Communication

A Comprehensive Study of Bright Fermi-GBM Short Gamma-ray Bursts: I. Multi-Pulse Lightcurves and Multi-Component Spectra

Department of Physics, Nanchang University, Nanchang 330031, China
*
Author to whom correspondence should be addressed.
Universe 2022, 8(3), 159; https://doi.org/10.3390/universe8030159
Submission received: 11 February 2022 / Revised: 28 February 2022 / Accepted: 1 March 2022 / Published: 2 March 2022
(This article belongs to the Special Issue Waiting for GODOT—Present and Future of Multi-Messenger Astronomy)

Abstract

:
Sorted by the photon fluences of short Gamma-ray Bursts (SGRBs) detected by the Fermi-Gamma Ray Burst Monitor (GBM), nine brightest bursts are selected to perform a comprehensive analysis. All GRB lightcurves are fitted well by 1 to 3 pulses that are modelled by fast-rising exponential decay profile (FRED), within which the resultant rising time is strongly positive-correlated with the full time width at half maxima (FWHM). A photon spectral model involving a cutoff power-law function and a standard blackbody function (CPL + BB) could reproduce the spectral energy distributions of these SGRBs well in the bursting phase. The CPL’s peak energy is found strongly positive-correlated with the BB’s temperature, which indicates they might be from the same physical origin. Possible physical origins are discussed to account for these correlations.

1. Introduction

Gamma-ray Bursts (GRBs) are the most energetic transient events in the universe, which is only after the bing bang. Short Gamma-ray Burst (SGRB) is an important astrophysical phenomena to shed light on the properties of the stellar physics, especially on the merger events of two compact objects in the gravitational-wave era, such as two neutron stars (NS-NS), which is firstly proved in SGRB 170817A [1]. During the short emission timescale of such event, i.e., less than two seconds in the prompt phase, SGRB typically consists of several pulses in its lightcurve (LC) and multiple spectral components in its spectral energy distribution (SED). The radiation process accounted for these properties during the prompt emission of SGRBs is still ambiguous, which however can revel some aspects of GRB, such as the central engine, the outflow composition and the structures of the relativistic jet [2,3,4,5,6]. For pulses of those LCs, it is found that the rise time width and the full time width are positively correlated with each other in most of the long GRBs (LGRBs) detected by the Burst and Transient Source Experiment (BATSE) on board Compton Gamma Ray Observatory (CGRO) [7,8,9]. However, such pulses in most BATSE SGRBs have not enough high count rates to be decomposed. For the SEDs represented by the nonthermal models in most SGRBs [10], two bright SGRBs (GRB 120323A and GRB 170206A) with the standard blackbody component detection both in their time-integrated and time-resolved spectra are reported in the literatrue [11,12], while the multiple blackbody component (mBB, a non-standard thermal component) is found in several redshift-measured SGRBs [13]. In order to discuss the possible physical origins in SGRBs, 9 fluence-selected brightest SGRBs amongst 522 Fermi-Gamma Burst Monitor (GBM) as of 2021 December are selected to perform the comprehensive analysis, in which both the LCs and SEDs are fitted. In Section 2, we describe the method. The results and possible correlaions are presented in Section 3. The discussion on these correlations is presented in Section 4. We present the summary and conclusion in Section 5.

2. Data Analysis

In this section, we present the sample selection and the general method for the lightcurve fitting and spectral energy distribution fitting, employing the Fermi/GBM observations.

2.1. Sample Selection

Fermi/GBM has two types of scintillation detectors, such as 12 Sodium Iodide (NaI) units named from ‘n0’ to ‘n9’, ‘na’ and ‘nb’, and 2 Bismuth Germanate (BGO) units named ‘b0’ and ‘b1’. NaIs cover the photon energy between about 8 keV and 1 MeV while BGOs between about 200 keV and 40 MeV. Among 522 SGRBs detected by the Fermi-GBM as of 2021 December, nine are selected with 50–300 keV energy fluence S 50 300 keV above 7 × 10 6 erg cm 2 and GBM T 90 less than 2 s. GBM T 90 is between GBM T 05 and T 95 , that are the times when 5% and 95% of the total GRB energy fluence is accumulated respectively. For each GRB, we selected four detectors in the following analysis, which are closest to the best-localizaion GRB position as shown in the Table 1. Their data can be downloaded from the public data site of Fermi/GBM https://heasarc.gsfc.nasa.gov/FTP/fermi/data/gbm/bursts/, accessed on 15 November 2021.

2.2. Method

2.2.1. Lightcurve Fitting

GBM Time-Tagged Event (TTE, 2 µs temporal resolution) data of three NaI detectors is employed, which were binned into 10 ms in our lightcurve fitting except for GRB 171108A, which takes 2 ms bins for its very short T 90 of 32 ms. The energy band is selected ranging from 50 keV to 300 keV. GRB lightcurves are usually irregular, but could be decomposed as several pulses, most of which are described as the fast-rising exponential-decay profile (FRED). FRED can be presented same as that in [14],
S ( t | A , T start , T rise , ξ ) = A e ξ t T start T rise + T rise t T start 2
where A is the amplitude, T start is start time of the pulse and T rise is the rise time interval before the peak, ξ is an asymmetry parameter to represent the skewness of the FRED pulse. The decay time interval can be calculated by T decay = 1 2 T rise ξ 1 [ ( 1 + 4 ξ ) 1 / 2 + 1 ] [15]. Therefore, we perform the fitting with several FRED pulses to nine GRBs in our sample, usually with 1, 2 or 3 FRED pulses which are named single-pulse SGRB, double-pulse SGRB and triple-pulse SGRB respectively. The maximum likelihood statistical method is employed in the LC fitting.

2.2.2. Spectral Energy Distribution Fitting

GBM TTE data of all detectors in Table 1 are used in our spectral analysis. Instrument response files are selected with r s p 2 files, we fit the background with an auto-selected orders polynomials using the Nelder-Mead method. Photons with energy ranging from 8 to 900 keV for NaIs are selected while from 200 keV to 40 MeV for BGOs.
We select 4 models to fit the gamma-ray spectra, e.g., the Band-function model (BAND), the cutoff power-law function model (CPL) and two blackbody function (BB)-included models, such as BAND + BB and CPL + BB. In order to distinguish from the single BAND model and the single CPL model above, we named the BAND component and the BB component in the BAND + BB model while the CPL component and BB component in CPL + BB model. BAND model is written as the so-called Band function [10], such as
N ( E ) BAND = N 0 , BAND ( E E piv ) α e [ E / E 0 ] , E ( α β ) E 0 ( ( α β ) E 0 E piv ) ( α β ) e ( β α ) ( E E piv ) β , E ( α β ) E 0
where α , β is the photon index before and after the typical energy of ( α β ) E 0 , and E 0 is the break energy in the F E ( = E N E ) spectrum, note that the peak energy in the E F E ( = E 2 N E ) spectrum E peak = ( 2 + α ) E 0 [15]. CPL could be regarded as the lower energy segment of the BAND model but with an exponential cutoff-power-law decay in the high-energy band, such as
N E ( CPL ) = N 0 , CPL ( E E piv ) Γ e E / E c ,
where Γ is the photon index and E c is the cutoff energy. E piv in both models is the pivot energy and fixed at 100 keV, which is most to adopt the observations. BB component is usually modified by the standard Planck spectrum, which is given by the photon flux,
N E ( BB ) = N 0 , BB E 2 e x p [ E / k T ] 1 ,
where k is the Boltzmann’s constant, and the joint parameter k T as a output parameter in common. The BB component is the additive spectral compoennt in our spectral analysis, such as BAND + BB and CPL + BB. In all spectral models, N 0 is the normalisation.
For each spectral fitting, a likelihood value L ( θ ) as the function of the free parameters θ is derived. The value of the Bayesian Information Criterion (BIC; [16]), defined as BIC = −2ln L ( θ ) + k ln n , are calculated, where k is the number of free parameters to be estimated and n is the number of observations (the sum of the selected GBM energy channels). In this work, the Multi-Mission Maximum Likelihood package (3ML; [17]) are employed to carry out all the spectral analysis and the parameter estimation, with the emcee sampling method.

3. Result

3.1. Multiple Pulses

Results of the lightcurve fitting are presented in Table 2. For the single-pulse GRBs, T rise is about 0.03 s and 0.05 s for GRB 171108A and GRB 120323A respectively, while about 0.27 s and 0.59 s for GRB 171126A and GRB 140209A respectively. For 4 GRBs with two FRED pulses (double-pulse SGRB), it is found that they have the similar pattern of the rising time, such as the second rising time T rise , 2 is about 1 to 3 times the first rising time T rise , 1 . For the only GRB with three FRED pulses (triple-pulse SGRB), GRB 170206A has the most energetic flux in the sample. Its first two rising times are compared, e.g., 0.16 s, 0.12 s respectively. Its last rising time is 0.54 s, which is longer than that in the former two pulses.
Figure 1 shows the observational lightcurves and the fitting curves of 9 GRBs in our sample. The red histograms represent lightcurves, and solid black lines are the best fittings by FRED profiles.
Table 2. Derived parameters of GRB FRED pulses.
GRBModels
Pulse 1 Pulse 2 Pulse 3
T start , 1
(s)
T rise , 1
(s)
FWHM 1
(s)
T start , 2
(s)
T rise , 2
(s)
FWHM 2
(s)
T start , 3
(s)
T rise , 3
(s)
FWHM 3
(s)
090227B 0.03 ± 0.03 0.04 ± 0.01 0.06 ± 0.02 0.02 ± 0.02 0.07 ± 0.04 0.05 ± 0.04 ---
120323A 0.03 ± 0.01 0.05 ± 0.01 0.13 ± 0.01 ------
140209A 1.03 ± 0.02 0.59 ± 0.03 0.44 ± 0.03 ------
150819B 0.05 ± 0.01 0.05 ± 0.01 0.04 ± 0.01 0.45 ± 0.01 0.14 ± 0.02 0.13 ± 0.02 ---
170206A 0.30 ± 0.01 0.16 ± 0.01 0.27 ± 0.03 0.57 ± 0.02 0.12 ± 0.02 0.24 ± 0.06 0.60 ± 0.03 0.54 ± 0.03 0.22 ± 0.02
171108A 0.04 ± 0.01 0.03 ± 0.01 0.02 ± 0.01 ------
171126A 0.11 ± 0.02 0.27 ± 0.03 0.48 ± 0.08 ------
180703B 0.19 ± 0.01 0.35 ± 0.01 0.24 ± 0.01 0.70 ± 0.01 0.51 ± 0.01 0.42 ± 0.01 ---
181222B 0.03 ± 0.01 0.09 ± 0.01 0.21 ± 0.01 0.03 ± 0.01 0.23 ± 0.01 0.11 ± 0.01 ---
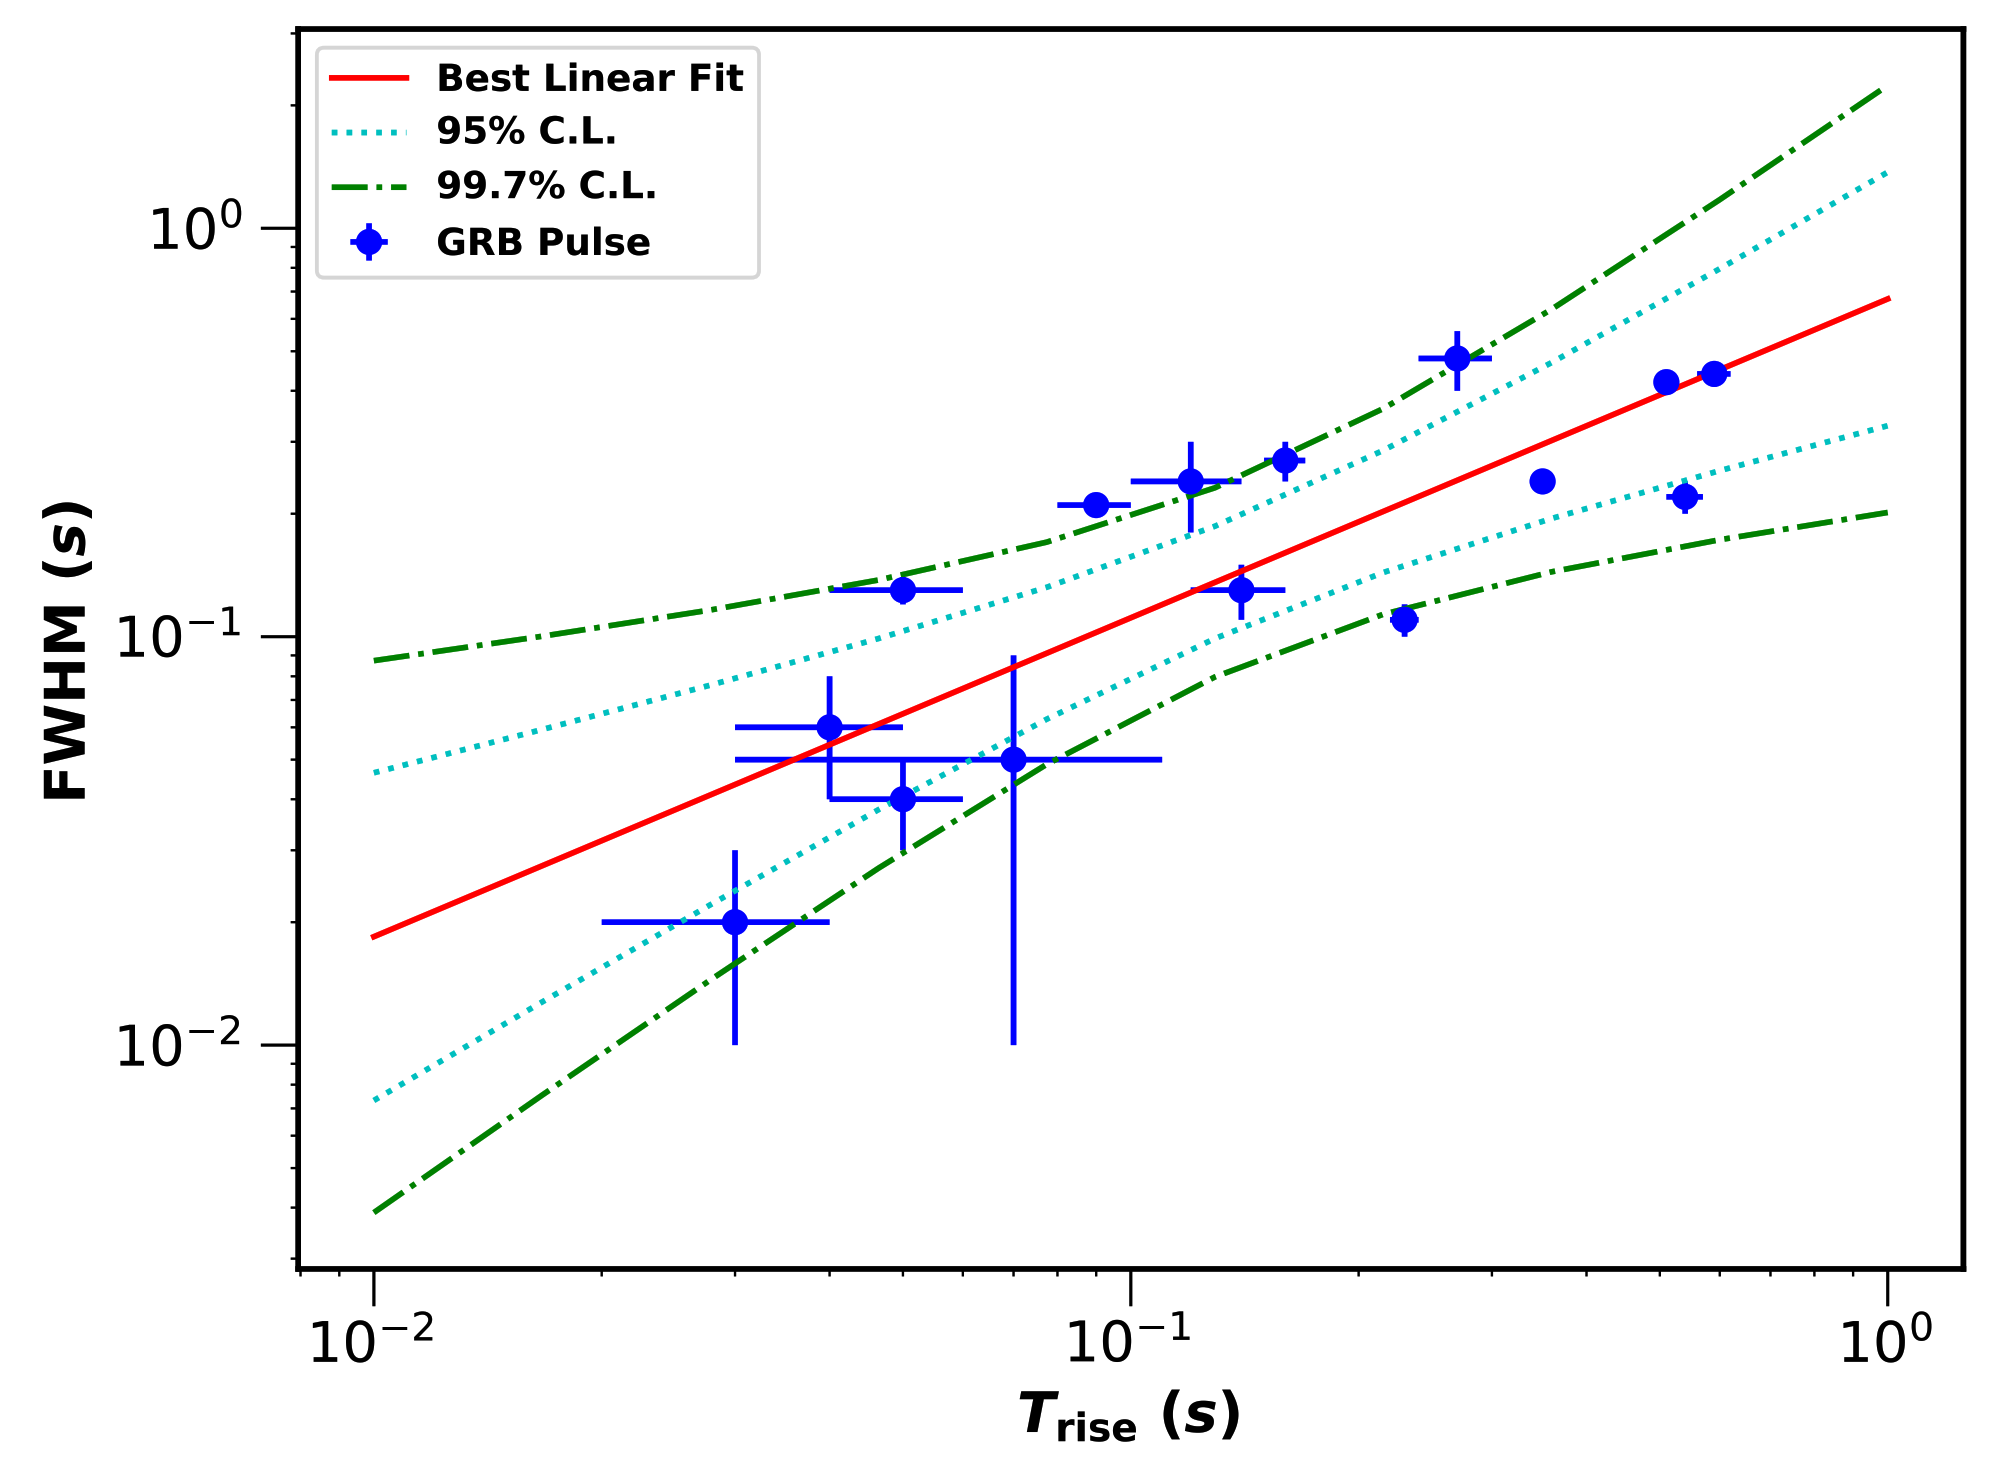
In order to analyze the relationship between the rising time ( T rise ) phase and the whole pulse time width, full time with in half maximum (FWHM) is measured, which is also presented in Table 2. Then we test the correlation between FWHM and T rise by the linear fitting in logarithmic space, such as
l o g ( FWHM ) = m + n l o g ( T rise )
where m and n are the free parameters. This fitting is performed by the basic linear regression analysis in the popular O r i g i n scientific package, which can give the coefficient of determination R 2 ( 0 < R 2 < 1 ). For the linear fit, two variables, such as FWHM and T rise in this section, are positively correlated if the Pearson-correlation coefficient R ( 1 < R < 1 ) is close to 1. For example, a strong correlation can be claimed when R > 0.8 while a moderate correlation can be claimed when 0.5 < R < 0.8 [18]. We also calculate the probability p of the null hypothesis, which can be described as the confidence level of 1 p for the correlation.
For the individual pulse in our sample, we found that T rise and FWHM are strongly correlated with each other, which is plotted in Figure 2, with R = 0.82, m = 0.17 ± 0.14 and n = 0.78 ± 0.15 . The best fit for the correlation is written as
l o g ( FWHM ) = ( 0.17 ± 0.14 ) + ( 0.78 ± 0.15 ) l o g ( T rise ) ,
p is about 1.9 × 10 4 , which also favors a strong positive correlation. This strong correlaiton implies those pulses are emitted within one impulsive explosion.

3.2. Multiple Spectral Components

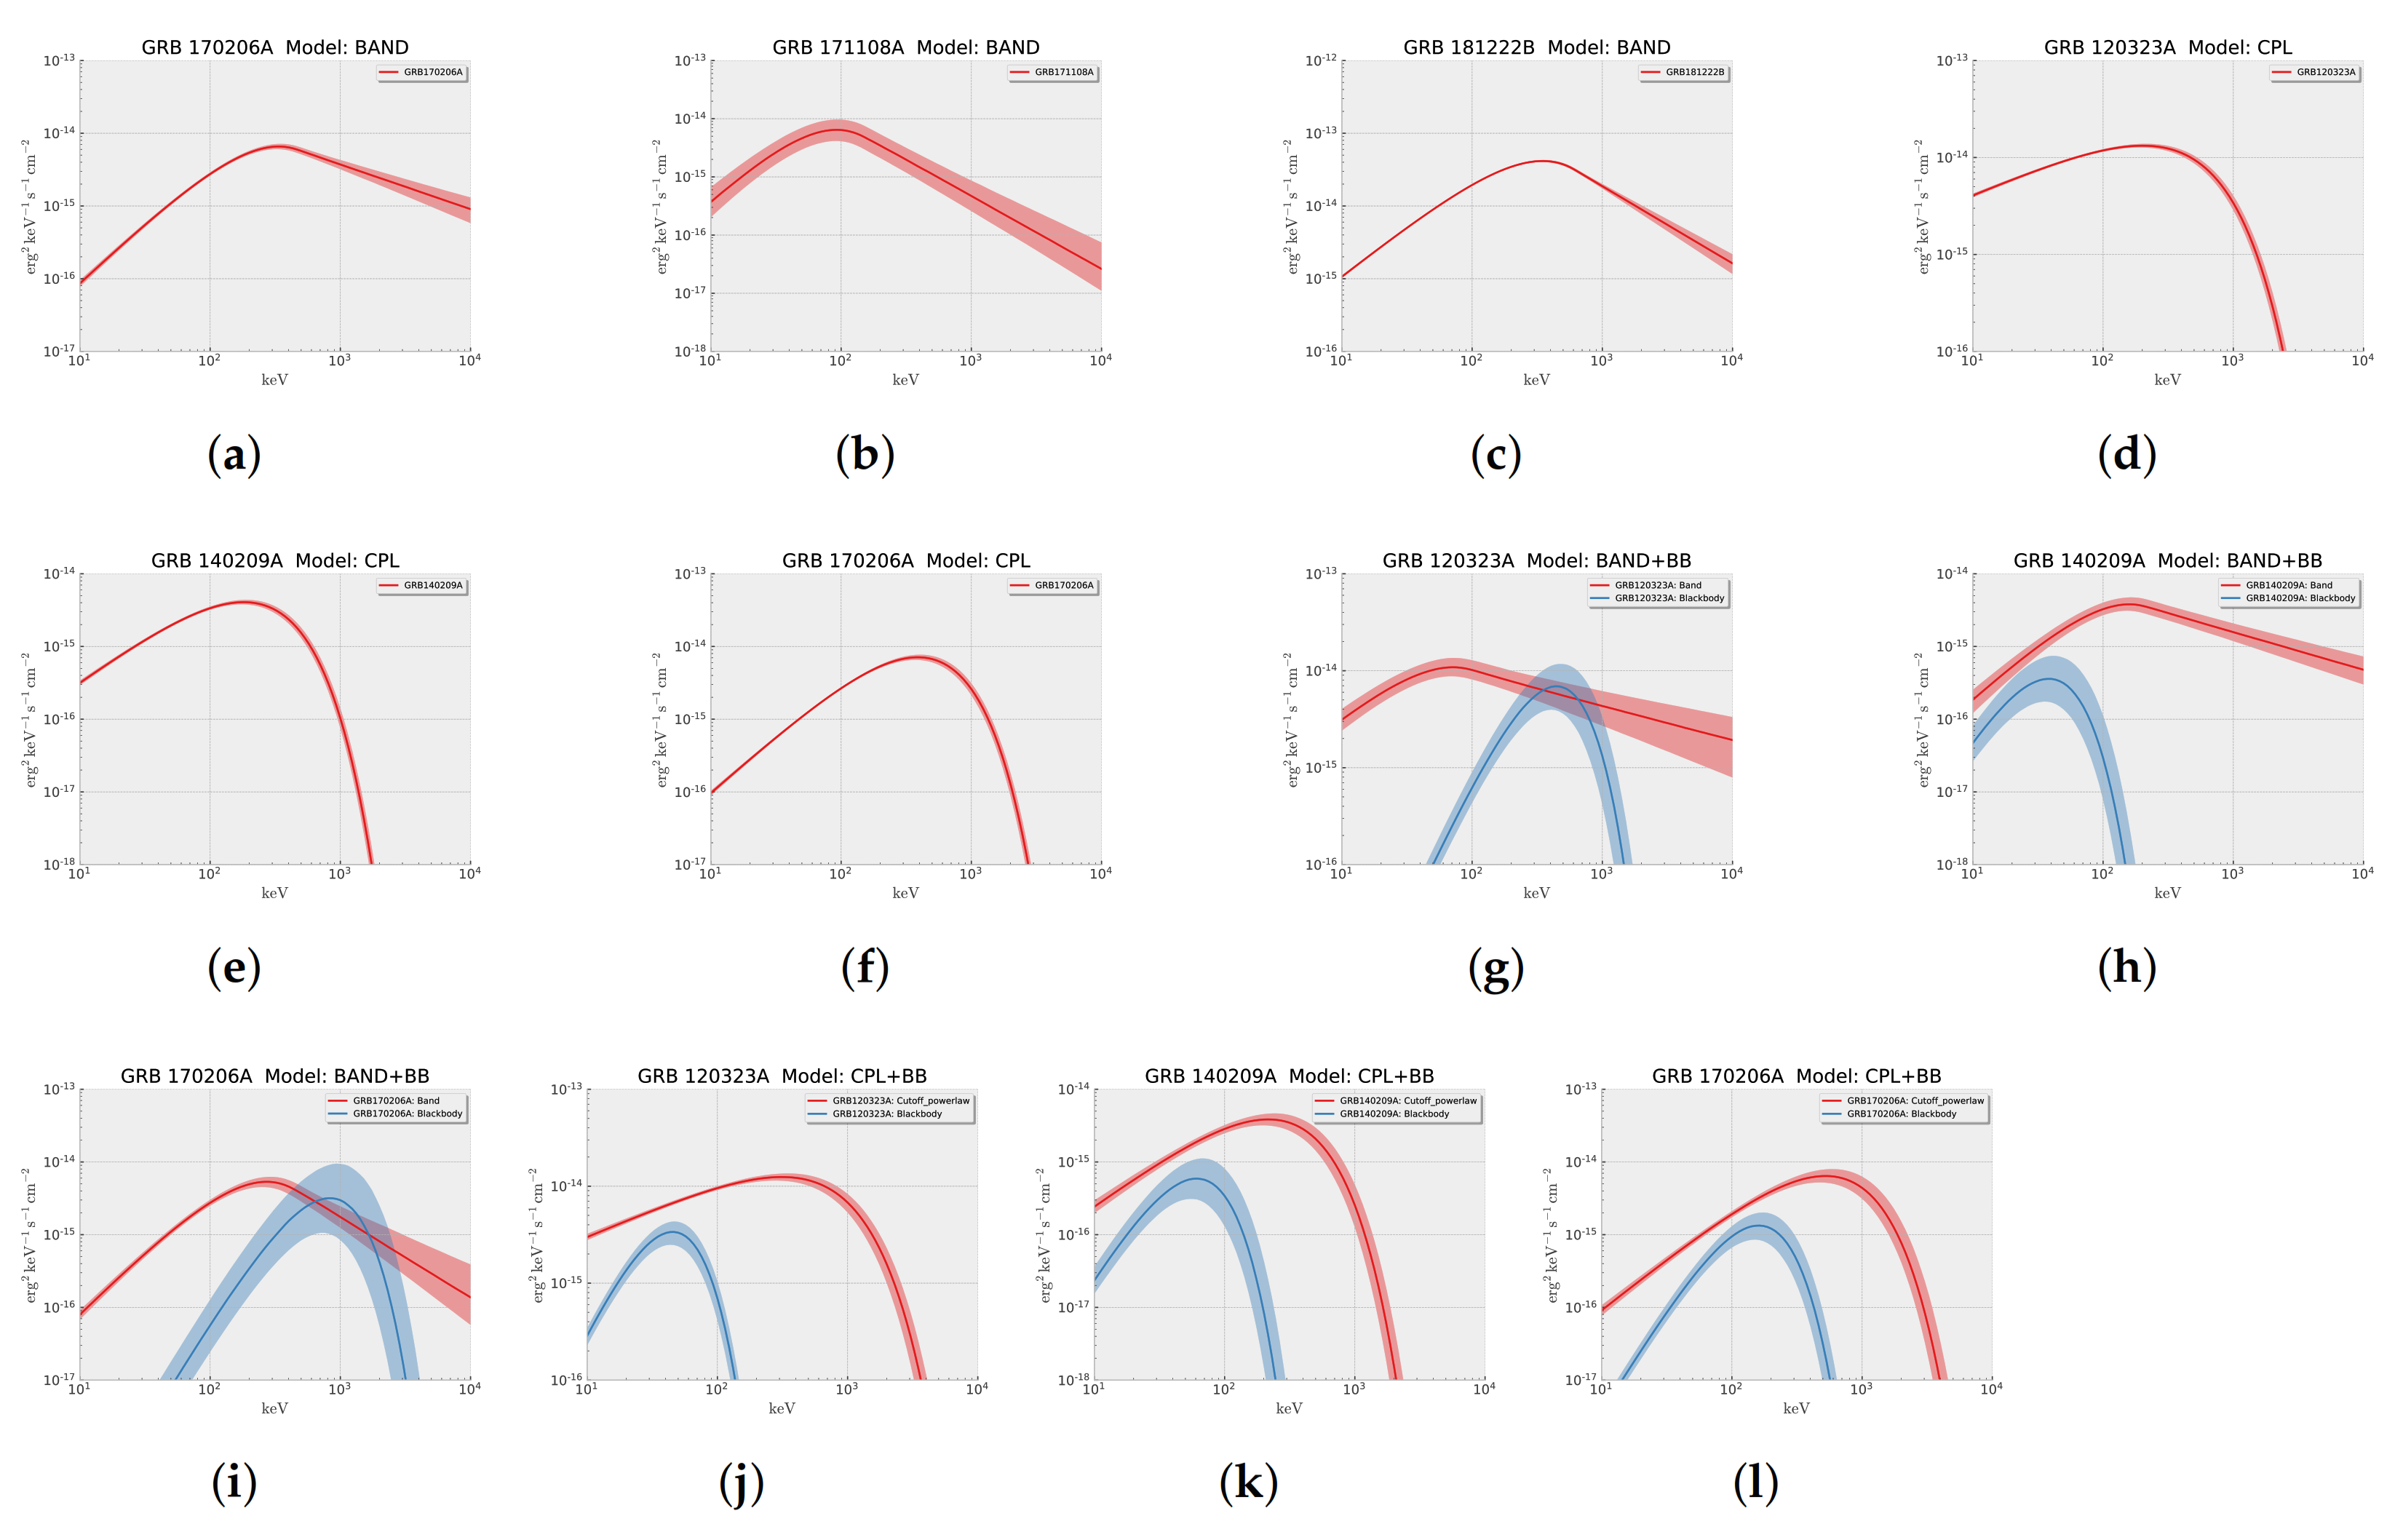
We obtained the resultant spectral parameters of each GRB as well as the BIC values, presented in Table 3. Firstly, BIC value of one model is enough smaller than that in other mdoels, i.e., Δ BIC > 6 , is selected as the best-fit model [19]. If two or more models have the Δ BIC < 6 with each other, then we named them the compareable models. Secondly, we will reject a model if the resultant parameters in a candidate model are unreasonable, such as k T is less than 8 keV, which is the minimum photon energy we selected. For each model, we plot three GRBs as the example in Figure 3.
  • For GRB 090227B, CPL, BAND + BB and CPL + BB models are the compared models.
  • For GRB 120323A, CPL + BB model is the best-fit model.
  • For GRB 140209A, BAND and BAND + BB models are the compared models.
  • For GRB 150819B, CPL and CPL + BB models are the compared models.
  • For GRB 170206A, CPL + BB model is the best-fit model.
  • For GRB 171108A, BAND, CPL and CPL + BB models are the compared models.
  • For GRB 171126A, BAND and CPL models are the compared models.
  • For GRB 180703B, BAND, CPL and CPL + BB models are the comared models.
  • For GRB 181222B, BAND model is the best model.
Amongst four candidate models, the CPL + BB model is best model in two GRBs, such as GRB 120323A and GRB 170206A, and is the compared models in GRBs 090227B, 150819B, 171108A, 180703B. For other 3 GRBs, although the CPL + BB model is not the best/compared model, the resultant k T is well constrained. In order to test the possible correlation between the multiple spectral components, we thus choose the spectral fittings that are modelled by CPL + BB model in the following analysis.
Table 3. Resultant parameters by the spectral fitting.
GRB Model BIC α / Γ E peak / E c
(keV)
β kT
(keV)
090227BBAND1692 0.12 ± 0.03 1000 ± 4 2.10 ± 0.05 -
CPL1517 0.46 ± 0.02 1400 ± 66 --
BAND + BB1522 0.42 ± 0.04 950 ± 58 2.20 ± 0.10 490 ± 29
CPL + BB1522 0.55 ± 0.06 1600 ± 180 - 270 ± 66
120323ABAND2151 0.84 ± 0.07 72 ± 5 2.10 ± 0.02 -
CPL2310 1.40 ± 0.02 350 ± 21 --
BAND + BB2158 0.81 ± 0.11 71 ± 7 2.10 ± 0.02 1 ± 1
CPL + BB2097 1.40 ± 0.03 530 ± 57 - 12 ± 1
140209ABAND3194 0.52 ± 0.05 150 ± 6 2.40 ± 0.08 -
CPL3248 0.69 ± 0.03 140 ± 6 --
BAND + BB3191 0.33 ± 0.15 160 ± 11 2.50 ± 0.09 10 ± 1
CPL + BB3220 0.70 ± 0.07 170 ± 18 - 16 ± 2
150819BBAND2670 1.10 ± 0.03 540 ± 38 3.30 ± 0.21 -
CPL2663 1.10 ± 0.03 600 ± 55 --
BAND + BB2672 1.00 ± 0.12 510 ± 66 3.20 ± 0.24 8 ± 2
CPL + BB2665 1.10 ± 0.11 570 ± 96 - 6 ± 6
170206ABAND3056 0.30 ± 0.04 340 ± 14 2.6 ± 0.13 -
CPL3054 0.40 ± 0.03 240 ± 11 --
BAND + BB3062 0.54 ± 0.14 430 ± 85 3.00 ± 0.39 38 ± 9
CPL + BB3048 0.57 ± 0.06 370 ± 44 - 41 ± 4
171108ABAND6 0.15 ± 0.20 92 ± 6 3.30 ± 0.21 -
CPL2 0.03 ± 0.19 51 ± 7 --
BAND + BB12 0.49 ± 0.61 100 ± 23 3.30 ± 0.26 10 ± 10
CPL + BB7 0.32 ± 0.44 45 ± 10 - 8 ± 5
171126ABAND2988 0.38 ± 0.08 88 ± 4 3.00 ± 0.23 -
CPL2989 0.49 ± 0.07 62 ± 5 --
BAND + BB2999 0.37 ± 0.12 90 ± 5 3.10 ± 0.23 1 ± 1
CPL + BB2995 0.49 ± 0.11 65 ± 9 - 8 ± 6
180703BBAND3482 0.65 ± 0.04 140 ± 5 3.10 ± 0.22 -
CPL3481 0.70 ± 0.03 110 ± 4 --
BAND + BB3487 0.63 ± 0.06 140 ± 10 3.10 ± 0.28 8 ± 7
CPL + BB3483 0.67 ± 0.06 120 ± 8 - 12 ± 2
181222BBAND2677 0.58 ± 0.01 350 ± 6 3.10 ± 0.11 -
CPL2719 0.61 ± 0.01 270 ± 6 --
BAND + BB2687 0.58 ± 0.02 350 ± 7 3.10 ± 0.10 1 ± 1
CPL + BB2721 0.66 ± 0.04 290 ± 20 - 40 ± 16
Figure 3. Examples for the SED fitting by four models. (a) + (b) + (c): BAND; (d) + (e) + (f): CPL; (g) + (h) + (i): BAND + BB; (j) + (k) + (l): CPL + BB.
Universe 08 00159 g003
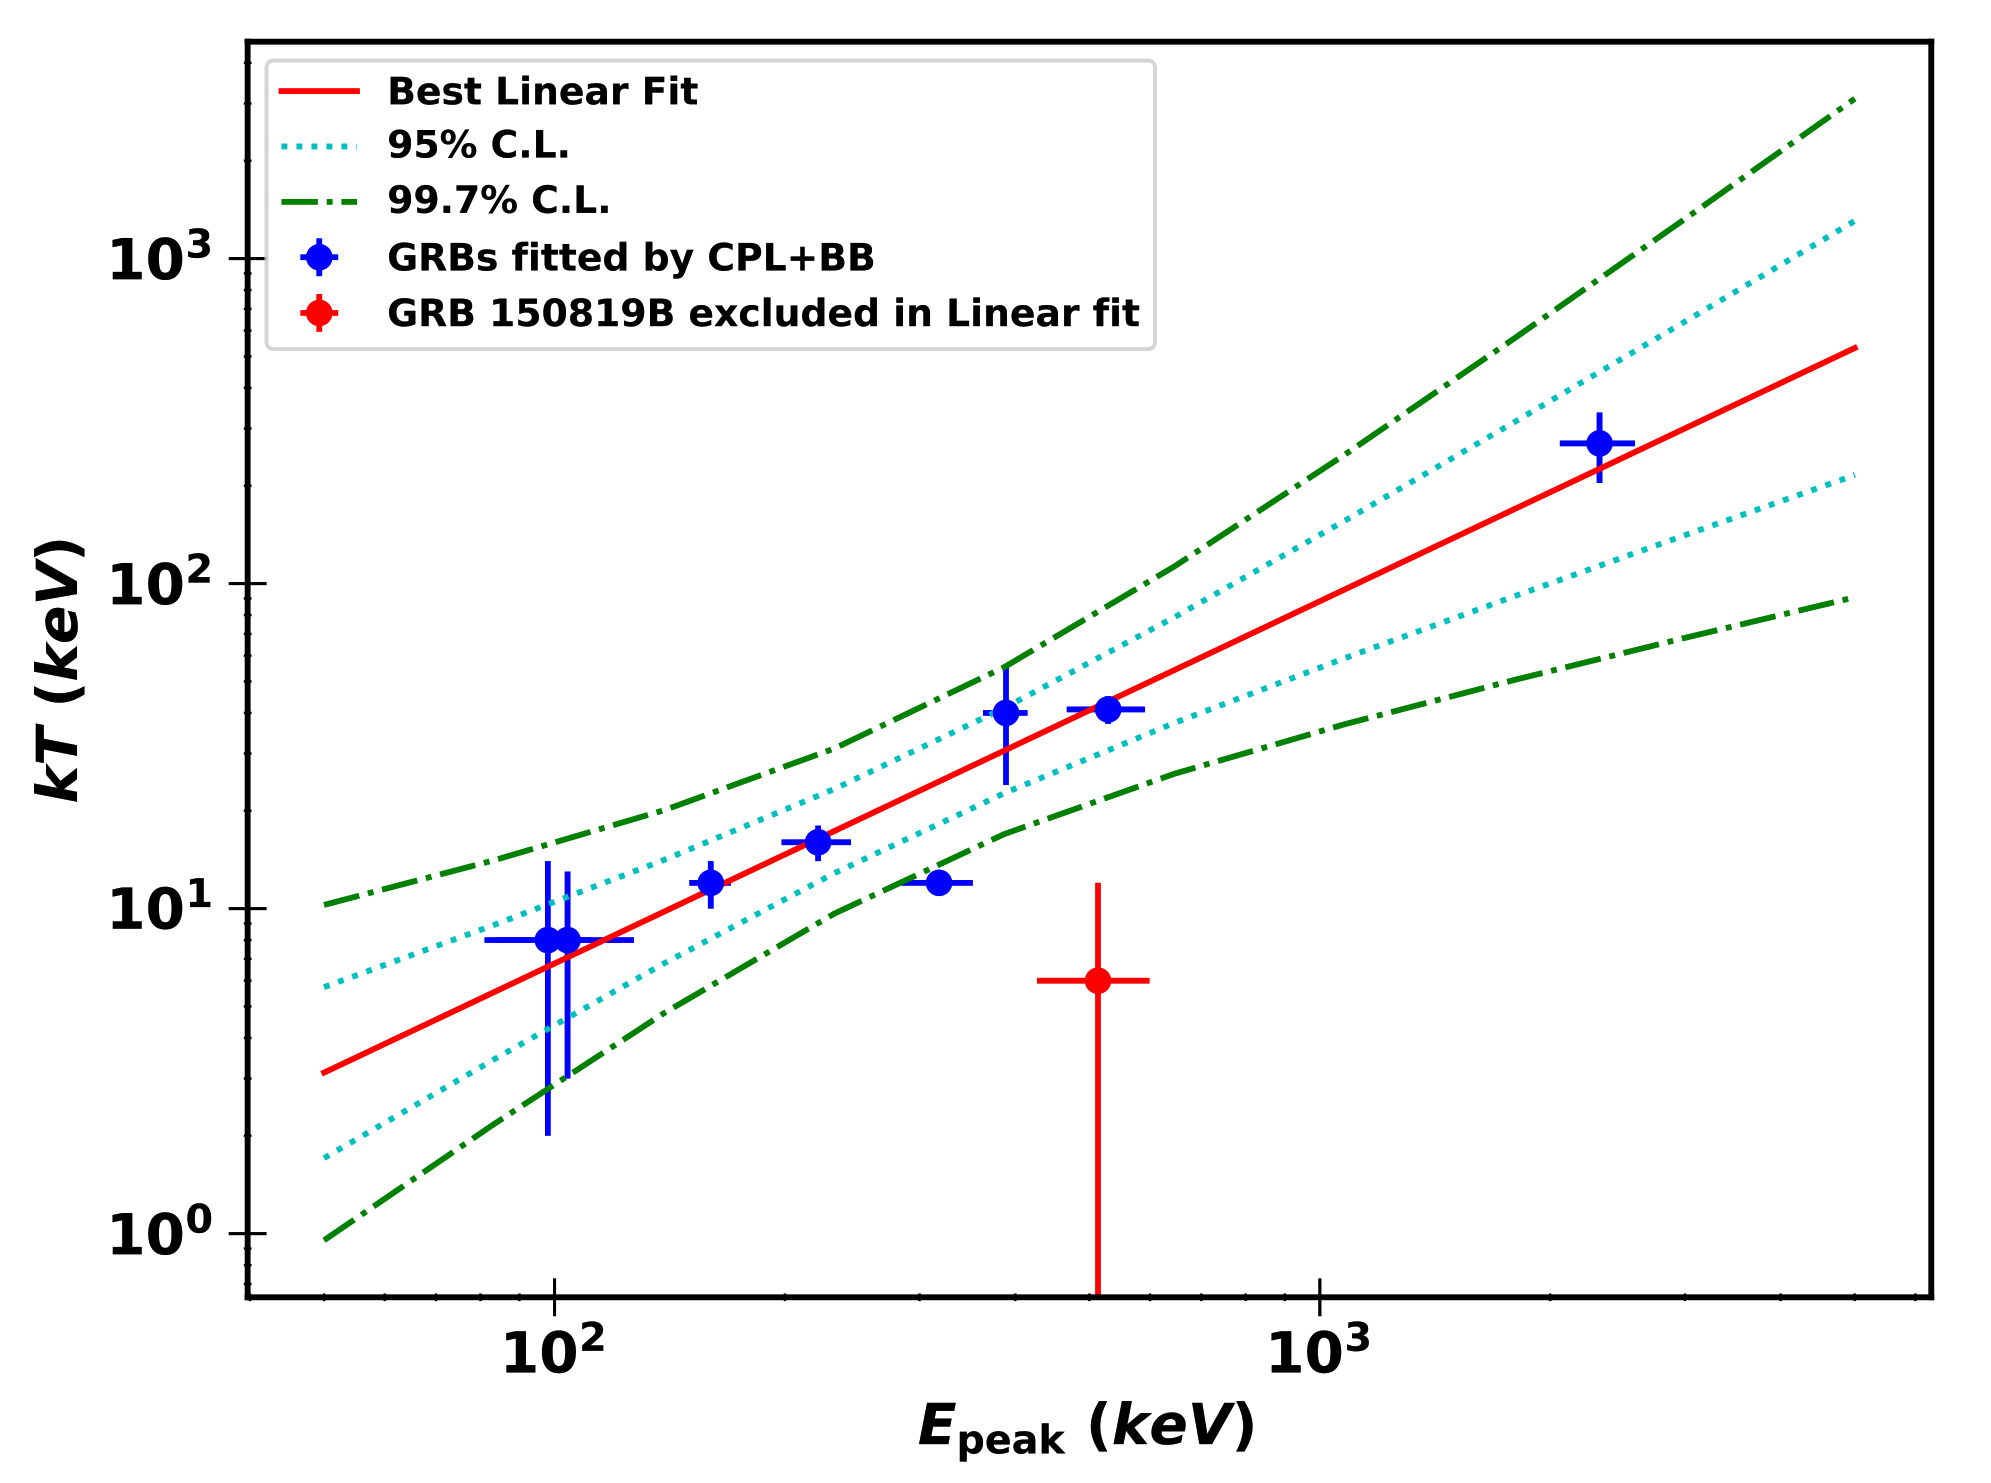
In order to compare the multiple spectral components, we select the CPL + BB model to test the correlation between the peak energy E peak = ( 2 + Γ ) E c in the CPL component and the temperature k T in the BB component using the linear fit in logarithmic space same as above. Excluding GRB 150819B, whose median value of k T = 6 keV is less than 8 keV, we found that E peak is strongly correlated with k T with R = 0.97, m = 1.40 ± 0.31 and n = 1.11 ± 0.12 . The best fit for the correlation is written as
l o g ( E peak ) = ( 1.40 ± 0.31 ) + ( 1.11 ± 0.12 ) l o g ( k T ) ,
p is about 1.0 × 10 4 , which favors a strong correlation, as seen in Figure 4. This strong correlation implies those two spectral components might share the same origins.

4. Discussion

4.1. Bias on the Transition Process of SGRBs

As seen in previous sections, there are three types of SGRBs, such as with single-pulse SGRB, double-pulse SGRB and triple-pulse SGRB, which might be connected with different types of energy dissipation. Transition process within one impulsive explosion, that is from a fireball to a Poynting-flux-dominated outflow, has been found in several LGRBs, e.g., GRB 160625B and GRB 160626B [20,21,22]. When the multiple-pulse SGRBs can be clearly separated, it could be the apparent evidence to constrain the transition times, such as the GRB 150819B and GRB 180703B in this work. Although such bias exists in individual SGRBs, the positive correlation between the FWHM and the rising time still hold in our sample, which might due to the very short T 90 duration and a small SGRB sample. This dispersion might be resolved when with more and more SGRBs detected in distinct types of pulses, which could divide this correlation into two or more subclass.

4.2. Implications for the Simultaneous Thermal and Non-Thermal Spectral Components

More and more GRB spectra were discovered deviating from the typical BAND model, while the model comprising a PL/CPL (nonthermal) and an additional BB (thermal) is found being fitted well in several GRBs [23,24,25,26,27,28]. The nonthermal component was well described within the context of synchrotron radiation from particles in the jet, while the thermal component was interpreted by the emission from the jet photosphere, see [27] and references therein. The PL component was claimed to originate most likely from the inverse-Compton process as well as the CPL component, whose seed photons are usually the synchrotron-induced photons. The high-energy exponential cutoff in the latter component (CPL) is naturally interpreted as annihilation between the high-energy photons and the low-energy photons [29,30]. The correlation found in this work, such as CPL’s peak energy E p e a k is in proportion to BB’s temperature k T ( E p e a k k T 1.1 ), would imply that despite the different pulse-type SGRBs in our sample, the prompt broadband gamma-ray radiation could originate from the similar structures of the region, such as the same jet structures and outflow compositions in the different types of SGRBs. As seen in [28], both the leptonic model and hadronic model could produce the simultaneous thermal and non-thermal spectral components, more extensive physical explanations are required in future.

5. Summary and Conclusions

In this work, nine most bright SGRBs have been analyzed both in the LCs and SEDs. Of these bursts, the pulses in the LCs are all best-fitted by the FRED profiles. The resultant rising time width ( T rise ) is found to be strongly positive-correlated with the full time width at half maxima (FWHM), which implies those pulses are emitted within one impulsive explosion. This correlation might be divided into two or more subclass if more and more SGRBs in different pulse types are detected in future. The correlation of spectral parameter found in this work, such as CPL’s peak energy E p e a k is in proportion to BB’s temperature k T ( E p e a k k T 1.1 ), would imply that despite the different pulse-type SGRBs in our sample, the prompt broadband gamma-ray radiation could originate from the similar structures of the region.

Author Contributions

Writing—review and editing, P.-W.Z. and Q.-W.T. All authors have read and agreed to the published version of the manuscript.

Funding

Q.-W.T. was funded by National Nature Science Foundation of China grant numbers 11903017 and 12065017.

Institutional Review Board Statement

Not applicable.

Informed Consent Statement

Not applicable.

Data Availability Statement

Data available on reasonable request to the authors.

Conflicts of Interest

The authors declare no conflict of interest.

References

  1. Abbott, B.P.; Abbott, R.; Abbott, T.D.; Acernese, F.; Ackley, K.; Adams, C.; Adams, T.; Addesso, P.; Adhikari, R.X.; Adya, V.B.; et al. Gravitational Waves and Gamma-Rays from a Binary Neutron Star Merger: GW170817 and GRB 170817A. ApJL 2017, 848, L13. [Google Scholar] [CrossRef]
  2. Duffell, P.C.; Quataert, E.; Kasen, D.; Klion, H. Jet Dynamics in Compact Object Mergers: GW170817 Likely Had a Successful Jet. ApJ 2018, 866, 3. [Google Scholar] [CrossRef] [Green Version]
  3. Mooley, K.P.; Deller, A.T.; Gottlieb, O.; Nakar, E.; Hallinan, G.; Bourke, S.; Frail, D.A.; Horesh, A.; Corsi, A.; Hotokezaka, K. Superluminal motion of a relativistic jet in the neutron-star merger GW170817. Nature 2018, 561, 355. [Google Scholar] [CrossRef] [PubMed]
  4. Mooley, K.P.; Frail, D.A.; Dobie, D.; Lenc, E.; Corsi, A.; De, K.; Nayana, A.J.; Makhathini, S.; Heywood, I.; Murphy, T.; et al. A Strong Jet Signature in the Late-time Light Curve of GW170817. ApJL 2018, 868, L11. [Google Scholar] [CrossRef] [Green Version]
  5. Alexander, K.D.; Margutti, R.; Blanchard, P.K.; Fong, W.; Berger, E.; Hajela, A.; Eftekhari, T.; Chornock, R.; Cowperthwaite, P.S.; Giannios, D.; et al. A Decline in the X-ray through Radio Emission from GW170817 Continues to Support an Off-axis Structured Jet. ApJL 2018, 863, L18. [Google Scholar] [CrossRef] [Green Version]
  6. Granot, J.; Gill, R.; Guetta, D.; De Colle, F. Off-axis emission of short GRB jets from double neutron star mergers and GRB 170817A. MNRAS 2018, 481, 1597. [Google Scholar] [CrossRef] [Green Version]
  7. Kocevski, D.; Ryde, F.; Liang, E. Search for Relativistic Curvature Effects in Gamma-Ray Burst Pulses. ApJ 2003, 596, 389. [Google Scholar] [CrossRef]
  8. Lu, R.-J.; Qin, Y.-P.; Yi, T.-F. The Relationship between the Rise Width and the Full Width of γ-ray Burst Pulses and Its Implications. CHJAA 2006, 6, 52. [Google Scholar] [CrossRef]
  9. Peng, Z.Y.; Zhao, X.H.; Yin, Y.; Bao, Y.Y.; Ma, L. Energy-dependent Gamma-Ray Burst Pulse Width Due to the Curvature Effect and Intrinsic Band Spectrum. ApJ 2012, 752, 132. [Google Scholar] [CrossRef] [Green Version]
  10. Band, D.; Matteson, J.; Ford, L.; Schaefer, B.; Palmer, D.; Teegarden, B.; Cline, T.; Briggs, M.; Paciesas, W.; Pendleton, G.; et al. BATSE Observations of Gamma-ray Burst Spectra. I. Spectral Diversity. ApJ 1993, 413, 281. [Google Scholar] [CrossRef]
  11. Guiriec, S.; Daigne, F.; Hascoët, R.; Vianello, G.; Ryde, F.; Mochkovitch, R.; Kouveliotou, C.; Xiong, S.; Bhat, P.N.; Foley, S.; et al. Evidence for a Photospheric Component in the Prompt Emission of the Short GRB 120323A and Its Effects on the GRB Hardness-Luminosity Relation. ApJ 2013, 770, 32. [Google Scholar] [CrossRef]
  12. Zhao, P.-W.; Tang, Q.-W.; Zou, Y.-C.; Wang, K. Detection of Prompt Fast-Variable Thermal Spectral Component in Multi-Pulse Short Gamma-ray Burst 170206A. arXiv 2021, arXiv:2201.00642. [Google Scholar]
  13. Iyyani, S.; Sharma, V. Study of the Prompt Emission of Short Gamma-Ray Bursts Using a Multicolor Blackbody: A Clue to the Viewing Angle. ApJS 2021, 255, 25. [Google Scholar] [CrossRef]
  14. Paynter, J.; Webster, R.; Thrane, E. Evidence for an intermediate-mass black hole from a gravitationally lensed Gamma-ray Burst. Nat. Astron. 2021, 5, 560. [Google Scholar] [CrossRef]
  15. Norris, J.P.; Bonnell, J.T.; Kazanas, D.; Scargle, J.D.; Hakkila, J.; Giblin, T.W. Long-Lag, Wide-Pulse Gamma-Ray Bursts. ApJ 2005, 627, 324. [Google Scholar] [CrossRef] [Green Version]
  16. Schwarz, G. Estimating the Dimension of a Model. Ann. Stat. 1978, 6, 461. [Google Scholar] [CrossRef]
  17. Vianello, G.; Lauer, R.J.; Younk, P.; Tibaldo, L.; Burgess, J.M.; Ayala, H.; Harding, P.; Hui, M.; Omodei, N.; Zhou, H. The Multi-Mission Maximum Likelihood framework (3ML). arXiv 2015, arXiv:1507.08343. [Google Scholar]
  18. Newton, R.R.; Rudestam, K.E. Your Statistical Consultant: Answers to Your Data Analysis Questions; Sage Publications: Thousand Oaks, CA, USA, 1999. [Google Scholar]
  19. Kass, R.; Raftery, A. Bayes Factors. J. Am. Stat. Assoc. 1995, 90, 773. [Google Scholar] [CrossRef]
  20. Zhang, B.-B.; Zhang, B.; Castro-Tirado, A.J.; Dai, Z.G.; Tam, P.-H.T.; Wang, X.-Y.; Hu, Y.-D.; Karpov, S.; Pozanenko, A.; Zhang, F.-W.; et al. Transition from fireball to Poynting-flux-dominated outflow in the three-episode GRB 160625B. Nat. Astron. 2018, 2, 69. [Google Scholar] [CrossRef] [Green Version]
  21. Li, L. Multipulse Fermi Gamma-Ray Bursts. I. Evidence of the Transition from Fireball to Poynting-flux-dominated Outflow. ApJS 2019, 242, 16. [Google Scholar] [CrossRef] [Green Version]
  22. Li, X.-J.; Zhang, Z.-B.; Zhang, C.-T.; Zhang, K.; Zhang, Y.; Dong, X.-F. Properties of Short GRB Pulses in the Fourth BATSE Catalog: Implications for the Structure and Evolution of the Jetted Outflows. ApJ 2020, 892, 113. [Google Scholar] [CrossRef] [Green Version]
  23. Abdo, A.A.; Ackermann, M.; Ajello, M.; Asano, K.; Atwood, W.B.; Axelsson, M.; Baldini, L.; Ballet, J.; Barbiellini, G.; Baring, M.G.; et al. Fermi Observations of GRB 090902B: A Distinct Spectral Component in the Prompt and Delayed Emission. ApJL 2009, 706, L138. [Google Scholar] [CrossRef] [Green Version]
  24. Ackermann, M.; Asano, K.; Atwood, W.B.; Axelsson, M.; Baldini, L.; Ballet, J.; Barbiellini, G.; Baring, M.G.; Bastieri, D.; Bechtol, K.; et al. Fermi Observations of GRB 090510: A Short-Hard Gamma-ray Burst with an Additional, Hard Power-law Component from 10 keV TO GeV Energies. ApJ 2010, 716, 1178. [Google Scholar] [CrossRef] [Green Version]
  25. Guiriec, S.; Briggs, M.S.; Connaugthon, V.; Kara, E.; Daigne, F.; Kouveliotou, C.; van der Horst, A.J.; Paciesas, W.M.; Charles, A.; Bhat, P.N.; et al. Time-resolved Spectroscopy of the Three Brightest and Hardest Short Gamma-ray Bursts Observed with the Fermi Gamma-ray Burst Monitor. ApJ 2010, 725, 225. [Google Scholar] [CrossRef] [Green Version]
  26. Ackermann, M.; Ajello, M.; Asano, K.; Axelsson, M.; Baldini, L.; Ballet, J.; Barbiellini, G.; Baring, M.G.; Bastieri, D.; Bechtol, K.; et al. Detection of a Spectral Break in the Extra Hard Component of GRB 090926A. ApJ 2011, 729, 114. [Google Scholar] [CrossRef]
  27. Dainotti, M.G.; Del Vecchio, R.; Tarnopolski, M. Gamma-ray Burst Prompt Correlations. Adv. Astron. 2018, 2018, 4969503. [Google Scholar] [CrossRef]
  28. Tang, Q.-W.; Wang, K.; Li, L.; Liu, R.-Y. Prevalence of Extra Power-Law Spectral Components in Short Gamma-ray Bursts. ApJ 2021, 922, 255. [Google Scholar] [CrossRef]
  29. Tang, Q.-W.; Peng, F.-K.; Wang, X.-Y.; Tam, P.H.T. Measuring the Bulk Lorentz Factors of Gamma-ray Bursts with Fermi. ApJ 2015, 806, 194. [Google Scholar] [CrossRef]
  30. Chand, V.; Pal, P.S.; Banerjee, A.; Sharma, V.; Tam, P.H.T.; He, X.B. MAGICal GRB 190114C: Implications of Cutoff in the Spectrum at sub-GeV Energies. ApJ 2020, 903, 9. [Google Scholar] [CrossRef]
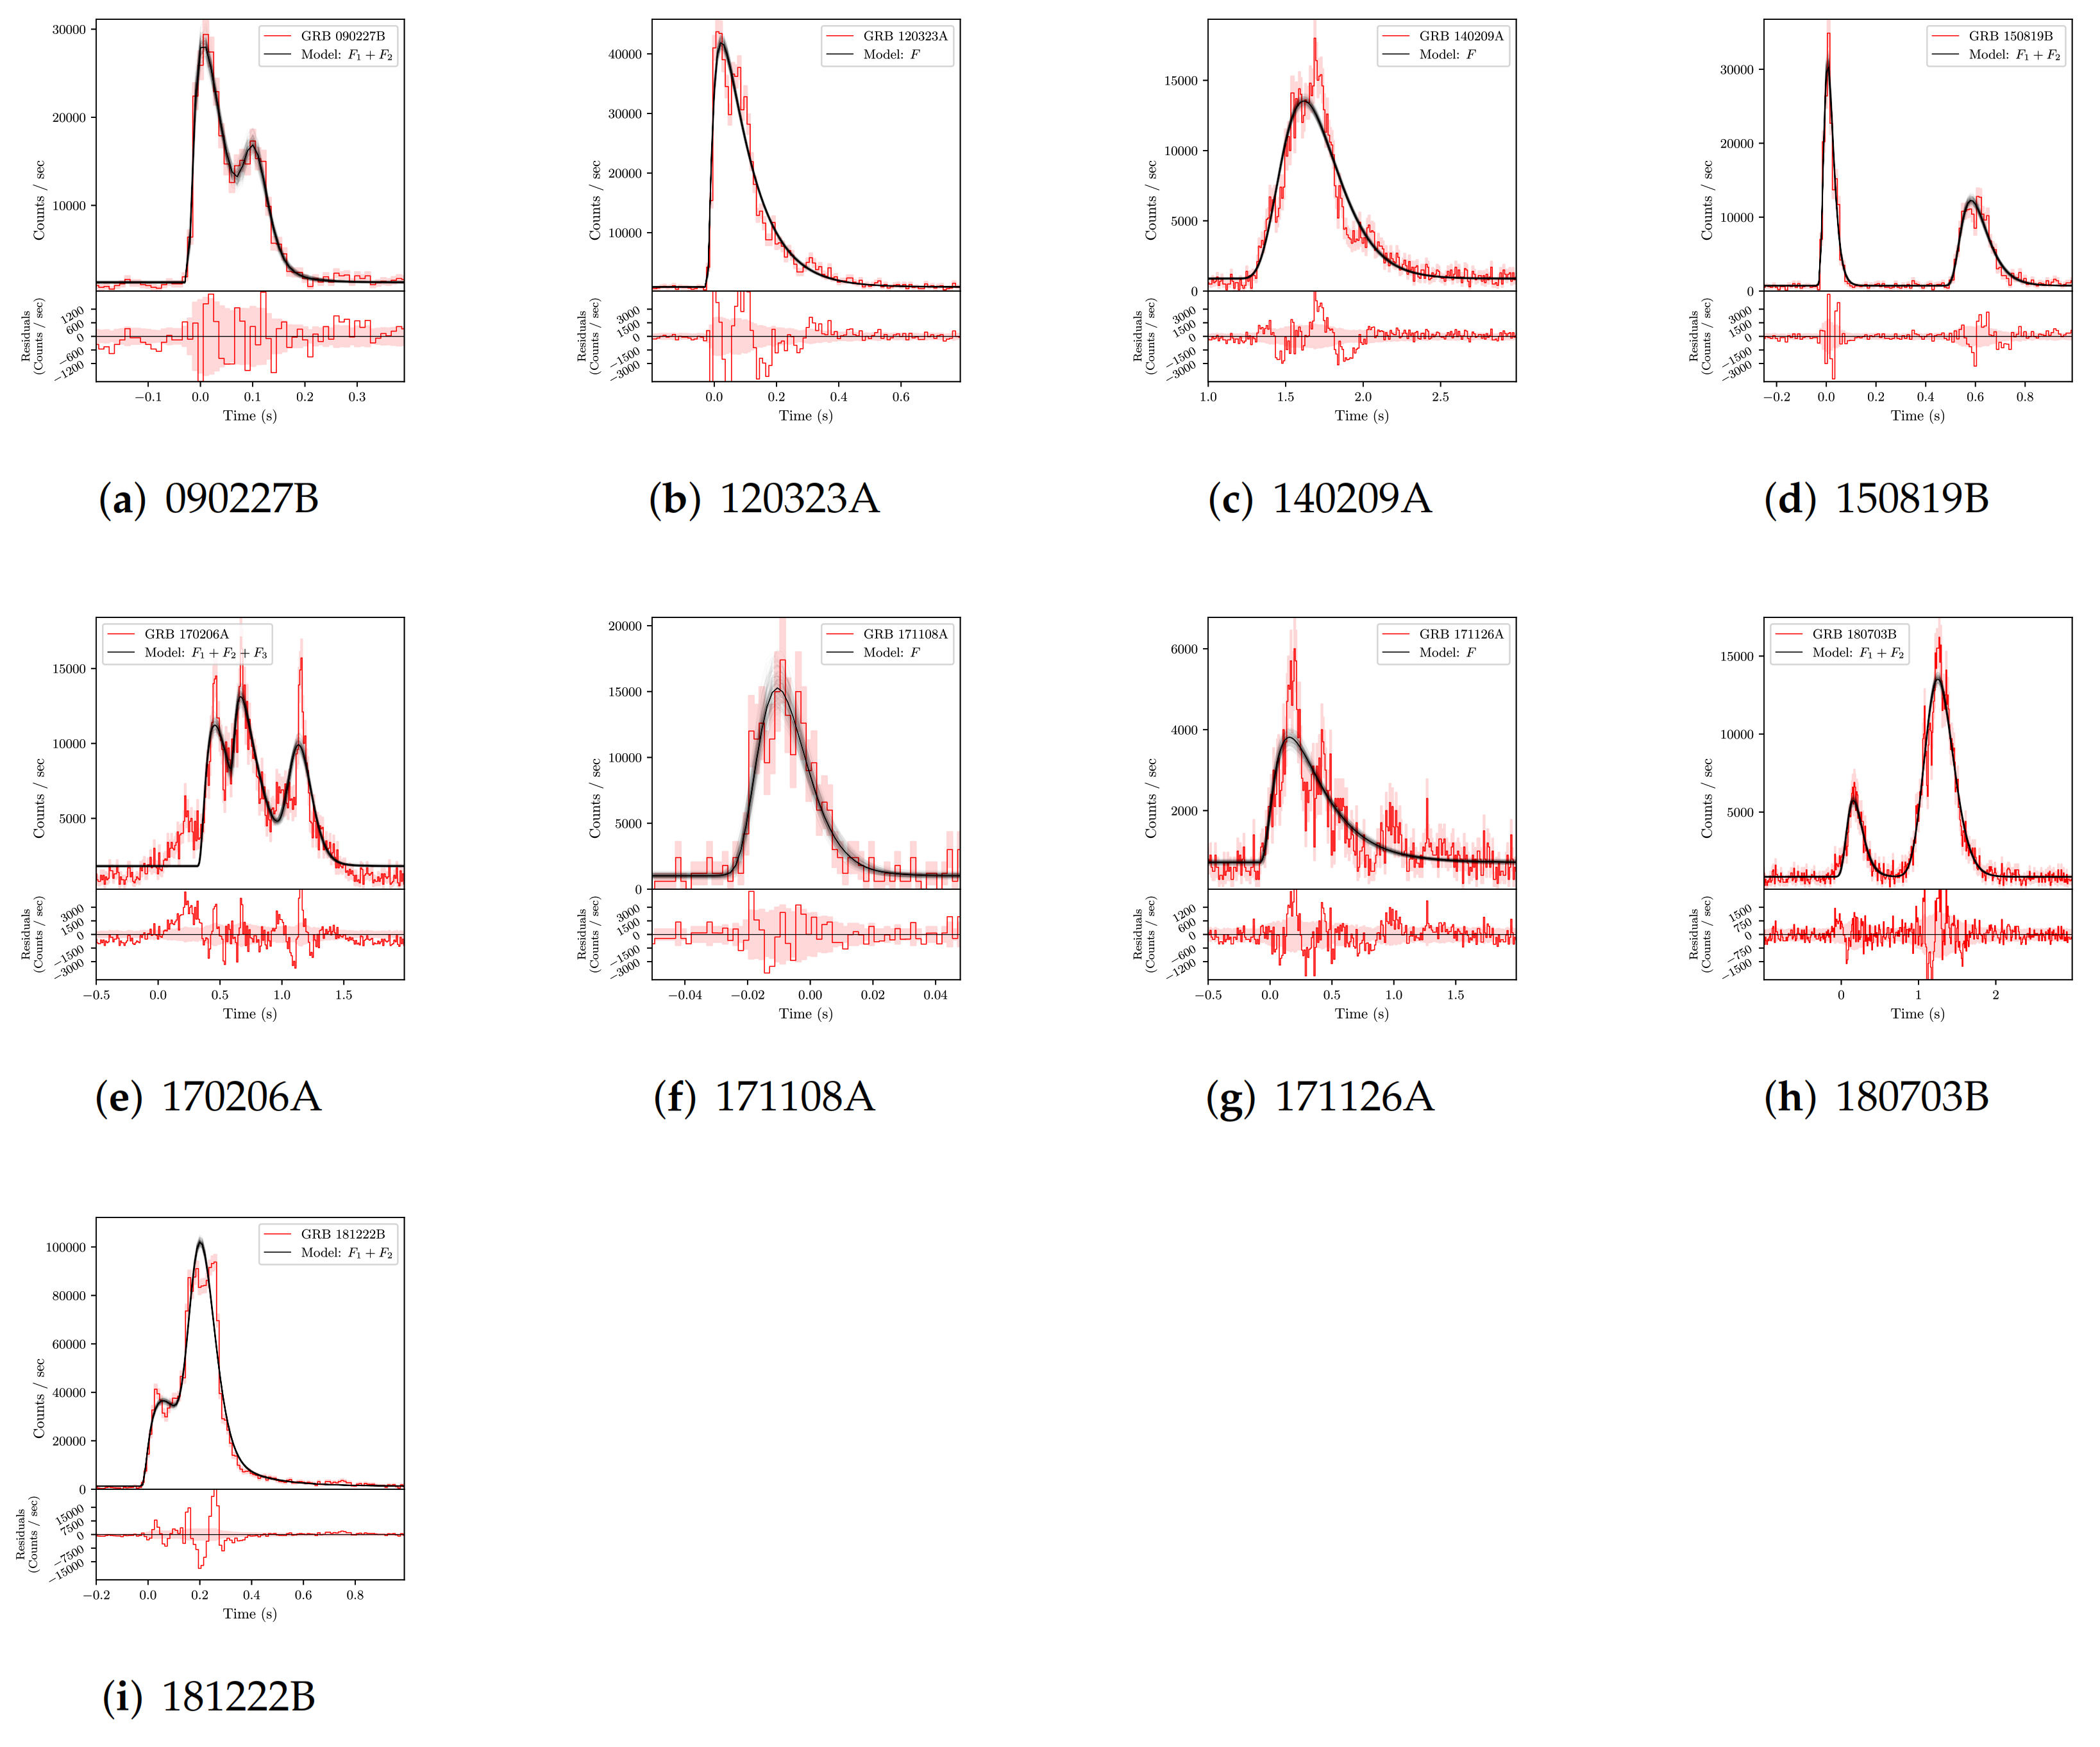
Figure 1. Observaional lightcurves in the energy band from 50 keV to 300 keV and the best-fit lines modelled by the FRED functions. For top pannel of each GRB, the red histogram represents 50–300 keV observational lightcurve, and solid black line is the best fit with the empirical function (FRED). The bottom pannel in ecah GRB is the residual between the observation and the fitting model.
Universe 08 00159 g001
Figure 2. Correlation of the rising time ( T rise ) and the full width at half maxima (FWHM) of individual pulses in all selected short GRBs. 95% and 99.7% confidence leverls are plotted by light blue dotted line and green dashed line respectively.
Universe 08 00159 g002
Figure 4. Correlation of peak energy E p e a k in CPL function and temperature k T in the standard BB function when GRB spectrum is fitted by CPL + BB model.
Universe 08 00159 g004
Table 1. GRB sample.
GRB T 90
(s)
T 05
(s)
T 95
(s)
Detetor S 50 300 keV
( 10 6   erg cm 2 )
090227B0.304−0.0160.288‘n0’,’n1’,’n2’,’b0’11.1 ± 0.1
120323A0.38400.384‘n0’,‘n3’,‘n4’,‘b0’10.4 ± 0.1
140209A1.4081.3442.752‘n9’,‘na’,‘nb’,‘b1’9.0 ± 0.1
150819B0.96−0.0640.896‘n2’,‘n9’,‘na’,‘b1’8.1 ± 0.1
170206A1.1680.2081.376‘n9’,‘na’,‘nb’,‘b1’10.2 ± 0.2
171108A0.032−0.0160.016‘n9’,‘na’,‘nb’,‘b1’10.4 ± 0.6
171126A1.47201.472‘n0’, ‘n1’,‘n2’,‘n3’7.2 ± 0.1
180703B1.5360.1281.664‘n0’,’n1’,‘n3’,‘b0’8.8 ± 0.1
181222B0.5760.0320.608‘n3’,‘n4’,‘n7’,‘b0’36.2 ± 0.1
Publisher’s Note: MDPI stays neutral with regard to jurisdictional claims in published maps and institutional affiliations.