Abstract
In this paper, we make use of data collected for open cluster members by high-resolution spectroscopic surveys and programmes (i.e., APOGEE, Gaia-ESO, GALAH, OCCASO, and SPA). These data have been homogenised and then analysed as a whole. The resulting catalogue contains [Fe/H] and orbital parameters for 251 Galactic open clusters. The slope of the radial metallicity gradient obtained through 175 open clusters with high-quality metallicity determinations is −0.064 ± 0.007 dex kpc. The radial metallicity distribution traced by open clusters flattens beyond R = 12.1 ± 1.1 kpc. The slope traced by open clusters in the [Fe/H]-L diagram is −0.31 ± 0.02 × 10 dex km kpc s, but it flattens beyond L = 2769 ± 177 km kpc s. In this paper, we also review some high-priority practical challenges around the study of open clusters that will significantly push our understanding beyond the state-of-the-art. Finally, we compare the shape of the galactic radial metallicity gradient to those of other spiral galaxies.
1. Introduction
The radial distribution of the metal content in our Galaxy, the so-called radial metallicity gradient, is an important observational constraint for models that allow us to study the Galactic formation and evolution scenarios e.g., [1,2,3,4,5]. Its shape and time evolution provide observational constraints on the disc formation process, on the role of radial flows and stellar migration [6,7,8,9,10,11,12], and the nature of the infalling gas and outflows [13,14,15]. Among the first models able to reproduce the negative abundance gradient observed in the thin disc of the Milky Way, we recall the model of Matteucci & Francois (1989, [16]) in which the Galaxy is assumed to form inside-out, i.e., on much shorter timescales in the inner rather than the outer regions, as originally suggested by Larson (1976, [17]) and confirmed later by cosmological models; see e.g., [18,19]. Generally, the inside-out disc formation mechanism is reproduced by an interplay between the radial variation of the star formation rate (SFR), and an exponential decrease of the gas infalling on the disc e.g., [1,20,21,22]. However, radial flows and stellar migration also have a role in modifying the observed gradients, for instance stellar migration might act in flattening the stellar metallicity gradients e.g., [9,19]. For a general review, we refer to Matteucci [23].
The Galactic metallicity gradient has be traced with a large variety of objects, from H II regions [24,25,26], to planetary nebulae [27,28,29,30], Cepheids [31,32,33], low mass [34,35,36] and massive stars [37,38]. Among those objects, open clusters (OCs) are recognised among the best probes of the gradient and its time evolution, since their ages and chemical composition can be determined with higher accuracy than for field stars. Open clusters have been used to track the radial metallicity gradient in our Galaxy since the late 1970s [39]. The results presented in subsequent works tend to converge on a bi-modal gradient, with a change of slope between the Galactocentric radii (R) 10 and 16 kpc see, e.g., [21,40,41,42,43,44,45,46,47,48,49]. There is a general consensus for a steeper gradient in the inner disc (R12–13 kpc), with a much flatter one in the outer regions.
Thanks to the age range spanned by the OC population (from few Myr to several Gyr, reaching for the oldest clusters 7–8 Gyr), they provide a unique opportunity to study the time evolution of Galactic metallicity gradient. Several works have investigated it separating the OCs in age bins see, e.g., [21,36,43,50,51,52], usually finding a flatter gradient for younger clusters see also [53]. The differences in the gradient of young and old clusters has stimulated discussion on the role of migration even in objects more massive than stars, such as clusters e.g., [36,54,55].
The last few years have seen a renewed interest in the study of open clusters, thanks to the launch of the Gaia satellite [56,57,58,59] and numerous spectroscopic surveys, such as Gaia-ESO [60], APOGEE [61] and GALAH [62] which have devoted a considerable amount of observational time to the study of clusters. In the present work, benefiting from the homogeneous determinations of cluster sample distances and ages obtained through Gaia [63], we use the data from the three main high-resolution spectroscopic surveys to review the Galactic gradient. The paper is structured as follows. In Section 2, we give an overview on the main Galactic High-Resolution Spectroscopic Surveys and Programmes that have determined the metal content of open clusters. In Section 1, we homogenise these metallicity values to a common scale and we derive the Galactic orbital parameters of the targeted open clusters. This dataset is then exploited in Section 2, where we outline and discuss the metallicity distribution traced by open clusters across the Galactic disk. Finally, in Section 5, we describe key scientific challenges that should be addressed in order to significantly advance our knowledge.
2. An Overview on the Galactic High-Resolution Spectroscopic Surveys and Programmes
In this section, we describe the main characteristics of the Galactic High-Resolution Spectroscopic Surveys and Programmes that have determined the metal content of open clusters. These metallicity values are then used in the following sections to describe the radial metallicity distribution traced by open clusters.
2.1. APOGEE
The Sloan Digital Sky Survey/APOGEE is a high-resolution (R∼22,000), near infrared spectroscopic (1.51–1.70 m) survey currently operating in both hemispheres, at Apache Point Observatory and Las Campanas Observatory. The APOGEE/DR16 dataset includes about 430,000 stars, collected between August 2011 and August 2018 using the two 300-fiber APOGEE spectrographs [64]. Given the overall goal to map further distances in the Galaxy, the survey mostly targets evolved stars, but APOGEE has also observed a significant number of dwarf stars, including M dwarfs and young stellar objects [61,65].
The Open Cluster Chemical Analysis and Mapping (OCCAM) survey [66] is an ancillary program of APOGEE that aims at producing a comprehensive and uniform data set for open clusters’ chemical abundances. Several previous studies have made use of APOGEE spectra of open cluster members, including Cunha et al. [52], Donor et al. [67], Souto et al. [68], Poovelil et al. [69], Price-Jones et al. [70], Souto et al. [71], Souto et al. [72], Cunha et al. [73]. The latest contribution from the OCCAM survey [48] presents the analysis of APOGEE DR16 spectra of 128 open clusters, 71 of which are designated to be “high quality” based on the appearance of their color-magnitude diagram. They provide radial velocity estimations of the cluster members, as well as detailed abundances for individual elements (e.g., Fe, O, Mg, S, Ca, Mn, Cr, Cu, Na, Al, and K). In the following sections, we adopt the metallicity values from Donor et al. [48].
2.2. Gaia-ESO
The Gaia-ESO survey (GES) is a large public spectroscopic survey carried on with the spectrograph FLAMES [74] at VLT [60,75] from the end of 2011 to 2018. GES has some unique features with respect to the other spectroscopic surveys: it has been performed on a larger telescope, VLT-UT2, an 8-m class telescope, thus reaching fainter and more distant stellar populations; it has observed at two spectral resolutions with UVES (R∼47,000) and with GIRAFFE (R∼20,000); it has covered all stellar populations and all types of stars in the MW, from pre-main sequence stars to old giants, from young clusters in the solar neighbourhood to the halo; the analysis has been performed with a multi-pipeline strategy allowing an in-depth study of the systematic effects affecting spectral analysis; and it has observed a large number of open clusters. In particular, this aspect is important for the aim of the present review, since GES observed in each cluster large and unbiased samples of stars and the cluster dataset samples the whole age-distance-metallicity parameter space. In addition, GES has included and re-analysed in a homogeneous way a sample of open clusters from the ESO archive, complementing its original sample. The final data release (idr6) includes 87 clusters. It provides stellar parameters, metallicity, and elemental abundances, radial velocities, and additional products, such as gravity index, chromospheric activity tracers, mass accretion rate diagnostics, and veiling. Several works in recent years have been devoted to the study of open clusters observed by the GES, among many we recall the latest ones: Bertelli Motta et al. [76], Magrini et al. [77], Magrini et al. [78], Magrini et al. [79], Prisinzano et al. [80], Hatzidimitriou et al. [81], Casali et al. [82], Casali et al. [83], Baratella et al. [84], Randich et al. [85], Jackson et al. [86], Bonito et al. [87], Gutiérrez Albarrán et al. [88], Semenova et al. [89], Binks et al. [90]. In the following sections, we adopt the average abundances from idr6 for the member stars of 57 clusters with ages ≥ 120 Myr published in Magrini et al. [79]. For the youngest clusters, we use the metallicity values from Baratella et al. [84], Spina et al. [91].
2.3. GALAH
The Galactic Archaeology with HERMES (GALAH) survey [62,92,93] acquires data with the 3.9-m Anglo-Australian Telescope at Siding Spring Observatory though the High Efficiency and Resolution Multi-Element Spectrograph (HERMES). The spectrograph disperses the light at ∼28,000, which is then captured by four independent cameras and recorded across four non-contiguous channels (4713–4903, 5648–5873, 6478–6737, and 7585–7887 Å).
The GALAH’s latest public release, the GALAH+ DR3 catalog [94], contains data from the main GALAH survey, and it also includes data from ancillary surveys [95,96], which use the same spectrograph, observational setup, and data reduction pipeline as the GALAH survey.
Homogenised chemical abundances from the GALAH+ DR3 and APOGEE DR16 catalogs have been used by Spina et al. [97] to derive chemical abundances of 21 elements, from C to Eu, for 134 open clusters, which are publicly available1 Following the authors’ recommendation, we caution against the chemical abundances of open clusters that have been derived though only one stellar member, as their values could not be accurate and the uncertainties underestimated. Therefore, in order to make this distinction clearer to the reader, we call the group of clusters whose metallicity was derived by Spina et al. [97] through only one stellar member as the silver sample, while all the other clusters belong to the gold sample.
2.4. OCCASO
The Open Cluster Chemical Abundances from Spanish Observatories (OCCASO) survey [98] targets several Northern open clusters to obtain accurate radial velocities and chemical abundances for more than 20 chemical species from high-resolution spectra (R ≥ 62,000) using the facilities available at Spanish observatories and complementing the Gaia-ESO observations from the South. The sample clusters have age ≥0.3 Gyr and have six or more stars close to the Red Clump region in the Colour-Magnitude diagram. They are selected mainly in the poorly studied regions in terms of R, [Fe/H], age and height above the Plane and for calibration purposes. The results of the OCCASO survey have been presented in Casamiquela et al. [47,98,99,100]. In the present work, we have used the metallicity values of 18 clusters from Casamiquela et al. [47].
2.5. SPA
The Stellar Population Astrophysics (SPA) project is an on-going Large Programme carried on the 3.6 m Telescopio Nazionale Galileo (TNG) at the Roque de los Muchachos Observatory (La Palma, Spain). It is providing high-resolution optical and near-infrared spectra with GIARPS, a combination of the HARPS-N (R∼110,000) and GIANO-B (R∼50,000) spectrographs, of approximately 500 stars near to the Sun, covering a wide range of ages and properties see, for a general description, [101]. Many of the SPA targets belong to open clusters for which stellar parameters of member stars, and in some cases a large variety of elemental abundances, have been derived, as the young open clusters ASCC 123 [102], the Praesepe cluster [103], Collinder 350, Gulliver 51, NGC 7044 and Ruprecht 171 Casali et al. [83], and a sample of 16 clusters in Zhang et al. [104] located at Galactocentric distance between ∼7.7 and ∼10 kpc. We use, for our sample, the results from all the mentioned SPA papers.
3. The Homogenised Dataset
Each of the surveys mentioned above have collected and analysed data following their own strategies, and using different instruments, tools, models, and techniques. As a consequence of this heterogeneity, there are systematics affecting their data products, and in particular the chemical abundances. For this reason, a large homogenised data set of open clusters’ metallicities derived by different high-resolution surveys and programmes is highly desiderable.
In this section, we describe how we assemble such a data set and how we derive the properties of open clusters’ Galactic orbits. These results are listed in Table 1. This is a unique table—available at the CDS—which reports for each open cluster the physical (coordinates, parallaxes, proper motions), orbital (Galactic velocities, orbital actions), and chemical (homogenised iron abundances) of the open clusters.

Table 1.
Physical, orbital and chemical properties of open clusters—full table available online at the CDS.
3.1. Metallicity Homogenisation
The metallicity values derived by different surveys and programmes are homogenised over the APOGEE sample. The choice of APOGEE as the standard calibrator is justified by the fact that this survey has observed a large number of Galactic open clusters spanning a wide range of metallicities. Here, we use the OCCAM sample from [48], who selected only evolved stars (i.e., log g ≤ 3.7 dex) for their analysis of metallicity gradients. Thus, their abundances can be considered as not affected by atomic diffusion [68,76,105].
First, we homogenise the GALAH dataset to that of APOGEE. To do so, we use the 44 open clusters in common between APOGEE-gold and GALAH-gold samples. These latter are plotted as coloured (orange or blue) circles in Figure 1A, which shows [Fe/H]-[Fe/H] as a function of the [Fe/H] values from the APOGEE-gold sample. The homogenisation is carried out correcting for the linear relation that we assume exists between these two quantities. This relation is found through a Huber regressor [106] that is able to identify the eventual outliers (represented as blue circles in Figure 1) and carry out the linear fitting only of the inliers (orange circles). The hyperparameter epsilon of the Huber regressor is set to 2. The result of the linear fit is represented as a black line. Figure 1A also shows as grey crosses the open clusters included in the GALAH-gold sample, but not in the standard sample. These are useful to visually check that the [Fe/H] range of clusters to be homogenised is within the [Fe/H] range of clusters in common with the standard sample. The plot of Figure 1A shows four outliers that are excluded from the linear regression: Basel 11b, Berkeley 71, NGC 1857, and NGC 2304. In fact, these latter have [Fe/H] abundances that are less precise than the majority of the other clusters.
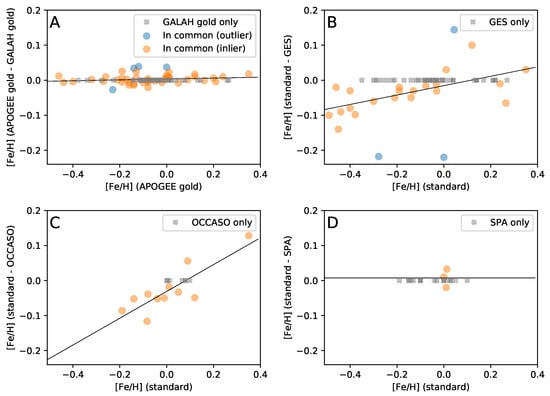
Figure 1.
(A–D) The figure shows the different steps of the homogenisation procedure. In each panel, we plot the differential abundances between the clusters in the standard sample and the clusters in the catalog that have to be homogenised, as a function of the [Fe/H] values from the standard. The coloured circles represent the open clusters in common between the two datasets. More specifically, the blue circles are the clusters that are identified as outliers through the Huber regressor, while the orange circles are the inliers. The linear fit is carried out on the latter, and the results are shown as a black line. The grey crosses represent the clusters that are not in common with the standard sample.
Once the homogenisation of GALAH-gold over APOGEE-gold is accomplished, the open clusters that are part only of the GALAH-gold sample are added to APOGEE-gold. This merged dataset is then used as a new standard for the homogeisation of the Gaia-ESO sample. The analysis described above is repeated, and the results are shown in Figure 1B. In addition, in this case, the are outliers whose [Fe/H] uncertainties are higher that the vast majority of the other clusters: Berkeley 44, Collinder 261, and NGC 2264. Once the Gaia-ESO data are homogenised and added to the standard data set, the resulting catalog is then used as a new standard for the homogenisation of the OCCASO data set (see Figure 1C).
Then, we perform the homogenisation of the SPA dataset. Since this programme only has three clusters in common with the standard sample, the homogenisation is carried out by subtracting the average of [Fe/H]-[Fe/H], as it is described in Figure 1D.
Finally, we add the clusters of the APOGEE-silver and GALAH-silver samples that are not included in the catalogs mentioned above. The [Fe/H] from the APOGEE-silver sample remain unchanged. Instead, the GALAH-silver sample is homogenised using the same relation shown in Figure 1A.
The final sample with homogenised iron abundances includes 251 open clusters in total. These are divided in 180 gold open clusters, plus 71 other clusters whose abundances are taken from either the APOGEE-silver or GALAH-silver samples. These latter are not considered in the analysis of the Galactic metallicity gradients discussed in Section 2; nevertheless, for completeness, we report them as well in Table 1.
Instead of using the largest data set as a standard calibrator, one could make a different choice and homogenize over the highest-quality data set. If we exclude OCCASO and SPA, whose data sets are considerably small compared to those of the other surveys, the highest-quality data set is probably the one from Gaia-ESO, as it is obtained from spectra with the highest resolution. Thus, we verified that, using Gaia-ESO as a standard calibrator, the results discussed in the following sections of this paper do not change.
3.2. Orbital Parameters
The kinematic properties of open clusters are derived from their astrometric solutions: right ascension (), declination (), parallax (), and proper motions ( and ). These values are taken from the catalog published by Cantat-Gaudin et al. [63] and are based on Gaia DR2 data of stars with probabilities of being members of the clusters ≥ 0.7. Among the 251 open clusters, 216 have astrometric solutions. In particular, out of the 180 gold open clusters, 175 are with astrometric solutions. The remaining five clusters are the star forming regions Carina, Chamaeleon I, NGC 6530, and Rho Ophiuchi, and the old cluster FSR 0394. When the astrometric solutions are not available from Cantat-Gaudin et al. [63], we use those from Kharchenko et al. [107].
Radial velocity (RV) is another fundamental ingredient for the derivation of orbital parameters. These values are taken from the same catalogs listing the iron abundances used in Section 3.1. In addition to those, we also used the dataset from Soubiran et al. [108] (hereafter, Gaia-RV), which is based on Gaia DR2 radial velocity values.
In order to collect RV determinations for the clusters in our dataset, we give the highest priority to the values based on more than one stellar members and with standard deviation <3 km s from the GALAH [109], APOGEE [48], and Gaia-RV [108] datasets, respectively. For the clusters without a RV determination in those catalogues, we use the values from Gaia-ESO [60] and SPA [101]. Finally, for the remaining clusters, we use the GALAH, APOGEE, and Gaia-RV datasets without restrictions on the number of stellar members and standard deviation.
The kinematic properties of the open clusters are determined following the same procedure applied to the GALAH open clusters, which is detailed in Spina et al. [109]. First, physical distances from the Sun of every open cluster are obtained from the value and its uncertainty, processed by abj20162. Following the formalism described in Astraatmadja and Bailer-Jones [110], this code derives the distance probability density function of the cluster from which we calculate the median value. The latter, (, , , , and RVs are then transformed into Galactocentric coordinates and velocities, both Cartesian (X, Y, Z, U, V, and W) and cylindrical (R, , z, v, v, v) through GALPY3 [111] a Python package for galactic dynamics. We also compute actions J, L, J, guiding radii r, eccentricities e, and orbit boundary information (z, R, and R) in the Galactic potential MWpotential2014 described in Bovy [111] and a Staeckel fudge with 0.45 as the focal length of the confocal coordinate system.
The statistical uncertainties of all these properties are obtained from a Monte Carlo simulation with a 10,000 sampling size. These samples are randomly drawn from normal distributions centred on , , , , and RV and with a standard deviation equal to their standard error. For the distance parameter, we use the probability density function obtained through abj2016. In Table 1, we list the median values and standard deviations of the final distributions of these kinematic properties.
4. Galactic Metallicity Gradients
Open clusters are tracers of the chemical evolution of the Galactic disk both in space and time. In Figure 2, we use the information derived in Section 1 to study how metallicity varies across the disk. Here, we consider the gold sample of open clusters that are also included in the catalog of Cantat-Gaudin et al. [63]. These 175 open clusters currently represent the largest sample of clusters ever used to trace the Galactic metallicity gradient with high-resolution spectroscopy (i.e., R ≳ 20 k). Figure 2-top shows Fe abundances as a function of the Galactocentric distances in cylindrical coordinates R. Clusters are colour coded as a function of their age from Cantat-Gaudin et al. [63].
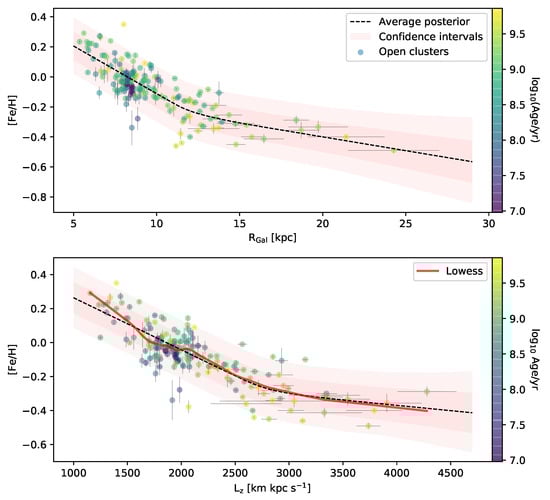
Figure 2.
(Top) [Fe/H] values determined for open clusters as a function of their Galactocentric distances R. Clusters are colour coded as a function of their age. Red shaded areas represent the 68 and 95% confidence intervals of the models resulting from the Bayesian inference, while the black dashed line traces the most probable model. (Bottom) Same as in the top panel, but with [Fe/H] plotted as a function of angular momentum L.
Similarly to many other studies before us [43,44,45,48,66,112,113], we also model the distribution of open clusters in the [Fe/H]-R space with a broken-line defined as follows:
Through a Monte Carlo Marcov Chain simulation, we derive the probability density distributions of the parameters in Equation (1). During the simulation, the x and y values are randomly drawn from normal distributions centred on the R and [Fe/H] values of the cluster:
where R is the uncertainty related to R and listed in Table 1, while Fe is the quadratic sum between the standard error of [Fe/H] calculated among the members of the cluster4 and a free parameter which accounts for the intrinsic chemical scatter between clusters at fixed Galactocentric radius. In fact, a variety of processes are responsible for this additional scatter in Fe that cannot be explained by measurement uncertainties, such as chemical evolution, radial migration, and the fact that we are projecting a 3D space (e.g., X, Y, Z) to the one-dimensional, variable R.
Priors for a, b, b, and k are chosen to be (0.6, 0.5), (−0.07 kpc, 0.2 kpc), (0.0 kpc, 0.2 kpc), and (13 kpc, 2 kpc), respectively. Our prior for the parameter is a positive half-Cauchy distribution with = 1. We run the simulation with 10,000 samples, half of which are used for burn-in, and a No-U-Turn Sampler [114]. The script is written in Python using the package [115].
The convergence of the Bayesian inference is checked against the traces of each parameter and their autocorrelation plots. The 68 and 95% confidence intervals of the models resulting from the posteriors are represented in the top panel of Figure 2 (top) with red shaded areas. There are few clusters that are located out of the shaded areas, such as the metal-rich NGC 6791 (R = 8.0 kpc; [Fe/H] = 0.35 dex) and the metal-poor NGC 2243 (R = 11.2 kpc; [Fe/H] = −0.46 dex). These outliers are old clusters (age > 1 Gyr) that have had the time to migrate significantly across the Galactic disk. The posteriors of the parameters from Equation (1) are shown in Figure 3-left panels. The mean values, standard deviations and 95% confidence intervals are also listed in Table 2-upper panel.
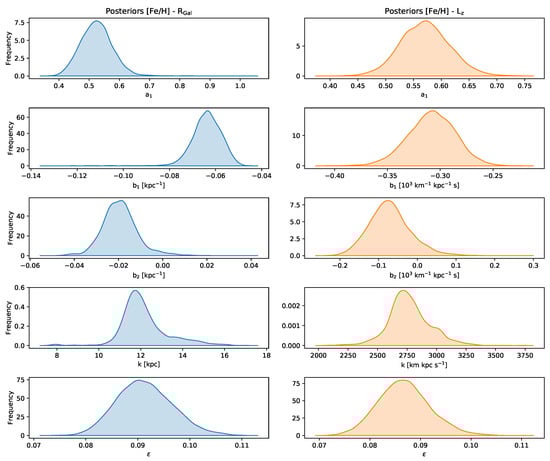
Table 2.
Posteriors.
According to our results, the knee of the Galactic metallicity gradient is located at 12.1 ± 1.1 kpc from the Galactic centre. This is an inner location compared to that found by Donor et al. [48] (i.e., 13.9 kpc). However, our result is in agreement several other works locating the break between 12 and 13 kpc from the Galactic centre [43,44,45,46,52,113]. Nevertheless, the break location found by Donor et al. [48] is still within the 95% confidence interval of our solution.
The slope of the inner metallicity gradient (i.e., b) is another important parameter which is tightly linked to the evolution of our Galaxy. Our value of −0.064 ± 0.007 kpc is in excellent agreement with many recent works based on open clusters [47,48,97,113,116].
There is a general consensus in the literature that the outer disk has a radial metallicity gradient which is significantly flatter than that of the inner disk. Our results confirm this view. Nevertheless, the slope of the outer gradient traced by our sample (b = −0.019 ± 0.008 kpc) is not consistent with a perfectly flat plateau.
The R values used in Figure 2 top panel offer a snapshot of the current location of open clusters, and they are not always representative of where clusters are born. In fact, it is very likely that clusters, especially the oldest ones such as NGC 6791, have migrated a long way from their birth locations. Although with our current information we are not able to trace back all these clusters to their original orbits, the metallicity variation across the Galactic disk can be studied against other parameters that are more fundamental than R. For instance, a stellar particle that only interacts with a static axisymmetric potential would see its R changing and following the radial oscillations of its eccentric orbit. On the other hand, its angular momentum L would stay constant5. Therefore, the main advantage of action integrals—such as L—is that they are conserved along the entire orbit and in fact they are often used to unveil orbital structures in the Galactic disk [117]. In the -Gaia era, action integrals could only be studied locally (500 pc from the Sun) and, for that reason, the metallicity variation across the Galactic disk has been historically studied against R. Instead, the precise astrometric solutions now produced by Gaia make it possible to capture the entire kinematic information for a broad range of clusters. This now makes L a quantity that is much better suited than R to characterise the metal content across the Galaxy [97]. Note that the guiding radius can also be used in place of the angular momentum; in fact, the two are quantities carrying the same information.
In Figure 2 bottom panel, we show the distribution of open clusters in the [Fe/H]-L space, which is modelled using Equation (1) and the same technique described above. The resulting posteriors are shown in Figure 2 right panel, and the confidence intervals are also listed in Table 2 middle panel.
Similarly to what we observed in the [Fe/H]-R diagram, the distribution of clusters in the [Fe/H]-L space is also characterised by a steeper inner gradient, a break located around L∼2800 km kpc s, and a flatter outer slope. Nevertheless, there may be details in the [Fe/H]-L diagram that our simple model could not capture. For instance, the locally weighted scatterplot smoothing (LOWESS) function in Figure 2 bottom shows a hint of a wave-crest between 2000–2200 km kpc s, which is similar to that found by Wheeler et al. [118] with Gaia and LAMOST data. This particular feature could be linked to the Outer Lindblad Resonance or to the Perseus arm, both located at L2200 km kpc s. As an alternative explanation, this ridge could simply be a statistical fluctuation of the LOWESS function. The urgency of enlarging the current sample of open clusters with metallicity determinations, and the necessity of understanding whether or not the features visible in Figure 2 are truly related to resonances of the Galactic disk, are key challenges that lie before us that we will discuss in more details (see Section 5.1 and Section 5.3).
It is also interesting to study how the metallicity gradients evolve with time and compare them to other tracers of the metallicity distribution across the Galactic disk. In Figure 4, we show the inner metallicity gradients calculated for different age bins with an orthogonal distance regression in both the [Fe/H]-R (blue circles) and [Fe/H]-r (red circles) diagrams. We also compare these values with the gradient seen for Cepheids (green circle; [31]), which are young stars with a range in ages that is quite limited (∼20–400 Myr), and the gradient-age relation observed by Casagrande et al. [119] on field stars (solid line). A similar figure showing flatter gradients for younger populations, including OB stars, was previously presented in Daflon and Cunha [37] for oxygen, keeping in mind that the latter element is measured in H II regions, OB stars, planetary nebulae and Cepheids.) As discussed previously in the literature [36,48,91,97], the young [Fe/H]-R gradient is flatter than the old one. Interestingly, the gradients traced by the youngest clusters are remarkably similar to those traced by Cepheids and young field stars. Nevertheless, as we move towards older bins, clusters and field stars show opposite behaviours: [Fe/H]-R gradient traced by clusters steepens, while that of field stars become flatter. Only this second behaviour is what it is expected from chemo-dynamical models of the Galactic disk [120]. This dichotomy between clusters and field stars is still a topic of debate; however, it is likely the result of a bias that is intrinsic in the populations of open clusters and that is operated by the Galaxy itself that quickly dissipates clusters living most of their lives near the Galactic centre (for more details, see Spina et al. [97]). As it is discussed in Section 5.2, we require further studies of these selection effects in order to better understand how the Galaxy is shaping the current demography of open clusters.
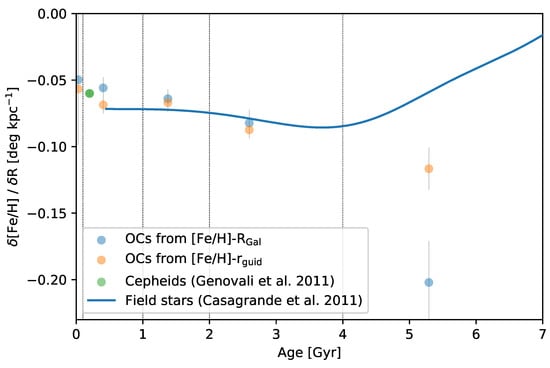
Figure 4.
Age dependence of the Galactic metallicity gradient traced by open clusters in the [Fe/H]-R (blue dots) and [Fe/H]-r (red dots) diagrams. The gradient age dependence traced by Cepheids ([31] is represented by a green circle, while field stars [119] are represented by a solid line.
As it was also noticed by Spina et al. [97], the gradient in the [Fe/H]-r space has a very little evolution with time. This is probably due to the fact that action integrals are more fundamental quantities than R. Differences between the distribution of open clusters within the [Fe/H]-R and [Fe/H]-r diagrams need to be further investigated with larger samples and more precise astrometric data.
Finally, it is interesting to notice that, although the innermost open clusters in our sample reach [Fe/H] abundances of ∼0.3 dex, the young stellar populations living in the Galactic centre are roughly solar [121,122]. Reconciling these findings is not straightforward. Does the inner metallicity gradient follow the steep gradient that we find in the regions between say 5 and 12 Kpc, or does it rather flatten and then invert its slope as we move towards the inner regions of the Galaxy?
5. Present and Future Challenges
In recent years, the study of Galactic open clusters has been undergoing an epochal revolution due to the tsunami of data produced by large missions and surveys such as Gaia, APOGEE, Gaia-ESO, GALAH, and many others. This unprecedented wealth of resources is pushing the field forward at high speed. Nevertheless, there is still much to understand around the chemical distribution of elements traced by open clusters. In this section, we discuss a few practical challenges that we hope would have the highest priority in order to advance the field significantly beyond its current the state-of-the-art.
5.1. The Selection Bias
To which extent is the current census of open clusters representative of the entire population living in our Galaxy? Is there any selection bias that is preventing us from using open clusters as effective tracers of the chemical evolution of the Galactic disk?
In Figure 5, we show the distribution of open clusters with [Fe/H] determination (coloured circles) and that we used to outline the Galactic metallicity gradient discussed in Section 2. It is readily evident that the open clusters in the outer disk—those with large L values—are on average older and also have larger values of J and J compared to the others. Therefore, the open clusters that we are using to trace the outer gradient are those that formed a long time ago that are living most of their time at large heights from the midplane, and on very eccentric orbits. Is this the effect of a selection bias due to the fact that it is easier to collect spectra from distant stars located above the midplane? How is this potential bias affecting the metallicity gradients shown in Figure 2?
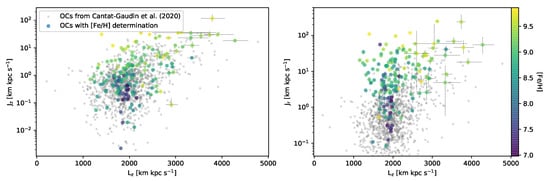
Figure 5.
(Left) Open clusters in the action space J-L. The open clusters with [Fe/H] determinations that we have used to outline the metallicity gradients in Figure 2 are shown as coloured circles. The different colours are representative of clusters ages. The small grey dots represent the other open clusters from the census of Cantat-Gaudin et al. [63]. Among all the clusters included in that catalog, we can show only those with a radial velocity determination. The RVs of clusters without [Fe/H] determinations are taken from Tarricq et al. [123]. For these clusters, we derive the three actions L, J, and J using the same method described in Section 3.2. (Right) Open clusters in the action space J-L.
An answer and a solution to this issue can be achieved by targeting open clusters that are strategically located in undersampled regions of the J-L and J-L diagrams. However, when we look at the distribution of open clusters that still do not have a [Fe/H] determination (grey circles), we find that very few of them are located in the outer disk and have low J and J values. Is this a real feature of the demographics of Galactic open clusters or instead is it the consequence of another selection bias affecting searches of open clusters? In fact, it is also in this case much easier to spot clusters located well above the Galactic midplane, rather than those living closer to the disk where the stellar density and extinction are higher.
Similarly, there are no clusters with [Fe/H] determination at L < 1100 km kpc s, but there are also very few known open clusters below that threshold. Is it because the clusters born in the inner Galaxy are immediately dissipated due to interactions with the bar, spirals, and giant molecular clouds or instead it is that we are not seeing them because of the high stellar density and extinction?
It is well known that past and recent searches of open clusters have been strongly biased by humans decisions. Astronomers have decided the regions of the Galaxy that deserved a deeper search, the observational strategy, and the techniques of analysis, which were fine-tuned to extract clusters with specific stellar densities. Although these decisions were necessary due to the lack of resources and observing time, they have strongly biased our current catalog of clusters in a very complex way. How this selection bias is affecting what we have learnt from open clusters around the Galactic chemical evolution is still undetermined. That represents a fundamental issue that needs to be addressed.
5.2. The Cluster Dissipation Bias
Do open clusters and field stars trace the chemical map of the Galactic disk in a similar way?
The results presented in Figure 4 indicate that there may be differences between the open clusters and the field stars. It is well known that several mechanisms can modify the orbits of stars, hence shaping their demographics across the Galaxy. For instance, stars can gain or lose angular momentum from interactions with gravitational potential (e.g., spirals, bars, molecular clouds). As a consequence, many stars have travelled a long way from the orbits in which they were born, and it is now difficult to ascertain where they originated. The situation that could be different for open clusters. In fact, the Galactic potentials that can modify stellar orbits are the same that can drive a quick disruption of open clusters. Therefore, it is possible that the open clusters that we observe today are either those that are young enough to not have undergone numerous interactions with the gravitational potential or old clusters living most of their time far from these potentials (e.g., far from the mid plane or in the outer disk). Either way, these are the clusters that have probably conserved most of their angular momentum.
In a recent work, Spina et al. [97] have discussed multiple hints of this dichotomy between field stars and open clusters. For instance, they have shown that old (age > 2 Gyr) clusters in our census are living far from the Galactic midplane, unlike field stars that are always more densely concentrated near the midplane. Is it because the open clusters born on orbits leaning on the Galactic disk have been quickly dissipated? Or instead are we missing the old clusters on the midplane because of a selection bias?
Similarly, the metal rich clusters formed near the inner Galaxy will likely face a rapid disruption if they do not migrate outward, where the galactic potentials are weaker. This is probably how the old, metal-rich NGC 6791 survived till today. Thus, if a metal-rich open cluster that formed in the inner disk can survive only if it migrates outward, one would expect to observe the older clusters tracing a steeper gradient than that seen for young clusters and field stars. This is exactly what we observe in Figure 4.
These are just realistic hypotheses, however. Solid evidence that opens clusters are not redistributed across the Galactic disk like field stars would represent a breakthrough in our understanding of the mechanisms that are responsible for stellar migration and cluster disruption. It would also be crucial to interpret the chemical distribution of elements traced by open clusters analogous to that of other tracers. Finally, the possibility that an existing cluster is less likely to have migrated than a coeval star in the field would justify the use of clusters as the best model-independent tracers of the role of radial migration in the Galactic disk. Therefore, a realistic comparison between the demographics of open clusters and field stars is urgently needed.
5.3. The Role of Resonances in the Galactic Disk
The dynamics of stars and the flows of gas across the Galactic disk obey a number of rules dictated by resonances between the frequencies of azimuthal and radial oscillations ( and , respectively), which are the frequency of oscillation of a star around its non-perturbed circular orbit, and the frequency of rotation around the Galactic center:
where m and l are small integers with m > 0. All these resonances can induce overdensities or underdensities of stars and gas within the Galactic disk. They can even act as barriers preventing matter from freely flowing across the disk.
It is expected that this complex dynamical substructure of the Galactic disk would produce visible signatures in the chemical distribution of elements [118]. Therefore, features may be noticeable in the metallicity gradient outlined by open clusters at the corotation (l, m = 0), or at the Lindblad Resonances (l = ±1, m = 2). A possible consequence of these resonances could be the crest visible at L2000–2200 km kpc s from the LOWESS in Figure 2 bottom. Furthermore, the break between the inner and outer gradients and the flatness of this latter also deserve an explanation within this context [124].
Now that Gaia data are unveiling interesting dynamical patterns within the Galactic disk [125], we believe that the effect of these resonances deserves further investigations in relation to the chemical distribution of elements traced by open clusters.
5.4. The Role of the Galactic Warp
Our Galaxy, like many large spiral galaxies, is warped and flared in its outskirts. The Galactic warp and flare are traced by various populations: gas such as atomic Hi e.g., [126,127,128], ionized hydrogen e.g., [129] and molecular clouds e.g., [130,131,132], and stellar populations e.g., [133,134,135,136], including Cepheids e.g., [137,138,139] and open clusters e.g., [63,140]. Amores et al. [141] investigated the dependence with the age of the structural parameters of the outer disc, including warp, flare, and disc truncation, finding strong evidence that the thin disc scale length, as well as the warp and flare shapes, changes with time. As described in Amores et al. [141], this might be due to a misalignment of the disc inside the dark halo, which can change with time, provoking a precession, or to the interaction of our Galaxy with the Magellanic Clouds. If the warp has a dynamical origin, tracers of different ages might show a different behaviour [see also [142]. Using the results for the time-dependence of the warp in our Galaxy from Amores et al. [141], we have investigated the effect of the warp on the shape of the radial metallicity gradient. Since our sample of clusters spans a large range in ages, we have corrected their R, de-projecting it along the warped disc as in Amores et al. [141], considering the variation with time of both the amplitude, the starting radius and the angle of the warp. The effect is indeed negligible for the youngest clusters, while it affects mainly the older clusters (age ≳ 1 Gyr), located in the outer disk (R ≳ 10 kpc). The results are shown in Figure 6, where the grey dots represent the open clusters under the flat disk assumption, while the coloured circles are the clusters after the correction for the Galactic warp.
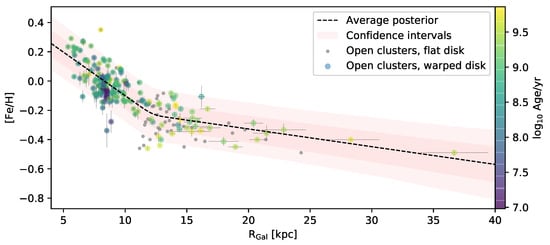
Figure 6.
[Fe/H] values determined for open clusters as a function of their Galactocentric distances R. Grey dots represent the open clusters under the flat disk assumption, while the coloured circles are the clusters after the correction for the Galactic warp. The latter are colour coded as a function of their age. Red shaded areas represent the 68 and 95% confidence intervals of the models resulting from the Bayesian inference, while the black dashed line traces the most probable model.
Using the R corrected for the Galactic warp, we repeat the analysis described in Section 2. The metallicity gradient of the warped disk is plotted in Figure 6 and the numerical results are listed in Table 2 bottom panel. Since the open clusters in the warped disk are located at greater distances, the new slope is slightly flatter than that found through the classic analysis. As a consequence, the break between the inner and outer disks also appears to be more distant from the Galactic centre. However, all the differences the gradient parameters are within their uncertainties. Nevertheless, we also note that the posteriors’ confidence intervals are tighter for the warped disk than those found for the flat disk. Finally, it is remarkable to see how the correction for the Galactic warp has moved the two outermost clusters of more than 5 kpc away from the Galactic centre.
The analysis described in this section is a simple illustration highlighting how the Galactic warp affects the radial metallicity gradient that we observe today. It is well known that the warp shows a complex structure, and it is strongly asymmetrical. There is no doubt that forthcoming Gaia data releases will pave the way for more accurate studies of the Galactic warp. These studies will be fundamental to trace a more realistic Galactic metallicity gradients.
5.5. Intra- and Inter-Clusters Chemical Homogeneity
Regardless of the precision achievable in elemental abundances, the success of chemical tagging relies on the significance of two other critical factors: (i) the level of chemical homogeneity among stellar members of the same cluster; (ii) the chemical diversity among open clusters.
These factors can be directly measured using distance metrics similar to that employed by Mitschang et al. [143]:
where C is a defined chemical space formed by N elements with A abundances. A weight is assigned to each element. This Manhattan-like distance is much less affected by outliers than the classical Euclidean distance and, for that reason, it should be preferred in studies of chemical tagging, especially those based on large volumes of data produced by surveys. Mitschang et al. [143] used the score described above to probe the intra- and inter-cluster level of homogeneity. The intra-cluster homogeneity level is given by the typical D distribution calculated among stars belonging to the same association, while, for the inter-cluster homogeneity level, D is computed from stars that are not members of the same cluster. This experiment has shown in practice that open clusters are ideal empirical calibrators of chemical tagging techniques. In fact, through them, we can understand chemical tagging in a practical sense, and probe different techniques of analysis (see also [144]).
It should be stressed, however, that intra- and inter-cluster homogeneity levels could be non-universal factors. For instance, old massive open clusters may be formed by multiple generations of stars and—similarly to what it is observed in globular clusters—these generations may be distinguishable also in the chemical space. Nevertheless, to date, all open clusters have been shown to be composed by single stellar populations [145,146]. A previous claim of chemical inhomogeneity for NGC 6791 [147] has not been confirmed in [73,148] and more recently in [149].
Other sources of chemical inhomogeneities have been found in open clusters, such as those related to atomic diffusion [68,76] or planet engulfment events [103,150,151]. The first can be observed by comparing the chemical patterns of main-sequence stars to those of giant stars (see Section 5.8) or fully convective M dwarfs [71]. Instead, the chemical signatures of planet engulfment events are mostly limited to G and late F-type stars, which are characterised by extremely thin convective zones that can be easily polluted by accreted material [152].
It is also very likely that the inter-cluster homogeneity level may be a function of the Galactocentric radius. The inner Galactic disk has evolved much faster than the outer disk. Therefore, the open clusters closer to the Galactic centre may be more chemically diverse than those formed at the outskirt of the Galaxy [83]. This would imply that chemical tagging in the inner Galaxy could be more efficient than in other regions of the disk.
In conclusion, despite the important works and attempts that have been conducted in the field, there is still much to understand around the intra- and inter-cluster homogeneity levels. Open clusters (and wide binary pairs) should be regarded at the centre of future studies in this field.
5.6. Spectroscopic Analysis of Young Stars
Figure 7 shows the metallicity distribution of the open clusters from the gold sample located at R within R 0.5 kpc. While these clusters span a wide range of [Fe/H] values between −0.2 and +0.35 dex, the fraction of clusters younger than 100 Myr is mostly restricted to sub-solar metallicities. Furthermore, all the youngest associations in this sample (age < 10 Myr) have on average even lower metal content.
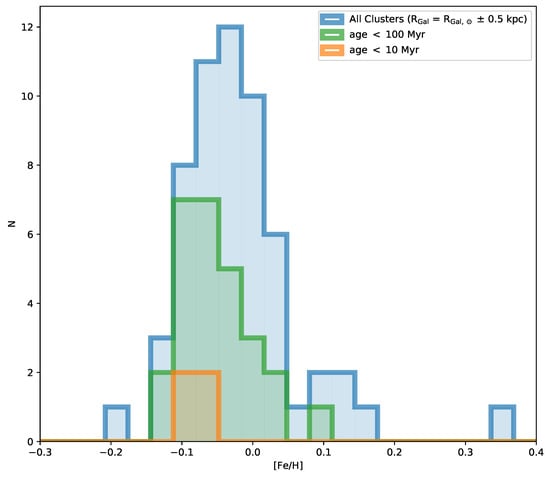
Figure 7.
Metallicity distributions of open clusters from the gold sample located at R within R0.5 kpc.
This evidence is clearly at odds with chemical evolution models of our Galaxy [3,10,21], which predict an increase of the metallicity with time. Such contention between theory and observations was previously noticed both within the solar vicinity [53,97,153,154,155,156,157] and beyond [91].
Recent works have shown that the anomalously low metal content of the youngest stars in our Galaxy is not the result of chemodynamical processes acting within the disk. Instead, they are caused by a synthetic gap in models of stellar atmospheres. The latter typically neglect the effects of stellar activity and magnetic fields on the formation of spectroscopic lines. These effects are particularly strong in young stars [158]. As a consequence of this approximation, the stellar atmospheres of active stars appear to be more metal poor than they actually are [84,109,159].
This poses a challenge for stellar spectroscopy. Most of the open clusters in our Galaxy dissolve on timescales that are typically shorter than a few Gyr due to the interactions with the bar, spirals and giant molecular clouds [160]. This implies that stellar members of these clusters are in large part young and active stars. The lack of a reliable methodology to derive their chemical content ultimately prevents us from using open clusters as effective tracers of the Galactic chemical evolution.
Important efforts have been done in developing new approaches of spectroscopic analysis based on the use of ad hoc linelists composed exclusively by those absorption features that are less affected by chromosperic activity [84]. Interestingly, these works have shown that the youngest clusters in the solar vicinity actually have super-solar metallicities ranging between between 0.04 and 0.12 dex. Although this work represents an important step towards the solution of the problem, developing new models of stellar atmospheres and new techniques of spectroscopic analysis that could fully take into account the effect of stellar activity would represent the optimal answer to this critical issue.
5.7. Analysis of Cool Stars
In some distant or particularly extinct clusters, only the brightest and coolest giants have been targeted. The spectra of cool stars, with T 4300 K and log g ≤ 1.8, are usually more difficult to analyse, in particular their surface gravity, and, consequently, their T and metallicity. The differences between the abundances from hotter and cooler stars in the same cluster, especially when their spectra are analysed through EWs, can be related, e.g., the failure of model atmospheres at low effective temperatures see, e.g., [161,162] or to the definition of the continuum near to the lines of interest in spectra dominated by line crowding (i.e., in particular high-metallicity giant stars) e.g., [83]. On the other hand, spectral synthesis is less prone to continuum setting and blending effects, producing more solid determination of the stellar parameters also in cool giant stars. In Figure 8, we show [Fe/H] as a function of log g in a sample of member stars in three open clusters, in which cool giants where observed: NGC 7044 and Rup171 from [83], analysed with both the EWs and the spectral synthesis, and Collinder 261 (only with EWs) from [163]. There is a clear decreasing trend of [Fe/H] with decreasing log g, much more pronounced in the analysis with EWs. The metallicity of NGC7044, in which only cool red giants are observed, is lower than we might expect for a cluster of ∼2 Gyr located in the solar neighbourhood. Considering only the stars of Rup 171, which are the most numerous in the sample shown in the figure and which cover the largest log g interval, we can compare the trend obtained with the spectral synthesis and that obtained with the EWs. Although there is an improvement in the analysis obtained with spectral synthesis (low gravity stars have metallicity closer to high gravity stars), the trend remains, with a slope of 0.17 ± 0.03 to be compared with a slope of 0.24 ± 0.02 for the analysis obtained with EWs.
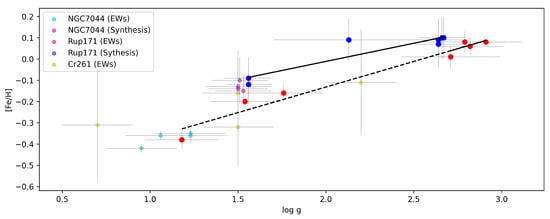
Figure 8.
The figure shows [Fe/H] as a function of log g in a sample of member stars in three open clusters, in which cool giants were observed: NGC 7044 and Rup171 from [83] analysed with both the EWs and the spectral synthesis, and Collinder 261 (only with EWs) from [163]. Colours and symbols are described in the legend.The continuous line is the linear regression to the results for Rup 171 obtained with spectral synthesis, while the dashed-line is the linear regression of the results from EWs for Rup 171.
Therefore, it is important to take this potential problem into account when dealing with clusters where only cool giant stars are observed, even if they are analysed with spectral synthesis, we might still have non-negligible effects on the derived parameters, particularly on metallicity. We suggest excluding the abundances in cool giants in the calculation of average cluster abundances.
5.8. Atomic Diffusion
Despite the problems highlighted in Section 5.7, evolved stars will certainly play a central role in tracing the chemical distribution of elements with open clusters. The chemical abundances that we measure in the stellar atmosphere can change along the different different evolutionary phases. This chemical abundance variation results from diffusion processes have been probed both in the metal-poor globular clusters [164,165,166], and in open clusters [68,76].
Atomic diffusion changes the surface chemical composition of stars during their main-sequence phase mainly because of gravitational settling that induces different elements to sink towards the interior of the star. The magnitude of this effect reaches its maximum at the turn-off, where the stellar atmosphere can be up to 0.10 dex poorer in Fe than its pristine composition [68,167]. After the turn-off, the outer convective zone becomes deeper and material from the stellar interior is brought back to the surface: the stellar atmosphere reacquires its initial chemical pattern.
The chemical composition changing along the evolutionary phases of stars can introduce small biases when we want to trace the chemical distribution of elements across the Galaxy. In fact, spectroscopic surveys typically observe a mixture of giants and dwarfs stars, with the evolved stars being generally observed at large distances, while dwarfs are often used as metallicity tracers around the solar location. A counter example is represented by APOGEE, which mostly observes evolved stars.
Future works should take this bias into account when significant. This is especially important for those interested in measuring the chemical scatter between open clusters at each Galactocentric radius, which is often interpreted as an indirect quantification of cluster migration e.g., [54,97].
6. The Radial Gradient of the Milky Way in the Extragalactic Framework
The Milky Way is a benchmark to study and understand the family of disk galaxies [168]. Only for the MW can we access the full star formation history of a galaxy, observing from the faint ancient dwarf stars to the young massive supergiant ones. The MW is one of the myriad of spiral galaxies of the Universe. However, Galactic studies will continue to play a fundamental role far into the future because there are measurements that can only be made in the near field. The MW is a luminous barred spiral with a central box/peanut bulge, dominated by its disk, and with a diffuse stellar halo. In a way, the Galaxy is a rather common spiral galaxy, located in a low density environment with a typical star formation rate, baryon fraction and stellar mass [169]. On the other hand, some of its characteristics are quite unusual: following Bland-Hawthorn and Gerhard [168], the MW falls in the sparsely populated “green valley” region of the galaxy colour-magnitude diagram, in transition between the ‘red sequence’ of galaxies and the ‘blue cloud’ [170]. In addition, the presence of two luminous dwarf galaxies (the Small and Large Magellanic Clouds, SMC and LMC) orbiting around the MW are very uncommon [171].
In the framework of the surveys aimed at studying the properties of nearby galaxies, it is interesting to compare the shape of the Galactic radial metallicity gradient with those of possible morphological analogues, keeping in mind that no two galaxies are exactly identical even if their morphology is very similar see, e.g., [172,173,174,175,176]. This comparison allows us to highlight common features between galaxies of similar morphological types, and at the same time to see which features are unique to our Galaxy. In this review, we compared the Galactic gradient slope and galactocentric radius at which the change of slope occurs, with the gradients observed in a sample of 95 spiral galaxies observed with Multi Unit Spectroscopic Explorer MUSE, see [177] at VLT by Sánchez-Menguiano et al. [172]. Both the slope and the radial position of the outer flattening in the MW, expressed in physical units, are in agreement with those observed in galaxies of similar morphological type, although there is a considerable spread, even in the sample of Sb galaxies. The large dispersion in the amplitude of the gradient slopes might indicate a possible dependence of the gradient with some particular property of the galaxies. In particular, Sánchez-Menguiano et al. [172] found that the steepest gradients are related to the presence of an inner drop or of an outer flattening. They suggested that radial motions might be playing an important role shaping the abundance profiles, and they might cause the presence of these features. The variety of behaviours at each given stellar mass might be homogenised when considering the gradients reported on the scale of the effective radius [178]. However, it is not trivial to have an estimate of the Galactic effective radius; in previous works, the MW disc scale length has been estimated to be atypically short, 2.15 kpc, see e.g., [179,180], much shorter than those in typical MW analogue galaxies. Boardman et al. [181] compared the gradient of the Milky Way with a sample of MW-analogue galaxies in the Mapping Nearby Galaxies at APO (MaNGA) sample. With their definition of MW analogues, based on the bulge-to-total ratio and not only on morphology, as opposed to what is shown in our Figure 9, where only morphology was taken into account, they found that the Galactic gradients are steeper (in dex kpc) than for a typical MW-analogue of their sample (see their Figure 10). Part of the discrepancy between the MW and its analogues might be related to the difference between the internal perspective offered by the MW and the external perspective available for other galaxies, and to our limited estimation of its scale-length, which is carried out via star-count analysis and differs significantly from the photometric methods employed in other galaxies [182]. In particular, as pointed out by Boardman et al. [181], we should be careful to compare “apple with apple” in the relative comparison between the MW and other galaxies, taking into account the differences due to integrated light of external galaxies versus the measurements of individual objects in the MW; the binning applied to the IFU data which might flatten the measured stellar population ratios see, e.g., [183]; the differences in gradient between mono-age and multi-age populations; see, e.g., [3,10].
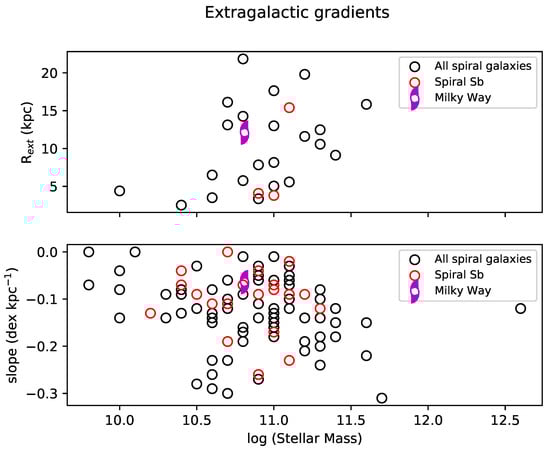
Figure 9.
The figure shows the R, the galactocentric radius at which the change of slope occurs, and the slope of the gradient in a sample of 95 spiral galaxies observed with MUSE@VLT in Sánchez-Menguiano et al. [172]. Colours and symbols are described in the legend.
The next few years will allow us to characterise our Galaxy even better. Thanks to the Gaia satellite data, we are having dynamical models of the MW, allowing us to measure the mass distribution in the disk, and its scale lengths; see, e.g., [184]. The new spectroscopic surveys with WEAVE [185], 4MOST [186], and MOONS [187], SDSS V MWM (using the APOGEE spectropgraphs) will enlarge the number of spectroscopic observations in open clusters, which remain among the best tracers of the Galactic metallicity gradient. At the same time, observations with Gaia and the Rubin telescope [188,189] will lead to the discovery of new clusters, complementing our view and overcoming some observational biases that affect our current knowledge of the Galactic cluster population. With such in-depth knowledge of the MW, we will be able to compare it in detail against its analogues, relating eventual differences with physical reasons, e.g., the unusual compactness of the MW for a galaxy of its type, its low density environment, or the interaction with Magellanic Clouds, and locating it in the framework of a wider galaxy population.
7. Summary
In this paper, we make use of data collected for open cluster members by high-resolution spectroscopic surveys and programmes: APOGEE, Gaia-ESO, GALAH, OCCASO, and SPA. These data have been homogenised and then analysed as a whole. The resulting catalogue contains [Fe/H] and orbital parameters for 251 Galactic open clusters.
The slope of the radial metallicity gradient obtained from 175 open clusters with high-quality metallicity determinations is −0.064 ± 0.007 dex kpc (see Figure 2 top, Figure 3 left, Table 2). The radial metallicity distribution traced by open clusters flattens beyond R12.1 ± 1.1 kpc.
We also investigate the distribution of open clusters in the [Fe/H]-L diagram (see Figure 2 bottom, Figure 3 right, Table 2). The slope we obtain is −0.31 ± 0.02 × 10 dex km kpc s. The distribution flattens beyond L = 2769 ± 177 km kpc s.
We notice that the metallicity scatter in the [Fe/H]-L diagram is lower than that obtained from R (Figure 3, Table 2). Furthermore, the [Fe/H]-L slope appears to be more stable with time than the classical radial metallicity slope (see Figure 4). These findings suggest that L is a better suited quantity than R to characterise the metal content across the Galaxy.
In Section 5, we review some high-priority practical challenges around the study of open clusters that will significantly push our understanding beyond the state-of-the-art. Namely, our knowledge on the open cluster demography is affected by selection biases which are preventing us from performing statistical studies of their populations and using them as effective tracers of the Galactic evolution (see Section 5.1). It is very likely that the Galaxy is also applying a selection of open clusters, dissipating those that are living most of their lives close to the midplane and the inner disk. Understanding this cluster dissipation bias is also fundamental to carry out meaningful comparison between the open clusters and field stars populations (see Section 5.2). In addition, we still need to understand which is the role of resonances in the Milky Way disk and of the Galactic warp in the spatial distribution of open clusters, with strong implications also on radial metallicity distribution that they trace (see Section 5.3 and Section 5.4). Given recent attempts for chemical tagging, it is fundamental to understand which is the intra- and iner-cluster chemical homogeneity at different locations within the Galactic disk (see Section 5.5). Finally, we still need to address how the anomalous metallicity of young stars, cool stars and atomic diffusion have affected studies of the radial metallicity distributions of open clusters (see Section 5.6, Section 5.7 and Section 5.8).
Finally, in Section 6, we compare the shape of the Galactic radial metallicity gradient to those of other spiral galaxies. The large dispersion in the amplitude of the gradient slopes that we observe for galaxies similar to our own Milky Way might indicate a possible dependence of the gradients to some particular properties of the galaxies, such as the total mass and radial motions of stars and gas.
Author Contributions
Conceptualisation L.S., L.M., K.C.; analysis L.S.; investigation L.S., L.M., K.C.; data curation L.S.; writing L.S., L.M.; review and editing L.S., L.M., K.C. All authors have read and agreed to the published version of the manuscript.
Funding
L.S. is supported by the Italian Space Agency (ASI) through contract 2018-24-HH.0 to the National Institute for Astrophysics (INAF).
Institutional Review Board Statement
Not applicable.
Informed Consent Statement
Not applicable.
Data Availability Statement
Table 1 is fully available at the CDS.
Acknowledgments
The authors are extremely grateful to Simone Daflon for the interesting conversations about open clusters and the radial metallicity gradients. L.S. also acknowledges Tristan Cantat-Gaudin, Neige Frankel, and Yuan-Sen Ting for the inspiring discussions about selection biases. L.S. is supported by the Italian Space Agency (ASI) through contract 2018-24-HH.0 to the National Institute for Astrophysics (INAF).
Conflicts of Interest
The authors declare no conflict of interest.
References
- Chiappini, C.; Matteucci, F.; Gratton, R. The Chemical Evolution of the Galaxy: The Two-Infall Model. Astrophys. J. Astrophys. J. 1997, 477, 765–780. [Google Scholar] [CrossRef]
- Prantzos, N.; Boissier, S. Chemo-spectrophotometric evolution of spiral galaxies—III. Abundance and colour gradients in discs. Mon. Not. R. Astron. Soc. Mon. Not. R. Astron. Soc. 2000, 313, 338–346. [Google Scholar] [CrossRef][Green Version]
- Minchev, I.; Chiappini, C.; Martig, M. Chemodynamical evolution of the Milky Way disk. II. Variations with Galactic radius and height above the disk plane. Astron. Astrophys. 2014, 572, A92. [Google Scholar] [CrossRef]
- Grisoni, V.; Spitoni, E.; Matteucci, F. Abundance gradients along the Galactic disc from chemical evolution models. Mon. Not. R. Astron. Soc. 2018, 481, 2570–2580. [Google Scholar] [CrossRef]
- Mollá, M.; Díaz, Á.I.; Cavichia, O.; Gibson, B.K.; Maciel, W.J.; Costa, R.D.D.; Ascasibar, Y.; Few, C.G. The time evolution of the Milky Way’s oxygen abundance gradient. Mon. Not. R. Astron. Soc. 2019, 482, 3071–3088. [Google Scholar] [CrossRef]
- Schönrich, R.; Binney, J. Chemical evolution with radial mixing. Mon. Not. R. Astron. Soc. 2009, 396, 203–222. [Google Scholar] [CrossRef]
- Spitoni, E.; Matteucci, F.; Recchi, S.; Cescutti, G.; Pipino, A. Effects of galactic fountains and delayed mixing in the chemical evolution of the Milky Way. Astron. Astrophys. 2009, 504, 87–96. [Google Scholar] [CrossRef]
- Spitoni, E.; Matteucci, F. Effects of the radial flows on the chemical evolution of the Milky Way disk. Astron. Astrophys. 2011, 531, A72. [Google Scholar] [CrossRef]
- Spitoni, E.; Romano, D.; Matteucci, F.; Ciotti, L. The Effect of Stellar Migration on Galactic Chemical Evolution: A Heuristic Approach. Astrophys. J. 2015, 802, 129. [Google Scholar] [CrossRef]
- Minchev, I.; Chiappini, C.; Martig, M. Chemodynamical evolution of the Milky Way disk. I. The solar vicinity. Astron. Astrophys. 2013, 558, A9. [Google Scholar] [CrossRef]
- Kubryk, M.; Prantzos, N.; Athanassoula, E. Evolution of the Milky Way with radial motions of stars and gas. II. The evolution of abundance profiles from H to Ni. Astron. Astrophys. 2015, 580, A127. [Google Scholar] [CrossRef]
- Kubryk, M.; Prantzos, N.; Athanassoula, E. Evolution of the Milky Way with radial motions of stars and gas. I. The solar neighbourhood and the thin and thick disks. Astron. Astrophys. 2015, 580, A126. [Google Scholar] [CrossRef]
- Spitoni, E.; Silva Aguirre, V.; Matteucci, F.; Calura, F.; Grisoni, V. Galactic Archaeology with asteroseismic ages: Evidence for delayed gas infall in the formation of the Milky Way disc. Astron. Astrophys. 2019, 623, A60. [Google Scholar] [CrossRef]
- Spitoni, E.; Verma, K.; Silva Aguirre, V.; Calura, F. Galactic archaeology with asteroseismic ages. II. Confirmation of a delayed gas infall using Bayesian analysis based on MCMC methods. Astron. Astrophys. 2020, 635, A58. [Google Scholar] [CrossRef]
- Spitoni, E.; Verma, K.; Silva Aguirre, V.; Vincenzo, F.; Matteucci, F.; Vaičekauskaitė, B.; Palla, M.; Grisoni, V.; Calura, F. APOGEE DR16: A multi-zone chemical evolution model for the Galactic disc based on MCMC methods. Astron. Astrophys. 2021, 647, A73. [Google Scholar] [CrossRef]
- Matteucci, F.; Francois, P. Galactic chemical evolution: Abundance gradients of individual elements. Mon. Not. R. Astron. Soc. 1989, 239, 885–904. [Google Scholar] [CrossRef]
- Larson, R.B. Models for the formation of disc galaxies. Mon. Not. R. Astron. Soc. 1976, 176, 31–52. [Google Scholar] [CrossRef]
- Grand, R.J.J.; Gómez, F.A.; Marinacci, F.; Pakmor, R.; Springel, V.; Campbell, D.J.R.; Frenk, C.S.; Jenkins, A.; White, S.D.M. The Auriga Project: The properties and formation mechanisms of disc galaxies across cosmic time. Mon. Not. R. Astron. Soc. 2017, 467, 179–207. [Google Scholar] [CrossRef]
- Vincenzo, F.; Kobayashi, C. Stellar migrations and metal flows—Chemical evolution of the thin disc of a simulated Milky Way analogous galaxy. Mon. Not. R. Astron. Soc. 2020, 496, 80–94. [Google Scholar] [CrossRef]
- Mollá, M.; Díaz, A.I. A grid of chemical evolution models as a tool to interpret spiral and irregular galaxies data. Mon. Not. R. Astron. Soc. 2005, 358, 521–543. [Google Scholar] [CrossRef]
- Magrini, L.; Sestito, P.; Randich, S.; Galli, D. The evolution of the Galactic metallicity gradient from high-resolution spectroscopy of open clusters. Astron. Astrophys. 2009, 494, 95–108. [Google Scholar] [CrossRef]
- Palla, M.; Matteucci, F.; Spitoni, E.; Vincenzo, F.; Grisoni, V. Chemical evolution of the Milky Way: Constraints on the formation of the thick and thin discs. Mon. Not. R. Astron. Soc. 2020, 498, 1710–1725. [Google Scholar] [CrossRef]
- Matteucci, F. Modelling the chemical evolution of the Milky Way. Astron. Astrophys. Rev. 2021, 29, 5. [Google Scholar] [CrossRef]
- Balser, D.S.; Rood, R.T.; Bania, T.M.; Anderson, L.D. H II Region Metallicity Distribution in the Milky Way Disk. Astrophys. J. 2011, 738, 27. [Google Scholar] [CrossRef]
- Esteban, C.; García-Rojas, J. Revisiting the radial abundance gradients of nitrogen and oxygen of the Milky Way. Mon. Not. R. Astron. Soc. 2018, 478, 2315–2336. [Google Scholar] [CrossRef]
- Arellano-Córdova, K.Z.; Esteban, C.; García-Rojas, J.; Méndez-Delgado, J.E. The Galactic radial abundance gradients of C, N, O, Ne, S, Cl, and Ar from deep spectra of H II regions. Mon. Not. R. Astron. Soc. 2020, 496, 1051–1076. [Google Scholar] [CrossRef]
- Maciel, W.J.; Quireza, C.; Costa, R.D.D. Time variation of radial gradients in the Galactic disk: Electron temperatures and abundances. Astron. Astrophys. 2007, 463, L13–L16. [Google Scholar] [CrossRef]
- Maciel, W.J.; Costa, R.D.D.; Cavichia, O. Radial abundance gradients from planetary nebulae at different distances from the galactic plane. Rev. Mex. Astron. AstrofíSica 2015, 51, 165. [Google Scholar]
- Stanghellini, L.; Haywood, M. The Galactic Structure and Chemical Evolution Traced by the Population of Planetary Nebulae. Astrophys. J. 2010, 714, 1096–1107. [Google Scholar] [CrossRef]
- Stanghellini, L.; Haywood, M. Galactic Planetary Nebulae as Probes of Radial Metallicity Gradients and Other Abundance Patterns. Astrophys. J. 2018, 862, 45. [Google Scholar] [CrossRef]
- Genovali, K.; Lemasle, B.; Bono, G.; Romaniello, M.; Fabrizio, M.; Ferraro, I.; Iannicola, G.; Laney, C.D.; Nonino, M.; Bergemann, M.; et al. On the fine structure of the Cepheid metallicity gradient in the Galactic thin disk. Astron. Astrophys. 2014, 566, A37. [Google Scholar] [CrossRef]
- Lemasle, B.; François, P.; Genovali, K.; Kovtyukh, V.V.; Bono, G.; Inno, L.; Laney, C.D.; Kaper, L.; Bergemann, M.; Fabrizio, M.; et al. Galactic abundance gradients from Cepheids. α and heavy elements in the outer disk. Astron. Astrophys. 2013, 558, A31. [Google Scholar] [CrossRef]
- Luck, R.E. Cepheid Abundances: Multiphase Results and Spatial Gradients. Astron. J. 2018, 156, 171. [Google Scholar] [CrossRef]
- Boeche, C.; Siebert, A.; Piffl, T.; Just, A.; Steinmetz, M.; Grebel, E.K.; Sharma, S.; Kordopatis, G.; Gilmore, G.; Chiappini, C.; et al. Chemical gradients in the Milky Way from the RAVE data. II. Giant stars. Astron. Astrophys. 2014, 568, A71. [Google Scholar] [CrossRef]
- Huang, Y.; Liu, X.W.; Zhang, H.W.; Yuan, H.B.; Xiang, M.S.; Chen, B.Q.; Ren, J.J.; Sun, N.C.; Wang, C.; Zhang, Y.; et al. On the metallicity gradients of the Galactic disk as revealed by LSS-GAC red clump stars. Res. Astron. Astrophys. 2015, 15, 1240. [Google Scholar] [CrossRef]
- Anders, F.; Chiappini, C.; Minchev, I.; Miglio, A.; Montalbán, J.; Mosser, B.; Rodrigues, T.S.; Santiago, B.X.; Baudin, F.; Beers, T.C.; et al. Red giants observed by CoRoT and APOGEE: The evolution of the Milky Way’s radial metallicity gradient. Astron. Astrophys. 2017, 600, A70. [Google Scholar] [CrossRef]
- Daflon, S.; Cunha, K. Galactic Metallicity Gradients Derived from a Sample of OB Stars. Astrophys. J. 2004, 617, 1115–1126. [Google Scholar] [CrossRef]
- Bragança, G.A.; Daflon, S.; Lanz, T.; Cunha, K.; Bensby, T.; McMillan, P.J.; Garmany, C.D.; Glaspey, J.W.; Borges Fernandes, M.; Oey, M.S.; et al. Radial abundance gradients in the outer Galactic disk as traced by main-sequence OB stars. Astron. Astrophys. 2019, 625, A120. [Google Scholar] [CrossRef]
- Janes, K.A. Evidence for an abundance gradient in the galactic disk. Astrophys. J. Suppl. 1979, 39, 135–156. [Google Scholar] [CrossRef]
- Bragaglia, A.; Sestito, P.; Villanova, S.; Carretta, E.; Randich, S.; Tosi, M. Old open clusters as key tracers of Galactic chemical evolution. II. Iron and elemental abundances in NGC 2324, NGC 2477 NGC 2660, NGC 3960, and Berkeley 32. Astron. Astrophys. 2008, 480, 79–90. [Google Scholar] [CrossRef]
- Sestito, P.; Bragaglia, A.; Randich, S.; Pallavicini, R.; Andrievsky, S.M.; Korotin, S.A. Open clusters as key tracers of Galactic chemical evolution. III. Element abundances in Berkeley 20, Berkeley 29, Collinder 261 and Melotte 66. Astron. Astrophys. 2008, 488, 943–958. [Google Scholar] [CrossRef]
- Friel, E.D.; Jacobson, H.R.; Pilachowski, C.A. Abundances of Red Giants in Old Open Clusters. V. Be 31, Be 32, Be 39, M 67, NGC 188, and NGC 1193. Astron. J. 2010, 139, 1942–1967. [Google Scholar] [CrossRef]
- Carrera, R.; Pancino, E. Chemical abundance analysis of the open clusters Berkeley 32, NGC 752, Hyades, and Praesepe. Astron. Astrophys. 2011, 535, A30. [Google Scholar] [CrossRef]
- Yong, D.; Carney, B.W.; Friel, E.D. Elemental Abundance Ratios in Stars of the Outer Galactic Disk. IV. A New Sample of Open Clusters. Astron. J. 2012, 144, 95. [Google Scholar] [CrossRef]
- Reddy, A.B.S.; Lambert, D.L.; Giridhar, S. The evolution of the Milky Way: New insights from open clusters. Mon. Not. R. Astron. Soc. 2016, 463, 4366–4382. [Google Scholar] [CrossRef]
- Jacobson, H.R.; Friel, E.D.; Jílková, L.; Magrini, L.; Bragaglia, A.; Vallenari, A.; Tosi, M.; Randich, S.; Donati, P.; Cantat-Gaudin, T.; et al. The Gaia-ESO Survey: Probes of the inner disk abundance gradient. Astron. Astrophys. 2016, 591, A37. [Google Scholar] [CrossRef]
- Casamiquela, L.; Blanco-Cuaresma, S.; Carrera, R.; Balaguer-Núñez, L.; Jordi, C.; Anders, F.; Chiappini, C.; Carbajo-Hijarrubia, J.; Aguado, D.S.; del Pino, A.; et al. OCCASO—III. Iron peak and α elements of 18 open clusters. Comparison with chemical evolution models and field stars. Mon. Not. R. Astron. Soc. 2019, 490, 1821–1842. [Google Scholar] [CrossRef]
- Donor, J.; Frinchaboy, P.M.; Cunha, K.; O’Connell, J.E.; Prieto, C.A.; Almeida, A.; Anders, F.; Beaton, R.; Bizyaev, D.; Brownstein, J.R.; et al. The Open Cluster Chemical Abundances and Mapping Survey. IV. Abundances for 128 Open Clusters Using SDSS/APOGEE DR16. Astron. J. 2020, 159, 199. [Google Scholar] [CrossRef]
- Netopil, M.; Oralhan, İ.A.; Çakmak, H.; Michel, R.; Karataş, Y. The Galactic metallicity gradient shown by open clusters in the light of radial migration. Mon. Not. R. Astron. Soc. 2021, 509, 421–439. [Google Scholar] [CrossRef]
- Carraro, G.; Ng, Y.K.; Portinari, L. On the Galactic disc age-metallicity relation. Mon. Not. R. Astron. Soc. 1998, 296, 1045–1056. [Google Scholar] [CrossRef]
- Friel, E.D.; Janes, K.A.; Tavarez, M.; Scott, J.; Katsanis, R.; Lotz, J.; Hong, L.; Miller, N. Metallicities of Old Open Clusters. Astron. J. 2002, 124, 2693–2720. [Google Scholar] [CrossRef]
- Cunha, K.; Frinchaboy, P.M.; Souto, D.; Thompson, B.; Zasowski, G.; Allende Prieto, C.; Carrera, R.; Chiappini, C.; Donor, J.; García-Hernández, D.A.; et al. Chemical abundance gradients from open clusters in the Milky Way disk: Results from the APOGEE survey. Astron. Nachr. 2016, 337, 922. [Google Scholar] [CrossRef]
- Spina, L.; Randich, S.; Palla, F.; Biazzo, K.; Sacco, G.G.; Alfaro, E.J.; Franciosini, E.; Magrini, L.; Morbidelli, L.; Frasca, A.; et al. The Gaia-ESO Survey: Metallicity of the Chamaeleon I star-forming region. Astron. Astrophys. 2014, 568, A2. [Google Scholar] [CrossRef]
- Quillen, A.C.; Nolting, E.; Minchev, I.; De Silva, G.; Chiappini, C. Migration in the shearing sheet and estimates for young open cluster migration. Mon. Not. R. Astron. Soc. 2018, 475, 4450–4466. [Google Scholar] [CrossRef]
- Chen, Y.Q.; Zhao, G. Open clusters as tracers on radial migration of the galactic disc. Mon. Not. R. Astron. Soc. 2020, 495, 2673–2681. [Google Scholar] [CrossRef]
- Gaia Collaboration; Prusti, T.; de Bruijne, J.H.J.; Brown, A.G.A.; Vallenari, A.; Babusiaux, C.; Bailer-Jones, C.A.L.; Bastian, U.; Biermann, M.; Evans, D.W.; et al. The Gaia mission. Astron. Astrophys. 2016, 595, A1. [Google Scholar] [CrossRef]
- Lindegren, L.; Lammers, U.; Bastian, U.; Hernández, J.; Klioner, S.; Hobbs, D.; Bombrun, A.; Michalik, D.; Ramos-Lerate, M.; Butkevich, A.; et al. Gaia Data Release 1. Astrometry: One billion positions, two million proper motions and parallaxes. Astron. Astrophys. 2016, 595, A4. [Google Scholar] [CrossRef]
- Gaia Collaboration; Brown, A.G.A.; Vallenari, A.; Prusti, T.; de Bruijne, J.H.J.; Babusiaux, C.; Bailer-Jones, C.A.L.; Biermann, M.; Evans, D.W.; Eyer, L.; et al. Gaia Data Release 2. Summary of the contents and survey properties. Astron. Astrophys. 2018, 616, A1. [Google Scholar] [CrossRef]
- Gaia Collaboration; Brown, A.G.A.; Vallenari, A.; Prusti, T.; de Bruijne, J.H.J.; Babusiaux, C.; Biermann, M.; Creevey, O.L.; Evans, D.W.; Eyer, L.; et al. Gaia Early Data Release 3. Summary of the contents and survey properties. Astron. Astrophys. 2021, 649, A1. [Google Scholar] [CrossRef]
- Gilmore, G.; Randich, S.; Asplund, M.; Binney, J.; Bonifacio, P.; Drew, J.; Feltzing, S.; Ferguson, A.; Jeffries, R.; Micela, G.; et al. The Gaia-ESO Public Spectroscopic Survey. Messenger 2012, 147, 25–31. [Google Scholar]
- Majewski, S.R.; Schiavon, R.P.; Frinchaboy, P.M.; Allende Prieto, C.; Barkhouser, R.; Bizyaev, D.; Blank, B.; Brunner, S.; Burton, A.; Carrera, R.; et al. The Apache Point Observatory Galactic Evolution Experiment (APOGEE). Astron. J. 2017, 154, 94. [Google Scholar] [CrossRef]
- Buder, S.; Asplund, M.; Duong, L.; Kos, J.; Lind, K.; Ness, M.K.; Sharma, S.; Bland-Hawthorn, J.; Casey, A.R.; de Silva, G.M.; et al. The GALAH Survey: Second data release. Mon. Not. R. Astron. Soc. 2018, 478, 4513–4552. [Google Scholar] [CrossRef]
- Cantat-Gaudin, T.; Anders, F.; Castro-Ginard, A.; Jordi, C.; Romero-Gómez, M.; Soubiran, C.; Casamiquela, L.; Tarricq, Y.; Moitinho, A.; Vallenari, A.; et al. Painting a portrait of the Galactic disc with its stellar clusters. Astron. Astrophys. 2020, 640, A1. [Google Scholar] [CrossRef]
- Wilson, J.C.; Hearty, F.R.; Skrutskie, M.F.; Majewski, S.R.; Holtzman, J.A.; Eisenstein, D.; Gunn, J.; Blank, B.; Henderson, C.; Smee, S.; et al. The Apache Point Observatory Galactic Evolution Experiment (APOGEE) Spectrographs. Publ. Astron. Soc. Pac. 2019, 131, 055001. [Google Scholar] [CrossRef]
- Beaton, R.L.; Oelkers, R.J.; Hayes, C.R.; Covey, K.R.; Chojnowski, S.D.; De Lee, N.; Sobeck, J.S.; Majewski, S.R.; Cohen, R.; Fernandez-Trincado, J.; et al. Final Targeting Strategy for the SDSS-IV APOGEE-2N Survey. arXiv 2021, arXiv:2108.11907. [Google Scholar]
- Frinchaboy, P.M.; Thompson, B.; Jackson, K.M.; O’Connell, J.; Meyer, B.; Zasowski, G.; Majewski, S.R.; Chojnowksi, S.D.; Johnson, J.A.; Allende Prieto, C.; et al. The Open Cluster Chemical Analysis and Mapping Survey: Local Galactic Metallicity Gradient with APOGEE Using SDSS DR10. Astrophys. J. Lett. 2013, 777, L1. [Google Scholar] [CrossRef]
- Donor, J.; Frinchaboy, P.M.; Cunha, K.; Thompson, B.; O’Connell, J.; Zasowski, G.; Jackson, K.M.; Meyer McGrath, B.; Almeida, A.; Bizyaev, D.; et al. The Open Cluster Chemical Abundances and Mapping Survey. II. Precision Cluster Abundances for APOGEE Using SDSS DR14. Astron. J. 2018, 156, 142. [Google Scholar] [CrossRef]
- Souto, D.; Cunha, K.; Smith, V.V.; Allende Prieto, C.; García-Hernández, D.A.; Pinsonneault, M.; Holzer, P.; Frinchaboy, P.; Holtzman, J.; Johnson, J.A.; et al. Chemical Abundances of Main-sequence, Turnoff, Subgiant, and Red Giant Stars from APOGEE Spectra. I. Signatures of Diffusion in the Open Cluster M67. Astrophys. J. 2018, 857, 14. [Google Scholar] [CrossRef]
- Poovelil, V.J.; Zasowski, G.; Hasselquist, S.; Seth, A.; Donor, J.; Beaton, R.L.; Cunha, K.; Frinchaboy, P.M.; García-Hernández, D.A.; Hawkins, K.; et al. Open Cluster Chemical Homogeneity throughout the Milky Way. Astrophys. J. 2020, 903, 55. [Google Scholar] [CrossRef]
- Price-Jones, N.; Bovy, J.; Webb, J.J.; Allende Prieto, C.; Beaton, R.; Brownstein, J.R.; Cohen, R.E.; Cunha, K.; Donor, J.; Frinchaboy, P.M.; et al. Strong chemical tagging with APOGEE: 21 candidate star clusters that have dissolved across the Milky Way disc. Mon. Not. R. Astron. Soc. 2020, 496, 5101–5115. [Google Scholar] [CrossRef]
- Souto, D.; Cunha, K.; Smith, V.V. A Metallicity Study of F, G, K, and M Dwarfs in the Coma Berenices Open Cluster from the APOGEE Survey. Astrophys. J. 2021, 917, 11. [Google Scholar] [CrossRef]
- Souto, D.; Cunha, K.; Smith, V.; Allende Prieto, C.; Pinsonneault, M.; Zamora, O.; García-Hernández, D.A.; Mészáros, S.; Bovy, J.; García Pérez, A.E.; et al. Chemical Abundances in a Sample of Red Giants in the Open Cluster NGC 2420 from APOGEE. Astrophys. J. 2016, 830, 35. [Google Scholar] [CrossRef]
- Cunha, K.; Smith, V.V.; Johnson, J.A.; Bergemann, M.; Mészáros, S.; Shetrone, M.D.; Souto, D.; Allende Prieto, C.; Schiavon, R.P.; Frinchaboy, P.; et al. Sodium and Oxygen Abundances in the Open Cluster NGC 6791 from APOGEE H-band Spectroscopy. Astrophys. J. Lett. 2015, 798, L41. [Google Scholar] [CrossRef]
- Pasquini, L.; Avila, G.; Blecha, A.; Cacciari, C.; Cayatte, V.; Colless, M.; Damiani, F.; de Propris, R.; Dekker, H.; di Marcantonio, P.; et al. Installation and commissioning of FLAMES, the VLT Multifibre Facility. Messenger 2002, 110, 1–9. [Google Scholar]
- Randich, S.; Gilmore, G.; Gaia-ESO Consortium. The Gaia-ESO Large Public Spectroscopic Survey. Messenger 2013, 154, 47–49. [Google Scholar]
- Bertelli Motta, C.; Pasquali, A.; Richer, J.; Michaud, G.; Salaris, M.; Bragaglia, A.; Magrini, L.; Randich, S.; Grebel, E.K.; Adibekyan, V.; et al. The Gaia-ESO Survey: Evidence of atomic diffusion in M67? Mon. Not. R. Astron. Soc. 2018, 478, 425–438. [Google Scholar] [CrossRef]
- Magrini, L.; Spina, L.; Randich, S.; Friel, E.; Kordopatis, G.; Worley, C.; Pancino, E.; Bragaglia, A.; Donati, P.; Tautvaišienė, G.; et al. The Gaia-ESO Survey: The origin and evolution of s-process elements. Astron. Astrophys. 2018, 617, A106. [Google Scholar] [CrossRef]
- Magrini, L.; Vincenzo, F.; Randich, S.; Pancino, E.; Casali, G.; Tautvaišienė, G.; Drazdauskas, A.; Mikolaitis, Š.; Minkevičiūtė, R.; Stonkutė, E.; et al. The Gaia-ESO Survey: The N/O abundance ratio in the Milky Way. Astron. Astrophys. 2018, 618, A102. [Google Scholar] [CrossRef]
- Magrini, L.; Lagarde, N.; Charbonnel, C.; Franciosini, E.; Randich, S.; Smiljanic, R.; Casali, G.; Viscasillas Vazquez, C.; Spina, L.; Biazzo, K.; et al. The Gaia-ESO survey: Mixing processes in low-mass stars traced by lithium abundance in cluster and field stars. arXiv 2021, arXiv:2105.04866. [Google Scholar] [CrossRef]
- Prisinzano, L.; Damiani, F.; Kalari, V.; Jeffries, R.; Bonito, R.; Micela, G.; Wright, N.J.; Jackson, R.J.; Tognelli, E.; Guarcello, M.G.; et al. The Gaia-ESO Survey: Age spread in the star forming region NGC 6530 from the HR diagram and gravity indicators. Astron. Astrophys. 2019, 623, A159. [Google Scholar] [CrossRef]
- Hatzidimitriou, D.; Held, E.V.; Tognelli, E.; Bragaglia, A.; Magrini, L.; Bravi, L.; Gazeas, K.; Dapergolas, A.; Drazdauskas, A.; Delgado-Mena, E.; et al. The Gaia-ESO Survey: The inner disc, intermediate-age open cluster Pismis 18. Astron. Astrophys. 2019, 626, A90. [Google Scholar] [CrossRef]
- Casali, G.; Magrini, L.; Tognelli, E.; Jackson, R.; Jeffries, R.D.; Lagarde, N.; Tautvaišienė, G.; Masseron, T.; Degl’Innocenti, S.; Prada Moroni, P.G.; et al. The Gaia-ESO survey: Calibrating a relationship between age and the [C/N] abundance ratio with open clusters. Astron. Astrophys. 2019, 629, A62. [Google Scholar] [CrossRef]
- Casali, G.; Magrini, L.; Frasca, A.; Bragaglia, A.; Catanzaro, G.; D’Orazi, V.; Sordo, R.; Carretta, E.; Origlia, L.; Andreuzzi, G.; et al. Stellar Population Astrophysics (SPA) with TNG. The old open clusters Collinder 350, Gulliver 51, NGC 7044, and Ruprecht 171. Astron. Astrophys. 2020, 643, A12. [Google Scholar] [CrossRef]
- Baratella, M.; D’Orazi, V.; Carraro, G.; Desidera, S.; Randich, S.; Magrini, L.; Adibekyan, V.; Smiljanic, R.; Spina, L.; Tsantaki, M.; et al. The Gaia-ESO Survey: A new approach to chemically characterising young open clusters. I. Stellar parameters, and iron-peak, α-, and proton-capture elements. Astron. Astrophys. 2020, 634, A34. [Google Scholar] [CrossRef]
- Randich, S.; Pasquini, L.; Franciosini, E.; Magrini, L.; Jackson, R.J.; Jeffries, R.D.; d’Orazi, V.; Romano, D.; Sanna, N.; Tautvaišienė, G.; et al. The Gaia-ESO Survey: Galactic evolution of lithium at high metallicity. Astron. Astrophys. 2020, 640, L1. [Google Scholar] [CrossRef]
- Jackson, R.J.; Jeffries, R.D.; Wright, N.J.; Randich, S.; Sacco, G.; Pancino, E.; Cantat-Gaudin, T.; Gilmore, G.; Vallenari, A.; Bensby, T.; et al. The Gaia-ESO Survey: Membership probabilities for stars in 32 open clusters from 3D kinematics. Mon. Not. R. Astron. Soc. 2020, 496, 4701–4716. [Google Scholar] [CrossRef]
- Bonito, R.; Prisinzano, L.; Venuti, L.; Damiani, F.; Micela, G.; Sacco, G.; Traven, G.; Biazzo, K.; Sbordone, L.; Masseron, T.; et al. The Gaia-ESO Survey: A new diagnostic for accretion and outflow activity in the young cluster NGC 2264. Astron. Astrophys. 2020, 642, A56. [Google Scholar] [CrossRef]
- Gutiérrez Albarrán, M.L.; Montes, D.; Gómez Garrido, M.; Tabernero, H.M.; González Hernández, J.I.; Marfil, E.; Frasca, A.; Lanzafame, A.C.; Klutsch, A.; Franciosini, E.; et al. The Gaia-ESO Survey: Calibrating the lithium-age relation with open clusters and associations. I. Cluster age range and initial membership selections. Astron. Astrophys. 2020, 643, A71. [Google Scholar] [CrossRef]
- Semenova, E.; Bergemann, M.; Deal, M.; Serenelli, A.; Hansen, C.J.; Gallagher, A.J.; Bayo, A.; Bensby, T.; Bragaglia, A.; Carraro, G.; et al. The Gaia-ESO survey: 3D NLTE abundances in the open cluster NGC 2420 suggest atomic diffusion and turbulent mixing are at the origin of chemical abundance variations. Astron. Astrophys. 2020, 643, A164. [Google Scholar] [CrossRef]
- Binks, A.S.; Jeffries, R.D.; Jackson, R.J.; Franciosini, E.; Sacco, G.G.; Bayo, A.; Magrini, L.; Randich, S.; Arancibia-Silva, J.; Bergemann, M.; et al. The Gaia-ESO survey: A lithium depletion boundary age for NGC 2232. Mon. Not. R. Astron. Soc. 2021, 505, 1280–1292. [Google Scholar] [CrossRef]
- Spina, L.; Randich, S.; Magrini, L.; Jeffries, R.D.; Friel, E.D.; Sacco, G.G.; Pancino, E.; Bonito, R.; Bravi, L.; Franciosini, E.; et al. The Gaia-ESO Survey: The present-day radial metallicity distribution of the Galactic disc probed by pre-main-sequence clusters. Astron. Astrophys. 2017, 601, A70. [Google Scholar] [CrossRef]
- De Silva, G.M.; Freeman, K.C.; Bland-Hawthorn, J.; Martell, S.; de Boer, E.W.; Asplund, M.; Keller, S.; Sharma, S.; Zucker, D.B.; Zwitter, T.; et al. The GALAH survey: Scientific motivation. Mon. Not. R. Astron. Soc. 2015, 449, 2604–2617. [Google Scholar] [CrossRef]
- Martell, S.L.; Sharma, S.; Buder, S.; Duong, L.; Schlesinger, K.J.; Simpson, J.; Lind, K.; Ness, M.; Marshall, J.P.; Asplund, M.; et al. The GALAH survey: Observational overview and Gaia DR1 companion. Mon. Not. R. Astron. Soc. 2017, 465, 3203–3219. [Google Scholar] [CrossRef]
- Buder, S.; Sharma, S.; Kos, J.; Amarsi, A.M.; Nordlander, T.; Lind, K.; Martell, S.L.; Asplund, M.; Bland-Hawthorn, J.; Casey, A.R.; et al. The GALAH+ survey: Third data release. Mon. Not. R. Astron. Soc. 2021, 506, 150–201. [Google Scholar] [CrossRef]
- Stello, D.; Zinn, J.; Elsworth, Y.; Garcia, R.A.; Kallinger, T.; Mathur, S.; Mosser, B.; Sharma, S.; Chaplin, W.J.; Davies, G.; et al. The K2 Galactic Archaeology Program Data Release. I. Asteroseismic Results from Campaign 1. Astrophys. J. 2017, 835, 83. [Google Scholar] [CrossRef]
- Sharma, S.; Stello, D.; Buder, S.; Kos, J.; Bland-Hawthorn, J.; Asplund, M.; Duong, L.; Lin, J.; Lind, K.; Ness, M.; et al. The TESS-HERMES survey data release 1: High-resolution spectroscopy of the TESS southern continuous viewing zone. Mon. Not. R. Astron. Soc. 2018, 473, 2004–2019. [Google Scholar] [CrossRef]
- Spina, L.; Ting, Y.S.; De Silva, G.M.; Frankel, N.; Sharma, S.; Cantat-Gaudin, T.; Joyce, M.; Stello, D.; Karakas, A.I.; Asplund, M.B.; et al. The GALAH survey: Tracing the Galactic disc with open clusters. Mon. Not. R. Astron. Soc. 2021, 503, 3279–3296. [Google Scholar] [CrossRef]
- Casamiquela, L.; Carrera, R.; Jordi, C.; Balaguer-Núñez, L.; Pancino, E.; Hidalgo, S.L.; Martínez-Vázquez, C.E.; Murabito, S.; del Pino, A.; Aparicio, A.; et al. The OCCASO survey: Presentation and radial velocities of 12 Milky Way open clusters. Mon. Not. R. Astron. Soc. 2016, 458, 3150–3167. [Google Scholar] [CrossRef]
- Casamiquela, L.; Carrera, R.; Blanco-Cuaresma, S.; Jordi, C.; Balaguer-Núñez, L.; Pancino, E.; Anders, F.; Chiappini, C.; Díaz-Pérez, L.; Aguado, D.S.; et al. OCCASO—II. Physical parameters and Fe abundances of red clump stars in 18 open clusters. Mon. Not. R. Astron. Soc. 2017, 470, 4363–4381. [Google Scholar] [CrossRef]
- Casamiquela, L.; Carrera, R.; Balaguer-Núñez, L.; Jordi, C.; Chiappini, C.; Anders, F.; Antoja, T.; Miret-Roig, N.; Romero-Gomez, M.; Blanco-Cuaresma, S.; et al. NGC 6705 a young α-enhanced open cluster from OCCASO data. Astron. Astrophys. 2018, 610, A66. [Google Scholar] [CrossRef]
- Origlia, L.; Dalessandro, E.; Sanna, N.; Mucciarelli, A.; Oliva, E.; Cescutti, G.; Rainer, M.; Bragaglia, A.; Bono, G. Stellar population astrophysics (SPA) with the TNG. GIANO-B spectroscopy of red supergiants in Alicante 7 and Alicante 10. Astron. Astrophys. 2019, 629, A117. [Google Scholar] [CrossRef]
- Frasca, A.; Alonso-Santiago, J.; Catanzaro, G.; Bragaglia, A.; Carretta, E.; Casali, G.; D’Orazi, V.; Magrini, L.; Andreuzzi, G.; Oliva, E.; et al. Stellar population astrophysics (SPA) with the TNG. Characterization of the young open cluster <ASTROBJ>ASCC 123</ASTROBJ>. Astron. Astrophys. 2019, 632, A16. [Google Scholar] [CrossRef]
- D’Orazi, V.; Oliva, E.; Bragaglia, A.; Frasca, A.; Sanna, N.; Biazzo, K.; Casali, G.; Desidera, S.; Lucatello, S.; Magrini, L.; et al. Stellar population astrophysics (SPA) with the TNG. Revisiting the metallicity of Praesepe (M 44). Astron. Astrophys. 2020, 633, A38. [Google Scholar] [CrossRef]
- Zhang, R.; Lucatello, S.; Bragaglia, A.; Carrera, R.; Spina, L.; Alonso-Santiago, J.; Andreuzzi, G.; Casali, G.; Carretta, E.; Frasca, A.; et al. Stellar Population Astrophysics (SPA) with TNG. Atmospheric parameters of members of 16 unstudied open clusters. Astron. Astrophys. 2021, 654, A77. [Google Scholar] [CrossRef]
- Liu, L.; Pang, X. A Catalog of Newly Identified Star Clusters in Gaia DR2. Astrophys. J. Suppl. Ser. 2019, 245, 32. [Google Scholar] [CrossRef]
- Huber, P.J. Robust Estimation of a Location Parameter. Ann. Math. Stat. 1964, 35, 73–101. [Google Scholar] [CrossRef]
- Kharchenko, N.V.; Piskunov, A.E.; Schilbach, E.; Röser, S.; Scholz, R.D. Global survey of star clusters in the Milky Way. II. The catalogue of basic parameters. Astron. Astrophys. 2013, 558, A53. [Google Scholar] [CrossRef]
- Soubiran, C.; Cantat-Gaudin, T.; Romero-Gómez, M.; Casamiquela, L.; Jordi, C.; Vallenari, A.; Antoja, T.; Balaguer-Núñez, L.; Bossini, D.; Bragaglia, A.; et al. Open cluster kinematics with Gaia DR2. Astron. Astrophys. 2018, 619, A155. [Google Scholar] [CrossRef]
- Spina, L.; Nordlander, T.; Casey, A.R.; Bedell, M.; D’Orazi, V.; Meléndez, J.; Karakas, A.I.; Desidera, S.; Baratella, M.; Yana Galarza, J.J.; et al. How Magnetic Activity Alters What We Learn from Stellar Spectra. Astrophys. J. 2020, 895, 52. [Google Scholar] [CrossRef]
- Astraatmadja, T.L.; Bailer-Jones, C.A.L. Estimating Distances from Parallaxes. II. Performance of Bayesian Distance Estimators on a Gaia-like Catalogue. Astrophys. J. 2016, 832, 137. [Google Scholar] [CrossRef]
- Bovy, J. galpy: A python Library for Galactic Dynamics. Astrophys. J. Suppl. Ser. 2015, 216, 29. [Google Scholar] [CrossRef]
- Twarog, B.A.; Ashman, K.M.; Anthony-Twarog, B.J. Some Revised Observational Constraints on the Formation and Evolution of the Galactic Disk. Astron. J. 1997, 114, 2556. [Google Scholar] [CrossRef]
- Netopil, M.; Paunzen, E.; Heiter, U.; Soubiran, C. On the metallicity of open clusters. III. Homogenised sample. Astron. Astrophys. 2016, 585, A150. [Google Scholar] [CrossRef]
- Hoffman, M.D.; Gelman, A. The No-U-Turn Sampler: Adaptively Setting Path Lengths in Hamiltonian Monte Carlo. arXiv 2011, arXiv:stat.CO/1111.4246. [Google Scholar]
- Salvatier, J.; Wieckiâ, T.V.; Fonnesbeck, C. Astrophysics Source Code Library. Available online: http://www.informationweek.com/news/201202317 (accessed on 5 December 2021).
- Carrera, R.; Bragaglia, A.; Cantat-Gaudin, T.; Vallenari, A.; Balaguer-Núñez, L.; Bossini, D.; Casamiquela, L.; Jordi, C.; Sordo, R.; Soubiran, C. Open clusters in APOGEE and GALAH. Combining Gaia and ground-based spectroscopic surveys. Astron. Astrophys. 2019, 623, A80. [Google Scholar] [CrossRef]
- Trick, W.H.; Coronado, J.; Rix, H.W. The Galactic disc in action space as seen by Gaia DR2. Mon. Not. R. Astron. Soc. 2019, 484, 3291–3306. [Google Scholar] [CrossRef]
- Wheeler, A.; Abril-Cabezas, I.; Trick, W.H.; Fragkoudi, F.; Ness, M. Chemodynamical signatures of bar resonances in the Galactic disk: Current data and future prospects. arXiv 2021, arXiv:2105.05263. [Google Scholar]
- Casagrande, L.; Schönrich, R.; Asplund, M.; Cassisi, S.; Ramírez, I.; Meléndez, J.; Bensby, T.; Feltzing, S. New constraints on the chemical evolution of the solar neighbourhood and Galactic disc(s). Improved astrophysical parameters for the Geneva-Copenhagen Survey. Astron. Astrophys. 2011, 530, A138. [Google Scholar] [CrossRef]
- Minchev, I.; Anders, F.; Recio-Blanco, A.; Chiappini, C.; de Laverny, P.; Queiroz, A.; Steinmetz, M.; Adibekyan, V.; Carrillo, I.; Cescutti, G.; et al. Estimating stellar birth radii and the time evolution of Milky Way’s ISM metallicity gradient. Mon. Not. R. Astron. Soc. 2018, 481, 1645–1657. [Google Scholar] [CrossRef]
- Cunha, K.; Sellgren, K.; Smith, V.V.; Ramirez, S.V.; Blum, R.D.; Terndrup, D.M. Chemical Abundances of Luminous Cool Stars in the Galactic Center from High-Resolution Infrared Spectroscopy. Astrophys. J. 2007, 669, 1011–1023. [Google Scholar] [CrossRef]
- Davies, B.; Origlia, L.; Kudritzki, R.P.; Figer, D.F.; Rich, R.M.; Najarro, F.; Negueruela, I.; Clark, J.S. Chemical Abundance Patterns in the Inner Galaxy: The Scutum Red Supergiant Clusters. Astrophys. J. 2009, 696, 2014–2025. [Google Scholar] [CrossRef]
- Tarricq, Y.; Soubiran, C.; Casamiquela, L.; Cantat-Gaudin, T.; Chemin, L.; Anders, F.; Antoja, T.; Romero-Gómez, M.; Figueras, F.; Jordi, C.; et al. 3D kinematics and age distribution of the open cluster population. Astron. Astrophys. 2021, 647, A19. [Google Scholar] [CrossRef]
- Lépine, J.R.D.; Cruz, P.; Scarano, S.J.; Barros, D.A.; Dias, W.S.; Pompéia, L.; Andrievsky, S.M.; Carraro, G.; Famaey, B. Overlapping abundance gradients and azimuthal gradients related to the spiral structure of the Galaxy. Mon. Not. R. Astron. Soc. 2011, 417, 698–708. [Google Scholar] [CrossRef]
- Trick, W.H.; Fragkoudi, F.; Hunt, J.A.S.; Mackereth, J.T.; White, S.D.M. Identifying resonances of the Galactic bar in Gaia DR2: I. Clues from action space. Mon. Not. R. Astron. Soc. 2021, 500, 2645–2665. [Google Scholar] [CrossRef]
- Nakanishi, H.; Sofue, Y. Three-Dimensional Distribution of the ISM in the Milky Way Galaxy: I. The H I Disk. Publ. Astron. Soc. Jpn. 2003, 55, 191–202. [Google Scholar] [CrossRef]
- Levine, E.S.; Blitz, L.; Heiles, C. The Vertical Structure of the Outer Milky Way H I Disk. Astrophys. J. 2006, 643, 881–896. [Google Scholar] [CrossRef]
- Koo, B.C.; Park, G.; Kim, W.T.; Lee, M.G.; Balser, D.S.; Wenger, T.V. Tracing the Spiral Structure of the Outer Milky Way with Dense Atomic Hydrogen Gas. Publ. Astron. Soc. Pac. 2017, 129, 094102. [Google Scholar] [CrossRef]
- Cersosimo, J.C.; Mader, S.; Figueroa, N.S.; Vélez, S.F.; Soto, C.L.; Azcárate, D. Warped Ionized Hydrogen in the Galaxy. Astrophys. J. 2009, 699, 469–477. [Google Scholar] [CrossRef][Green Version]
- May, J.; Alvarez, H.; Bronfman, L. Physical properties of molecular clouds in the southern outer Galaxy. Astron. Astrophys. 1997, 327, 325–332. [Google Scholar]
- Nakagawa, M.; Onishi, T.; Mizuno, A.; Fukui, Y. An Unbiased Search for Molecular Clouds in the Southern Galactic Warp. Publ. Astron. Soc. Jpn. 2005, 57, 917–931. [Google Scholar] [CrossRef]
- Xu, Y.; Hou, L.G.; Wu, Y.W. The spiral structure of the Milky Way. Res. Astron. Astrophys. 2018, 18, 146. [Google Scholar] [CrossRef]
- Hammersley, P.L.; López-Corredoira, M. Modelling star counts in the Monoceros stream and the Galactic anti-centre. Astron. Astrophys. 2011, 527, A6. [Google Scholar] [CrossRef]
- Poggio, E.; Drimmel, R.; Smart, R.L.; Spagna, A.; Lattanzi, M.G. The kinematic signature of the Galactic warp in Gaia DR1. I. The Hipparcos subsample. Astron. Astrophys. 2017, 601, A115. [Google Scholar] [CrossRef][Green Version]
- Li, C.; Zhao, G.; Jia, Y.; Liao, S.; Yang, C.; Wang, Q. Flare and Warp of Galactic Disk with OB Stars from Gaia DR2. Astrophys. J. 2019, 871, 208. [Google Scholar] [CrossRef]
- Chrobáková, Ž.; Nagy, R.; López-Corredoira, M. Structure of the outer Galactic disc with Gaia DR2. Astron. Astrophys. 2020, 637, A96. [Google Scholar] [CrossRef]
- Feast, M.W.; Menzies, J.W.; Matsunaga, N.; Whitelock, P.A. Cepheid variables in the flared outer disk of our galaxy. Nature 2014, 509, 342–344. [Google Scholar] [CrossRef] [PubMed]
- Chen, X.; Wang, S.; Deng, L.; de Grijs, R.; Liu, C.; Tian, H. An intuitive 3D map of the Galactic warp’s precession traced by classical Cepheids. Nat. Astron. 2019, 3, 320–325. [Google Scholar] [CrossRef]
- Skowron, D.M.; Skowron, J.; Mróz, P.; Udalski, A.; Pietrukowicz, P.; Soszyński, I.; Szymański, M.K.; Poleski, R.; Kozłowski, S.; Ulaczyk, K.; et al. A three-dimensional map of the Milky Way using classical Cepheid variable stars. Science 2019, 365, 478–482. [Google Scholar] [CrossRef]
- Carraro, G.; Seleznev, A.F.; Baume, G.; Turner, D.G. The complex stellar populations in the background of open clusters in the third Galactic quadrant. Mon. Not. R. Astron. Soc. 2016, 455, 4031–4045. [Google Scholar] [CrossRef][Green Version]
- Amôres, E.B.; Robin, A.C.; Reylé, C. Evolution over time of the Milky Way’s disc shape. Astron. Astrophys. 2017, 602, A67. [Google Scholar] [CrossRef]
- López-Corredoira, M.; Momany, Y.; Zaggia, S.; Cabrera-Lavers, A. Re-affirming the connection between the Galactic stellar warp and the Canis Major over-density. Astron. Astrophys. 2007, 472, L47–L50. [Google Scholar] [CrossRef][Green Version]
- Mitschang, A.W.; De Silva, G.; Sharma, S.; Zucker, D.B. Quantifying chemical tagging: Towards robust group finding in the Galaxy. Mon. Not. R. Astron. Soc. 2013, 428, 2321–2332. [Google Scholar] [CrossRef]
- Blanco-Cuaresma, S.; Fraix-Burnet, D. A phylogenetic approach to chemical tagging. Reassembling open cluster stars. Astron. Astrophys. 2018, 618, A65. [Google Scholar] [CrossRef]
- Bragaglia, A.; Gratton, R.G.; Carretta, E.; D’Orazi, V.; Sneden, C.; Lucatello, S. Searching for multiple stellar populations in the massive, old open cluster Berkeley 39. Astron. Astrophys. 2012, 548, A122. [Google Scholar] [CrossRef][Green Version]
- Carraro, G.; de Silva, G.; Monaco, L.; Milone, A.P.; Mateluna, R. Updated properties of the old open cluster Melotte 66: Searching for multiple stellar populations. Astron. Astrophys. 2014, 566, A39. [Google Scholar] [CrossRef][Green Version]
- Geisler, D.; Villanova, S.; Carraro, G.; Pilachowski, C.; Cummings, J.; Johnson, C.I.; Bresolin, F. The Unique Na:O Abundance Distribution in NGC 6791: The First Open(?) Cluster with Multiple Populations. Astrophys. J. Lett. 2012, 756, L40. [Google Scholar] [CrossRef][Green Version]
- Bragaglia, A.; Sneden, C.; Carretta, E.; Gratton, R.G.; Lucatello, S.; Bernath, P.F.; Brooke, J.S.A.; Ram, R.S. Searching for Chemical Signatures of Multiple Stellar Populations in the Old, Massive Open Cluster NGC 6791. Astrophys. J. 2014, 796, 68. [Google Scholar] [CrossRef]
- Villanova, S.; Carraro, G.; Geisler, D.; Monaco, L.; Assmann, P. NGC 6791: A Probable Bulge Cluster without Multiple Populations. Astrophys. J. 2018, 867, 34. [Google Scholar] [CrossRef]
- Spina, L.; Palla, F.; Randich, S.; Sacco, G.; Jeffries, R.; Magrini, L.; Franciosini, E.; Meyer, M.R.; Tautvaišienė, G.; Gilmore, G.; et al. The Gaia-ESO Survey: Chemical signatures of rocky accretion in a young solar-type star. Astron. Astrophys. 2015, 582, L6. [Google Scholar] [CrossRef]
- Spina, L.; Meléndez, J.; Casey, A.R.; Karakas, A.I.; Tucci-Maia, M. Chemical Inhomogeneities in the Pleiades: Signatures of Rocky-forming Material in Stellar Atmospheres. Astrophys. J. 2018, 863, 179. [Google Scholar] [CrossRef]
- Spina, L.; Sharma, P.; Meléndez, J.; Bedell, M.; Casey, A.R.; Carlos, M.; Franciosini, E.; Vallenari, A. Chemical evidence for planetary ingestion in a quarter of Sun-like stars. Nat. Astron. 2021, 5, 1163–1169. [Google Scholar] [CrossRef]
- James, D.J.; Melo, C.; Santos, N.C.; Bouvier, J. Fundamental properties of pre-main sequence stars in young, southern star forming regions: Metallicities. Astron. Astrophys. 2006, 446, 971–983. [Google Scholar] [CrossRef]
- D’Orazi, V.; Randich, S. Chemical composition of the young open clusters IC 2602 and IC 2391. Astron. Astrophys. 2009, 501, 553–562. [Google Scholar] [CrossRef]
- D’Orazi, V.; Biazzo, K.; Randich, S. Chemical composition of the Taurus-Auriga association. Astron. Astrophys. 2011, 526, A103. [Google Scholar] [CrossRef]
- Biazzo, K.; Randich, S.; Palla, F. Chemical pattern across the young associations ONC and OB1b. Astron. Astrophys. 2011, 525, A35. [Google Scholar] [CrossRef]
- Biazzo, K.; Randich, S.; Palla, F.; Briceño, C. Elemental abundances of low-mass stars in the young clusters 25 Orionis and λ Orionis. Astron. Astrophys. 2011, 530, A19. [Google Scholar] [CrossRef]
- Lorenzo-Oliveira, D.; Freitas, F.C.; Meléndez, J.; Bedell, M.; Ramírez, I.; Bean, J.L.; Asplund, M.; Spina, L.; Dreizler, S.; Alves-Brito, A.; et al. The Solar Twin Planet Search. The age-chromospheric activity relation. Astron. Astrophys. 2018, 619, A73. [Google Scholar] [CrossRef]
- Yana Galarza, J.; Meléndez, J.; Lorenzo-Oliveira, D.; Valio, A.; Reggiani, H.; Carlos, M.; Ponte, G.; Spina, L.; Haywood, R.D.; Gandolfi, D. The effect of stellar activity on the spectroscopic stellar parameters of the young solar twin HIP 36515. Mon. Not. R. Astron. Soc. 2019, 490, L86–L90. [Google Scholar] [CrossRef]
- Anders, F.; Cantat-Gaudin, T.; Quadrino-Lodoso, I.; Gieles, M.; Jordi, C.; Castro-Ginard, A.; Balaguer-Núñez, L. The star cluster age function in the Galactic disc with Gaia DR2. Fewer old clusters and a low cluster formation efficiency. Astron. Astrophys. 2021, 645, L2. [Google Scholar] [CrossRef]
- Bessell, M.S.; Castelli, F.; Plez, B. Model atmospheres broad-band colors, bolometric corrections and temperature calibrations for O—M stars. Astron. Astrophys. 1998, 333, 231–250. [Google Scholar]
- Short, C.I.; Hauschildt, P.H. Atmospheric Models of Red Giants with Massive-Scale Non-Local Thermodynamic Equilibrium. Astrophys. J. 2003, 596, 501–508. [Google Scholar] [CrossRef][Green Version]
- Friel, E.D.; Jacobson, H.R.; Barrett, E.; Fullton, L.; Balachandran, S.C.; Pilachowski, C.A. Abundances of Red Giants in the Old Open Cluster Collinder 261. Astron. J. 2003, 126, 2372–2384. [Google Scholar] [CrossRef]
- Korn, A.J.; Grundahl, F.; Richard, O.; Mashonkina, L.; Barklem, P.S.; Collet, R.; Gustafsson, B.; Piskunov, N. Atomic Diffusion and Mixing in Old Stars. I. Very Large Telescope FLAMES-UVES Observations of Stars in NGC 6397. Astrophys. J. 2007, 671, 402–419. [Google Scholar] [CrossRef]
- Lind, K.; Korn, A.J.; Barklem, P.S.; Grundahl, F. Atomic diffusion and mixing in old stars. II. Observations of stars in the globular cluster NGC 6397 with VLT/FLAMES-GIRAFFE. Astron. Astrophys. 2008, 490, 777–786. [Google Scholar] [CrossRef]
- Nordlander, T.; Korn, A.J.; Richard, O.; Lind, K. Atomic Diffusion and Mixing in Old Stars. III. Analysis of NGC 6397 Stars under New Constraints. Astrophys. J. 2012, 753, 48. [Google Scholar] [CrossRef]
- Dotter, A.; Conroy, C.; Cargile, P.; Asplund, M. The Influence of Atomic Diffusion on Stellar Ages and Chemical Tagging. Astrophys. J. 2017, 840, 99. [Google Scholar] [CrossRef]
- Bland-Hawthorn, J.; Gerhard, O. The Galaxy in Context: Structural, Kinematic, and Integrated Properties. Annu. Rev. Astron. Astrophys. 2016, 54, 529–596. [Google Scholar] [CrossRef]
- Kormendy, J.; Drory, N.; Bender, R.; Cornell, M.E. Bulgeless Giant Galaxies Challenge Our Picture of Galaxy Formation by Hierarchical Clustering. Astrophys. J. 2010, 723, 54–80. [Google Scholar] [CrossRef]
- Mutch, S.J.; Croton, D.J.; Poole, G.B. The Mid-life Crisis of the Milky Way and M31. Astrophys. J. 2011, 736, 84. [Google Scholar] [CrossRef]
- Robotham, A.S.G.; Baldry, I.K.; Bland-Hawthorn, J.; Driver, S.P.; Loveday, J.; Norberg, P.; Bauer, A.E.; Bekki, K.; Brough, S.; Brown, M.; et al. Galaxy In addition, Mass Assembly (GAMA): In search of Milky Way Magellanic Cloud analogues. Mon. Not. R. Astron. Soc. 2012, 424, 1448–1453. [Google Scholar] [CrossRef]
- Sánchez-Menguiano, L.; Sánchez, S.F.; Pérez, I.; Ruiz-Lara, T.; Galbany, L.; Anderson, J.P.; Krühler, T.; Kuncarayakti, H.; Lyman, J.D. The shape of oxygen abundance profiles explored with MUSE: Evidence for widespread deviations from single gradients. Astron. Astrophys. 2018, 609, A119. [Google Scholar] [CrossRef]
- Bresolin, F. Metallicity gradients in small and nearby spiral galaxies. Mon. Not. R. Astron. Soc. 2019, 488, 3826–3843. [Google Scholar] [CrossRef]
- Boardman, N.F.; Zasowski, G.; Newman, J.A.; Sanchez, S.F.; Schaefer, A.; Lian, J.; Bizyaev, D.; Drory, N. SDSS-IV MaNGA: Galaxy gas-phase metallicity gradients vary across the mass-size plane. Mon. Not. R. Astron. Soc. 2021, 501, 948–953. [Google Scholar] [CrossRef]
- Zurita, A.; Florido, E.; Bresolin, F.; Pérez, I.; Pérez-Montero, E. Bar effect on gas-phase abundance gradients—II. Luminosity-dependent flattening. Mon. Not. R. Astron. Soc. 2021, 500, 2380–2400. [Google Scholar] [CrossRef]
- Zurita, A.; Florido, E.; Bresolin, F.; Pérez-Montero, E.; Pérez, I. Bar effect on gas-phase abundance gradients. I. Data sample and chemical abundances. Mon. Not. R. Astron. Soc. 2021, 500, 2359–2379. [Google Scholar] [CrossRef]
- Bacon, R.; Accardo, M.; Adjali, L.; Anwand, H.; Bauer, S.; Biswas, I.; Blaizot, J.; Boudon, D.; Brau-Nogue, S.; Brinchmann, J.; et al. The MUSE second-generation VLT instrument. In Ground-Based and Airborne Instrumentation for Astronomy III; Society of Photo-Optical Instrumentation Engineers (SPIE) Conference Series; McLean, I.S., Ramsay, S.K., Takami, H., Eds.; International Society for Optics and Photonics: Bellingham, WA, USA, 2010; Volume 7735, p. 773508. [Google Scholar] [CrossRef]
- Sánchez, S.F.; Rosales-Ortega, F.F.; Iglesias-Páramo, J.; Mollá, M.; Barrera-Ballesteros, J.; Marino, R.A.; Pérez, E.; Sánchez-Blazquez, P.; González Delgado, R.; Cid Fernandes, R.; et al. A characteristic oxygen abundance gradient in galaxy disks unveiled with CALIFA. Astron. Astrophys. 2014, 563, A49. [Google Scholar] [CrossRef]
- Bovy, J.; Rix, H.W. A Direct Dynamical Measurement of the Milky Way’s Disk Surface Density Profile, Disk Scale Length, and Dark Matter Profile at 4 kpc <~R <~9 kpc. Astrophys. J. 2013, 779, 115. [Google Scholar] [CrossRef]
- Licquia, T.C.; Newman, J.A. Sizing Up the Milky Way: A Bayesian Mixture Model Meta-analysis of Photometric Scale Length Measurements. Astrophys. J. 2016, 831, 71. [Google Scholar] [CrossRef]
- Boardman, N.; Zasowski, G.; Newman, J.A.; Andrews, B.; Fielder, C.; Bershady, M.; Brinkmann, J.; Drory, N.; Krishnarao, D.; Lane, R.R.; et al. Are the Milky Way and Andromeda unusual? A comparison with Milky Way and Andromeda analogues. Mon. Not. R. Astron. Soc. 2020, 498, 4943–4954. [Google Scholar] [CrossRef]
- Boardman, N.; Zasowski, G.; Seth, A.; Newman, J.; Andrews, B.; Bershady, M.; Bird, J.; Chiappini, C.; Fielder, C.; Fraser-McKelvie, A.; et al. Milky Way analogues in MaNGA: Multiparameter homogeneity and comparison to the Milky Way. Mon. Not. R. Astron. Soc. 2020, 491, 3672–3701. [Google Scholar] [CrossRef]
- Ibarra-Medel, H.J.; Avila-Reese, V.; Sánchez, S.F.; González-Samaniego, A.; Rodríguez-Puebla, A. Optical integral field spectroscopy observations applied to simulated galaxies: Testing the fossil record method. Mon. Not. R. Astron. Soc. 2019, 483, 4525–4550. [Google Scholar] [CrossRef]
- Nitschai, M.S.; Cappellari, M.; Neumayer, N. First Gaia dynamical model of the Milky Way disc with six phase space coordinates: A test for galaxy dynamics. Mon. Not. R. Astron. Soc. 2020, 494, 6001–6011. [Google Scholar] [CrossRef]
- Dalton, G. WEAVE: The Next, Generation Spectroscopy Facility for the WHT. In Multi-Object Spectroscopy in the Next, Decade: Big Questions, Large Surveys, and Wide Fields; Astronomical Society of the Pacific Conference Series; Skillen, I., Balcells, M., Trager, S., Eds.; ADS: San Francisco, CA, USA, 2016; Volume 507, pp. 465–472. [Google Scholar]
- de Jong, R.S.; Bellido-Tirado, O.; Chiappini, C.; Depagne, É.; Haynes, R.; Johl, D.; Schnurr, O.; Schwope, A.; Walcher, J.; Dionies, F.; et al. 4MOST: 4-m multi-object spectroscopic telescope. In Ground-Based and Airborne Instrumentation for Astronomy IV; Society of Photo-Optical Instrumentation Engineers (SPIE) Conference Series; McLean, I.S., Ramsay, S.K., Takami, H., Eds.; International Society for Optics and Photonics: Bellingham, WA, USA, 2012; Volume 8446, p. 84460T. [Google Scholar] [CrossRef]
- Cirasuolo, M.; Afonso, J.; Carollo, M.; Flores, H.; Maiolino, R.; Oliva, E.; Paltani, S.; Vanzi, L.; Evans, C.; Abreu, M.; et al. MOONS: The Multi-Object Optical and Near-infrared Spectrograph for the VLT. In Ground-Based and Airborne Instrumentation for Astronomy V; Society of Photo-Optical Instrumentation Engineers (SPIE) Conference Series; Ramsay, S.K., McLean, I.S., Takami, H., Eds.; International Society for Optics and Photonics: Bellingham, WA, USA, 2014; Volume 9147, p. 91470N. [Google Scholar] [CrossRef]
- Ivezić, Ž.; Kahn, S.M.; Tyson, J.A.; Abel, B.; Acosta, E.; Allsman, R.; Alonso, D.; AlSayyad, Y.; Anderson, S.F.; Andrew, J.; et al. LSST: From Science Drivers to Reference Design and Anticipated Data Products. Astrophys. J. 2019, 873, 111. [Google Scholar] [CrossRef]
- Prisinzano, L.; Magrini, L.; Damiani, F.; Sacco, G.; Bonito, R.; Venuti, L.; Casali, G.; Roccatagliata, V.; Randich, S.; Inno, L.; et al. Investigating the population of Galactic star formation regions and star clusters within a Wide-Fast-Deep Coverage of the Galactic Plane. arXiv 2018, arXiv:1812.03025. [Google Scholar]
| 1 | https://vizier.u-strasbg.fr/viz-bin/VizieR?-source=J/MNRAS/503/3279 accessed on 5 December 2021. |
| 2 | Code available at https://github.com/fjaellet/abj2016 accessed on 5 December 2021. Our analysis is carried out using the default settings. |
| 3 | Code available at http://github.com/jobovy/galpy accessed on 5 December 2021. |
| 4 | Given a standard deviation measured over a population of size N, the standard error is defined as /. |
| 5 | However, L can also change when the particle interacts with non-axisymmetric perturbations of the Galactic potential, such as the bar, spirals and giant molecular clouds. |
Publisher’s Note: MDPI stays neutral with regard to jurisdictional claims in published maps and institutional affiliations. |
© 2022 by the authors. Licensee MDPI, Basel, Switzerland. This article is an open access article distributed under the terms and conditions of the Creative Commons Attribution (CC BY) license (https://creativecommons.org/licenses/by/4.0/).