Abstract
This work investigates the differences between the monthly and 13-month smoothed sunspot numbers since 1749, using data from sunspot number (version 2). The distribution of the differences is centered near zero, with 74% of all values lying between −20 and +20, and only 1% exceeding ±70. Positive and negative differences are nearly balanced in total number, although the distribution of the monthly differences is moderately asymmetric (skewness = −0.55) and high kurtosis (>3), confirming leptokurtic behavior with sharper peak around zero and heavier tails than a Gaussian distribution. Spikes, defined in each tail using the 95th and 5th percentile, occurred in nearly all solar cycles studied, predominantly around solar cycle maxima and in cycles with higher solar activity. Moreover, the five most extreme cases with a difference of more than 100 occur in five solar cycles, ranging from below to above average. Additionally, we analyze the recent behavior of Solar Cycle 25. The significant increase in the monthly sunspot number in August 2024 (it reached 216, the highest since 2001) raised questions about the potential future intensity of Solar Cycle 25. As the sunspot number series evolved, this difference between the maximum monthly and 13-month smoothed series decreased to 55.1 (with data through October 2025), placing Solar Cycle 25 within the historical relationship between maximum monthly and 13-month smoothed sunspot number, and the largest monthly deviations. Our results show that spikes are a recurrent feature of solar activity and can provide useful diagnostics for shorter-term solar cycle variability.
1. Introduction
The sunspot number series is one of the most widely used indices to characterize solar activity [1,2,3,4,5]. Thanks to systematic sunspot observations recorded for centuries [6,7,8], key information on the behavior of the solar cycle and the long-term solar dynamo have been discovered. This record is extensively used in several scientific fields such as, for example, in space weather studies, where the solar cycle amplitude strongly affects technological systems and near-Earth space conditions [9,10,11,12,13,14].
Solar activity varies on multiple timescales ranging from days to decades [15,16]. Shorter-term periodicities, such as the Rieger periodicity [17], show that rapid variations are an intrinsic part of solar activity [16,18]. However, studies of solar cycle characteristics, including analyses of cycle amplitude and duration, rely on the use of the 13-month smoothed sunspot number to suppress short-term fluctuations and extract long-term trends [19,20,21,22,23,24]. This smoothed series is also the reference for both reconstructions of past solar activity [4] and for solar cycle predictions [13]. Although there are many ways to smooth the monthly series of the sunspot number, the 13-month smoothing was already defined by Rudolf Wolf in the 19th century and has since been widely used by the international scientific community (for example, see Chapter 7 in Vaquero and Vázquez [2]).
Despite its advantages, the 13-month smoothing inherently removes short-term variability. The differences between the monthly sunspot number and its smoothed counterpart can be large, particularly around cycle maxima. Such deviations carry physical information not characterized in the 13-month smoothed sunspot number: they may reflect rapid changes of the solar dynamo and in historical periods they may also reveal inconsistencies arising from limited or incomplete observations. Therefore, studying these deviations is relevant both for understanding solar dynamo and for assessing the long-term homogeneity of the sunspot number.
A recent example illustrates their potential importance. Solar activity sharply increased in August 2024 when the monthly sunspot number exceeded the threshold of 200 reaching 216.0 (Figure 1). This was the highest monthly sunspot number since September 2001 (Solar Cycle 23) when its value was 238.2. That monthly sunspot number of August 2024 combined with the sunspot number in July 2024 (196.8) generated renewed discussion about whether Solar Cycle 25 will evolve into a high intensity cycle, as some predictions suggested [25], contrary to the forecast made by the Solar Cycle 25 Prediction Panel [10]. Because such rapid short-term increases do not immediately appear in the smoothed series, quantifying the typical magnitude and frequency of these differences across cycles becomes scientifically relevant.
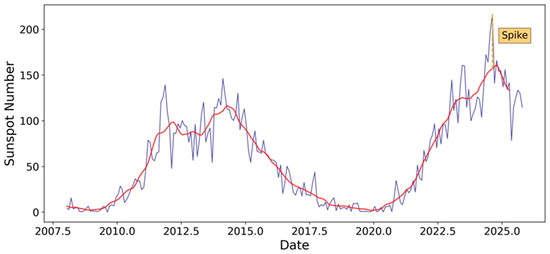
Figure 1.
Monthly (blue line) and 13-month smoothed (red line) sunspot number from 2008 to present. The only “spike” occurred in Solar Cycles 24 and 25 is indicated in orange.
Motivated by this context, the present work analyzes the differences between the monthly and 13-month smoothed sunspot number from 1749 to 2025. We examine the statistical properties of these differences, identify extreme events (hereafter called “spikes”), and assess whether their occurrence depends on the cycle amplitude. We also study whether the behavior of Solar Cycle 25, particularly after the August 2024 increase, is consistent with past cycles or represent an outlier in the historical context. The aim is to determine whether the differences between monthly values and the smoothed series can provide insights for assessing the ongoing solar cycle and interpreting past solar activity, especially during poorly observed periods.
It is important to note that the objective of this work is not to explore the mathematical properties of different smoothing techniques, but to analyze the practical consequences of the difference between the monthly and the 13-month smoothed sunspot number (both series provided by SILSO). The latter (which is the reference commonly used by the international community for tracking the evolution of the solar cycle) can only be computed retrospectively, once data from six subsequent months are available. As no alternative smoothed series are routinely provided or used by the scientific community in practice, the analysis presented here is intentionally tied to this standard definition.
The outline of this work is as follows. Section 2 describes the data and methodology. Section 3 presents the analysis of the differences between the monthly and 13-month smoothed sunspot number, including the statistical properties of spikes. Section 4 discusses the case of August 2024 within the context of Solar Activity 25. Section 5 summarizes the main conclusions.
2. Data and Methodology
The monthly (SNm) and 13-month smoothed (SNsm) sunspot number series (version 2) provided by the Sunspot Index and Long-term Solar Observations (SILSO, https://www.sidc.be/SILSO, accessed on 20 January 2025) are used in this work. We analyzed data from 1749 to October 2025, which is the last month with available data at the time of writing this work.
To study the sunspot number variability between its monthly and smoothed series, we have calculated the difference for each month of both series such as: DIF = SNm − SNsm. Figure 2 presents the temporal evolution of the SNm (blue line, top panel) and SNsm (red line, top panel), in addition to the monthly differences between the two series (bottom panel). The 95th and 5th percentile thresholds of the monthly differences are also indicated in Figure 2 (bottom panel) as horizontal dashed lines and are used to define positive and negative spikes (see Section 3.4 for more details). Furthermore, Table 1 lists, for each solar cycle from 1 to 25, the maximum monthly (SNm-max) and 13-month smoothed sunspot number (SNsm-max), its difference, and the maximum (DIFmax) and minimum (DIFmin) monthly differences between both series.
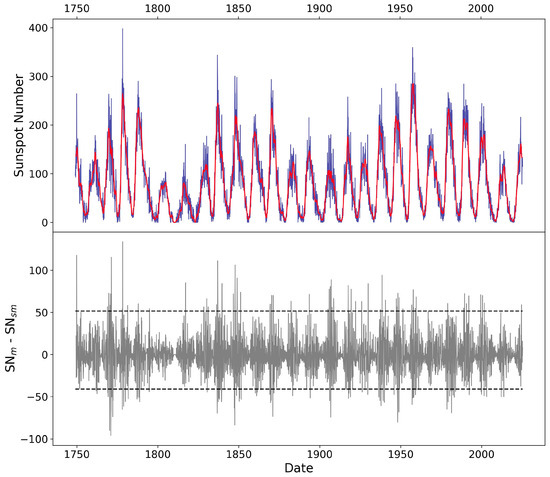
Figure 2.
(Top panel) Monthly (blue line) and 13-month smoothed (red line) sunspot number from 1749 to present. (Bottom panel) Monthly differences between the monthly (SNm) and 13-month (SNsm) sunspot number. The horizontal dashed lines in the bottom panel depict the 5th and 95th percentile of the monthly SNm − SNsm differences, used as thresholds to identify negative and positive spikes, respectively.

Table 1.
Information for each solar cycle (first column, “Cycle”) on the maximum monthly (second and third column, “SNm-max”) and 13-month smoothed (fourth and fifth column, “SNsm-max”) sunspot number (value and date), the difference between both (fourth column, “SNm-max − SNsm-max”) and the maximum (sixth and seventh column, “DIFmax”) and minimum (eighth and ninth column, “DIFmin”) monthly difference between both series (value and date). Data on the ongoing Solar Cycle 25 are shown in italics.
3. Analysis and Discussion
3.1. Statistical Overview of SNm − SNsm Differences
The distribution of the monthly differences between the SNm and SNsm series can be seen in Figure 3. Specifically, differences ranging between −20 and 20 are 74% of the total cases, whereas the number of cases for which the differences are higher than 70 or lower than −70 represents only 1% of the data. A slightly greater number of negative differences (54.5% of the total cases) are observed compared to positive ones (44.9%), with 0.6% of the cases showing differences equal to 0. Positive differences indicate that the SNm is higher than the SNsm, while negative differences indicate the opposite.
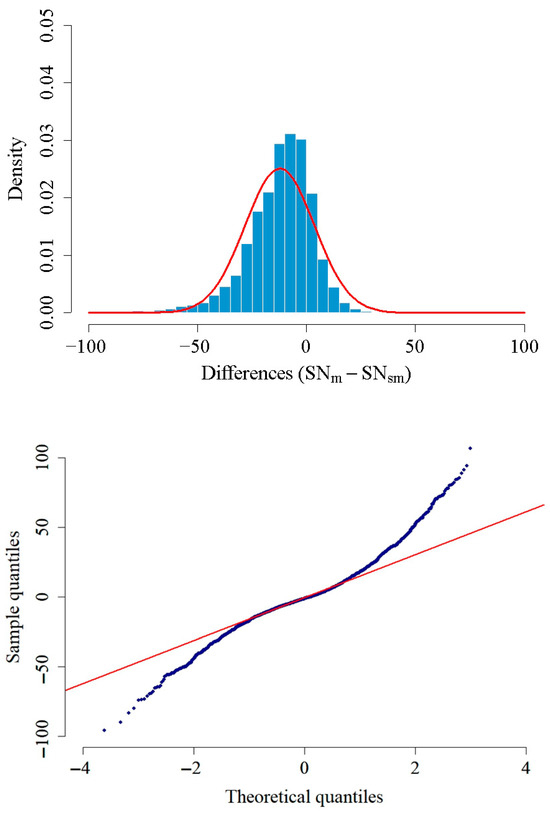
Figure 3.
(Top panel) Histogram of the monthly differences between SNm and SNsm with the theoretical normal curve in red. (Bottom panel) Q-Q plot comparing the empirical quantiles of the differences against a standard normal distribution.
3.2. Distribution of SNm − SNsm Differences
The distribution of the SNm − SNsm differences is not strictly symmetric. The maximum of the histogram in Figure 3 corresponds to values for which the difference is around 0. The mean and median value is 0.0 and −1.5, respectively. The theoretical normal curve is also represented in red in Figure 3 (top panel). The probability density function of the Gaussian distribution is defined as follows:
The Gaussian fit shown in Figure 3 (top panel) yielded a mean of μ = −12.23 and a standard deviation of σ = 15.90.
The distribution of the differences is leptokurtic, that is, it has a higher peak and fatter tails than a Gaussian distribution. It implies that spikes occur more frequently than predicted by a Gaussian distribution. Also, the kurtosis coefficient of the monthly differences is 5.95, which also indicates that there is a greater risk of outliers or rare events. Moreover, to assess the normality (or not) of the data, we have examined the Quantile-Quantile (Q-Q) plot shown in Figure 3 (bottom panel). The points deviate significantly from the reference red line at both extremes, confirming the presence of fatter tails than a Gaussian (Figure 3, bottom panel).
Given the significant deviation from normality, we explored alternative statistical models to better describe the probability of occurrence of these spikes. First, we fitted the data to a t-Student distribution (Figure 4, top panel). The location-scale t-Student probability density function is:
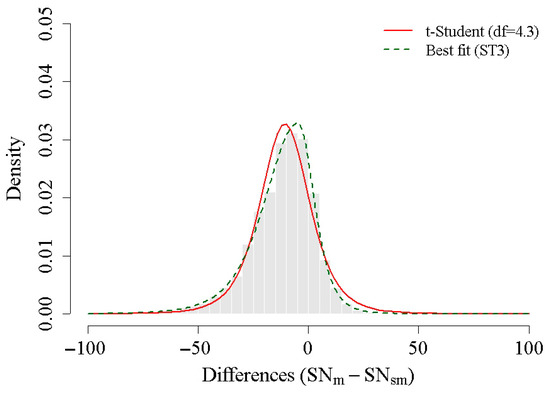
Figure 4.
Comparison of statistical models for the monthly differences. The histogram is fitted with a t-Student distribution (red curve) and a skew exponential power type 3 distribution (green curve).
Unlike the Gaussian distribution, this model includes a degrees-of-freedom parameter that controls tail thickness. The resulting fit has the following parameters: µ = −10.61 (mean), s = 11.51 (scale) and df = 4.34 (degrees of freedom). The value of the degrees of freedom (4.34) indicates fatter tails compared to a Gaussian. This model captures more efficiently the leptokurtic nature of the differences. Additionally, to account for the slight negative asymmetry observed in the data (skewness coefficient of −0.55), we have applied a fit using a skew exponential power type 3 distribution (Figure 4, bottom panel), with the following parameters: µ = −4.76 (location), σ = 2.39 (scale), ν = −0.35 (asymmetry), τ = 1.60 (shape). This distribution allows for the simultaneous modelling the sharp peak of the distribution around zero and the tendency toward asymmetric tails. Its probability density function is given by the following expression:
The Y-axis in Figure 3 (top panel) and 4 represents the probability density function (PDF). Unlike frequency counts, the density values are scaled so that the total area under the histogram and the curves equal unity. This approach facilitates a consistent comparison between the empirical distribution of the sunspot number differences and the theoretical models.
We also analyzed the temporal persistence of these differences. Figure 5 presents the Autocorrelation Function (ACF) of the monthly differences. A significant correlation is observed only at the first lag (1 month), which decays to zero quickly. This short-term memory suggests that, while spikes are sudden events, they maintain a dependence on their immediate past values. This indicates that the differences are not purely random noise and that a high deviation in one month is likely to influence the next one.
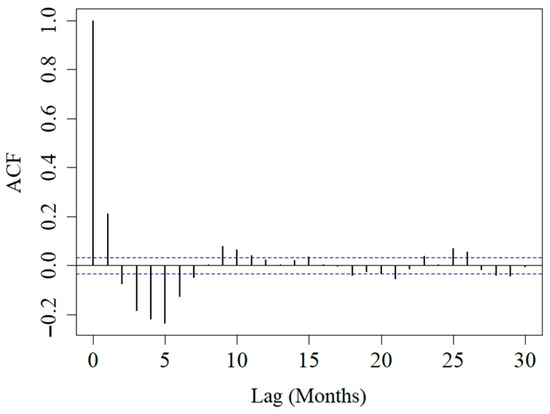
Figure 5.
Autocorrelation function (ACF) of the differences. The dashed lines represent the 95% confidence bounds. Correlations outside these lines are considered statistically significant.
3.3. SNm − SNsm Differences in Solar Cycles
We list the highest monthly positive and negative differences for each solar cycle from 1 to 25 in Table 1. The values (in absolute value) of the negative differences are higher than those of the positive ones only in Solar Cycle 1 (−46.5 vs. 39.9), 5 (−30.5 vs. 26.3), 10 (−49.0 vs. 44.7), 11 (−73.5 vs. 70.2), 18 (−80.3 vs. 72.8), 21 (−69.3 vs. 60.7) and 24 (−50.3 vs. 49.7). We note that Solar Cycle 1, 5 and 24 were below average cycles, Solar Cycle 10 was an average cycle, and Solar Cycle 11, 18 and 21 were above average cycles.
We analyzed some correlation between parameters in Table 1 to test if they can be used as predictors of the amplitude of solar cycles. Figure 6 (top panel) represents the SNm-max against the SNsm-max for each cycle from 1 to 25. The best linear fit is given by the expression: SNm-max = (23.8 ± 14.9) + (1.2 ± 0.9)·SNsm-max, r = 0.95. That correlation coefficient is significantly higher than that considering the relationship between the difference of DIFmax and DIFmin (DIFt) and the highest SNm-max in each cycle. The best linear fit in this case is: DIFt = (46.0 ± 19.7) + (0.4 ± 0.1)·SNm-max, r = 0.68 (Figure 6, bottom panel). Moreover, considering the uncertainty associated with the sample size [26], the latter correlation is comparable to those obtained considering the relationships between: (i) the DIFt and the SNsm_max [DIFt = (69.0 ± 21.8) + (0.3 ± 0.1)·SNsm-max, r = 0.53]; (ii) the maximum monthly difference (DIFm-abs) of DIFmax and DIFmin (choosing from the two the one with the highest absolute value) and the SNm-max [DIFm-abs = (23.0 ± 12.9) + (0.2 ± 0.1)·SNm-max, r = 0.66]; and (iii) the maximum monthly difference (DIFm-abs) of DIFmax and DIFmin (choosing from the two the one with the highest absolute value) and the SNsm-max [DIFm-abs = (41.4 ± 14.6) + (0.2 ± 0.1)·SNsm-max, r = 0.46].
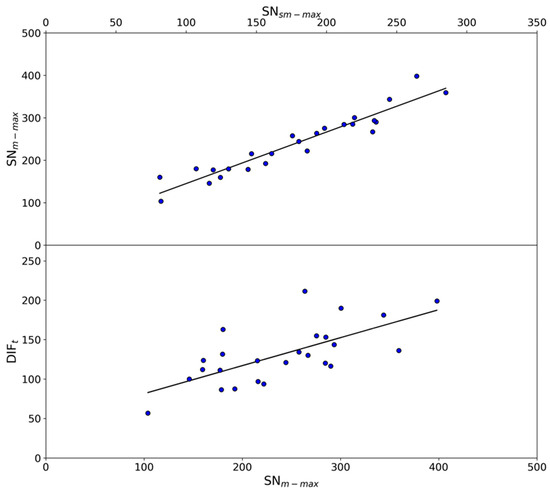
Figure 6.
(Top panel) Maximum monthly (SNm-max) against maximum 13-month (SNsm-max) sunspot number for each solar cycle from 1 to 25. (Bottom panel) Difference between the maximum and minimum monthly difference per cycle between the monthly and 13-month smoothed sunspot number (DIFt) against the maximum monthly sunspot number (SNm-max) for each cycle from 1 to 25. The best linear fits are represented by solid lines.
3.4. Definition and Distribution of Spikes
We define “spikes” as those cases where the difference between the SNm and SNsm exceeds a significant threshold. As the distribution of the monthly differences (SNm − SNsm) is moderately skewed (skewness = −0.55), we define this threshold using independent thresholds for each tail of the distribution. Specifically, we define positive peaks as values above the 95th percentile and negative peaks as values below the 5th percentile. This definition enables us to identify the most extreme monthly events without imposing artificial symmetries on the data. Thus, monthly differences higher than 51.6 and lower than −41.0 are considered “spikes”. We note that the spikes have been defined on a monthly scale and there are some cases in which several consecutive monthly differences exceed the 5th or 95th percentile threshold.
There are a slightly more negative spikes (55%) compared to positive ones (45%). They generally occur around maxima of the solar cycle, which is expected because the sunspot number is higher during these periods. Therefore, there can be significant differences between the monthly and 13-month smoothed sunspot numbers.
The largest monthly negative spikes do not reach the value −100 (the minimum is −96.1), whereas there are five positive spikes above 100. These cases correspond to October 1749 in Solar Cycle 0 (117.9), May 1771 in Solar Cycle 2 (115.4), May 1778 in Solar Cycle 3 (133.9), December 1836 in Solar Cycle 8 (111.4), and October 1847 in Solar Cycle 9 (106.3). These spikes appeared in cycles ranging from below to above average cycles, with Solar Cycle 0 being a below average cycle (maximum amplitude of 154.3), Solar Cycle 2 an average cycle (193.0), and Solar Cycle 3 (264.3), 8 (244.9), and 9 (219.9) above average cycles.
However, not all these spikes can be considered equally reliable. For those spikes above 100 occurred in the earliest cycles (Solar Cycle 0, Solar Cycle 2, and Solar Cycle 3), the observational coverage in these cycles was sparse and there is no overlap between observers, making these spikes potentially affected by calibration uncertainties or by poor sampling of the actual monthly activity [4,27]. Thus, these early spikes may reflect observational limitations rather than true episodes of exceptional activity.
In contrast, the cases in December 1836 (Solar Cycle 8) and October 1847 (Solar Cycle 9) are likely to be robust. In Solar Cycle 9, the October 1847 spike above 100 is supported by high observational coverage, while in Solar Cycle 8 the December 1836 spike, although based on fewer observations, occurs in a period where the series is known to have continuous records, higher-quality observations, and better observer overlap, which greatly reduces the probability that large spikes arise from data artifacts. Therefore, these two spikes are the most reliable examples among the extreme cases exceeding 100.
The distribution of the number of spikes from Solar Cycle 0 to 25 is shown in Figure 7. Discarding Solar Cycle 0, which lacks full observational coverage, only Solar Cycle 5 and 20 do not have any spikes, whereas cycles with only one spike are Solar Cycle 6 and the ongoing Solar Cycle 25. Solar cycles with five or lower spikes include Solar Cycle 1, 5, 6, 7, 10, 12, 13, 16, 20, 22, 24, and (so far) 25. Among these, only Solar Cycle 22 has an above average maximum amplitude, Solar Cycle 10 is an average cycle, and the rest are below average cycles. Note that the average maximum amplitude considering Solar Cycle 1–24 is ~180. By contrast, solar cycles with ten or more spikes, that is, Solar Cycle 2, 8, 9, 11, 18, and 19 are above average cycles.
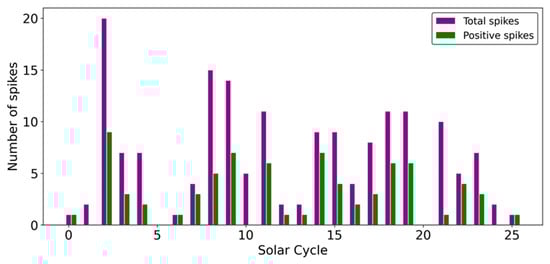
Figure 7.
Distribution of the number of total (purple) and positive (green) spikes per solar cycle from 0 to 25.
There is also an apparent trend, with historical cycles generally showing more spikes than recent ones, although the historical part includes the Dalton Minimum (Solar Cycles 5 and 6), a period of reduced solar activity [28,29] when there were almost no spikes. The average spike count for Solar Cycles 1–12 is 7.3, whereas it is 6.5 for Solar Cycles 13–24.
An analysis of positive spikes is particularly of interest since these represent months when solar activity significantly exceeds the smoothed sunspot number. This information is relevant, for example, for space agencies and international institutions that monitor the evolution of solar activity due to the fact that sudden monthly increases in solar activity (positive spikes) can have significant impacts on technology and society. The number of positive spikes per solar cycle is depicted in Figure 7 (green bars). In this case, also positive spikes generally occur around solar cycle maxima and there are consecutive monthly positive differences exceeding the 95th percentile threshold. A number of positive spikes higher than five occurred in Solar Cycle 2, 9, 11, 14, 18, and 19. All these solar cycles are above average cycles. In addition, as in the analysis of total spikes, no decrease or increase in the number of positive spikes over time is observed, with an average of 3.1 spikes both during Solar Cycles 1–12 and Solar Cycles 13–24.
We have also analyzed the relationship between the number of positive and negative spikes in each solar cycle in order to assess whether both types of events are linked. The best linear fit between both for Solar Cycles 1–25 does not indicate a strong correlation (r = 0.58), indicating that cycles with a larger number of positive spikes do not necessarily exhibit a comparable number of negative ones. This result suggests that, although spikes tend to occur preferentially around solar maxima, the occurrence of positive and negative spikes within a given cycle is not tightly coupled.
4. The Case of August 2024
Solar activity experienced a significant increase in August 2024. In that month, the SNm reached a value of 216, the highest SNm so far in Solar Cycle 25. At that time, the highest SNsm value was 136.9 in February 2024, owing to the intrinsic 6-month lag of the smoothing procedure. Therefore, the difference between these two values is 76.1. Then, six solar cycles have a larger difference between SNm and SNsm: Solar Cycle 3 (133.9), Solar Cycle 6 (79.1), Solar Cycle 8 (98.9), Solar Cycle 9 (80.7), Solar Cycle 15 (82.0), and Solar Cycle 17 (77.0). These values (and those for the remaining cycles) are listed in Table 1. Moreover, at that same time (August 2024), the largest monthly difference between SNm and SNsm was 35.4 (July 2023).
As of October 2025, the highest SNsm value for Solar Cycle 25 has been 160.9 (October 2024). With the maximum SNm still being 216, the updated difference between the largest SNm and SNsm for Solar Cycle 25 is 55.1. This is lower than the median value (64.0) of the differences between both series for Solar Cycles 1–25. Beyond the solar cycles already noted above, eight additional cycles have differences higher than that of Solar Cycle 25: Solar Cycle 2 (70.7), Solar Cycle 7 (58.1), Solar Cycle 11 (59.6), Solar Cycle 13 (68.9), Solar Cycle 14 (73.2), Solar Cycle 18 (66.3), Solar Cycle 19 (74.4), Solar Cycle 22 (72.0), and Solar Cycle 23 (64.0). Thus, only nine of the previous solar cycles (1–24) have a smaller difference than Solar Cycle 25.
We also compared the highest monthly difference between SNm and SNsm in absolute value (see DIFmax and DIFmin in Table 1) for each solar cycle (DIFm-abs) with the difference between the maximum SNm (SNm-max) and maximum SNsm (SNsm-max) for Solar Cycles 1–25 (DIFSNmax) (Figure 8). The best linear fit is given by the expression: DIFm-abs = (23.4 ± 6.2) + (0.8 ± 0.1) DIFSNmax, r = 0.88. The red point in Figure 8 was not included in this regression.
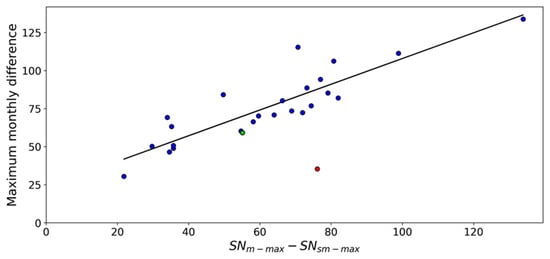
Figure 8.
Highest monthly difference (in absolute values) between the monthly (SNm) and 13-month smoothed (SNsm) sunspot number for each solar cycle against the difference between the maximum monthly (SNm-max) and maximum 13-month smoothed (SNsm-max) sunspot number for Solar Cycles 1–25. Red dot (green) represents the case of Solar Cycle 25 with data updated to August 2024 (October 2025). The best linear fit is represented by the solid line.
The red point in Figure 8 corresponds to Solar Cycle 25, using data available as of August 2024. This point lies significantly below the regression line, indicating an anomalous relationship between DIFm-abs and DIFSNmax at that time. Such a deviation suggested that either DIFm-abs or DIFSNmax was expected to change as more data became available, a prediction confirmed when the SNsm maximum increased later in the cycle. With the updated values (October 2025), the difference between the maximum SNm and maximum SNsm for Solar Cycle 25 has been reduced to 55.1, whereas the highest monthly difference between the SNm and SNsm in Solar Cycle 25 is 59.2, which represents the only spike identified in this cycle. Thus, the behavior of Solar Cycle 25 appears much closer to the regression line (see green point in Figure 8).
The movement of Solar Cycle 25 towards the regression line following the evolution of SNm and SNsm suggests that the DIFm-abs − IFSNmax relationship can be used to track the evolution of an ongoing cycle prior to its maximum. In the case of Solar Cycle 25, the updated behavior is fully consistent with that displayed by previous cycles.
5. Conclusions
We analyzed the monthly differences between the monthly and the 13-month smoothed sunspot number (version 2) for the period 1749–2025. The most common occurrence corresponds to differences closer to zero. Most differences lie within ±20, and those exceeding 70 or lower than −70 represent only 1% of the total cases. We also found a similar number of positive and negative differences (54.5% of the differences are negative and 44.9% are positive). However, the distribution shows a moderately asymmetric skewness (−0.55), highlighting a slight predominance of negative differences, and high kurtosis, confirming a leptokurtic shape with a sharper central peak and heavier tails. Additionally, the ACF reveals strong temporal persistence, demonstrating that extreme deviations tend to cluster rather than occur as isolated random events, particularly around cycle maxima.
Spikes, defined as monthly differences above and below the 95th and 5th percentile, respectively, appear in nearly all solar cycles analyzed, being more frequent around solar cycle maxima and in cycles with higher solar activity (this is also the case for positive spikes). Likewise, the five spikes with a difference higher than 100 (all of them are positive spikes) occurred from below to above average cycles, indicating that large differences can occur regardless of the solar activity level.
Among below-average cycles, only Solar Cycle 14 displays a comparatively large number of spikes. For positive spikes, only strong cycles tend to exhibit many events, but this is not universal. Several intense cycles (SC3, SC4, SC8, SC17, SC21, SC22) show five or fewer spikes, and only SC8 reaches five. Therefore, the scales for total spike count and positive spike count do not show a consistent pattern with cycle amplitude.
There is an apparent general trend toward a lower spike frequency during recent cycles compared to historical ones (not in the case of the positive spikes). This trend in the spike frequency may reflect specific behaviors related to the long-term solar dynamo or a poor characterization of the monthly sunspot number values in earlier solar cycles because of low observational coverage (see Figure 8 in Clette et al. [4]). In any case, it needs to be analyzed in more detail in the future.
Analyzing the maximum monthly differences in each cycle between the monthly and 13-month smoothed sunspot number, we found that there are significantly more cycles in which the value of the maximum positive difference is higher than that of the maximum negative difference (in absolute value). In addition, we found that there is no high correlation between the maximum monthly difference (positive or negative choosing from the two the one with the highest absolute value) and the maximum 13-month smoothed sunspot number of each solar cycle as well as between the difference of the maximum positive and negative monthly difference and the highest 13-month smoothed sunspot number in each cycle. Thus, this relationship should not be used as solar activity predictor.
The significant increase in solar activity observed in August 2024 sparked interest in the final amplitude of Solar Cycle 25. As the monthly and 13-month smoothed sunspot number evolved, the movement of Solar Cycle 25 towards the regression line indicates that the relationship between the highest absolute monthly difference (DIFm-abs) and the difference between the maximum monthly and 13-month smoothed sunspot number (DIFSNmax) can be used as a diagnostic tool to track the evolution of an ongoing cycle before it reaches its maximum (see Figure 8). This empirical relationship provides a means of evaluating whether a cycle follows a typical historical pattern or its behavior is anomalous. In the case of Solar Cycle 25, the convergence with the updated values towards the regression line confirms that its evolution is consistent with the historical behavior observed since the mid-eighteenth century. Therefore, Solar Cycle 25 does not present any anomalous characteristics within the context of the DIFm-abs − DIFSNmax relationship.
Overall, spikes represent a recurrent but irregular feature of solar activity. Their frequency and amplitude provide insights into short-term dynamo variability and may help evaluate the internal consistency of historical sunspot records, especially during periods with sparse observations.
Author Contributions
Conceptualization, V.M.S.C. and J.M.V.; methodology, V.M.S.C. and J.M.V.; formal analysis, V.M.S.C., L.B. and J.M.V.; investigation, V.M.S.C., A.J.P.A., L.B., M.C.G. and J.M.V.; writing—original draft preparation, V.M.S.C.; writing—review and editing, V.M.S.C., A.J.P.A., L.B., M.C.G. and J.M.V.; supervision, J.M.V.; project administration, V.M.S.C. and J.M.V.; funding acquisition, V.M.S.C., A.J.P.A. and J.M.V. All authors have read and agreed to the published version of the manuscript.
Funding
This research was co-financed at 85% by the European Union through the European Regional Development Fund and the regional Government of Junta de Extremadura, Consejería de Educación, Ciencia y Formación Profesional (Project IB24061, Grant GR24049). The work is also co-funded by national funds through FCT—Fundação para a Ciência e Tecnologia, I.P., in the framework of the UID/06107/2023—Centro de Investigação em Ciência e Tecnologia para o Sistema Terra e Energia (CREATE).
Data Availability Statement
Data used in this work are available on the SILSO website (Royal Observatory of Brussels, https://www.sidc.be/SILSO/home (accessed on 20 January 2026)).
Conflicts of Interest
The authors declare no conflicts of interest.
References
- Bray, R.J.; Loughhead, R.E. Sunspots; Wiley: New York, NY, USA, 1965. [Google Scholar]
- Vaquero, J.M.; Vázquez, M. The Sun Recorded Through History; Springer: Berlin/Heidelberg, Germany, 2009. [Google Scholar] [CrossRef]
- Clette, F.; Lefèvre, L. The New Sunspot Number: Assembling All Corrections. Sol. Phys. 2016, 291, 2629. [Google Scholar] [CrossRef]
- Clette, F.; Lefèvre, L.; Chatzistergos, T.; Hayakawa, H.; Carrasco, V.M.S.; Arlt, R.; Cliver, E.W.; Dudok de Wit, T.; Friedli, T.K.; Karachik, N.; et al. Recalibration of the Sunspot-Number: Status Report. Sol. Phys. 2023, 298, 44. [Google Scholar] [CrossRef]
- Chatzistergos, T.; Krivova, N.A.; Sundermann, H.; Usoskin, I.G. Assessment of sunspot number cross-calibration approaches. Astron. Astrophys. 2025, 699, A157. [Google Scholar] [CrossRef]
- Hoyt, D.V.; Schatten, K.H. Group Sunspot Numbers: A New Solar Activity Reconstruction. Sol. Phys. 1998, 179, 189. [Google Scholar] [CrossRef]
- Vaquero, J.M.; Svalgaard, L.; Carrasco, V.M.S.; Clette, F.; Lefèvre, L.; Gallego, M.C.; Arlt, R.; Aparicio, A.J.P.; Richard, J.-G.; Howe, R. A Revised Collection of Sunspot Group Numbers. Sol. Phys. 2016, 291, 3061. [Google Scholar] [CrossRef]
- Arlt, R.; Vaquero, J.M. Historical sunspot records. Living Rev. Sol. Phys. 2020, 17, 1. [Google Scholar] [CrossRef]
- Hathaway, D.H. The Solar Cycle. Living Rev. Sol. Phys. 2015, 12, 4. [Google Scholar] [CrossRef]
- Biesecker, D.A.; Upton, L. Solar Cycle 25 Consensus Prediction Update; AGU Fall Meeting, Abstract SH13B–03; American Geophysical Union: Washington, DC, USA, 2019. [Google Scholar]
- Charbonneau, P. Dynamo models of the solar cycle. Living Rev. Sol. Phys. 2020, 17, 4. [Google Scholar] [CrossRef]
- Pesnell, W.D. Lessons learned from predictions of Solar Cycle 24. J. Space Weather Space Clim. 2020, 10, 60. [Google Scholar] [CrossRef]
- Nandy, D. Progress in Solar Cycle Predictions: Sunspot Cycles 24–25 in Perspective. Sol. Phys. 2021, 296, 54. [Google Scholar] [CrossRef]
- Usoskin, I.G. A history of solar activity over millennia. Living Rev. Sol. Phys. 2023, 20, 2. [Google Scholar] [CrossRef]
- Gleissberg, W. A long-periodic fluctuation of the sun-spot numbers. Observatory 1939, 62, 158. [Google Scholar]
- Gurgenashvili, E.; Zaqarashvili, T.V.; Kukhianidze, V.; Oliver, R.; Ballester, J.L.; Ramishvili, G.; Shergelashvili, B.; Hanslmeier, A.; Poedts, S. Rieger-type periodicity during solar cycles 14–24: Estimation of dynamo magnetic field strength in the solar interior. Astrophys. J. 2016, 826, 55. [Google Scholar] [CrossRef]
- Rieger, E.; Share, G.H.; Forrest, D.J.; Kanbach, G.; Reppin, C.; Chupp, E.L. A 154-day periodicity in the occurrence of hard solar flares? Nature 1984, 312, 623. [Google Scholar] [CrossRef]
- Vaquero, J.M.; Trigo, R.M.; Vázquez, M.; Gallego, M.C. 155-day Periodicity in Solar Cycles 3 and 4. New Astron. 2010, 15, 385. [Google Scholar] [CrossRef]
- Gnevyshev, M.N.; Ohl, A.I. On the 22-Year Cycle of Solar Activity. Astron. Zhurnal 1948, 25, 18. [Google Scholar]
- Hathaway, D.H.; Wilson, R.M.; Reichmann, E.J. Group Sunspot Numbers: Sunspot Cycle Characteristics. Sol. Phys. 2002, 211, 357. [Google Scholar] [CrossRef]
- Solanki, S.K.; Krivova, N.A.; Schüssler, M.; Fligge, M. Search for a relationship between solar cycle amplitude and length. Astron. Astrophys. 2002, 396, 1029. [Google Scholar] [CrossRef]
- Kane, R.P. How useful is the Waldmeier effect for prediction of a sunspot cycle? J. Atmos. Sol.-Terr. Phys. 2008, 70, 1533. [Google Scholar] [CrossRef]
- Carrasco, V.M.S.; Aparicio, A.J.P.; Vaquero, J.M.; Gallego, M.C. The New Sunspot-Number Index and Solar-Cycle Characteristics. Sol. Phys. 2016, 291, 3045. [Google Scholar] [CrossRef]
- Li, F.Y.; Kong, D.F.; Xie, J.L.; Xiang, N.B.; Xu, J.C. Solar cycle characteristics and their application in the prediction of cycle 25. J. Atmos. Sol.-Terr. Phys. 2018, 181, 110. [Google Scholar] [CrossRef]
- McIntosh, S.W.; Chapman, S.; Leamon, R.J.; Egeland, R.; Watkins, N.W. Overlapping Magnetic Activity Cycles and the Sunspot Number: Forecasting Sunspot Cycle 25 Amplitude. Sol. Phys. 2020, 295, 163. [Google Scholar] [CrossRef]
- Bonnet, D.G.; Wright, T.A. Sample size requirements for estimating pearson, kendall and spearman correlations. Psychometrika 2020, 65, 23. [Google Scholar] [CrossRef]
- Muñoz-Jaramillo, A.; Vaquero, J.M. Visualization of the challenges and 304 limitations of the long-term sunspot number record. Nature Astron. 2019, 3, 205. [Google Scholar] [CrossRef]
- Hayakawa, H.; Besser, B.P.; Iju, T.; Arlt, R.; Uneme, S.; Imada, S.; Bourdin, P.A.; Kraml, A. Thaddäus Derfflinger’s sunspot observations during 1802–1824: A primary reference to understand the Dalton Minimum. Astrophys. J. 2020, 890, 98. [Google Scholar] [CrossRef]
- Carrasco, V.M.S. Number of sunspot groups and individual sunspots recorded by Tevel for the period 1816–1836 in the Dalton minimum. Astrophys. J. 2021, 922, 58. [Google Scholar] [CrossRef]


Disclaimer/Publisher’s Note: The statements, opinions and data contained in all publications are solely those of the individual author(s) and contributor(s) and not of MDPI and/or the editor(s). MDPI and/or the editor(s) disclaim responsibility for any injury to people or property resulting from any ideas, methods, instructions or products referred to in the content. |
© 2026 by the authors. Licensee MDPI, Basel, Switzerland. This article is an open access article distributed under the terms and conditions of the Creative Commons Attribution (CC BY) license.