Abstract
The present study was conducted to assess the effect of elevated ozone stress on the development and metabolite contents of lemongrass, a medicinal plant. The experimental plant was exposed to two elevated ozone concentrations (ambient + 15 ppb, and ambient + 30 ppb) using open-top chambers. Samplings were carried out at 45 and 90 days after transplantation (DAT), for the analysis of different characteristics, while the metabolite contents of leaves and essential oils were analyzed at 110 DAT. Both the doses of elevated ozone had notable negative effects on the carbon fixation efficiency of plants, resulting in a significant reduction in plant biomass. Enzymatic antioxidant activity increased during the second sampling, which suggests that the scavenging of reactive oxygen species was more prominent in lemongrass during the later developmental stage. The results of the present study showed a stimulated diversion of resources towards the phenylpropanoid pathway, which is made evident by the increase in the number and contents of metabolites in foliar extract and essential oils of plants grown at elevated ozone doses, as compared to ambient ozone. Elevated ozone not only upregulated the contents of medicinally important components of lemongrass, it also induced the formation of some pharmaceutically active bio compounds. On the basis of this study, it is expected that increasing ozone concentrations in near future will enhance the medicinal value of lemongrass. However, more experiments are required to validate these findings.
1. Introduction
Mean ground-level ozone (O3) concentration is continuously increasing due to accelerated development of several anthropogenic activities, including industrialization and vehicular emissions, over the past few decades [1,2]. Background average O3 concentrations have escalated from 20–30 ppb to 30–50 ppb and are expected to further increase up to 40–60% by the end of this century [3,4]. Anthropogenic activities have resulted in an almost three-fold increment in the emissions of oxides of nitrogen (NOx), volatile organic compounds (VOCs), and carbon monoxide (CO) [5]. This, coupled with the favourable meteorological conditions, has stepped-up the complex chemical reactions for the formation of this oxidative photochemical secondary air pollutant [6,7] in both developed and developing countries [8]. South Asian countries are continuously exposed to high O3 concentrations due to unchecked high emissions of O3 precursors and will continue to follow this same trend in the coming years [9,10,11]. However, simulation analyses have shown a significant reduction in O3 concentration in Europe and North America due to lower O3 precursor levels [12,13]. Several studies reported that suitable meteorological conditions have made China and India major O3 hotspots, with predicted increases of 13% and 20% in O3 precursors, respectively [14,15,16]. NOx levels in India showed an annual increasing trend of 0.9 ppb from 2010 to 2015 [8]. In India, the middle Indo-Gangetic Plains have seen high concentrations in the last few years, as made evident by a number of studies [17,18].
The pharmaceutical properties of medicinal plants are mainly attributed to their secondary metabolites (SMs) such as alkaloids, flavonoids, triterpenes, tannins, and phenolic acids [19,20]. Different medicinal plants are recognized as a source of natural free radicals scavenging compounds and are crucial in the chemoprevention of many diseases [21,22]. Owing to the presence of a substantial amount of SMs in medicinal plants have a number of pharmaceutical properties, such as anti-inflammatory, anticancer, antioxidative properties, which establish their use as herbal medicines [23]. Secondary metabolites are also known to play an important role in plant–environment interactions, coping with numerous biotic and abiotic stresses. It has been observed that environmental stress such as O3 pollution causes significant alterations in plants’ metabolic profiles [24,25,26]. Ground-level O3 generates oxidative stress in plants via the generation of reactive oxygen species, which disturbs normal cellular homeostasis, bringing about alterations in various morphological, physiological and biochemical processes [25,27,28]. The oxidative burst experienced by the plants under O3 exposure stimulates the antioxidant production and biosynthesis of SMs [29]. A number of SMs such as terpenoids, flavonoids, phenolics are observed to increase under elevated O3 [25,30]. Most O3-based studies have focused on the nutritional contents of agricultural crops and their bioactive phytochemical constituents are completely ignored. In the light of the recent COVID-19 wave(s), there has been an increasing demand in society for natural immunity boosters, and medicinal plants can successfully fill this void. As such, it becomes important to evaluate the qualitative and quantitative response of SMs of medicinal plants towards unfavourable environmental factors such as O3 stress. Cymbopogon flexuosus (Steud.) (Wats.) is an aromatic perennial C4 grass, grown in almost all tropical and subtropical countries and is an important source of bioactive secondary metabolites, commonly used in traditional medicines [31,32]. Lemongrass can be used for its analeptic, antioxidative, anti-inflammatory, and anticancer properties and is helpful in controlling blood sugar, cholesterol, and blood pressure. Citral, the major bioactive compound present in the essential oil of lemongrass, mainly comprises two stereoisomeric monoterpene aldehydes, geranial (C10H16O) and neral (C10H16O), exhibiting multitudinous therapeutic properties [31,33]. The present study was planned with the following objectives: (i) to evaluate the response of lemongrass to elevated O3 (as predicted in the coming years) by studying its morphological, biochemical and physiological characteristics, and (ii) to investigate the qualitative and quantitative alterations in the secondary metabolite profile of lemongrass upon exposure to elevated O3. We hypothesize that O3 stress initiates the upregulation of bioactive phytochemical compounds in lemongrass. We further aim to explore the mechanistic modifications and the compensatory influences on other plant functional characteristics, which facilitates the enhanced therapeutic importance of lemongrass under elevated O3 stress.
2. Materials and Methods
2.1. Study Site
The experiment was carried out between September 2021 and February 2022 in the Botanical Garden of Banaras Hindu University, a suburban area of Varanasi, Uttar Pradesh, located in the eastern Gangetic plains of the Indian subcontinent at 25°18 N, 82°01 E (76.19 m above mean sea level). The experimental site is characterized by alluvial, pale brown soil with a typical sandy loam texture comprising ~45% sand, 28% silt and 27% of clay, with pH ranging from 7.2 to 7.6 ± 0.2, which was measured using a soil pH meter (Eutech Cyber Scan pH 510, India). Total soil nitrogen and organic carbon contents were 0.21% and 1.44%, respectively. The meteorological parameters of the site were obtained from the Indian Meteorological Division (IMD), B.H.U., Varanasi. The study area experienced a mean monthly maximum temperature ranging from 31.68 ± 2.1 to 33.42 ± 1.25 °C and mean monthly minimum temperature between 8.42 ± 4.1 and 20.64 ± 1.14 °C, with a total rainfall of 855.20 mm that mostly occurred in September. Relative humidity varied from 84.5% to 90.93% during the experimental period. Daily mean sunshine duration ranged from 4.3 h to 11.2 h.
2.2. Plant Material
Cymbopogon flexuosus (Steud.) (Wats.) (Lemongrass), var. ‘Krishna’, a well-known medicinal and aromatic plant (MAPs), [34] was selected as the experimental material. C. flexuosus is a perennial C4 species widely in grown South Asian countries. Lemongrass is cultivated over an area of 16,000 ha throughout the world, generating around 1000 t of essential oil per year [35]. ‘Krishna’ is considered a superior variety as it has the potential to increase oil yield by up to three times compared to the other existing varieties [36]. Out of the top four ranked varieties of lemongrass, ‘Krishna’ is second for essential oil yield [9]. In India, the ‘Krishna’ variety can produce up to 300–369.00 q/ha fresh herb yield with 0.8–0.9% essential oil content, thus yielding 101.42 kg oil/ha containing 76–80% citral, an important medicinal component of lemongrass [37]. The lemongrass saplings were purchased from the Central Institute of Medicinal & Aromatic Plants, Lucknow (CSIR-CIMAP), Lucknow, India. The field was prepared following standard agronomic practices. The soil was prepared using recommended NPK doses for lemongrass (30:30:30) (National Horticulture Board, GOI) as basal dressing before planting saplings.
2.3. Experimental Design
The experiment was performed in specially designed open-top chambers (OTCs), with 1.5 m diameter and 1.8 m height that were connected with a high-speed blower (168 ls−1) maintaining the near natural environment. The other structural and functional aspects of the chamber were followed as per Tiwari et al. [38]. The experiment consisted of three O3 doses; ambient (AO), ambient + 15 ppb (EO1), and ambient + 30 ppb (EO2). Elevated O3 was provided via O3 generators (A1G, Faraday, India), attached to the high-speed blowers of the OTCs. O3 treatment was started 25 days after transplantation (DAT) and carried out between 10.00 and 15.00 h. until maturity
2.4. Ozone Monitoring
O3 concentrations were monitored for 8 h daily from 9.00 a.m. to 5.00 p.m. during the study period (Model APOA-370, HORIBA Ltd., Kyoto, Japan). O3 concentrations were measured via drawing air through a Teflon tube 0.35 cm in diameter, which was kept above the plant leaves inside the chamber. For each month of the experimental period, the AOT40 value was also calculated as per the formulae given by Mauzerall and Wang [39].
where, ‘i’ is the index, ‘CO3′ is the mean O3 concentration per hour ppb and ‘n’ designates the hours (in number) during which the O3 concentration was above 40 ppb/h.
2.5. Plant Sampling and Assessment of Plant Parameters
Leaf samples were randomly taken from OTCs with ambient and elevated O3 (EO1 and EO2) exposures for the estimation of different growth, biomass, physiological and biochemical parameters from each treatment after fumigation at 45 and 90 DAT (days after treatment).
2.5.1. Growth and Biomass Parameters
Triplicate plants with intact roots were randomly and carefully dug via digging a monolith of 10 × 10 × 25 cm3 from OTCs under ambient and elevated O3 exposures at 100 DAT (days after treatment). Several growth parameters such as root and shoot length, number of leaves, leaf area, root and shoot fresh weight and tillers were measured. Leaf area was measured using a portable leaf area meter (Model Li- 3100, Li-COR, Inc., Lincoln, NE, USA). For the estimation of dry weight, each plant was separated into the root, shoot and leaf and then kept in the oven (80 °C) until constant weights were achieved. Dry and fresh weight was determined, and the cumulative addition of all plant parts gave the total biomass as g plants−1. For the measurement of foliar injury percentage (FIP), triplicate plants were collected at 100 DAT from all treatment and the total area of leaves was estimated for all plants, with or without symptoms measured using a portable leaf area meter (LI 3000, LICOR Inc., USA). According to Mishra et al. [40], FIP was calculated using the following formula:
2.5.2. Biochemical Assays
Hydrogen Peroxide (H2O2), Superoxide Radicals (O2o−) and MDA Content
H2O2 content was estimated using the method given by Alexieva et al. [41]. Leaf samples homogenised with trichloroacetic acid (TCA) were treated with potassium phosphate buffer and potassium iodide solution sequentially. The absorbance of the reaction mixture was taken at 390 nm using a double-beam spectrophotometer (model 2203, Systronics, India). For estimation of O2o−, the method described by Elstner and Heupel [42] was used, with a few modifications. Lipid peroxidation was estimated in fresh leaves tissue in terms of malondialdehyde (MDA) content as described by the methodology of Heath and Packer [43].
Antioxidants and Metabolites
Enzymatic antioxidants activities, such as superoxide dismutase (SOD), glutathione reductase (GR), ascorbate peroxidase (APX) and catalase (CAT) enzymes, were evaluated as described by Fridovich [44], Anderson [45], Nakano and Asada [46] and Aebi [47], respectively. Non-enzymatic antioxidants, such as phenols [48], flavonoids [49], anthocyanin [50], proline [51], alkaloids [52], and ascorbic acid (AsA) [53] were quantified using the respective protocols.
ROS Scavenging Activity
For free-radical scavenging activities, such as 2,2-diphenyl-1-picrylhydrazyl (DPPH), 2,2′-azino-bis (3-ethylbenzothiazoline-6-sulfonic acid) diammonium salt (ABTS) and ferric reducing antioxidant power (FRAP), the radical scavenging assay followed the protocols of Noreen et al. [54], Khatua et al. [55] and Clarke et al. [56], respectively.
2.5.3. Measurement of Gas Exchange and Photochemical Efficiency
On three plants from each OTC, measurements in triplicate were carried out for gas exchange parameters, such as internal CO2 (iCO2), stomatal conductance (gs), transpiration rate (E), net photosynthesis rate (Ps), and water usage efficiency (WUE), at 65 DAT using Ciras-3 Portable Photosynthesis System (PP Systems, Haverhill, Amesbury, MA, USA) with 25 mm 97 mm size PLC3 universal leaf cuvette. The measured physiological characteristics were randomly studied on the third fully expanded leaf from each treatment plant, oriented to normal irradiation during cloud-free days. The portable photosynthetic system took measurements between 08:00 h and 10:00 h. During the measurements, photosynthetically active radiation (PAR) ranged between 1100 and 1200 μmol m−2s−1. The system was calibrated using a known CO2 source (509 ppm). Gas measurements were made at a constant flow rate (500 μmol s−1). Maximum photochemical efficiency of PSII (Fv/Fm) was measured after the initial 30 min dark-adapted leaves [57] using PAM-2500 WALZ (PAMWin-3 software), Germany.
2.5.4. Photosynthetic Pigments
For pigment contents (total chlorophyll and carotenoids) determination, 0.5 g of fresh leaves homogenized in 20 mL of 80% acetone were centrifuged for 15 min at 4032× g. Optical densities were taken at 645 nm and 663 nm wavelengths for chlorophyll a and b contents, respectively, and at 480 and 510 nm for carotenoid content using a double-beam spectrophotometer (Model-2203, Systronics, India). Chlorophyll and carotenoid content were estimated using the formulae developed by Takshak and Agrawal [58].
2.5.5. Isolation of Essential Oil
Fresh shoot samples of lemongrass were taken from OTCs under ambient and elevated O3 exposures, including control at 110 DAT following the formulae of Takshak and Agrawal [58] with some modifications. Triplicate samples were washed thoroughly with distilled water, chopped finely and processed via hydro distillation for four hours in a Clevenger-type apparatus [59]. After being extracted, the essential oil was separated, dried over anhydrous sodium sulphate, and refrigerated at 4 °C until analysis. The volume of essential oil obtained was estimated, and the percentage of oil content was measured using the weight of fresh shoot samples. The samples were further subjected to chemical characterization of essential oil analysed using GC–MS (gas chromatography–mass spectroscopy) (QP-2010, Shimadzu, Japan).
2.5.6. Extraction, Analysis, and Identification of Different Metabolites of Leaf
At 110 DAT, randomly selected leaves collected from OTCs under ambient and elevated O3 exposures, including control samples, were cut into small pieces and dried at room temperature (25–30 °C) in the shade. An electric grinder was utilized to crush the dried leaves to powder, and the leaves were soaked in 90% HPLC-grade methanol for 72 h with intermittent shaking [60] then filtered. Next, 10 mL supernatant was treated with 20 mL 0.5 N H2SO4. To make the solution alkaline, a few drops of NH4OH and further chloroform added; the solution was then properly mixed and kept at room temperature for 24 h for incubation. Two layers formed, among which the upper layer was discarded and the lower layer containing the majority of the phytoconstituents was concentrated to 2 mL through a cold rotavapor and subjected to GC–MS analysis [25].
2.6. GC–MS Conditions and Specifications
The leaf extracts and essential oil samples of all treatments were prepared and analyzed with the help of GC–MS (QP-2010, Shimadzu, Japan) with a capillary (30 m× 0.25 mm i.d. × 0.25 μm film thickness) column (Rtx-5Ms). Then, 1.0 μL leaves extracts or essential oil samples were injected into the system at 260 °C with helium gas as a carrier at a flow rate of 1.21 mL min−1. Initially, the temperature of the oven was set at 500 °C for 2 min, followed by an increment in temperature to 210 °C at a rate of 3 °C min−1 and a holding time of 2 min. This was again increased to 2800 °C at 80 °C min−1 and maintaining for 9 min, a pattern that remained until the end of the running program. The pressure of 73.3 kPa, total flow of 16.3 mL min−1, linear velocity of 3.0 mL min−1, and a split ratio of 10:0 was all maintained throughout GC. The operating values were as follows: ion source temperature, 230 °C; interference temperature, 270 °C; solvent cut time, 3.5 min; scan speed, 333 amu s−1; MS running time, 60.6 min; and threshold, 1000. The metabolites of the leaves extracts and essential oil samples were identified by comparing their retention indices and mass spectra fragmentation patterns with those compounds reported within libraries (NIST14, NIST14s, WILEY8, FFNSC, and SZTERP) using the GC–MS data system.
2.7. Identification of Different Metabolites of Leaf Extract and Essential Oil
The database of the National Institute of Standards and Technology, which contains more than 62,000 patterns, was used to identify the extracted metabolites. The spectra of unknown components were compared to known components contained in the WILEY and NIST libraries (WILEY8.LIB and NIST14.LIB), which provide the molecular weight, chemical structure, and molecular formula of the plant’s constituent parts.
2.8. Statistical Analysis
All statistical analyses were performed using the SPSS statistical package (SPSS Inc., version 16.0.0). Initially, the Shapiro–Wilk test was used to determine the normality of each dataset. The distribution was considered normal as, in every case, the p values were above 0.05 (level of significance). Further principal component analysis (PCA), regression method, different graphical representation and one-way ANOVA (analysis of variance) were used to test the effect of O3 on the physiological, biochemical, morphological and yield characteristics of medicinal plants. After subjecting to a one-way ANOVA test on physiological, biochemical, and morphological parameters, Duncan’s multiple range tests were performed as post hoc tests for various measurements. Each ANOVA was used to check the assumption of homoscedasticity. Sigma Plot 12.5 and GraphPad (Version 8.02) were used to plot the graphs and heatmaps. The percentage changes in all parameters were calculated with respect to control, i.e., AO. The PCA was performed using the correlation matrix, varimax rotation and regression method. All statistical analyses were performed using IBM SPSS/PC+ (ver. 25.0, x64).
3. Result
3.1. Ozone Monitoring and AOT 40
The ambient mean O3 concentration throughout the experimental period was found to be 46.69 ± 2.1 ppb at the experimental site, which is above the phytotoxic threshold level. The maximum observed ambient O3 concentration was 53.85 ± 1.5 ppb and the minimum was 38.22 ± 1.3 ppb (Figure 1). The AOT40 value calculated through daily mean 8 h O3 concentration during the experimental period (September to February) was 3606.43 ppb/h. In EO1 and EO2 exposure, mean 8 h O3 concentrations throughout the experimental period were observed to be 61.49 ± 1.5 ppb and 76.30 ± 3.4 ppb and AOT 40 values for these concentrations were observed to be 11,586.43 ppm/h and 19,566.43 ppm/h, respectively (Figure 1). The maximum value of AOT40 recorded in December was 6446.53 ppm/month.
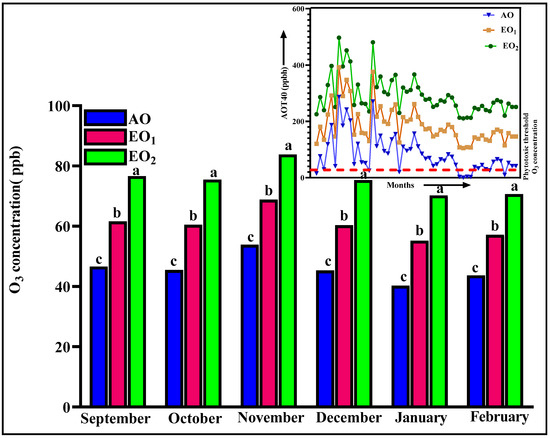
Figure 1.
Daily 8 h ambient and elevated O3 concentration and AOT40 during the experimental period at the experimental site. Bars represent mean values. Bars showing different letters indicate significant differences according to Duncan’s test at p < 0.05.
3.2. Gas Exchange and Chlorophyll Fluorescence
Significant variations of (−) 23.42, (−) 17.18, (+) 15.16, (+) 16.30 and (−) 18.63% were recorded for Ps, gs, iCO2, WUE and Fv/Fm, respectively, during EO1 treatment at 65 DAT (Figure 2). During EO2 treatment, Ps, gs, iCO2, WUE and Fv/Fm showed significant variations of (−)36.15, (−) 22.19, (+) 19.73, (+) 38.12 and (−) 24.63%, respectively (Figure 2).
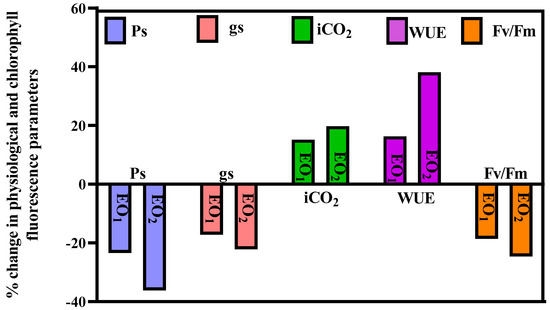
Figure 2.
Percent change in different physiological parameters of lemongrass grown at elevated ozone concentrations (EO1 and EO2) at 65 days after transplantation (DAT) (Ps = rate of photosynthesis; gs = stomatal conductance; iCO2 = internal CO2; WUE = water use efficiency; Fv/Fm = chlorophyll fluorescence).
3.3. Photosynthetic Pigments
Total leaf chlorophyll and carotenoid content decreased by 1.06 and 8.59% during EO1 treatment and by 35.97 and 25.08% during EO2 treatment, respectively, compared to the control (p < 0.05) at 45 DAT (Figure 3). At 90 DAT, reductions of 45.62 and 62.21% during EO1 treatment and 19.45 and 30.73% during EO2 treatment, were observed, as compared to the control, respectively (p < 0.05).
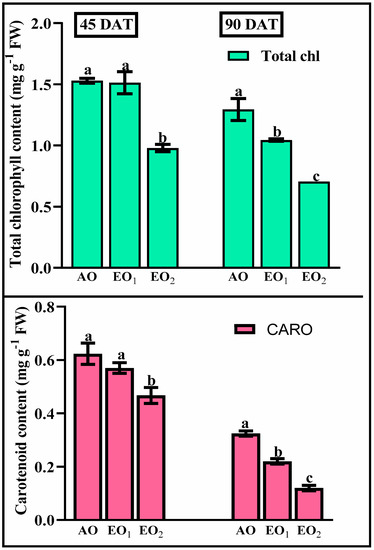
Figure 3.
Effect of ambient (AO) and elevated O3 (EO1 and EO2) on the responses of photosynthetic pigments of lemongrass at 45 and 90 days after transplantation (DAT). Bars represent mean ± SE. Bars with different letters in the same group show significant variation at p < 0.05.
3.4. Biochemical Assays
3.4.1. Hydrogen Peroxide (H2O2), Superoxide Radicals (O2o−) and MDA Contents
Significant increments in ROS and MDA contents were observed at elevated O3 concentrations during both the sampling stages. O2o− contents significantly increased by 10.32 and 13.76%, respectively during EO1 and EO2 treatments compared to the control at 45 DAT (Figure 4). At 90 DAT, O2o− contents did not show any significant variations. H2O2 contents significantly increased by 25.72 and 37.20% at 45 DAT and by 17.31 and 22.43% at 90 DAT during EO1 and EO2 treatments, respectively (Figure 4). MDA contents significantly increased by 22.37 and 30.16% at 45 DAT and by 13.17 and 17.16% at 90 DAT during EO1 and EO2 treatments, respectively (Figure 4).
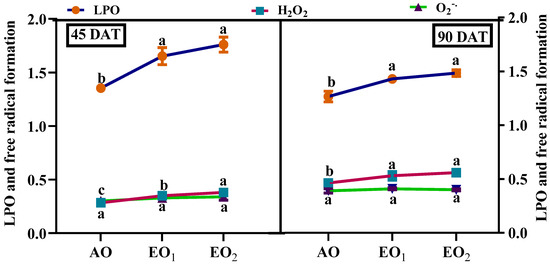
Figure 4.
Effect of ambient (AO) and elevated O3 (EO1 and EO2) on the H2O2 and O2− production and MDA content of lemongrass at 45 and 90 days after transplantation (DAT). Dots represent mean ± SE. Dots with different letters in the same group show significant variations at p < 0.05.
3.4.2. Antioxidants and Metabolites
SOD activity significantly decreased by 18.30 and 21.36% at 45 DAT, while SOD activity significantly increased by 17.93 and 20.76% at 90 DAT during EO1 and EO2 treatments, respectively (Figure 5). APX activity significantly decreased by 12.38 and 15.41% at 45 DAT, while it significantly increased by 11.07 and 13.61% at 90 DAT during EO1 and EO2 treatments, respectively, as compared to the control (Figure 5). CAT activity also significantly decreased by 11.01 and 13.22% at 45 DAT, while it significantly increased by 12.81 and 15.78% at 90 DAT during EO1 and EO2 treatments, respectively, as compared to the control (Figure 5). At 90 DAT, GR activity significantly varied during EO2 treatment compared to the control (Figure 5). Phenol content increased by 11.64 and 20.78% at 45 DAT and by 9.79 and 12.0% at 90 DAT. Flavonoid contents showed significant increments of 13.48 and 19.86% at 45 DAT and by 24.5 and 26.0% at 90 DAT during EO1 and EO2 treatments, respectively, as compared with the control (Figure 6). At 90 DAT, AsA contents were significantly reduced by 11.11 and 14.28% in the EO1 and EO2 treatments, respectively, as compared with the control (Figure 6). Similarly, proline decreased by 23.54 and 48.41% at 45 DAT and by 59.31 and 20.06% at 90 DAT during EO1 and EO2 treatments, respectively, as compared with the control (Figure 6). Anthocyanins significantly increased by 47.6 and 84.5% at 45 DAT and 18.77 and 49.56% at 90 DAT during EO1 and EO2 treatments, respectively, as compared with the control. Similarly, alkaloid contents significantly increased by 46.43 and 53.57% at 45 DAT and 44.77 and 57.89% at 90 DAT during EO1 and EO2 treatments, respectively, as compared with the control (Figure 6).
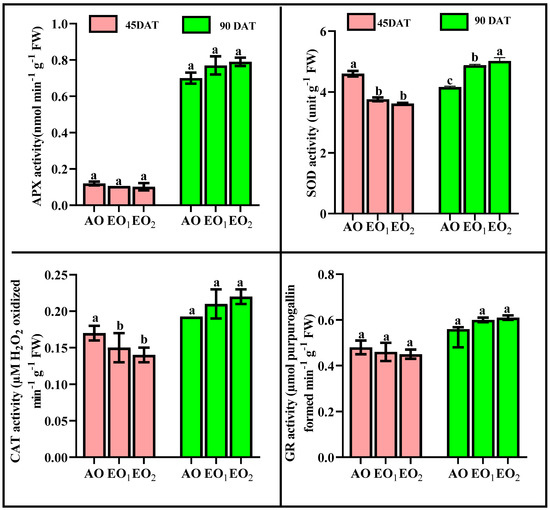
Figure 5.
Effect of ambient (AO) and elevated O3 (EO1 and EO2) on the responses of enzymatic antioxidants of lemongrass at 45 and 90 days after transplantation (DAT). Bars represent mean ± SE. Bars with different letters in the same group show significant variation at p < 0.05. (APX = ascorbate peroxidase; SOD = superoxide dismutase; CAT = catalase; GR = glutathione reductase).
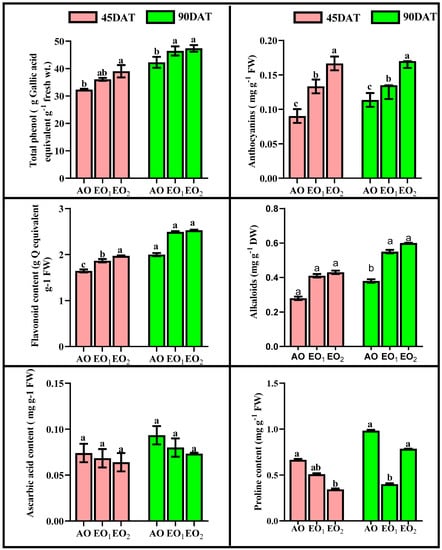
Figure 6.
Effect of ambient (AO) and elevated O3 (EO1 and EO2) on the responses of selected metabolites of lemongrass at 45 and 90 days after transplantation (DAT). Bars represent mean± SE. Bars with different letters in the same group show significant variation at p < 0.05.
3.4.3. ROS Scavenging Potential
DPPH significantly declined by 1.94 and 4.76% at 45 DAT and 8.59 and 26.56% at 90 DAT during EO1 and EO2 treatments, respectively, as compared with the control (Figure 7). FRAP also significantly declined by 6.69 and 7.60% at 45 DAT and 3.22 and 7.38% at 90 DAT, whereas ABTS significantly increased by 16.67 and 44.44% at 45 DAT and 17.29 and 32.00% at 90 DAT during EO1 and EO2 treatments, respectively, as compared with the control (Figure 7).
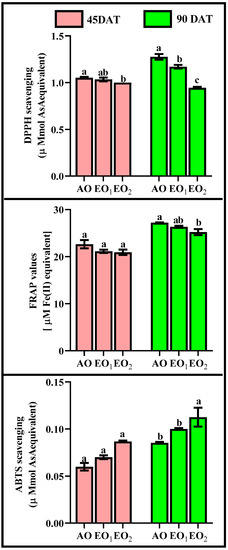
Figure 7.
Effect of ambient (AO) and elevated O3 (EO1 and EO2) on the ROS scavenging potential measured in terms of DPPH, FRAP and ABTS of lemongrass at 45 and 90 days after transplantation (DAT). Bars represent mean ± SE. Bars with different letters in the same group show significant variations at p < 0.05.
3.5. Morphological Parameters
At 100 DAT, the shoot length (SL) and root length (RL) of the plants were significantly decreased by 21.76, 26.14% and 9.07 and 11.11% due to EO1 and EO2 treatments, respectively, as compared to the control (Figure 8). At 100 DAT, number of leaves, number of tillages, and leaf area also showed significant reductions of 1.18 and 27.27%, respectively, during EO1 treatment, and 4.71 and 36.36%, respectively, during EO2 treatment, as compared to control (Figure 8). At 100 DAT, leaf area significantly reduced by 25.17 and 55.50% during EO1 and EO2 treatments, respectively, as compared with control (Figure 9). At 100 DAT, the estimated FIP values in mature leaves caused by EO1 and EO2 exposures were 68.09 and 124.12%, respectively, while 41.38% leaf injury was observed in plants grown under AO treatment (Figure 9). Total plant biomass significantly decreased by 7.11 and 36.52% at 100 DAT during EO1 and EO2 treatments, respectively, as compared with control (Figure 8).
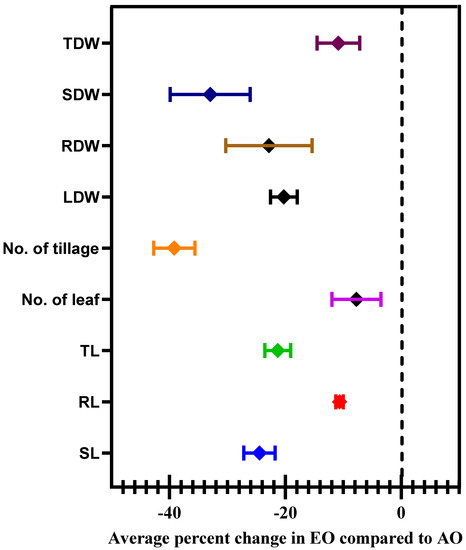
Figure 8.
Average percentage change in selected growth and morphological characteristics of lemongrass at 100 days after transplantation (DAT) grown at elevated ozone concentrations (EO1 and EO2). Symbols represent the mean of % change, and error bars are the 95% confidence interval.
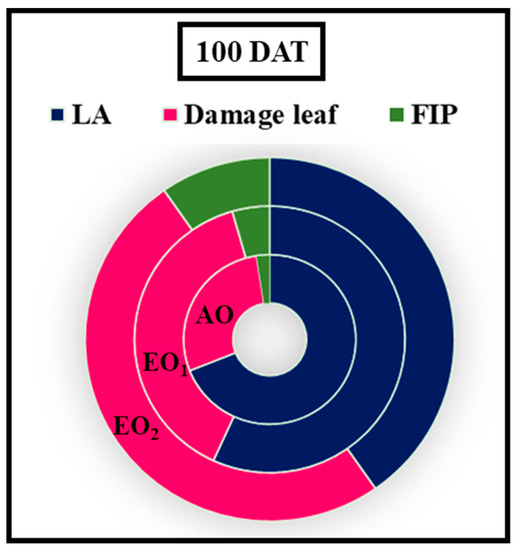
Figure 9.
Foliar injury percent (FIP) and leaf area of lemongrass at 100 days after transplantation (DAT) grown at elevated ozone concentrations (EO1 and EO2).
3.6. Effects on Metabolite Constituents in Leaves Extract and Essential Oil
Under EO1 and EO2 exposure, metabolites of both the leaf extract and essential oil of the test plants showed considerable variations as control (AO) leaf extract and essential oil. At 110 DAT, 54, 41 and 53 metabolites in leaf extracts, and 25, 26 and 33 metabolites were present in essential oil under AO, EO1 and EO2, respectively, (Figure 10). The variations in the composition of some pharmacologically important compounds are shown in Figure 11 and Figure 12 (Supplementary Tables S1 and S2). In AO leaf extract, out of 54 metabolites—2,6-octadien-1-ol, 3,7-dimethyl-, (E) (3.59%), geranyl acetate (4.62%), naphthalene (4.89%), 1,2,3,4,4a,5,6,8a-octahydro-7-methyl-4-methylene-1-(1-methylethyl)-, (1. α),neophytadiene (3.9%), hexane, 1-bromo-6-chloro-(3.05%), palmitic acid (4.94%), geranyl linolenate (10.87%), geranyl linoleate (6.99%), lanosterol (4.33%), d:c-friedo-b’:a’-neogammacer-9(11)-ene, and 3-methoxy-, (3. β.) (3.37%)—some had a maximum % concentration (Figure 11). On the other hand, some metabolites—neophytadiene (3.38%), glutaric acid, myrtenyl 3-methylbut-2-en-1-yl ester (4.43%), 6-Methyl-4,6-bis(4-methylpent-3-en-1-yl)cyclohexa-1,3-dienecarbaldehyde (7.63%), trans-p-mentha-2,8-dienol (3.87%), geranyl linoleate (6.83%), geranyl linolenate (8.33%) lanosterol (5.73%), and D:C-Friedo-B’:A’-neogammacer-9(11)-ene, 3-methoxy-, (3.b β.) (5.97%)—showed higher % concentration during EO1 exposure (Figure 11, Supplementary Table S1). Out of 53 metabolites, 13 metabolites—β-Citral (11.71%), geranyl acetate, (12.16%), 2,6 octadien-1-ol,3,7-dimethyl-, acetate (9.14%), Cadinene < γ> (5.78%), 6-methyl-4,6-bis(4-methylpent-3-en-1-yl)cyclohexa-1,3-dienecarbaldehyde (6.27%), palmitic acid(5.31%), geranyl linoleate (6.75%), geranyl linolenate (8.18%), and lanosterol (9.14%)—showed higher% concentrations in EO2 exposure (Figure 11, Supplementary Table S1). In the case of essential oil, citral is the principal active compound and its concentration determines the quality of the oil. A remarkably high percentage of neral and geranial was found in the oil due to AO, EO1 and EO2 exposure. The increases in the concentration (%) of Geranial (C10H16O) contents by 36.7, 37.66, and 39.21% and neral (C10H16O) contents by 31.33, 36.23 and 38.42% were caused by AO, EO1 and EO2 exposure, respectively (Figure 12, Supplementary Table S2). Some of the metabolites such as isogeranial, geranyl acetate, geranyl linalool decreased during EO1 treatment and increased during EO2 exposure compared to AO exposure. On the other hand, limonene and tetradec-(7Z)-en-2-one levels increased during EO1 treatment but decreased during EO2 treatment, and neral, decanal, caryophyllene <(E)-> and cadinene < γ-> increased. Some important metabolites such as caryophyllene oxide and geraniol decreased during O3 exposure in essential oil. Some metabolites were detected only under AO conditions—(2,2-dimethylocta-3,4-dienal, citronellal and cubebol), EO1 (bisabolene < (E)- γ- >, α-ylangene, humulene < α>, germacrene D, bisabolene < (E)- γ- > and cuparene) and EO2 (cubebanol, germacrene a, bisabolene < (Z)-, γ->, cadina-1,4-diene <trans->, and epicubenol exposure. Similarly, 2,3-dehydro-1,8-cineole and cadinene < δ> increased in both EO1 and EO2 exposure (Figure 12, Supplementary Table S2). Details of variations in the contents of different metabolites during different O3 treatments are shown in the supplementary data (Supplementary Tables S1 and S2), along with the IUPAC names and the chemical structures of the different metabolites (Supplementary Table S3).
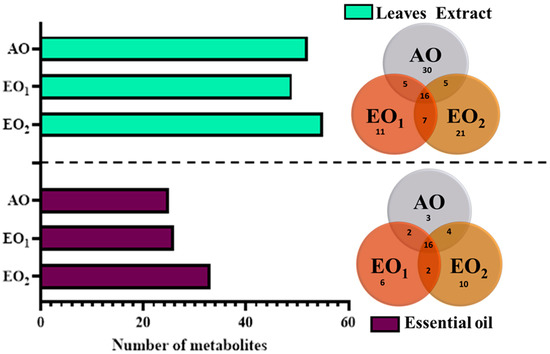
Figure 10.
Number of metabolites observed via GC–MS analysis in ambient (AO) and elevated O3 (EO1 and EO2) in lemongrass at 110 days after transplantation (DAT). The Venn diagram shows the number of common and uncommon metabolites at different treatments.
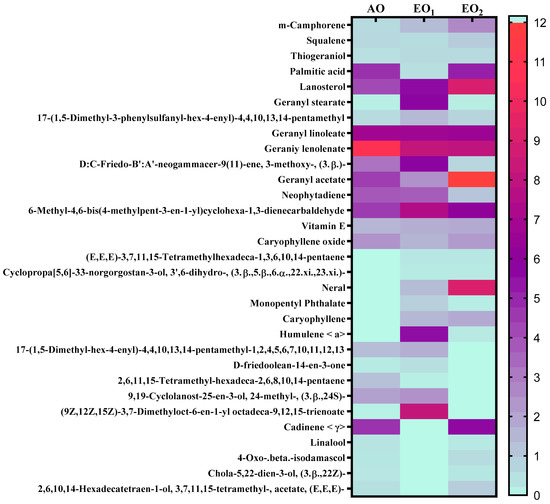
Figure 11.
Heatmap showing variations in the percentage retention peak area in the contents of common metabolites observed in leaf extracts of lemongrass via GC–MS analysis, 110 days after transplantation (DAT) at ambient (AO) and elevated O3 (EO1 and EO2) treatments. Red shows the higher percentage retention peak area, purple represents medium percentage retention peak area, and light sea green represents the lower percentage retention peak area. Legend numbers represent the gradients of the retention peak area.
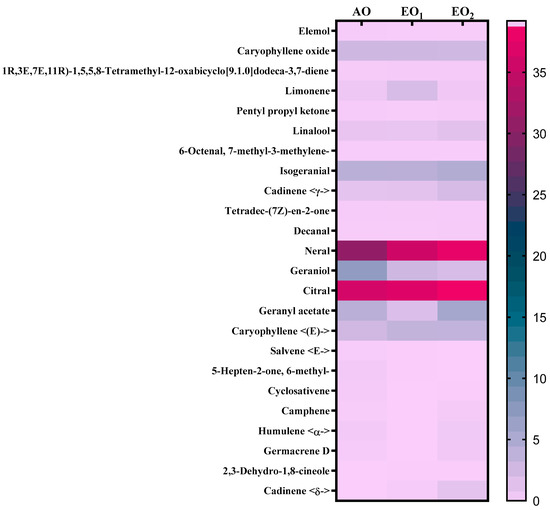
Figure 12.
Heatmap showing the variations in percentage retention peak area in the contents of common metabolites observed in the essential oil of lemongrass via GC–MS analysis at 110 days after transplantation (DAT) at ambient (AO) and elevated O3 (EO1 and EO2) treatments. Pink shows the higher percentage retention peak area, teal blue represents a medium percentage retention peak area and purple represents a lower percentage retention peak area. Legend numbers represent the gradient of retention peak area.
4. Discussion
The present experimental site is well marked by a high concentration of O3 as evidenced by a number of previous studies [1,61,62,63]. The present study reported 8 h average O3 concentration of 46.69 ± 2.1 ppb, high enough to cause noticeable damage to the plants. In the present experiment, the negative effects of O3 are clearly demonstrated in the biochemical and physiological responses of lemongrass. The first indicator of O3-induced biochemical damage is the increased concentration of malonaldehyde (MDA), which acts as a marker of oxidative stress in plants [4,27,58,62]. Increased malonaldehyde content in O3-exposed plants is a result of lipid peroxidation, which suggests a disruption in plasma membrane permeability leading to an unbalance in disrupted cellular homeostasis [64]. Enhanced lipid peroxidation is attributed to the stimulated production of reactive oxygen species (ROS) such as O2−0 and H2O2 [65] at high O3 concentrations. It was observed that, in the present study, the magnitude of lipid peroxidation and ROS production increased with increasing O3 concentration, signifying higher oxidative stress at higher O3 (AO < EO1 < EO2) concentrations. The PCA (Figure 13) also indicated a strong positive correlation of LPO and ROS with O3 concentrations. Upon O3 exposure, the increased concentration of MDA contents and ROS, have been commonly reported in earlier studies [17,65,66,67,68,69]. Higher plants sustain an efficient enzymatic and non-enzymatic antioxidant pool to cope with O3-induced stress. In the present study, it was observed that enzymatic antioxidants decreased during the first sampling, while they increased during the second sampling in EO1 and EO2 ozone concentrations compared to AO. This suggests that the ROS scavenging mechanism was more efficient during the later stage of plant development. The variability in enzymatic responses at different developmental stages was also observed in cotton, where a lesser heterogeneity was recorded at the later sampling stage [70]. In the present study, the discrepancy of enzymatic response at different developmental stages in EO1 and EO2 plants can be well-correlated to the respective ROS contents. Whereas SOD catalyses the dismutation of O2−0 and H2O2, APX and CAT are responsible for scavenging H2O2 [18,71,72]. Non-significant variations in O2−0 accompanied by an increase in H2O2 contents demonstrate the rapid activity of SOD. The present study shows a reduction in ascorbate content at both sampling stages, which indicates its poor regeneration capacity. This observation can be linked to the inefficient upregulation of GR, pointing towards its more sensitive nature towards O3 stress [18]. The loading values of PCA for enzymatic antioxidants also supports this discussion (Figure 13). Notably, a higher increase in the enzyme activity was observed during the second sampling of the EO1 and EO2 treatments, as compared to AO treatments, suggesting an efficient stimulation of the defence machinery of lemongrass to combat the O3 stress at a later developmental stage. The incitement of antioxidant enzymes has also been reported in wheat [17,62], cotton [70], bean [65] and castor [66]. However, in this study, constitutive levels of enzymatic antioxidants were always higher at first sampling stage compared to the second sampling stage in all the treatments, suggesting their utilization of resources in other metabolic pathways during the later developmental stage. The response of DPPH, FRAP and ABTS also indicate the balance between the ROS generation and antioxidative scavenging in plants during EO1 and EO2 treatments.
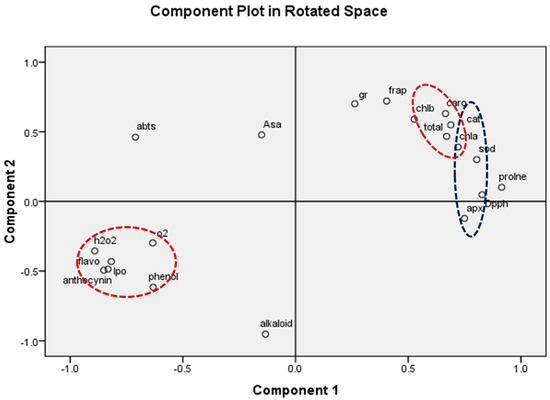
Figure 13.
Principal component analysis (PCA) showing the effect of ambient (AO) and elevated O3 (EO1 and EO2) on considered biochemical parameters of lemongrass. The parameters studied are total Chl (total chlorophyll), Caro (carotenoids), AsA (ascorbic acid), phenol, flavonoid, DPPH, ABTS, FRAP, alkaloid, proline, anthocyanin, APX (ascorbate peroxidase), GR (glutathione reductase), SOD (superoxide dismutase), catalase (CAT), lipid peroxidation (LPO), H2O2 (hydrogen peroxide) and SOR (superoxide radical) Red dotted circles showed the synchronization of H2O, SOR, LPO, anthocyanin phenol, flavonoid, Caro, and total Chl. Similarly blue dotted circles showed the synchronization of APX, DPPH, CAT and SOD parameters.
O3 stress in plants was visibly evident via the foliar injury in the leaves of lemongrass grown during EO1 and EO2 treatments. However, no visible injury was reported in plants at ambient O3. In the present study, the recorded FIP was 68.09 and 124.12% for EO1 and EO2 O3 treatments compared to AO. Leaf injury at elevated O3 concentrations is an important parameter as it results in the impairment of photosynthesis via the destruction of photosynthetic pigments. Carotenoids, proline and anthocyanins act as a quencher of ROS and function as antioxidants to protect chlorophyll molecules from photo-oxidative damage. The decline in these contents causes more damage to photosynthetic pigments. In the present study, the reduction in Ps was accompanied by a decline in gs in plants grown at elevated O3 as compared to AO, which is considered to be an adaptive feature to minimise the entry of O3 plants [73]. During stress, imbalanced osmotic solute disturbs the K+ flux from guard cells, resulting in the modification of guard cell turgidity and stomatal aperture [74]. A simultaneous decrease in Ps and gs in response to O3 stress has also been reported in many other studies [64,65,75,76]. The increase in iCO2 during EO1 and EO2 treatments can be correlated with reduced Ps due to damage to photosynthetic machinery [76]. The impediment of photosynthesis is further strengthened by the reduction in Fv/Fm ratio at EO1 and EO2 treatments, as compared to AO, as recorded in the present study. Fv/Fm represents the photochemical efficiency of PS II, and its reduction under elevated O3 treatments can be considered an important indicator of O3-induced photoinhibition due to deactivation of PS II. The disrupted functioning of PS II further enhances ROS generation during light-dependent activities of photosynthesis, thus resulting in damaged thylakoids and the inactivation of the enzymes of the Calvin cycle [76,77]. The present study depicts a significant reduction in leaf number and area, which clearly invigorates the negative effect of O3 on plants’ assimilation capacity. Elevated O3 results in the production of thinner leaves and hampers the formation of new leaves, which explains the reduction in plant biomass [78]. The decline in plant biomass at elevated O3 conditions is widely cited in numerous studies [4,61,62].
Secondary metabolite contents are an important constituent of the lemongrass, and are known to provide protection against O3-induced oxidative stress in plants [79,80]. Metabolites, such as phenolics, ascorbate and flavonoids, form an important defence line in plants, directly scavenging O3-related ROS [81]. Increments in the secondary metabolite contents under elevated O3 divert resources towards the shikimate–phenylpropanoid pathway. In the present study, the increase in flavonoid contents suggests that flavonoid biosynthesis genes were upregulated in plants under O3 stress conditions, thereby assisting the amelioration of ROS toxicity [64]. The GCMS data of the foliar extract and essential oil clearly demonstrate a huge heterogeneity in the composition and contents of the metabolites recorded at elevated O3 treatments, as compared to AO. In our study, the leaf extract showed 11 and 21 new compounds, while 6 and 10 new compounds were reported from essential oils during EO1 and EO2 treatments, respectively, as compared to the control (AO treatment) (Figure 14 and Figure 15). Although the foliar extract showed a reduction in the number of metabolites during EO treatments compared to AO, increments in the contents of many terpenes—such as camphorene (1.54 and 2.81%), geranyl acetate (6.11 and 12.16%), lanosterol (5.73 and 9.14%) and caryophyllene (1.65 and 2.01%)—were recorded (Figure 14; Supplementary Table S1). In addition, a few new compounds such as stearaldehyde (Octadecanal), steroids (stigmasterol, cholest-8-en-3-ol, ergost-5-en-3-ol), and polyphenolics (licarin A) were observed in the foliar extract of plants grown at elevated O3 (Figure 14; Supplementary Table S1). The increase in metabolite contents in plants during stress conditions were reported in earlier studies [25,60,82,83]. Caryophyllene, a sesquiterpene used in the treatment of osteroartheritis, diabetes and anxiety, has been reported to increase in Sida cordifolia [25], Artemisia annua [84] and Zea mays [85]. However, no change in the concentration of secondary metabolites was reported under stress conditions by Valkama et al. [86]. In the present study, the essential oils of O3-exposed plants also showed the appearance of new sesquiterpenes such as ylanglene, bisbolene, cuparene, epicubenol, and p-Menth-3-en-9-ol etc, which remarkably increased the medicinal properties of the essential oil (Figure 15). The modifications in the secondary metabolite profile of lemongrass upon O3 exposure can be explained by the upregulation of the genes associated with shikimate–phenylpropanoid pathway [87]. Being ubiquitous in plants, the compounds of the phenylpropanoid pathway have higher antioxidative properties, thereby ensuring an efficient scavenging of O3-generated ROS [88]. When plants are under abiotic stress such as O3, the shikimic–acid pathway is stimulated, which frequently results in the production of new metabolic compounds [89,90]. The appearance of new terpenoids in essential oils of plants treated with elevated O3 not only strengthens the plant’s defence, but also invigorates their medicinal value (Figure 15). Ylanglene shows anti-microbial and anti-diabetic activity, while bisbolene has anti-cancer properties. Cuparene is effective for regulating immunity and improving memory and epicubenol is helpful in the treatment of Alzheimer’s disease [91,92].
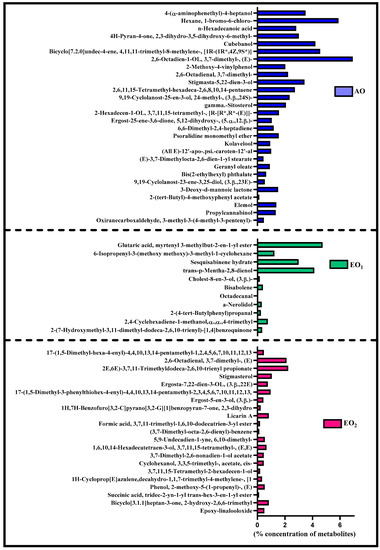
Figure 14.
Number of uncommon * metabolites observed in leaf extract of lemongrass through GC–MS analysis at 110 days after transplantation (DAT) at ambient (AO) and elevated O3 (EO1 and EO2) treatments. * Metabolites present either in ambient (AO) or elevated O3 (EO1/EO2) treatments, specifically in the leaf extract.
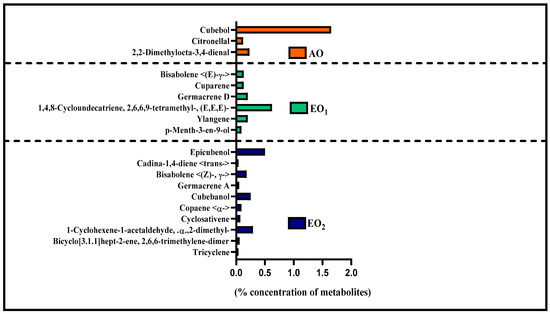
Figure 15.
Number of uncommon metabolites observed in the essential oil of lemongrass through GC–MS analysis at 110 days after transplantation (DAT) at ambient (AO) and elevated O3 (EO1 and EO2) treatments. Metabolites present either in ambient (AO) or elevated O3 (EO1/EO2) treatments, specifically in the essential oil.
5. Conclusions
The elevated O3 inflicted significant negative responses in lemongrass, manifested in form of greater leaf injury, curtailed carbon fixation, and reduced plant biomass. The stimulation of enzymatic and non-enzymatic antioxidants was successful in scavenging O3-generated ROS to some extent. The magnitude of the response, however, was more at elevated O3 concentrations. The results of the study clearly depict that SOD was more responsive towards elevated O3 stress, whereas GR was not able to up regulate its activity, thereby affecting the AsA regeneration potential of the plant. It was further observed that the antioxidant system was more receptive during the later developmental stage, at both O3 concentrations. The reduction in biomass accompanied by the increase in the number of metabolites in leaf extract and essential oils suggest that plants are allocating more resources towards the phenylpropanoid pathway. O3 exposure not only resulted in and increased production of important metabolic compounds, it also induced the formation of new compounds, such as cuparene, bisbolene, epicubenol, in the essential oils, thus enhancing the medicinal properties and uses of lemongrass. Our results regarding the medicinal values of lemongrass, which will be prone to high O3 concentrations in the coming years, can be exploited by the pharmaceutical sectors.
Supplementary Materials
The following supporting information can be downloaded at: https://www.mdpi.com/article/10.3390/metabo13050597/s1, Table S1: Variation in the metabolic profile of leaf extract due to the EO exposure in Cymbopogon flexuosus; Table S2: Variation in the metabolic profile of essential oil due to the EO exposure in Cymbopogon flexuosus and Table S3: The IUPAC name and chemical structure of different compounds obtained by GC- MS in Cymbopogon flexuosus.
Author Contributions
P.M.: Conceptualization, Visualization, Methodology, Writing—Original Draft Preparation. G.S.G.: Formal Analysis, Validation. A.S.: Writing—Review S.T.: Resources, Visualization, Writing—Review and Editing and Supervision. All authors have read and agreed to the published version of the manuscript.
Funding
Authors received financial support in the form of a Senior Research Fellowship (SRF) from the UGC (University Grant Commission: 190510043902) and CSIR (Council of Scientific and Industrial Research) for this experiment.
Institutional Review Board Statement
Not applicable.
Informed Consent Statement
Not applicable.
Data Availability Statement
The data presented in this study are available in article and supplementary material.
Acknowledgments
The authors are thankful to the Head of the Department of Botany and coordinators of Center of Advanced Study (CAS), Banaras Hindu University, for providing the necessary research facilities. We are thankful to the Central Institute of Medicinal & Aromatic Plants, Lucknow (CSIR-CIMAP), Lucknow, India for providing slips of lemongrass and Advanced Instrumentation Research Facility (AIRF), Jawaharlal Nehru University for GC–MS analysis. The Institute of Eminence (IoE) grant is acknowledged for financial assistance for the project. PM, GSG and AS are thankful to UGC and CSIR, respectively for providing financial support in the form of Senior Research Fellowship to authors.
Conflicts of Interest
The authors declare no conflict of interest.
References
- Tiwari, S.; Rai, R.; Agrawal, M. Annual and seasonal variations in tropospheric ozone concentrations around Varanasi. Int. J. Remote Sens. 2008, 29, 4499–4514. [Google Scholar] [CrossRef]
- Harmens, H.; Hayes, F.; Sharps, K.; Radbourne, A.; Mills, G. Can reduced irrigation mitigate ozone impacts on an ozone-sensitive African wheat variety. Plants 2019, 8, 220. [Google Scholar] [CrossRef] [PubMed]
- IPCC. Climate change 2007: The physical science basis. In Contribution of Working Group I to the Fourth Assessment Report of the Intergovernmental Panel on Climate Change; Solomon, S., Qin, D., Manning, M., Eds.; Cambridge University Press: Cambridge, UK, 2007. [Google Scholar]
- Ansari, N.; Yadav, D.S.; Agrawal, M.; Agrawal, S.B. The impact of elevated ozone on growth, secondary metabolites, production of reactive oxygen species and antioxidant response in an anti-diabetic plant Costus pictus. Funct. Plant Biol. 2021, 48, 597–610. [Google Scholar] [CrossRef] [PubMed]
- Manisalidis, I.; Stavropoulou, E.; Stavropoulos, A.; Bezirtzoglou, E. Environmental and health impacts of air pollution: A review. Front. Public Health 2020, 8, 14. [Google Scholar] [CrossRef] [PubMed]
- Madheshiya, P.; Gupta, G.S.; Sahoo, A.; Tiwari, S. Biomonitoring tools and bioprogramming: An overview. In New Paradigms in Environmental Biomonitoring Using Plants; Elsevier: Amsterdam, The Netherlands, 2022; pp. 341–366. [Google Scholar] [CrossRef]
- Sicard, P.; Anav, A.; de Marco, A.; Paoletti, E. Projected global ground-level ozone impacts on vegetation under different emission and climate scenarios. Atmos. Chem. Phys. 2017, 17, 12177–12196. [Google Scholar] [CrossRef]
- Kumari, S.; Lakhani, A.; Kumari, K.M. First observation-based study on surface O3 trend in Indo-Gangetic Plain: Assessment of its impact on crop yield. Chemosphere 2020, 255, 126972. [Google Scholar] [CrossRef]
- Kumar, A.; Jnanesha, A.C.; Lal, R.K. Coppicing impact on the essential oil yield and its chemical composition of lemongrass cultivars of the genus Cymbopogon under the semi-arid region of South India. Acta Ecol. Sin. 2023, 43, 20–26. [Google Scholar] [CrossRef]
- Ojha, N.; Pozzer, A.; Rauthe-Schöch, A.; Baker, A.K.; Yoon, J.; Brenninkmeijer, C.A.; Lelieveld, J. Ozone and carbon monoxide over India during the summer monsoon: Regional emissions and transport. Atmos. Chem. Phys. 2016, 16, 3013–3032. [Google Scholar] [CrossRef]
- Mukherjee, A.; Yadav, D.S.; Agrawal, S.B.; Agrawal, M. Ozone a persistent challenge to food security in India: Current status and policy implications. Curr. Opin. Environ. Sci. Health 2021, 19, 100220. [Google Scholar] [CrossRef]
- Boleti, E.; Hueglin, C.; Grange, S.K.; Prévôt, A.S.; Takahama, S. Temporal and spatial analysis of ozone concentrations in Europe based on timescale decomposition and a multi-clustering approach. Atmos. Chem. Phys. 2020, 20, 9051–9066. [Google Scholar] [CrossRef]
- Mitchell, M.; Wiacek, A.; Ashpole, I. Surface ozone in the North American pollution outflow region of Nova Scotia: Long-term analysis of surface concentrations, precursor emissions and long-range transport influence. Atmos. Environ. 2021, 261, 118536. [Google Scholar] [CrossRef]
- Cooper, O.R.; Parrish, D.D.; Ziemke, J.; Balashov, N.V.; Cupeiro, M.; Galbally, I.E.; Gilge, S.; Horowitz, L.; Jensen, N.R.; Lamarque, J.F.; et al. Global distribution and trends of tropospheric ozone: An observation-based review Global distribution and trends of tropospheric ozone. Elem. Sci. Anthr. 2014, 2, 000029. [Google Scholar] [CrossRef]
- Tiwari, S.; Agrawal, M. Tropospheric Ozone and Its Impacts on Crop Plants; Springer International Publishing AG: Berlin, Germany, 2018; Volume 1007. [Google Scholar]
- Zhan, Y.; Luo, Y.; Deng, X.; Grieneisen, M.L.; Zhang, M.; Di, B. Spatiotemporal prediction of daily ambient ozone levels across China using random forest for human exposure assessment. Environ. Pollut. 2018, 233, 464–473. [Google Scholar] [CrossRef] [PubMed]
- Fatima, A.; Singh, A.A.; Mukherjee, A.; Agrawal, M.; Agrawal, S.B. Variability in defence mechanism operating in three wheat cultivars having different levels of sensitivity against elevated ozone. Environ. Exp. Bot. 2018, 155, 66–78. [Google Scholar] [CrossRef]
- Gupta, G.S.; Tiwari, S. Role of antioxidant pool in management of ozone stress through soil nitrogen amendments in two cultivars of a tropical legume. Funct. Plant Biol. 2020, 48, 371–385. [Google Scholar] [CrossRef]
- Hassan, A. Effects of mineral nutrients on physiological and biochemical processes related to secondary metabolites production in medicinal herbs. Med Arom Plant Sci Biotechnol. 2012, 6, 105. [Google Scholar]
- Elshafie, H.S.; Camele, I.; Mohamed, A.A. A Comprehensive Review on the Biological, Agricultural and Pharmaceutical Properties of Secondary Metabolites Based-Plant Origin. Int. J. Mol. Sci. 2023, 24, 3266. [Google Scholar] [CrossRef]
- George, B.P.; Chandran, R.; Abrahamse, H. Role of phytochemicals in cancer chemoprevention: Insights. Antioxidants 2021, 10, 1455. [Google Scholar] [CrossRef]
- Sharma, A. Gene expression analysis in medicinal plants under abiotic stress conditions. In Plant Metabolites and Regulation under Environmental Stress; Academic Press: Cambridge, MA, USA, 2018; pp. 407–414. [Google Scholar] [CrossRef]
- Bortolin, R.C.; Caregnato, F.F.; Junior, A.M.; Zanotto-Filho, A.; Moresco, K.S.; de Oliveira Rios, A.; de Oliveira Salvi, A.; Ortmann, C.F.; de Carvalho, P.; Reginatto, F.H.; et al. Chronic ozone exposure alters the secondary metabolite profile, antioxidant potential, anti-inflammatory property, and quality of red pepper fruit from Capsicum baccatum. Ecotoxicol. Environ. Saf. 2016, 129, 16–24. [Google Scholar] [CrossRef]
- Pant, P.; Pandey, S.; Dall’Acqua, S. The influence of environmental conditions on secondary metabolites in medicinal plants: A literature review. Chem. Biodivers. 2021, 18, e2100345. [Google Scholar] [CrossRef]
- Ansari, N.; Agrawal, M.; Agrawal, S.B. An assessment of growth, floral morphology, and metabolites of a medicinal plant Sida cordifolia L. under the influence of elevated ozone. Environ. Sci. Pollut. Res. 2021, 28, 832–845. [Google Scholar] [CrossRef] [PubMed]
- Kumar, I.; Sharma, R.K. Production of secondary metabolites in plants under abiotic stress: An overview. Significances Bioeng. Biosci. 2018, 2, 196–200. [Google Scholar] [CrossRef]
- Ainsworth, E.A. Understanding and improving global crop response to ozone pollution. Plant J. 2017, 90, 886–897. [Google Scholar] [CrossRef] [PubMed]
- Singh, S.; Singh, P.; Agrawal, S.B.; Agrawal, M. Use of Ethylenediurea (EDU) in identifying indicator cultivars of Indian clover against ambient ozone. Ecotoxicol. Environ. Saf. 2018, 147, 1046–1055. [Google Scholar] [CrossRef]
- Dumont, J.; Keski-Saari, S.; Keinänen, M.; Cohen, D.; Ningre, N.; Kontunen-Soppela, S.; Baldet, P.; Gibon, Y.; Dizengremel, P.; Vaultier, M.N.; et al. Ozone affects ascorbate and glutathione biosynthesis as well as amino acid contents in three Euramerican poplar genotypes. Tree Physiol. 2014, 34, 253–266. [Google Scholar] [CrossRef] [PubMed]
- Ashraf, M.A.; Iqbal, M.; Rasheed, R.; Hussain, I.; Riaz, M.; Arif, M.S. Environmental stress and secondary metabolites in plants: An overview. In Plant Metabolites and Regulation under Environmental Stress; Academic Press: Cambridge, MA, USA, 2018; pp. 153–167. [Google Scholar] [CrossRef]
- Ali, M.; Khan, T.; Fatima, K.; Ali, Q.U.; Ovais, M.; Khalil, A.T.; Ullah, I.; Raza, A.; Shinwari, Z.K.; Idrees, M. Selected hepatoprotective herbal medicines: Evidence from ethnomedicinal applications, animal models, and possible mechanism of actions. Phytother. Res. 2018, 32, 199–215. [Google Scholar] [CrossRef]
- Haque, A.N.; Remadevi, R.; Naebe, M. Lemongrass (Cymbopogon): A review on its structure, properties, applications and recent developments. Cellulose 2018, 25, 5455–5477. [Google Scholar] [CrossRef]
- Mukarram, M.; Choudhary, S.; Khan, M.A.; Poltronieri, P.; Khan, M.M.; Ali, J.; Kurjak, D.; Shahid, M. Lemongrass essential oil components with antimicrobial and anticancer activities. Antioxidants 2021, 11, 20. [Google Scholar] [CrossRef]
- Choudhary, S.; Zehra, A.; Mukarram, M.; Wani, K.I.; Naeem, M.; Khan, M.M.; Aftab, T. Salicylic acid-mediated alleviation of soil boron toxicity in Mentha arvensis and Cymbopogon flexuosus: Growth, antioxidant responses, essential oil contents and components. Chemosphere 2021, 276, 130153. [Google Scholar] [CrossRef]
- Joy, P.P.; Skaria, B.P.; Mathew, S.; Mathew, G.; Joseph, A.; Sreevidya, P.P. Lemongrass. Ind. J. Arecanut Spices Medicin. Plants 2006, 2, 55–64. [Google Scholar]
- Bahl, J.R.; Singh, A.K.; Lal, R.K.; Gupta, A.K. High-yielding improved varieties of medicinal and aromatic crops for enhanced income. In New Age Herbals: Resource, Quality and Pharmacognosy; Springer: Berlin/Heidelberg, Germany, 2018; pp. 247–265. [Google Scholar]
- Lal, R.K. Stability for oil yield and variety recommendations’ using AMMI (additive main effects and multiplicative interactions) model in Lemongrass (Cymbopogon species). Ind. Crops Prod. 2012, 40, 296–301. [Google Scholar] [CrossRef]
- Tiwari, S.; Agrawal, M.; Marshall, F.M. Evaluation of ambient air pollution impact on carrot plants at a sub urban site using open top chambers. Environ. Monit. Assess. 2006, 119, 15–30. [Google Scholar] [CrossRef] [PubMed]
- Mauzerall, D.L.; Wang, X. Protecting agricultural crops from the effects of tropospheric ozone exposure: Reconciling science and standard setting in the United States, Europe, and Asia. Annu. Rev. Energy Environ. 2001, 26, 237–268. [Google Scholar] [CrossRef]
- Mishra, A.K.; Rai, R.; Agrawal, S.B. Differential response of dwarf and tall tropical wheat cultivars to elevated ozone with and without carbon dioxide enrichment: Growth, yield and grain quality. Field Crops Res. 2013, 145, 21–32. [Google Scholar] [CrossRef]
- Alexieva, V.; Sergiev, I.; Mapelli, S.; Karanov, E. The effect of drought and ultraviolet radiation on growth and stress markers in pea and wheat. Plant Cell Environ. 2001, 24, 1337–1344. [Google Scholar] [CrossRef]
- Elstner, E.F.; Heupel, A. Inhibition of nitrite formation from hydroxyl ammonium chloride: A simple assay for superoxide dismutase. Anal. Biochem. 1976, 70, 616–620. [Google Scholar] [CrossRef]
- Heath, R.L.; Packer, L. Photoperoxidation in isolated chloroplasts: I. Kinetics and stoichiometry of fatty acid peroxidation. Arch. Biochem. Biophys. 1968, 125, 189–198. [Google Scholar] [CrossRef]
- Fridovich, I. Superoxide dismutases. Adv. Enzymol. Relat. Areas Mol. Biol. 1974, 41, 35–97. [Google Scholar]
- Anderson, M.E. Glutathione. In Free Radicals: A practical Approach; Punchard, N.A., Kelly, F.J., Eds.; Oxford University Press: Oxford, UK, 1996; pp. 213–226. [Google Scholar]
- Nakano, Y.; Asada, K. Hydrogen peroxide is scavenged by ascorbate-specific peroxidase in spinach chloroplasts. Plant Cell Physiol. 1981, 22, 867–880. [Google Scholar] [CrossRef]
- Aebi, H. [13] Catalase in vitro. In Methods in Enzymology; Academic Press: Cambridge, MA, USA, 1984; Volume 105, pp. 121–126. [Google Scholar] [CrossRef]
- Bray, H.G.; Thorpe, W. Analysis of phenolic compounds of interest in metabolism. In Methods of Biochemical Analysis; Interscience Publishers, Inc.: Newy York, NY, USA, 1954; pp. 27–52. [Google Scholar] [CrossRef]
- Flint, S.D.; Jordan, P.W.; Caldwell, M.M. Plant protective response to enhanced UV-B radiation under field conditions: Leaf optical properties and photosynthesis. Photochem. Photobiol. 1985, 41, 95–99. [Google Scholar] [CrossRef]
- Gitelson, A.A.; Merzlyak, M.N.; Chivkunova, O.B. Optical properties and non-destructive estimation of anthocyanin content in plant leaves. Photochem. Photobiol. 2001, 74, 38–45. [Google Scholar] [CrossRef] [PubMed]
- Jamil, M.; Bashir, S.A.; Anwar, S.; Bibi, S.; Bangash, A.; Ullah, F.; Rha, E.S. Effect of salinity on physiological and biochemical characteristics of different varieties of rice. Pak. J. Bot. 2012, 44, 7–13. [Google Scholar]
- Takshak, S.; Agrawal, S.Á. Secondary metabolites and phenylpropanoid pathway enzymes as influenced under supplemental ultraviolet-B radiation in Withania somnifera Dunal, an indigenous medicinal plant. J. Photochem. Photobiol. B Biol. 2014, 140, 332–343. [Google Scholar] [CrossRef] [PubMed]
- Keller, T.; Schwager, H. Air pollution and ascorbic acid. Eur. J. For. Pathol. 1977, 7, 338–350. [Google Scholar] [CrossRef]
- Noreen, H.; Semmar, N.; Farman, M.; McCullagh, J.S. Measurement of total phenolic content and antioxidant activity of aerial parts of medicinal plant Coronopus didymus. Asian Pac. J. Trop. Med. 2017, 10, 792–801. [Google Scholar] [CrossRef]
- Khatua, S.; Acharya, K. Functional ingredients and medicinal prospects of ethanol extract from Macrocybe lobayensis. Pharmacogn. J. 2018, 10. [Google Scholar] [CrossRef]
- Clarke, G.; Ting, K.N.; Wiart, C.; Fry, J. High correlation of 2, 2-diphenyl-1-picrylhydrazyl (DPPH) radical scavenging, ferric reducing activity potential and total phenolics content indicates redundancy in use of all three assays to screen for antioxidant activity of extracts of plants from the Malaysian rainforest. Antioxidants 2013, 2, 1–10. [Google Scholar] [CrossRef]
- Maxwell, K.; Johnson, G.N. Chlorophyll fluorescence—A practical guide. J. Exp. Bot. 2000, 51, 659–668. [Google Scholar] [CrossRef]
- Takshak, S.; Agrawal, S.B. Interactive effects of supplemental ultraviolet-B radiation and indole-3-acetic acid on Coleus forskohlii Briq.: Alterations in morphological-, physiological-, and biochemical characteristics and essential oil content. Ecotoxicol. Environ. Saf. 2018, 147, 313–326. [Google Scholar] [CrossRef]
- Sebastian, A.; Kumari, R.; Kiran, B.R.; Prasad, M.N. Ultraviolet B induced bioactive changes of enzymatic and non-enzymatic antioxidants and lipids in L. (Fenugreek). Euro Biotech J. 2018, 2, 64–71. [Google Scholar] [CrossRef]
- Takshak, S.; Agrawal, S.B. Defence strategies adopted by the medicinal plant Coleus forskohlii against supplemental ultraviolet-B radiation: Augmentation of secondary metabolites and antioxidants. Plant Physiol. Biochem. 2015, 97, 124–138. [Google Scholar] [CrossRef] [PubMed]
- Ghosh, A.; Agrawal, M.; Agrawal, S.B. Effect of water deficit stress on an Indian wheat cultivar (Triticum aestivum L. HD 2967) under ambient and elevated level of ozone. Sci. Total Environ. 2020, 714, 136837. [Google Scholar] [CrossRef] [PubMed]
- Yadav, D.S.; Rai, R.; Mishra, A.K.; Chaudhary, N.; Mukherjee, A.; Agrawal, S.B.; Agrawal, M. ROS production and its detoxification in early and late sown cultivars of wheat under future O3 concentration. Sci. Total Environ. 2019, 659, 200–210. [Google Scholar] [CrossRef] [PubMed]
- Sarkar, A.; Singh, A.A.; Agrawal, S.B.; Ahmad, A.; Rai, S.P. Cultivar specific variations in antioxidative defense system, genome and proteome of two tropical rice cultivars against ambient and elevated ozone. Ecotoxicol. Environ. Saf. 2015, 115, 101–111. [Google Scholar] [CrossRef] [PubMed]
- Ansari, N.; Yadav, D.S.; Singh, P.; Agrawal, M.; Agrawal, S.B. Ozone exposure response on physiological and biochemical parameters vis-a-vis secondary metabolites in a traditional medicinal plant Sida cordifolia L. Ind. Crops Prod. 2023, 194, 116267. [Google Scholar] [CrossRef]
- Sahoo, A.; Madheshiya, P.; Mishra, A.K.; Tiwari, S. Combating ozone stress through N fertilization: A case study of Indian bean (Dolichos lablab L.). Front. Plant Sci. 2023, 14, 548. [Google Scholar] [CrossRef]
- Rathore, D.; Chaudhary, I.J. Ozone risk assessment of castor (Ricinus communis L.) cultivars using open top chamber and ethylene di urea (EDU). Environ. Pollut. 2019, 244, 257–269. [Google Scholar] [CrossRef]
- Singh, A.A.; Agrawal, S.B.; Shahi, J.P.; Agrawal, M. Assessment of growth and yield losses in two Zea mays L. cultivars (quality protein maize and nonquality protein maize) under projected levels of ozone. Environ. Sci. Pollut. Res. 2014, 21, 2628–2641. [Google Scholar] [CrossRef]
- Wang, Y.; Yang, L.; Höller, M.; Zaisheng, S.; Pariasca-Tanaka, J.; Wissuwa, M.; Frei, M. Pyramiding of ozone tolerance QTLs OzT8 and OzT9 confers improved tolerance to season-long ozone exposure in rice. Environ. Exp. Bot. 2014, 104, 26–33. [Google Scholar] [CrossRef]
- Tiwari, S.; Agrawal, M. Assessment of the variability in response of radish and brinjal at biochemical and physiological levels under similar ozone exposure conditions. Environ. Monit. Assess. 2011, 175, 443–454. [Google Scholar] [CrossRef]
- Chaudhary, I.J.; Rathore, D. Assessment of dose-response relationship between ozone dose and groundnut (Arachis hypogaea L) cultivars using Open Top Chamber (OTC) and Ethylenediurea (EDU). Environ. Technol. Innov. 2021, 22, 101494. [Google Scholar] [CrossRef]
- Singh, R.; Rathore, D. Oxidative stress defence responses of wheat (Triticum aestivum L.) and chilli (Capsicum annum L.) cultivars grown under textile effluent fertilization. Plant Physiol. Biochem. 2018, 123, 342–358. [Google Scholar] [CrossRef] [PubMed]
- You, J.; Chan, Z. ROS regulation during abiotic stress responses in crop plants. Front. Plant Sci. 2015, 6, 1092. [Google Scholar] [CrossRef] [PubMed]
- Xu, J.; Zong, M.H.; Fu, S.Y.; Li, N. Correlation between physicochemical properties and enzymatic digestibility of rice straw pretreated with cholinium ionic liquids. ACS Sustain. Chem. Eng. 2016, 4, 4340–4345. [Google Scholar] [CrossRef]
- Kumari, R.; Agrawal, S.B. Supplemental UV-B induced changes in leaf morphology, physiology and secondary metabolites of an Indian aromatic plant Cymbopogon citratus (DC) Staph under natural field conditions. Int. J. Environ. Stud. 2010, 67, 655–675. [Google Scholar] [CrossRef]
- Yadav, D.S.; Jaiswal, B.; Agrawal, S.B.; Agrawal, M. Diurnal variations in physiological characteristics, photo assimilates, and total ascorbate in early and late sown Indian wheat cultivars under exposure to elevated ozone. Atmosphere 2021, 12, 1568. [Google Scholar] [CrossRef]
- Singh, E.; Tiwari, S.; Agrawal, M. Effects of elevated ozone on photosynthesis and stomatal conductance of two soybean varieties: A case study to assess impacts of one component of predicted global climate change. Plant Biol. 2009, 11, 101–108. [Google Scholar] [CrossRef]
- Nishiyama, Y.; Allakhverdiev, S.I.; Murata, N. Protein synthesis is the primary target of reactive oxygen species in the photoinhibition of photosystem, I.I. Physiol. Plant. 2011, 142, 35–46. [Google Scholar] [CrossRef]
- Tiwari, S.; Agrawal, M.; Marshall, F.M. Seasonal variations in adaptational strategies of Beta vulgaris L. plants in response to ambient air pollution: Biomass allocation, yield and nutritional quality. Trop. Ecol. 2010, 51, 353–363. [Google Scholar]
- Qaderi, M.M.; Martel, A.B.; Strugnell, C.A. Environmental Factors Regulate Plant Secondary Metabolites. Plants 2023, 12, 447. [Google Scholar] [CrossRef]
- Jan, R.; Asaf, S.; Numan, M.; Kim, K.M. Plant secondary metabolite biosynthesis and transcriptional regulation in response to biotic and abiotic stress conditions. Agronomy 2021, 11, 968. [Google Scholar] [CrossRef]
- Lin, D.; Xiao, M.; Zhao, J.; Li, Z.; Xing, B.; Li, X.; Kong, M.; Li, L.; Zhang, Q.; Liu, Y.; et al. An overview of plant phenolic compounds and their importance in human nutrition and management of type 2 diabetes. Molecules 2016, 21, 1374. [Google Scholar] [CrossRef]
- Feng, Z.; De Marco, A.; Anav, A.; Gualtieri, M.; Sicard, P.; Tian, H.; Fornasier, F.; Tao, F.; Guo, A.; Paoletti, E. Economic losses due to ozone impacts on human health, forest productivity and crop yield across China. Environ. Int. 2019, 131, 104966. [Google Scholar] [CrossRef]
- Gil, M.; Pontin, M.; Berli, F.; Bottini, R.; Piccoli, P. Metabolism of terpenes in the response of grape (Vitis vinifera L.) leaf tissues to UV-B radiation. Phytochemistry 2012, 77, 89–98. [Google Scholar] [CrossRef]
- Pandey, N.; Pandey-Rai, S. Modulations of physiological responses and possible involvement of defense-related secondary metabolites in acclimation of Artemisia annua L. against short-term UV-B radiation. Planta 2014, 240, 611–627. [Google Scholar] [CrossRef]
- Smith, W.E.; Shivaji, R.; Williams, W.P.; Luthe, D.S.; Sandoya, G.V.; Smith, C.L.; Sparks, D.L.; Brown, A.E. A maize line resistant to herbivory constitutively releases (E)-β-caryophyllene. J. Econ. Entomol. 2012, 105, 120–128. [Google Scholar] [CrossRef] [PubMed]
- Valkama, E.; Koricheva, J.; Oksanen, E. Effects of elevated O3, alone and in combination with elevated CO2, on tree leaf chemistry and insect herbivore performance: A meta-analysis. Glob. Change Biol. 2007, 13, 184–201. [Google Scholar] [CrossRef]
- Kangasjärvi, J.; Jaspers, P.; Kollist, H. Signalling and cell death in ozone-exposed plants. Plant Cell Environ. 2005, 28, 1021–1036. [Google Scholar] [CrossRef]
- Kasote, D.M.; Katyare, S.S.; Hegde, M.V.; Bae, H. Significance of antioxidant potential of plants and its relevance to therapeutic applications. Int. J. Biol. Sci. 2015, 11, 982. [Google Scholar] [CrossRef]
- Silva, F.L.; Vieira, L.G.; Ribas, A.F.; Moro, A.L.; Neris, D.M.; Pacheco, A.C. Proline accumulation induces the production of total phenolics in transgenic tobacco plants under water deficit without increasing the G6PDH activity. Theor. Exp. Plant Physiol. 2018, 30, 251–260. [Google Scholar] [CrossRef]
- Debona, D.; Rodrigues, F.A.; Datnoff, L.E. Silicon’s role in abiotic and biotic plant stresses. Annu. Rev. Phytopathol. 2017, 55, 85–107. [Google Scholar] [CrossRef] [PubMed]
- Deng, G.B.; Zhang, H.B.; Xue, H.F.; Chen, S.N.; Chen, X.L. Chemical composition and biological activities of essential oil from the rhizomes of Iris bulleyana. Agric. Sci. China 2009, 8, 691–696. [Google Scholar] [CrossRef]
- Videira, R.; Castanheira, P.; Grãos, M.; Salgueiro, L.; Faro, C.; Cavaleiro, C. A necrodane monoterpenoid from Lavandula luisieri essential oil as a cell-permeable inhibitor of BACE-1, the β-secretase in Alzheimer’s disease. Flavour Fragr. J. 2013, 28, 380–388. [Google Scholar] [CrossRef]
Disclaimer/Publisher’s Note: The statements, opinions and data contained in all publications are solely those of the individual author(s) and contributor(s) and not of MDPI and/or the editor(s). MDPI and/or the editor(s) disclaim responsibility for any injury to people or property resulting from any ideas, methods, instructions or products referred to in the content. |
© 2023 by the authors. Licensee MDPI, Basel, Switzerland. This article is an open access article distributed under the terms and conditions of the Creative Commons Attribution (CC BY) license (https://creativecommons.org/licenses/by/4.0/).