
Lipidomic Analysis of Archival Pathology Specimens Identifies Altered Lipid Signatures in Ovarian Clear Cell Carcinoma

 , and
, and 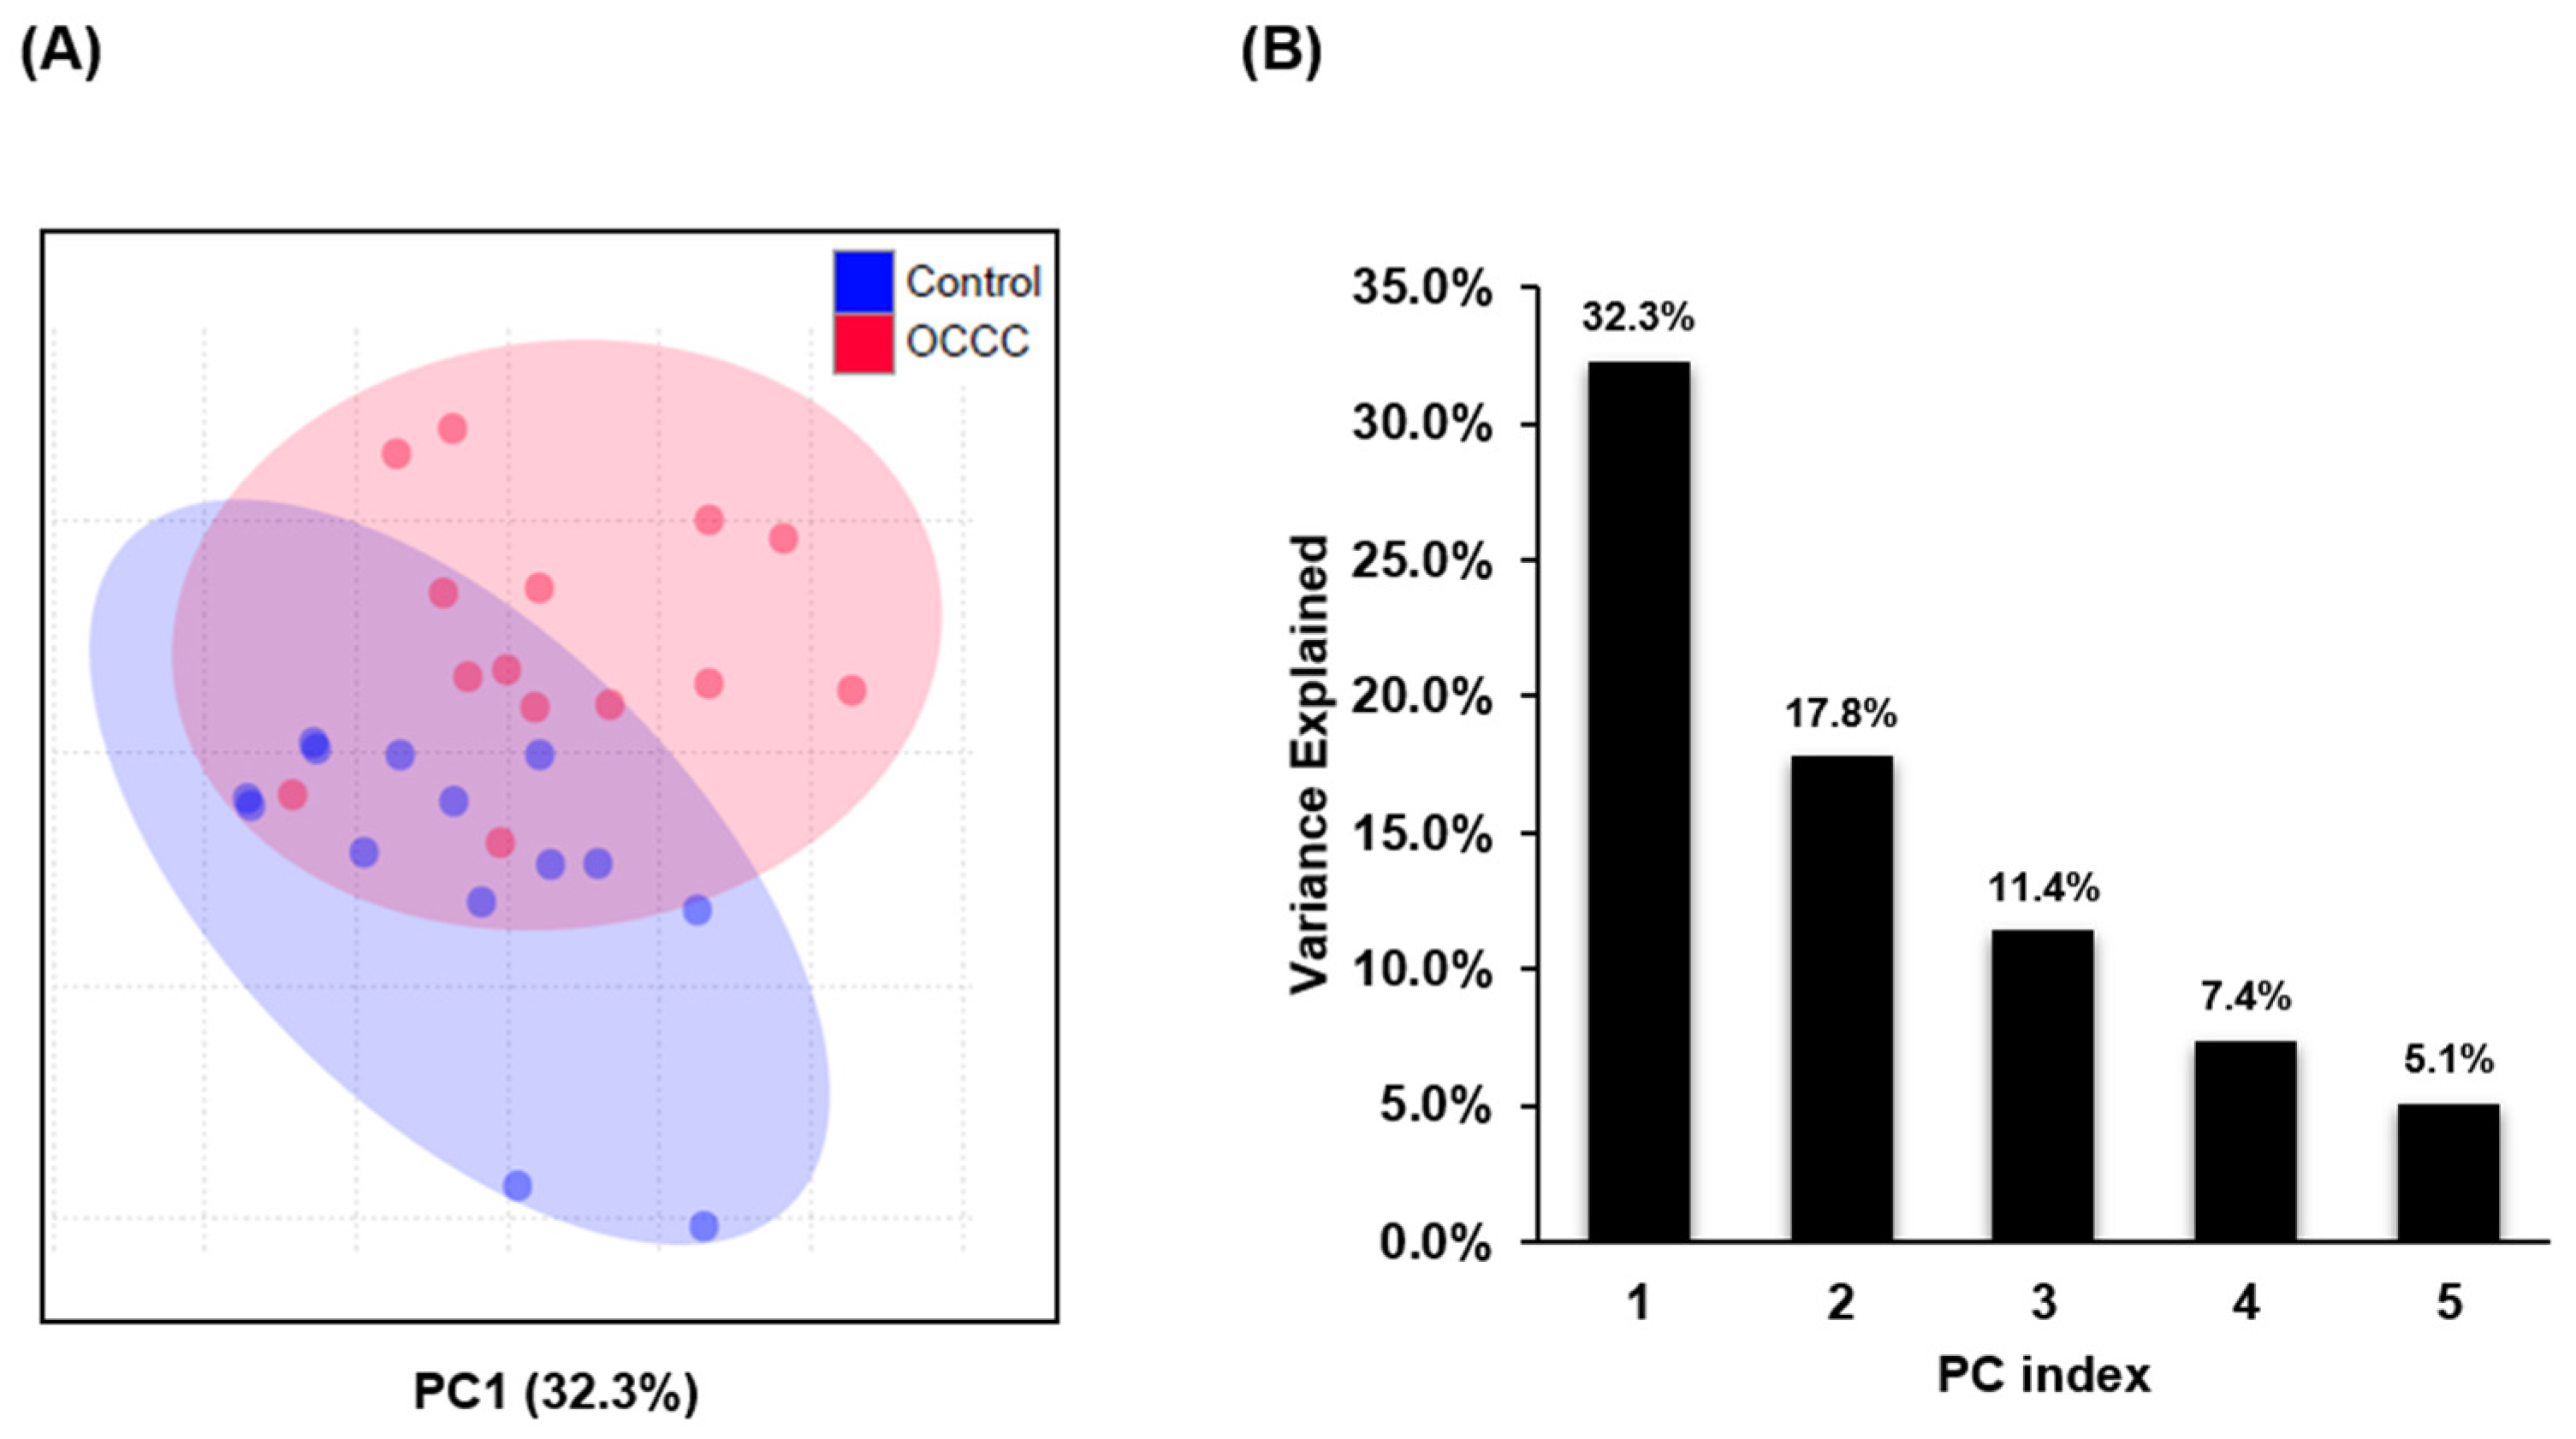
Abstract
:1. Introduction
2. Results
2.1. Lipidomic Profiling of FFPE Tissue Samples
2.2. Differential Expression of Lipid Species in OCCC
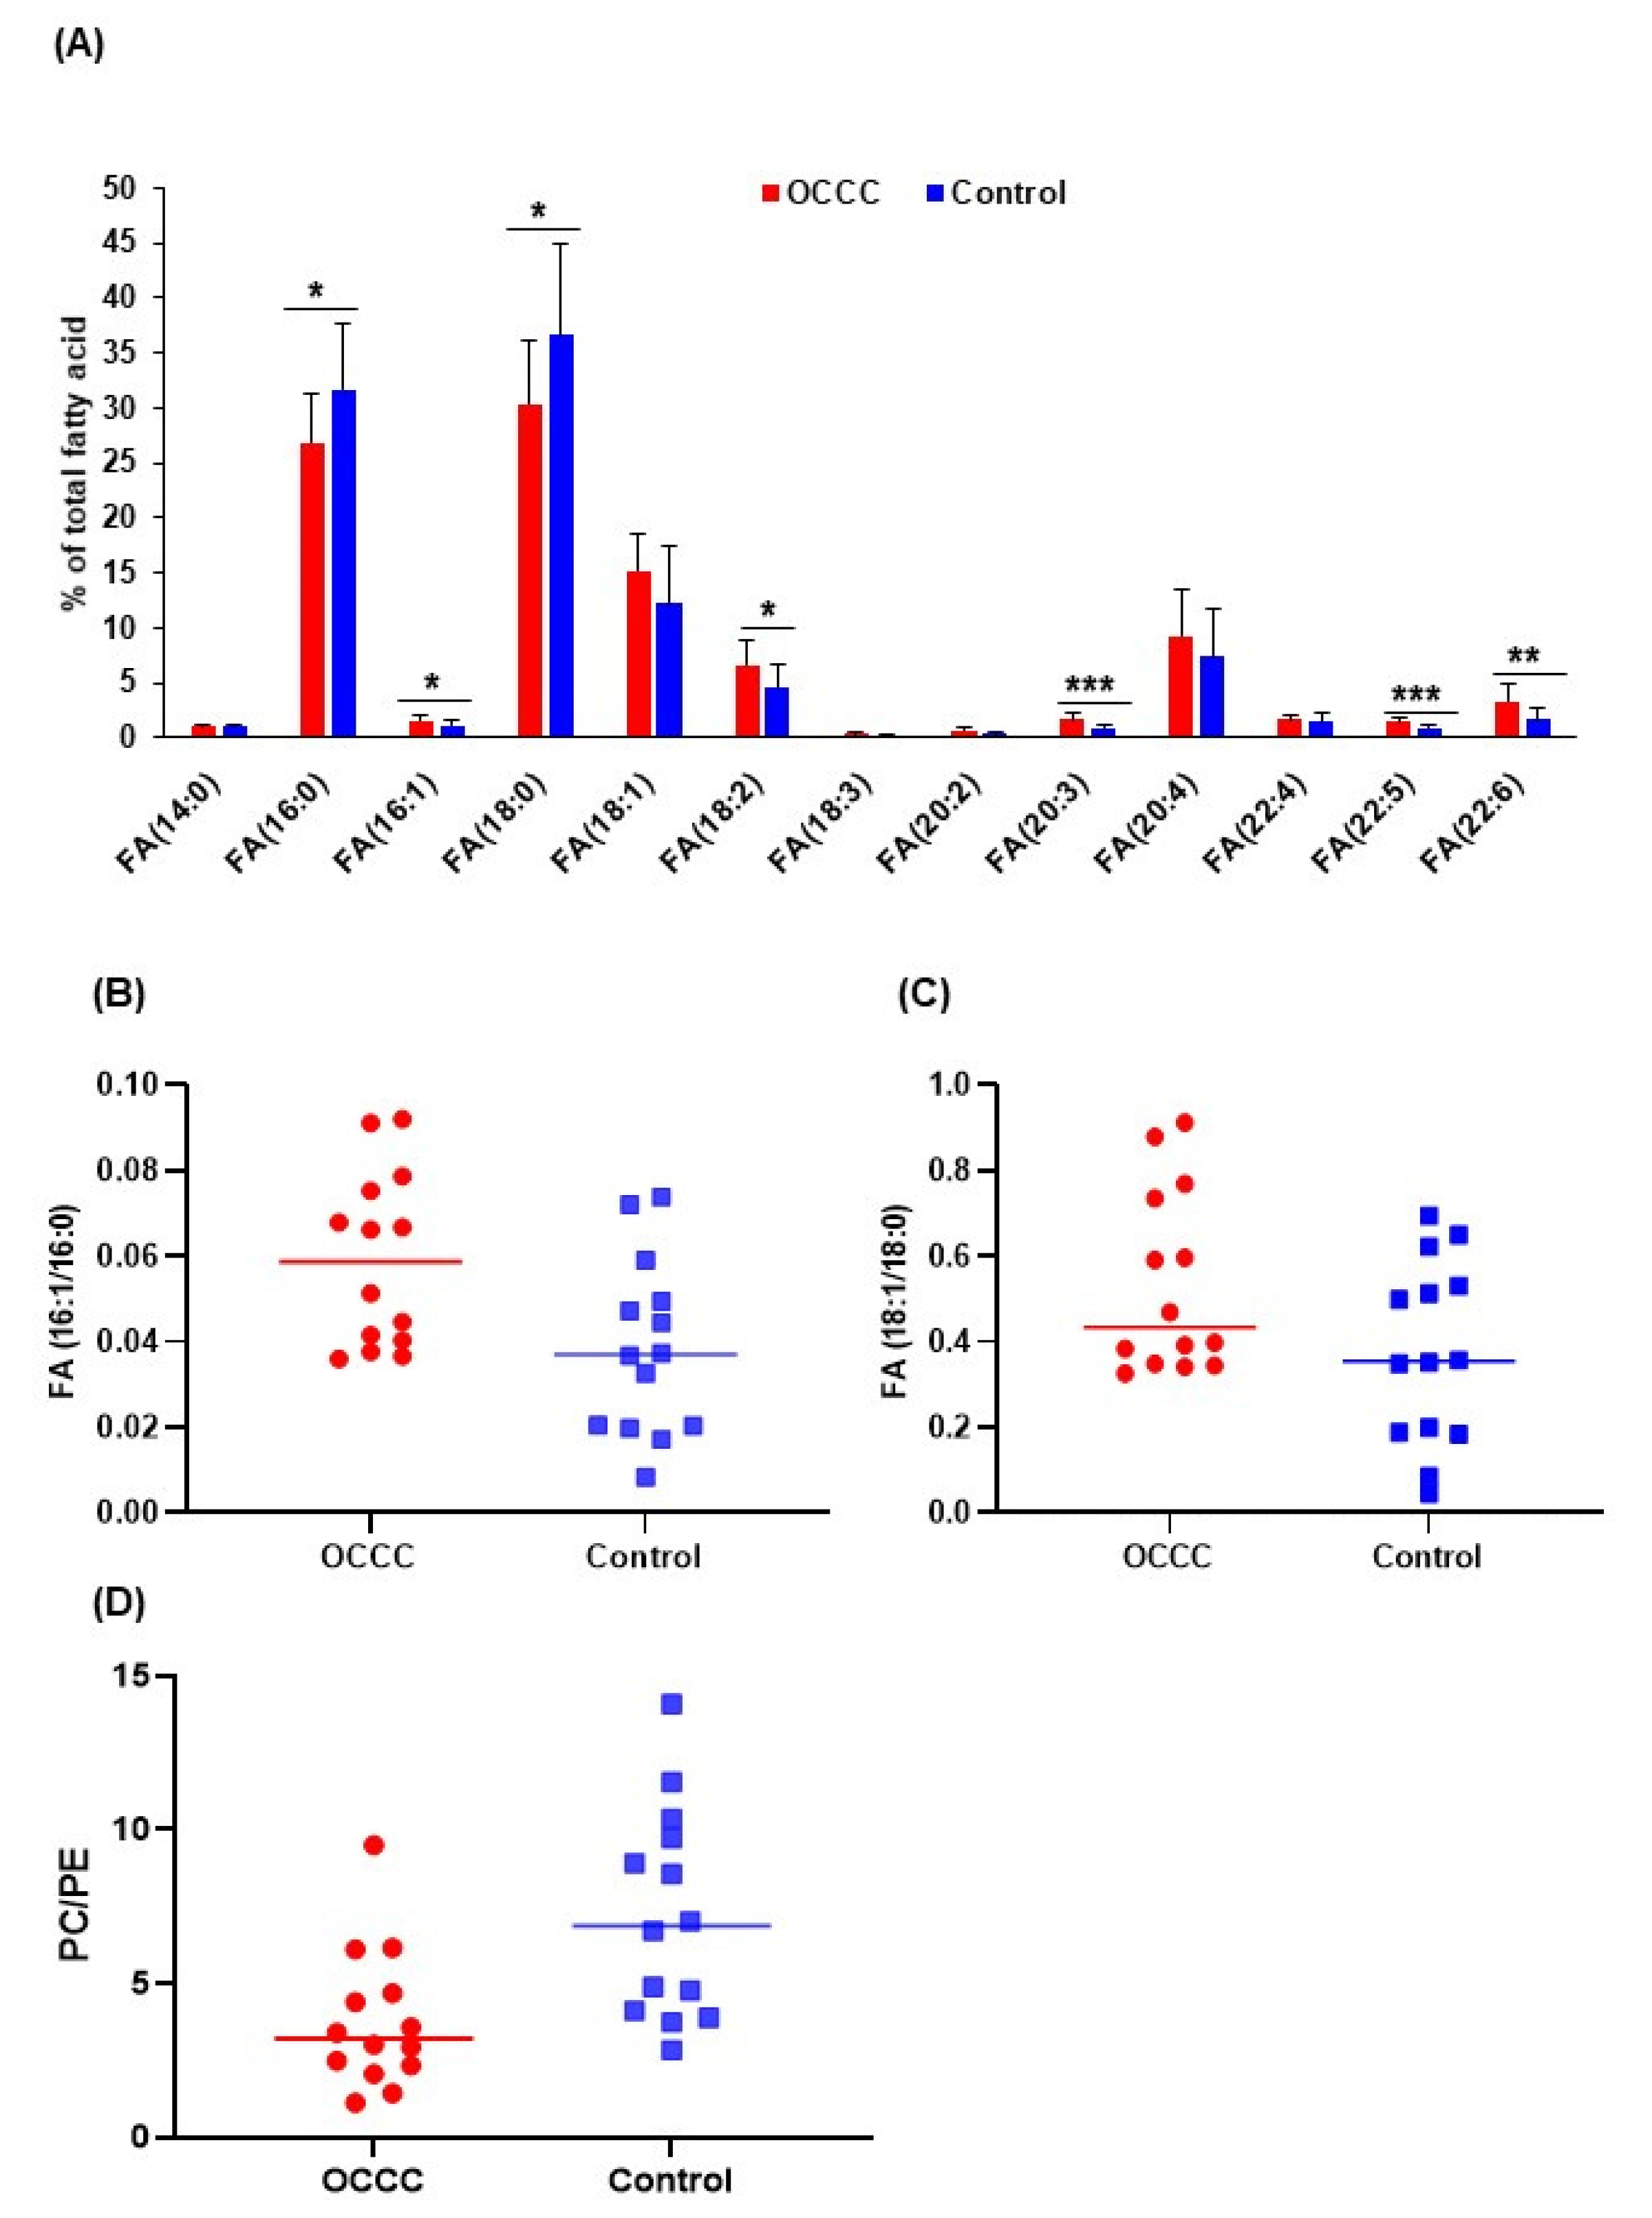
2.3. Unsaturated Lipid Species Are Elevated in OCCC
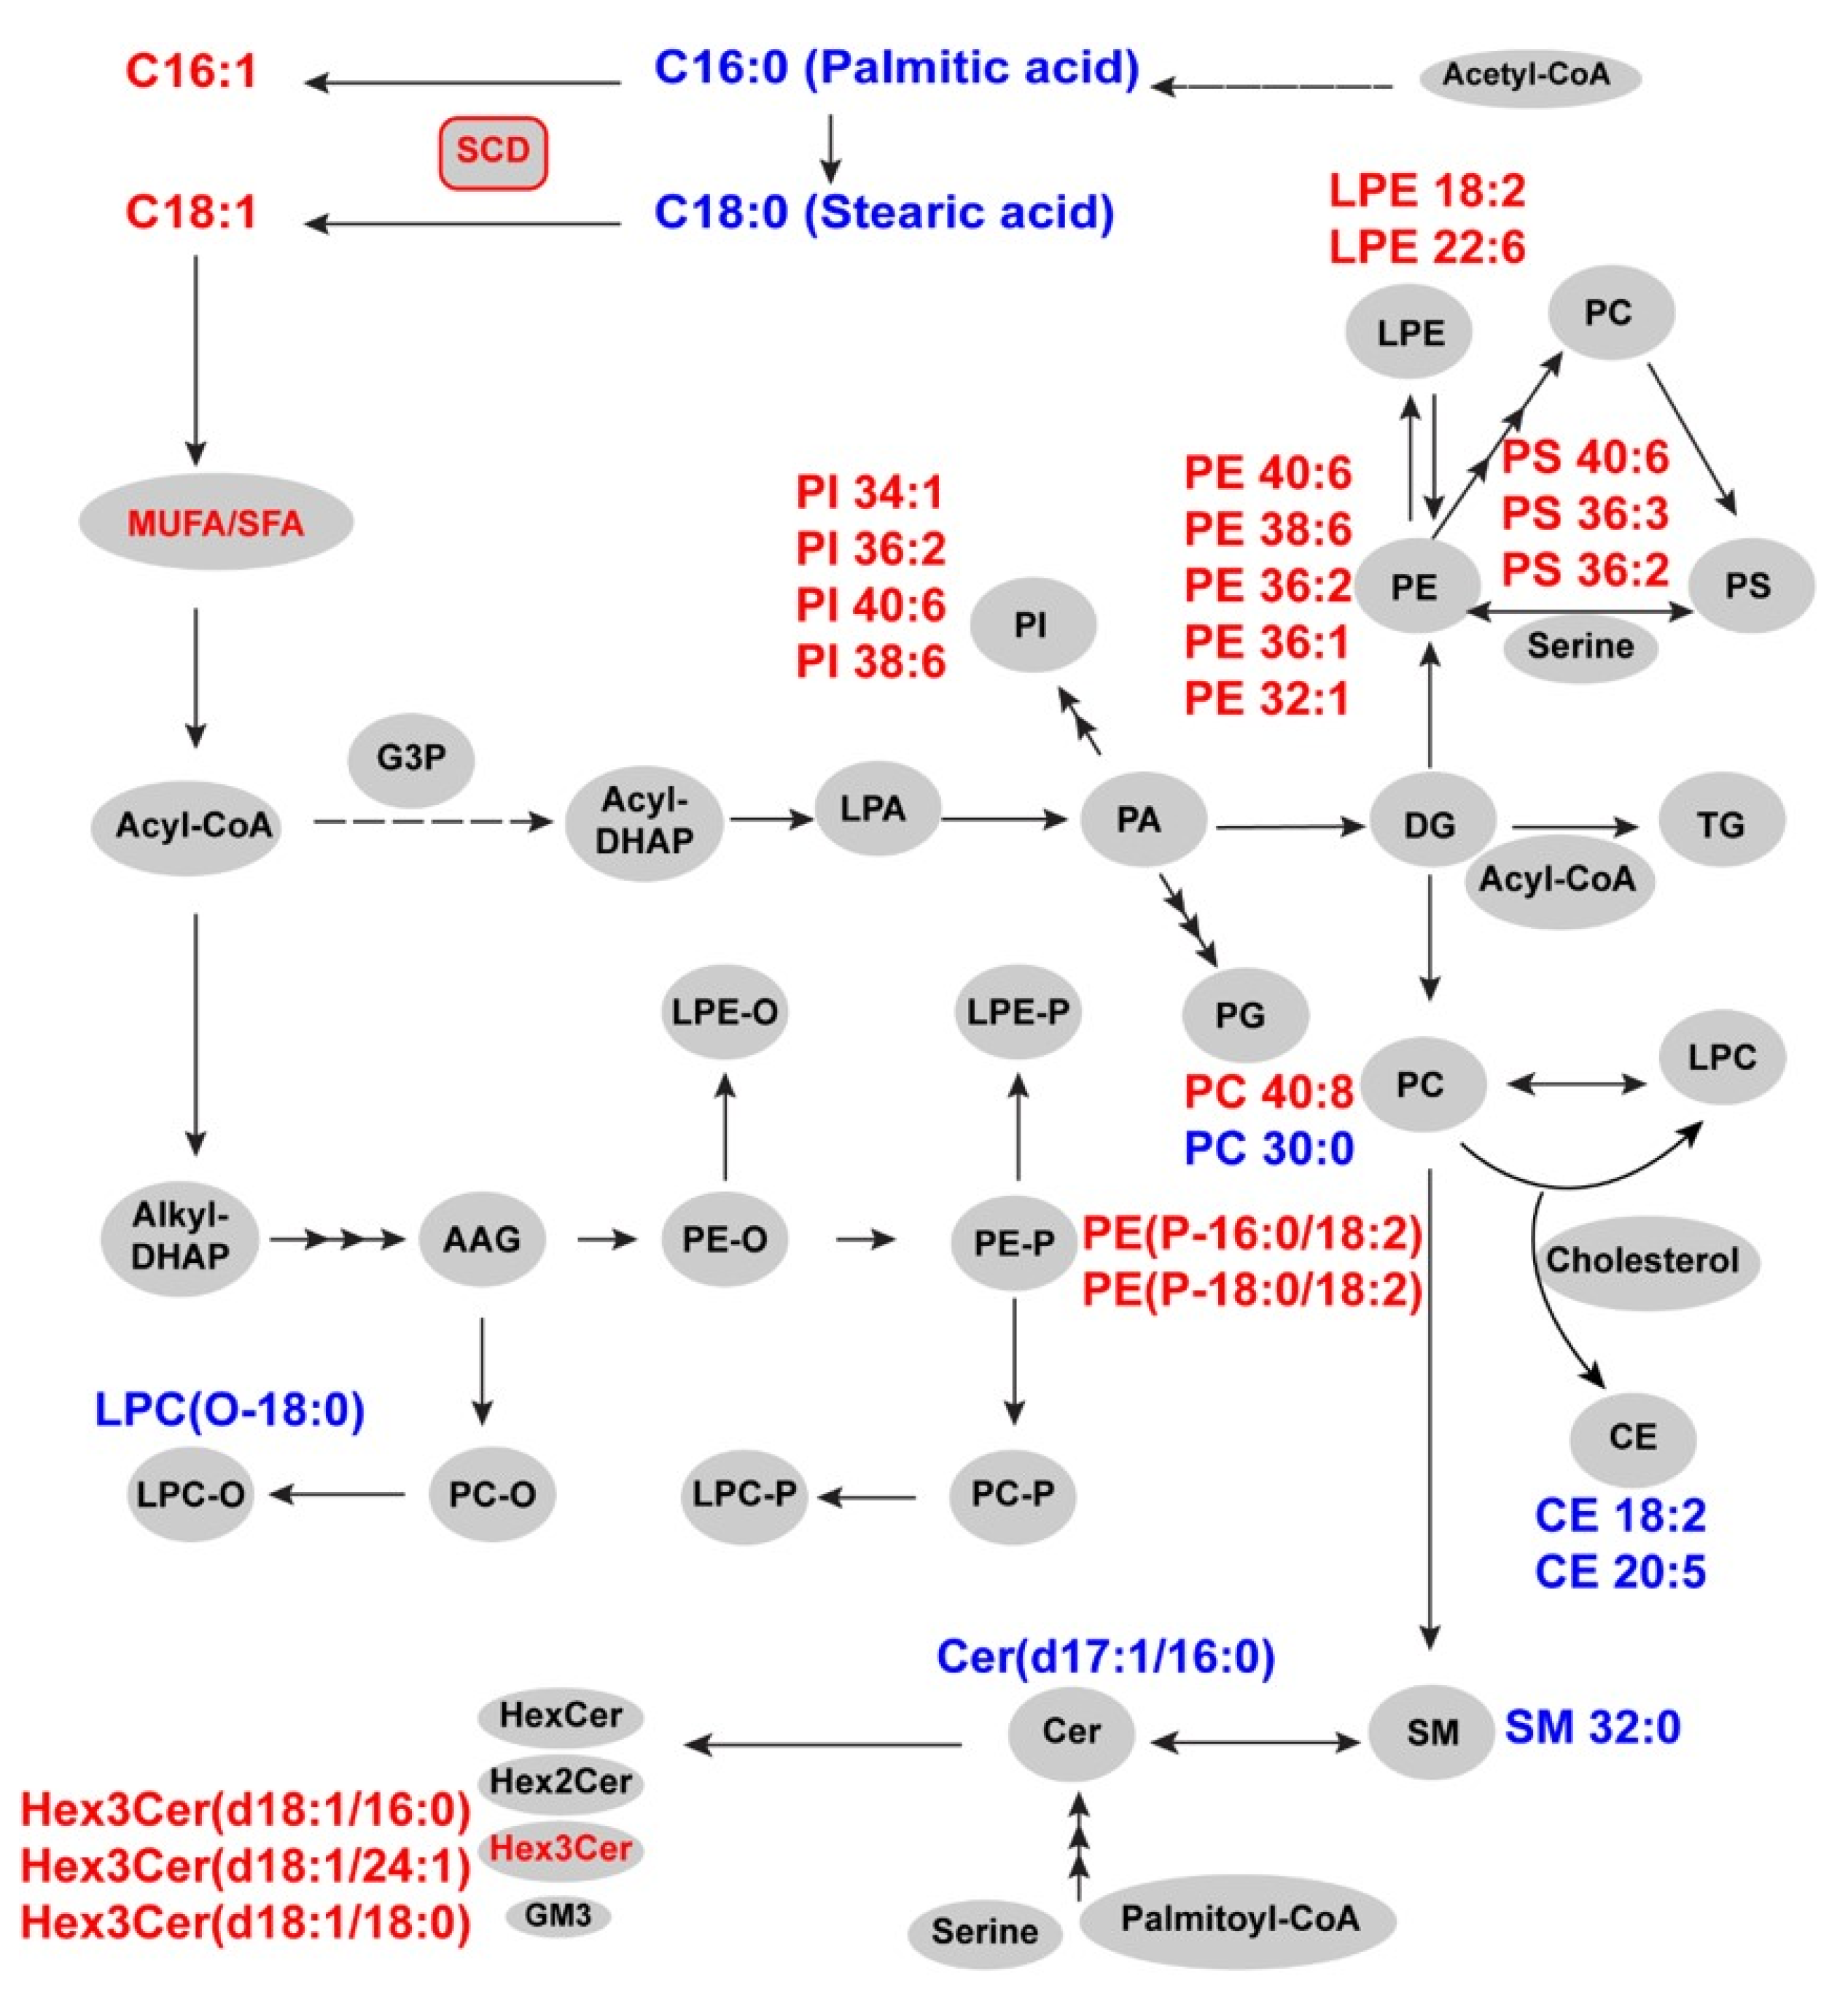
2.4. Stearoyl-CoA Desaturase (SCD) Expression in OCCC and Control Tissue
3. Discussion
4. Materials and Methods
4.1. Reagents
4.2. Methods
4.2.1. Formalin-Fixed Paraffin-Embedded Tissue Sections
4.2.2. Sample Preparation
4.2.3. LC-MS/MS Analysis
4.2.4. Data Analysis and Quantitation
4.2.5. Statistical Analysis
4.2.6. Immunohistochemical Staining for SCD and Scoring of Staining
5. Conclusions
Supplementary Materials
Author Contributions
Funding
Institutional Review Board Statement
Informed Consent Statement
Data Availability Statement
Conflicts of Interest
References
- Tay, S.K.; Cheong, M.A. Evidence for ethnic and environmental contributions to frequency of ovarian clear cell carcinoma. Aust. New Zealand J. Obstet. Gynaecol. 2014, 54, 225–230. [Google Scholar] [CrossRef]
- Prat, J.; D’Angelo, E.; Espinosa, I. Ovarian carcinomas: At least five different diseases with distinct histological features and molecular genetics. Hum. Pathol. 2018, 80, 11–27. [Google Scholar] [CrossRef]
- Tan, D.S.P.; Miller, R.E.; Kaye, S.B. New perspectives on molecular targeted therapy in ovarian clear cell carcinoma. Br. J. Cancer 2013, 108, 1553–1559. [Google Scholar] [CrossRef] [Green Version]
- Santos, C.R.; Schulze, A. Lipid metabolism in cancer. FEBS J. 2012, 279, 2610–2623. [Google Scholar] [CrossRef]
- Broadfield, L.A.; Pane, A.A.; Talebi, A.; Swinnen, J.V.; Fendt, S.-M. Lipid metabolism in cancer: New perspectives and emerging mechanisms. Dev. Cell 2021, 56, 1363–1393. [Google Scholar] [CrossRef]
- Wolrab, D.; Jirásko, R.; Chocholoušková, M.; Peterka, O.; Holčapek, M. Oncolipidomics: Mass spectrometric quantitation of lipids in cancer research. TrAC Trends Anal. Chem. 2019, 120, 115480. [Google Scholar] [CrossRef]
- Blomme, A.; Ford, C.A.; Mui, E.; Patel, R.; Ntala, C.; Jamieson, L.E.; Planque, M.; McGregor, G.H.; Peixoto, P.; Hervouet, E.; et al. 2,4-dienoyl-CoA reductase regulates lipid homeostasis in treatment-resistant prostate cancer. Nat. Commun. 2020, 11, 2508. [Google Scholar] [CrossRef]
- Liu, Y.; Chen, Y.; Momin, A.; Shaner, R.; Wang, E.; Bowen, N.J.; Matyunina, L.V.; Walker, L.D.; McDonald, J.F.; Sullards, M.C.; et al. Elevation of sulfatides in ovarian cancer: An integrated transcriptomic and lipidomic analysis including tissue-imaging mass spectrometry. Mol. Cancer 2010, 9, 186. [Google Scholar] [CrossRef] [PubMed] [Green Version]
- Buas, M.F.; Gu, H.; Djukovic, D.; Zhu, J.; Drescher, C.W.; Urban, N.; Raftery, D.; Li, C.I. Identification of novel candidate plasma metabolite biomarkers for distinguishing serous ovarian carcinoma and benign serous ovarian tumors. Gynecol. Oncol. 2015, 140, 138–144. [Google Scholar] [CrossRef] [Green Version]
- Li, J.; Xie, H.; Li, K.; Cheng, J.; Yang, K.; Wang, J.; Wang, W.; Zhang, F.; Li, Z.; Dhillon, H.S.; et al. Distinct plasma lipids profiles of recurrent ovarian cancer by liquid chromatography-mass spectrometry. Oncotarget 2016, 8, 46834–46845. [Google Scholar] [CrossRef]
- Ogretmen, B.; Hannun, Y.A. Biologically active sphingolipids in cancer pathogenesis and treatment. Nat. Rev. Cancer 2004, 4, 604–616. [Google Scholar] [CrossRef]
- Qiu, Y.; Zhou, B.; Su, M.; Baxter, S.; Zheng, X.; Zhao, X.; Yen, Y.; Jia, W. Mass Spectrometry-Based Quantitative Metabolomics Revealed a Distinct Lipid Profile in Breast Cancer Patients. Int. J. Mol. Sci. 2013, 14, 8047–8061. [Google Scholar] [CrossRef] [Green Version]
- Alberg, A.J.; Armeson, K.; Pierce, J.S.; Bielawski, J.; Bielawska, A.; Visvanathan, K.; Hill, E.G.; Ogretmen, B. Plasma Sphingolipids and Lung Cancer: A Population-Based, Nested Case–Control Study. Cancer Epidemiol. Biomark. Prev. 2013, 22, 1374–1382. [Google Scholar] [CrossRef] [Green Version]
- Hájek, R.; Lísa, M.; Khalikova, M.; Jirásko, R.; Cífková, E.; Student, V.; Vrána, D.; Opálka, L.; Vávrová, K.; Matzenauer, M.; et al. HILIC/ESI-MS determination of gangliosides and other polar lipid classes in renal cell carcinoma and surrounding normal tissues. Anal. Bioanal. Chem. 2018, 410, 6585–6594. [Google Scholar] [CrossRef]
- Oskouian, B.; Saba, J.D. Cancer Treatment Strategies Targeting Sphingolipid Metabolism. Adv. Exp. Med. Biol. 2010, 688, 185–205. [Google Scholar] [CrossRef] [Green Version]
- Seo, E.J.; Kwon, Y.W.; Jang, I.H.; Kim, D.K.; Lee, S.I.; Choi, E.J.; Kim, K.-H.; Suh, D.-S.; Lee, J.H.; Choi, K.U.; et al. Autotaxin Regulates Maintenance of Ovarian Cancer Stem Cells through Lysophosphatidic Acid-Mediated Autocrine Mechanism. Stem Cells 2016, 34, 551–564. [Google Scholar] [CrossRef] [PubMed]
- Pua, T.L.; Wang, F.-Q.; Fishman, D.A. Roles of LPA in ovarian cancer development and progression. Futur. Oncol. 2009, 5, 1659–1673. [Google Scholar] [CrossRef]
- Meleh, M.; Požlep, B.; Mlakar, A.; Meden-Vrtovec, H.; Zupančič-Kralj, L. Determination of serum lysophosphatidic acid as a potential biomarker for ovarian cancer. J. Chromatogr. B 2007, 858, 287–291. [Google Scholar] [CrossRef] [PubMed]
- Cruciani, G.; Pellegrino, R.M.; Di Veroli, A.; Cataldi, S.; Marocco, D.; Costantini, E.; Sidoni, A.; Viola-Magni, M. Diagnostic application of lipidomics fingerprints to bladder carcinoma. Transl. Cancer Res. 2017, 6, 1197–1206. [Google Scholar] [CrossRef]
- Cala, M.; Aldana, J.; Medina, J.; Sánchez, J.; Guio, J.; Wist, J.; Meesters, R.J.W. Multiplatform plasma metabolic and lipid fingerprinting of breast cancer: A pilot control-case study in Colombian Hispanic women. PLoS ONE 2018, 13, e0190958. [Google Scholar] [CrossRef] [Green Version]
- Ackerman, D.; Tumanov, S.; Qiu, B.; Michalopoulou, E.; Spata, M.; Azzam, A.; Xie, H.; Simon, M.C.; Kamphorst, J.J. Triglycerides Promote Lipid Homeostasis during Hypoxic Stress by Balancing Fatty Acid Saturation. Cell Rep. 2018, 24, 2596–2605.e5. [Google Scholar] [CrossRef] [PubMed] [Green Version]
- Cacciatore, S.; Zadra, G.; Bango, C.; Penney, K.L.; Tyekucheva, S.; Yanes, O.; Loda, M. Metabolic Profiling in Formalin-Fixed and Paraffin-Embedded Prostate Cancer Tissues. Mol. Cancer Res. 2017, 15, 439–447. [Google Scholar] [CrossRef] [Green Version]
- Kelly, A.D.; Breitkopf, S.B.; Yuan, M.; Goldsmith, J.; Spentzos, D.; Asara, J.M. Metabolomic Profiling from Formalin-Fixed, Paraffin-Embedded Tumor Tissue Using Targeted LC/MS/MS: Application in Sarcoma. PLoS ONE 2011, 6, e25357. [Google Scholar] [CrossRef]
- Wojakowska, A.; Marczak, L.; Jelonek, K.; Polański, K.; Widlak, P.; Pietrowska, M. An Optimized Method of Metabolite Extraction from Formalin-Fixed Paraffin-Embedded Tissue for GC/MS Analysis. PLoS ONE 2015, 10, e0136902. [Google Scholar] [CrossRef] [PubMed] [Green Version]
- Aldo Acevedo, C.D.; Ciucci, S.; Gerl, M.; Cannistraci, C.V. LIPEA: Lipid Pathway Enrichment Analysis. bioRxiv 2018, 274969. [Google Scholar] [CrossRef] [Green Version]
- Sawada, R.; Hotta, H.; Chung, Y.-S.; Sowa, M.; Tai, T.; Yano, I. Globotriaosyl Ceramide and Globoside as Major Glycolipid Components of Fibroblasts in Scirrhous Gastric Carcinoma Tissues. Jpn. J. Cancer Res. 1998, 89, 167–176. [Google Scholar] [CrossRef]
- Chuang, P.K.; Hsiao, M.; Hsu, T.-L.; Chang, C.-F.; Wu, C.-Y.; Chen, B.-R.; Huang, H.-W.; Liao, K.-S.; Chen, C.-C.; Chen, C.-L.; et al. Signaling pathway of globo-series glycosphingolipids and beta1,3-galactosyltransferase V (beta3GalT5) in breast cancer. Proc. Natl. Acad. Sci. USA 2019, 116, 3518–3523. [Google Scholar] [CrossRef] [Green Version]
- Arab, S.; Russel, E.; Chapman, W.B.; Rosen, B.; Lingwood, C.A. Expression of the verotoxin receptor glycolipid, globotriaosylceramide, in ovarian hyperplasias. Oncol. Res. Featur. Preclin. Clin. Cancer Ther. 1997, 9, 553–563. [Google Scholar]
- Szlasa, W.; Zendran, I.; ZalesiŃska, A.; Tarek, M.; Kulbacka, J. Lipid composition of the cancer cell membrane. J. Bioenerg. Biomembr. 2020, 52, 321–342. [Google Scholar] [CrossRef]
- Gibellini, F.; Smith, T.K. The Kennedy pathway--De novo synthesis of phosphatidylethanolamine and phosphatidylcholine. IUBMB Life 2010, 62, 414–428. [Google Scholar] [CrossRef]
- Zou, Y.; Henry, W.S.; Ricq, E.L.; Graham, E.T.; Phadnis, V.V.; Maretich, P.; Paradkar, S.; Boehnke, N.; Deik, A.A.; Reinhardt, F.; et al. Plasticity of ether lipids promotes ferroptosis susceptibility and evasion. Nature 2020, 585, 603–608. [Google Scholar] [CrossRef] [PubMed]
- Harayama, T.; Riezman, H. Understanding the diversity of membrane lipid composition. Nat. Rev. Mol. Cell Biol. 2018, 19, 281–296. [Google Scholar] [CrossRef] [PubMed]
- Li, Z.; Agellon, L.B.; Allen, T.M.; Umeda, M.; Jewell, L.; Mason, A.; Vance, D.E. The ratio of phosphatidylcholine to phosphatidylethanolamine influences membrane integrity and steatohepatitis. Cell Metab. 2006, 3, 321–331. [Google Scholar] [CrossRef] [PubMed] [Green Version]
- van der Veen, J.N.; Kennelly, J.P.; Wan, S.; Vance, J.E.; Vance, D.E.; Jacobs, R.L. The critical role of phosphatidylcholine and phosphatidylethanolamine metabolism in health and disease. Biochim. Biophys. Acta Biomembr. 2017, 1859, 1558–1572. [Google Scholar] [CrossRef] [PubMed]
- Dawaliby, R.; Trubbia, C.; Delporte, C.; Noyon, C.; Ruysschaert, J.-M.; Van Antwerpen, P.; Govaerts, C. Phosphatidylethanolamine Is a Key Regulator of Membrane Fluidity in Eukaryotic Cells. J. Biol. Chem. 2016, 291, 3658–3667. [Google Scholar] [CrossRef] [PubMed] [Green Version]
- Meng, X.; Riordan, N.H.; Riordan, H.D.; Mikirova, N.; Jackson, J.; González, M.J.; Miranda-Massari, J.R.; Mora, E.; Castillo, W.T. Cell membrane fatty acid composition differs between normal and malignant cell lines. Puerto Rico Health Sci. J. 2004, 23, 103–106. [Google Scholar]
- Ricoult, S.J.H.; Yecies, J.L.; Ben-Sahra, I.; Manning, B.D. Oncogenic PI3K and K-Ras stimulate de novo lipid synthesis through mTORC1 and SREBP. Oncogene 2015, 35, 1250–1260. [Google Scholar] [CrossRef] [Green Version]
- Daniels, V.; Smans, K.; Royaux, I.; Chypre, M.; Swinnen, J.; Zaidi, N. Cancer Cells Differentially Activate and Thrive on De Novo Lipid Synthesis Pathways in a Low-Lipid Environment. PLoS ONE 2014, 9, e106913. [Google Scholar] [CrossRef]
- Zoeller, R.A.; Wood, R. The importance of the stearoyl-CoA desaturase system in octadecenoate metabolism in the Morris hepatoma 7288C. Biochim. Biophys. Acta 1985, 845, 380–388. [Google Scholar] [CrossRef]
- Melana, J.P.; Mignolli, F.; Stoyanoff, T.; Aguirre, M.V.; Balboa, M.A.; Balsinde, J.; Rodriguez, J.P. The Hypoxic Microenvironment Induces Stearoyl-CoA Desaturase-1 Overexpression and Lipidomic Profile Changes in Clear Cell Renal Cell Carcinoma. Cancers 2021, 13, 2962. [Google Scholar] [CrossRef]
- Colacino, J.A.; McDermott, S.P.; Sartor, M.A.; Wicha, M.S.; Rozek, L.S. Transcriptomic profiling of curcumin-treated human breast stem cells identifies a role for stearoyl-coa desaturase in breast cancer prevention. Breast Cancer Res. Treat. 2016, 158, 29–41. [Google Scholar] [CrossRef]
- Peck, B.; Schug, Z.T.; Zhang, Q.; Dankworth, B.; Jones, D.T.; Smethurst, E.; Patel, R.; Mason, S.; Jiang, M.; Saunders, R.; et al. Inhibition of fatty acid desaturation is detrimental to cancer cell survival in metabolically compromised environments. Cancer Metab. 2016, 4, 1–18. [Google Scholar] [CrossRef] [Green Version]
- Tesfay, L.; Bibbin, T.P.; Konstorum, A.; Deng, Z.; Cox, A.O.; Lee, J.; Furdui, C.M.; Hedge, P.; Torti, F.M.; Torti, S.V. Stearoyl-CoA Desaturase 1 Protects Ovarian Cancer Cells from Ferroptotic Cell Death. Cancer Res. 2019, 79, 5355–5366. [Google Scholar] [CrossRef]
- Preta, G. New Insights into Targeting Membrane Lipids for Cancer Therapy. Front. Cell Dev. Biol. 2020, 8, 876. [Google Scholar] [CrossRef]
- Arima, K.; Lau, M.C.; Zhao, M.; Haruki, K.; Kosumi, K.; Mima, K.; Gu, M.; Väyrynen, J.P.; Twombly, T.S.; Baba, Y.; et al. Metabolic Profiling of Formalin-Fixed Paraffin-Embedded Tissues Discriminates Normal Colon from Colorectal Cancer. Mol. Cancer Res. 2020, 18, 883–890. [Google Scholar] [CrossRef] [PubMed] [Green Version]
- Löfgren, L.; Forsberg, G.-B.; Ståhlman, M. The BUME method: A new rapid and simple chloroform-free method for total lipid extraction of animal tissue. Sci. Rep. 2016, 6, 1–11. [Google Scholar] [CrossRef] [PubMed] [Green Version]
- Alshehry, Z.H.; Barlow, C.K.; Weir, J.M.; Zhou, Y.; McConville, M.J.; Meikle, P.J. An Efficient Single Phase Method for the Extraction of Plasma Lipids. Metabolites 2015, 5, 389–403. [Google Scholar] [CrossRef]
- Pradas, I.; Huynh, K.; Cabré, R.; Ayala, V.; Meikle, P.; Jové, M.; Pamplona, R. Lipidomics Reveals a Tissue-Specific Fingerprint. Front. Physiol. 2018, 9, 1165. [Google Scholar] [CrossRef] [PubMed] [Green Version]
- Aveldaño, M.I.; Horrocks, L.A. Quantitative release of fatty acids from lipids by a simple hydrolysis procedure. J. Lipid Res. 1983, 24, 1101–1105. [Google Scholar] [CrossRef]
- Pang, Z.; Chong, J.; Zhou, G.; Morais, D.A.D.L.; Chang, L.; Barrette, M.; Gauthier, C.; Jacques, P.; Li, S.; Xia, J. MetaboAnalyst 5.0: Narrowing the gap between raw spectra and functional insights. Nucleic Acids Res. 2021, 49, W388–W396. [Google Scholar] [CrossRef]


Publisher’s Note: MDPI stays neutral with regard to jurisdictional claims in published maps and institutional affiliations. |
© 2021 by the authors. Licensee MDPI, Basel, Switzerland. This article is an open access article distributed under the terms and conditions of the Creative Commons Attribution (CC BY) license (https://creativecommons.org/licenses/by/4.0/).
Share and Cite
Mir, S.A.; Wong, S.B.J.; Narasimhan, K.; Esther, C.W.L.; Ji, S.; Burla, B.; Wenk, M.R.; Tan, D.S.P.; Bendt, A.K. Lipidomic Analysis of Archival Pathology Specimens Identifies Altered Lipid Signatures in Ovarian Clear Cell Carcinoma. Metabolites 2021, 11, 597. https://doi.org/10.3390/metabo11090597
Mir SA, Wong SBJ, Narasimhan K, Esther CWL, Ji S, Burla B, Wenk MR, Tan DSP, Bendt AK. Lipidomic Analysis of Archival Pathology Specimens Identifies Altered Lipid Signatures in Ovarian Clear Cell Carcinoma. Metabolites. 2021; 11(9):597. https://doi.org/10.3390/metabo11090597
Chicago/Turabian StyleMir, Sartaj Ahmad, Soon Boon Justin Wong, Kothandaraman Narasimhan, Chua W. L. Esther, Shanshan Ji, Bo Burla, Markus R. Wenk, David S. P. Tan, and Anne K. Bendt. 2021. "Lipidomic Analysis of Archival Pathology Specimens Identifies Altered Lipid Signatures in Ovarian Clear Cell Carcinoma" Metabolites 11, no. 9: 597. https://doi.org/10.3390/metabo11090597
APA StyleMir, S. A., Wong, S. B. J., Narasimhan, K., Esther, C. W. L., Ji, S., Burla, B., Wenk, M. R., Tan, D. S. P., & Bendt, A. K. (2021). Lipidomic Analysis of Archival Pathology Specimens Identifies Altered Lipid Signatures in Ovarian Clear Cell Carcinoma. Metabolites, 11(9), 597. https://doi.org/10.3390/metabo11090597