Targeted Metabolic Profiling of Urine Highlights a Potential Biomarker Panel for the Diagnosis of Alzheimer’s Disease and Mild Cognitive Impairment: A Pilot Study


 ,
,  ,
, 
Abstract
1. Introduction
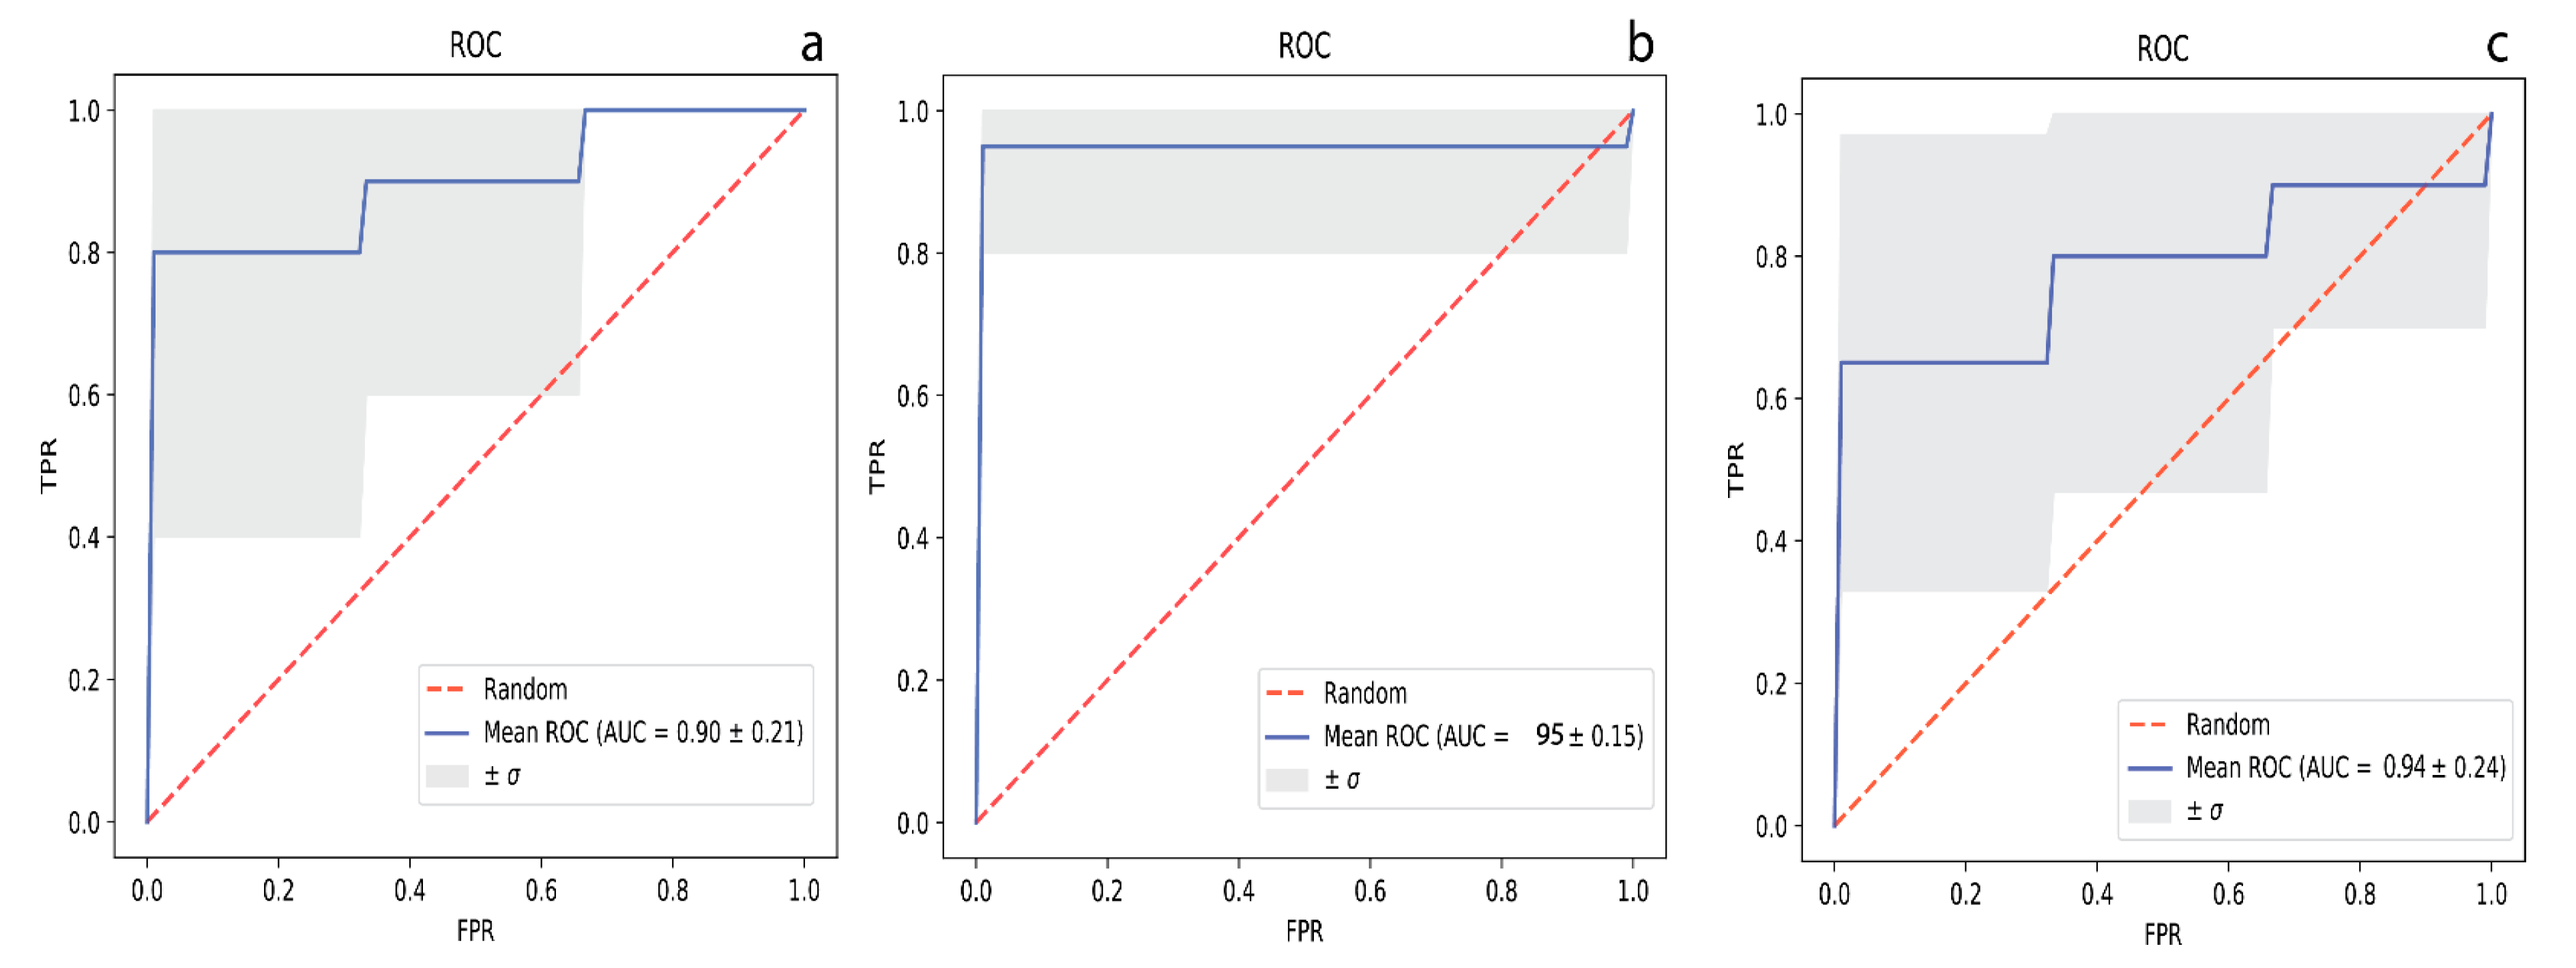
2. Results
3. Discussion
4. Materials and Methods
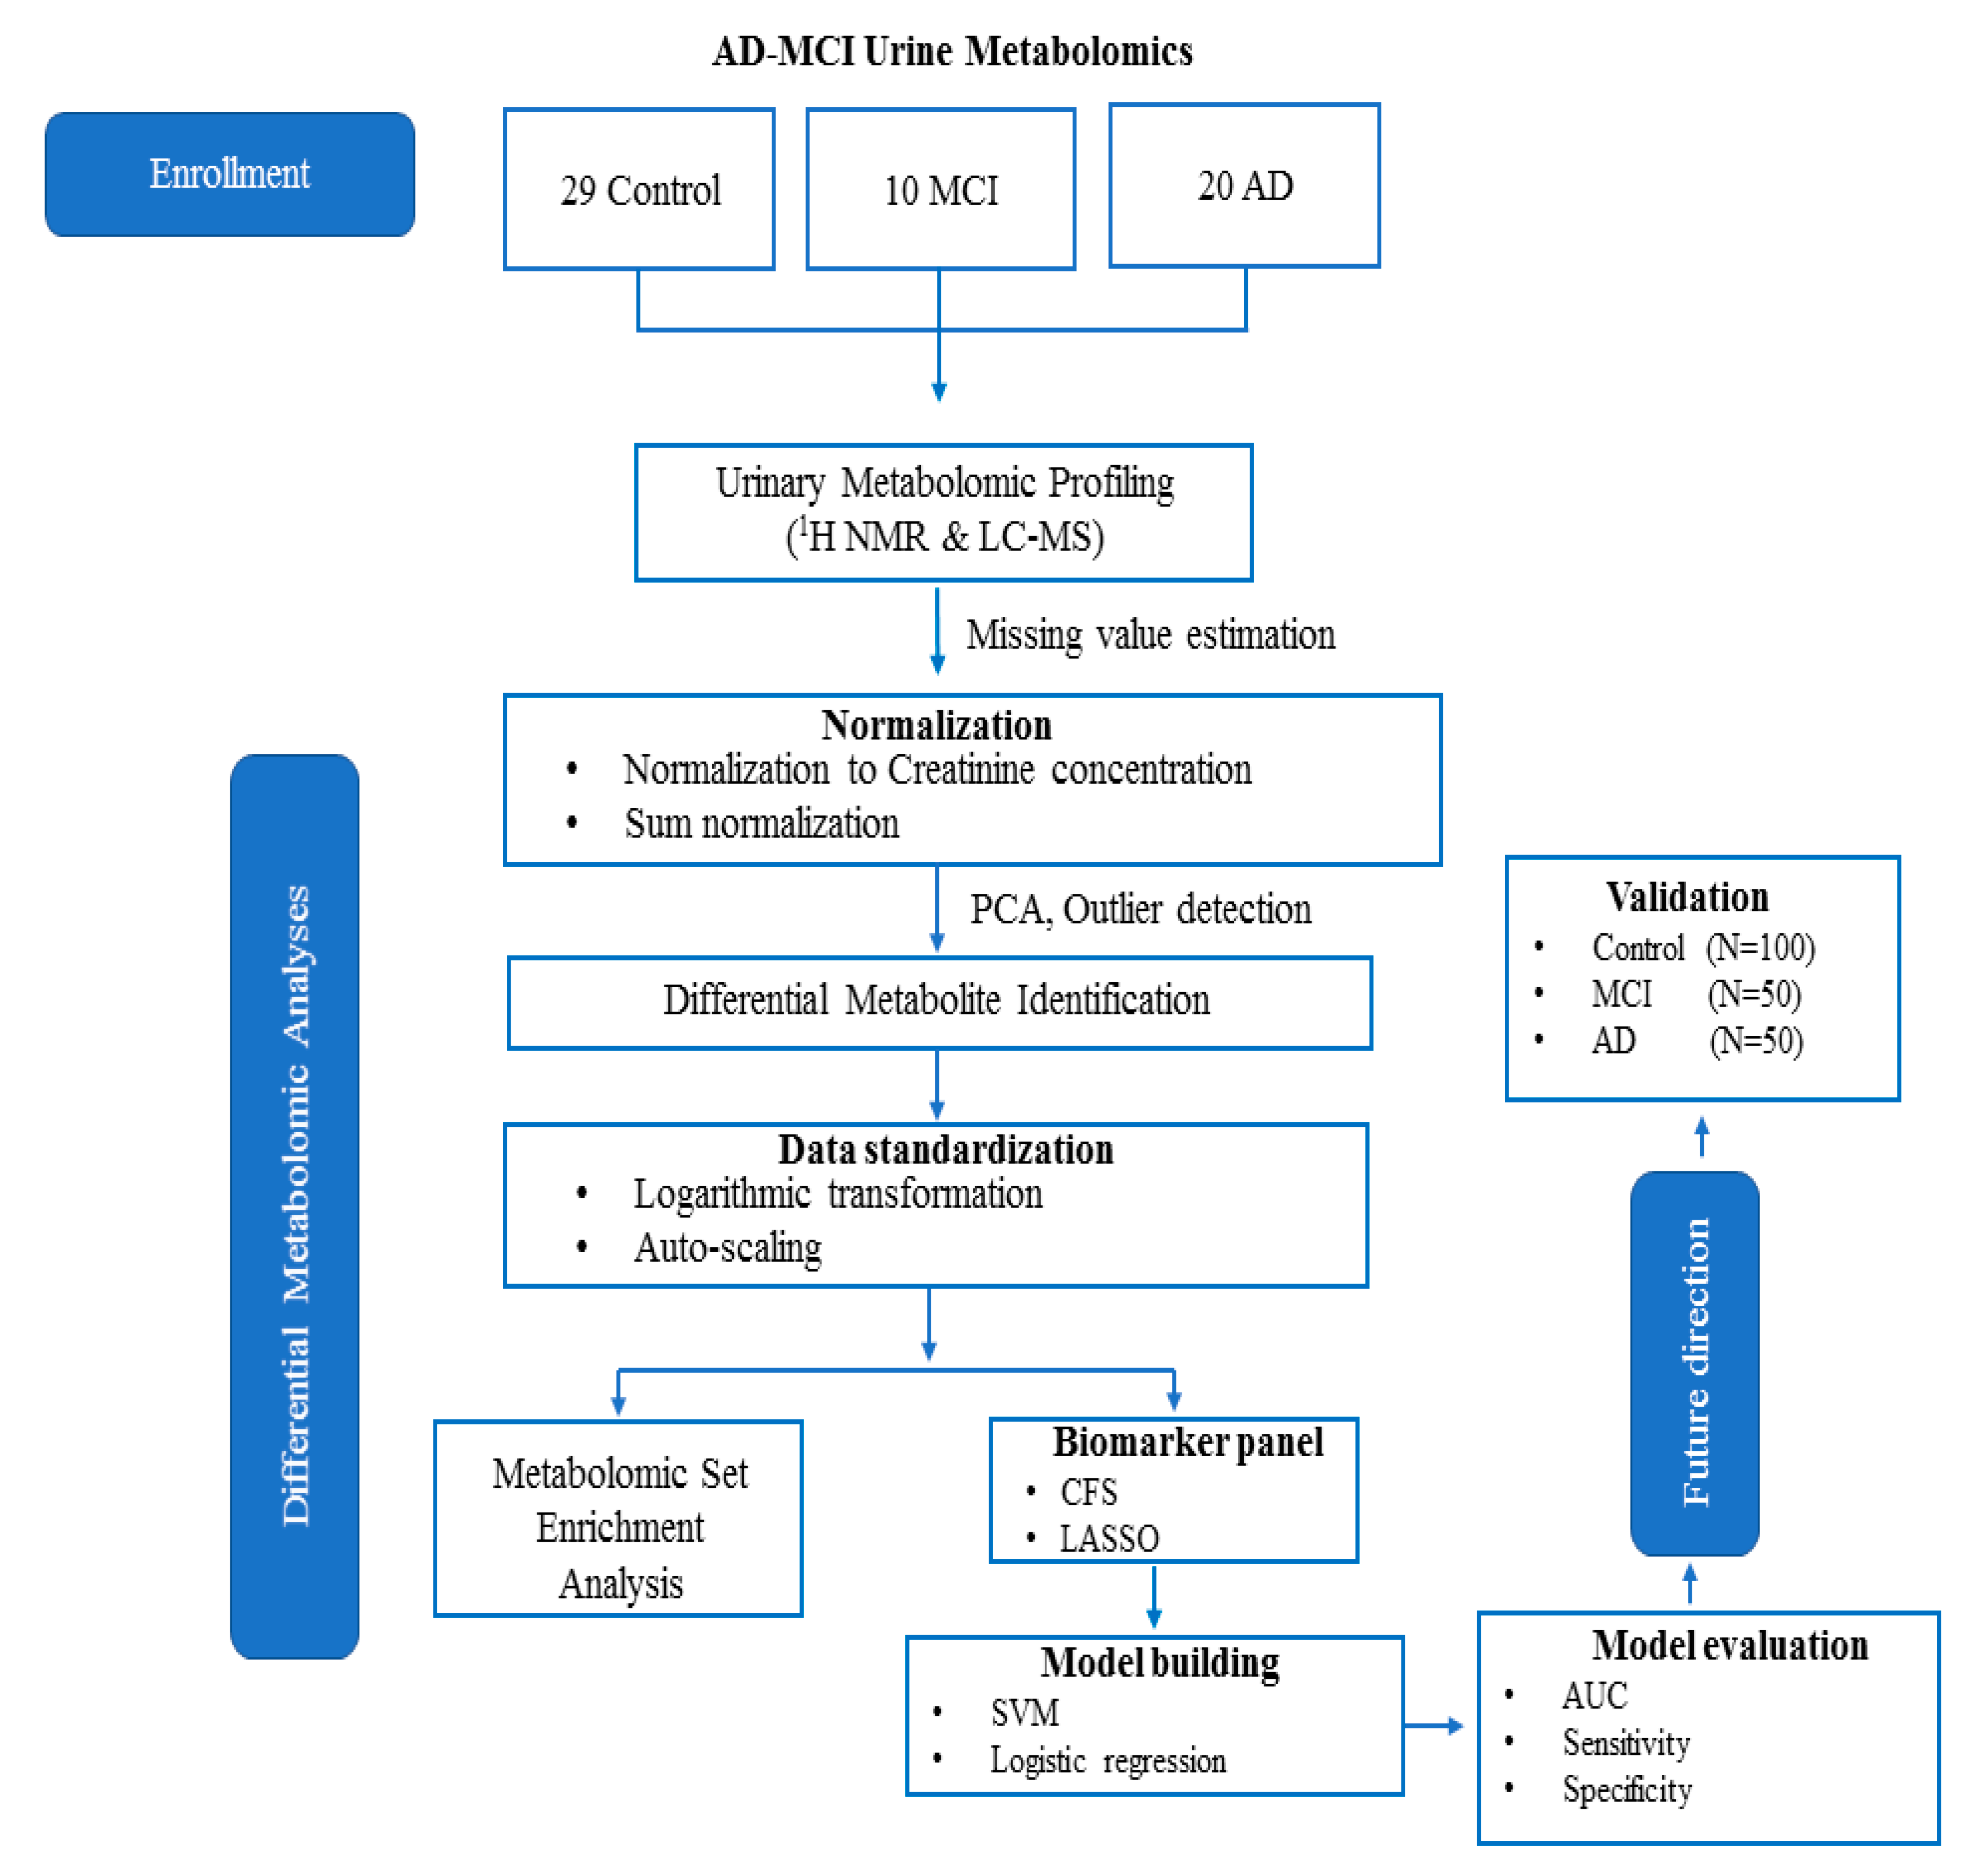
4.1. Urine Samples
4.2. 1H NMR Analysis
4.2.1. Sample Preparation and Acquisition
4.2.2. Metabolite Identification and Quantification
4.3. DI/LC-MS/MS Analysis
4.4. Statistical Analysis
5. Conclusions
Supplementary Materials
Author Contributions
Funding
Conflicts of Interest
Data Availability
References
- Guo, R.; Fan, G.; Zhang, J.; Wu, C.; Du, Y.; Ye, H.; Li, Z.; Wang, L.; Zhang, Z.; Zhang, L.; et al. A 9-microRNA Signature in Serum Serves as a Noninvasive Biomarker in Early Diagnosis of Alzheimer’s Disease. J. Alzheimer Dis. JAD 2017, 60, 1365–1377. [Google Scholar] [CrossRef] [PubMed]
- Olsson, B.; Lautner, R.; Andreasson, U.; Öhrfelt, A.; Portelius, E.; Bjerke, M.; Hölttä, M.; Rosén, C.; Olsson, C.; Strobel, G.; et al. Csf and blood biomarkers for the diagnosis of alzheimer’s disease: A systematic review and meta-analysis. Lancet. Neurol. 2016, 15, 673–684. [Google Scholar] [CrossRef]
- Graham, S.F.; Chevallier, O.P.; Roberts, D.; Hölscher, C.; Elliott, C.T.; Green, B.D. Investigation of the Human Brain Metabolome to Identify Potential Markers for Early Diagnosis and Therapeutic Targets of Alzheimer’s Disease. Anal. Chem. 2013, 85, 1803–1811. [Google Scholar] [CrossRef] [PubMed]
- Ballard, C.; Gauthier, S.; Corbett, A.; Brayne, C.; Aarsland, D.; Jones, E. Alzheimer’s disease. Lancet 2011, 377, 1019–1031. [Google Scholar] [CrossRef]
- Khoury, R.; Patel, K.; Gold, J.; Hinds, S.; Grossberg, G.T. Recent Progress in the Pharmacotherapy of Alzheimer’s Disease. Drugs Aging 2017, 34, 811–820. [Google Scholar] [CrossRef]
- Geda, Y.E. Mild cognitive impairment in older adults. Curr. Psychiatry Rep. 2012, 14, 320–327. [Google Scholar] [CrossRef]
- Roberts, R.; Knopman, D.S. Classification and epidemiology of MCI. Clin. Geriatr. Med. 2013, 29, 753–772. [Google Scholar] [CrossRef]
- Yesavage, J.A.; O’Hara, R.; Kraemer, H.; Noda, A.; Taylor, J.L.; Ferris, S.; Gély-Nargeot, M.C.; Rosen, A.; Friedman, L.; Sheikh, J.; et al. Modeling the prevalence and incidence of Alzheimer’s disease and mild cognitive impairment. J. Psychiatr. Res. 2002, 36, 281–286. [Google Scholar] [CrossRef]
- Caraci, F.; Castellano, S.; Salomone, S.; Drago, F.; Bosco, P.; Di Nuovo, S. Searching for disease-modifying drugs in AD: Can we combine neuropsychological tools with biological markers? CNS Neurol. Disord. Drug Targets 2014, 13, 173–186. [Google Scholar] [CrossRef]
- Beckonert, O.; Keun, H.C.; Ebbels, T.M.; Bundy, J.; Holmes, E.; Lindon, J.C.; Nicholson, J.K. Metabolic profiling, metabolomic and metabonomic procedures for NMR spectroscopy of urine, plasma, serum and tissue extracts. Nat. Protoc. 2007, 2, 2692–2703. [Google Scholar] [CrossRef]
- Yilmaz, A.; Geddes, T.; Han, B.; Bahado-Singh, R.O.; Wilson, G.D.; Imam, K.; Maddens, M.; Graham, S.F. Diagnostic Biomarkers of Alzheimer’s Disease as Identified in Saliva using 1H NMR-Based Metabolomics. J. Alzheimer Dis. JAD 2017, 58, 355–359. [Google Scholar] [CrossRef] [PubMed]
- Pan, X.; Nasaruddin, M.B.; Elliott, C.T.; McGuinness, B.; Passmore, A.P.; Kehoe, P.G.; Hölscher, C.; McClean, P.L.; Graham, S.F.; Green, B.D. Alzheimer’s disease-like pathology has transient effects on the brain and blood metabolome. Neurobiol. Aging 2016, 38, 151–163. [Google Scholar] [CrossRef] [PubMed]
- Graham, S.F.; Rey, N.L.; Yilmaz, A. Biochemical Profiling of the Brain and Blood Metabolome in a Mouse Model of Prodromal Parkinson’s Disease Reveals Distinct Metabolic Profiles. J. Proteome Res. 2018, 17, 2460–2469. [Google Scholar] [CrossRef] [PubMed]
- Alpay Savasan, Z.; Yilmaz, A.; Ugur, Z.; Aydas, B.; Bahado-Singh, R.O.; Graham, S.F. Metabolomic Profiling of Cerebral Palsy Brain Tissue Reveals Novel Central Biomarkers and Biochemical Pathways Associated with the Disease: A Pilot Study. Metabolites 2019, 9, 27. [Google Scholar] [CrossRef]
- Koç, E.R.; Ilhan, A.; Zübeyde, A.; Acar, B.; Gürler, M.; Altuntaş, A.; Karapirli, M.; Bodur, A.S. A comparison of hair and serum trace elements in patients with Alzheimer disease and healthy participants. Turk. J. Med. Sci. 2015, 45, 1034–1039. [Google Scholar] [CrossRef]
- Trushina, E.; Dutta, T.; Persson, X.M.; Mielke, M.M.; Petersen, R.C. Identification of altered metabolic pathways in plasma and CSF in mild cognitive impairment and Alzheimer’s disease using metabolomics. PLoS ONE 2013, 8, e63644. [Google Scholar] [CrossRef]
- González-Domínguez, R.; García-Barrera, T.; Gómez-Ariza, J.L. Using direct infusion mass spectrometry for serum metabolomics in Alzheimer’s disease. Anal. Bioanal. Chem. 2014, 406, 7137–7148. [Google Scholar] [CrossRef]
- Botosoa, E.P.; Zhu, M.; Marbeuf-Gueye, C.; Triba, M.N.; Dutheil, F.; Duyckäerts, C.; Beaune, P.; Loriot, M.A.; Le Moyec, L. NMR metabolomic of frontal cortex extracts: First study comparing two neurodegenerative diseases, Alzheimer disease and amyotrophic lateral sclerosis. IRBM 2012, 33, 281–286. [Google Scholar] [CrossRef]
- Liang, Q.; Liu, H.; Zhang, T.; Jiang, Y.; Xing, H.; Zhang, A.-H. Metabolomics-based screening of salivary biomarkers for early diagnosis of Alzheimer’s disease. RSC Adv. 2015, 5, 96074–96079. [Google Scholar] [CrossRef]
- Koal, T.; Klavins, K.; Seppi, D.; Kemmler, G.; Humpel, C. Sphingomyelin SM(d18:1/18:0) is significantly enhanced in cerebrospinal fluid samples dichotomized by pathological amyloid-β42, tau, and phospho-tau-181 levels. J. Alzheimer Dis. JAD 2015, 44, 1193–1201. [Google Scholar] [CrossRef]
- Nho, K.; Kueider-Paisley, A.; MahmoudianDehkordi, S.; Arnold, M.; Risacher, S.L.; Louie, G.; Blach, C.; Baillie, R.; Han, X.; Kastenmüller, G.; et al. Altered bile acid profile in mild cognitive impairment and Alzheimer’s disease: Relationship to neuroimaging and CSF biomarkers. Alzheimer Dement. J. Alzheimer Assoc. 2019, 15, 232–244. [Google Scholar] [CrossRef] [PubMed]
- Liu, Y.; Wei, M.; Yue, K.; Hu, M.; Li, S.; Men, L.; Pi, Z.; Liu, Z.; Liu, Z. Study on Urine Metabolic Profile of Aβ25-35-Induced Alzheimer’s Disease Using UHPLC-Q-TOF-MS. Neuroscience 2018, 394, 30–43. [Google Scholar] [CrossRef] [PubMed]
- Echeverry, G.; Hortin, G.L.; Rai, A.J. Introduction to urinalysis: Historical perspectives and clinical application. Methods Mol. Biol. 2010, 641, 1–12. [Google Scholar] [CrossRef]
- Garrod, A.E. The incidence of alkaptonuria: A study in chemical individuality. 1902. Mol. Med. 1996, 2, 274–282. [Google Scholar] [CrossRef]
- Issaq, H.J.; Nativ, O.; Waybright, T.; Luke, B.; Veenstra, T.D.; Issaq, E.J.; Kravstov, A.; Mullerad, M. Detection of bladder cancer in human urine by metabolomic profiling using high performance liquid chromatography/mass spectrometry. J. Urol. 2008, 179, 2422–2426. [Google Scholar] [CrossRef] [PubMed]
- Kim, K.; Aronov, P.; Zakharkin, S.O.; Anderson, D.; Perroud, B.; Thompson, I.M.; Weiss, R.H. Urine metabolomics analysis for kidney cancer detection and biomarker discovery. Mol. Cell. Proteom. MCP 2009, 8, 558–570. [Google Scholar] [CrossRef]
- Pasikanti, K.K.; Esuvaranathan, K.; Ho, P.C.; Mahendran, R.; Kamaraj, R.; Wu, Q.H.; Chiong, E.; Chan, E.C. Noninvasive urinary metabonomic diagnosis of human bladder cancer. J. Proteome Res. 2010, 9, 2988–2995. [Google Scholar] [CrossRef]
- Yu, J.; Kong, L.; Zhang, A.; Han, Y.; Liu, Z.; Sun, H.; Liu, L.; Wang, X. High-Throughput Metabolomics for Discovering Potential Metabolite Biomarkers and Metabolic Mechanism from the APPswe/PS1dE9 Transgenic Model of Alzheimer’s Disease. J. Proteome Res. 2017, 16, 3219–3228. [Google Scholar] [CrossRef]
- Fukuhara, K.; Ohno, A.; Ota, Y.; Senoo, Y.; Maekawa, K.; Okuda, H.; Kurihara, M.; Okuno, A.; Niida, S.; Saito, Y.; et al. NMR-based metabolomics of urine in a mouse model of Alzheimer’s disease: Identification of oxidative stress biomarkers. J. Clin. Biochem. Nutr. 2013, 52, 133–138. [Google Scholar] [CrossRef]
- Peng, J.; Guo, K.; Xia, J.; Zhou, J.; Yang, J.; Westaway, D.; Wishart, D.S.; Li, L. Development of isotope labeling liquid chromatography mass spectrometry for mouse urine metabolomics: Quantitative metabolomic study of transgenic mice related to Alzheimer’s disease. J. Proteome Res. 2014, 13, 4457–4469. [Google Scholar] [CrossRef]
- Castor, K.J.; Shenoi, S.; Edminster, S.P.; Tran, T.; King, K.S.; Chui, H.; Pogoda, J.M.; Fonteh, A.N.; Harrington, M.G. Urine dicarboxylic acids change in pre-symptomatic Alzheimer’s disease and reflect loss of energy capacity and hippocampal volume. PLoS ONE 2020, 15, e0231765. [Google Scholar] [CrossRef]
- Boksa, P. A way forward for research on biomarkers for psychiatric disorders. J. Psychiatry Neurosci. JPN 2013, 38, 75–77. [Google Scholar] [CrossRef]
- Mapstone, M.; Cheema, A.K.; Fiandaca, M.S. Plasma phospholipids identify antecedent memory impairment in older adults. Nat. Med. 2014, 20, 415–418. [Google Scholar] [CrossRef] [PubMed]
- Vapnik, V.N. An overview of statistical learning theory. IEEE Trans. Neural Netw. 1999, 10, 988–999. [Google Scholar] [CrossRef]
- Xi, B.; Gu, H.; Baniasadi, H.; Raftery, D. Statistical analysis and modeling of mass spectrometry-based metabolomics data. Methods Mol. Biol. 2014, 1198, 333–353. [Google Scholar] [CrossRef]
- Cunnane, S.; Nugent, S.; Roy, M.; Courchesne-Loyer, A.; Croteau, E.; Tremblay, S.; Castellano, A.; Pifferi, F.; Bocti, C.; Paquet, N.; et al. Brain fuel metabolism, aging, and Alzheimer’s disease. Nutrition 2011, 27, 3–20. [Google Scholar] [CrossRef] [PubMed]
- Kan, H.E.; Renema, W.K.J.; Isbrandt, D.; Heerschap, A. Phosphorylated guanidinoacetate partly compensates for the lack of phosphocreatine in skeletal muscle of mice lacking guanidinoacetate methyltransferase. J. Physiol. 2004, 560, 219–229. [Google Scholar] [CrossRef] [PubMed]
- Parra, M.; Stahl, S.; Hellmann, H. Vitamin B6 and Its Role in Cell Metabolism and Physiology. Cells 2018, 7, 84. [Google Scholar] [CrossRef]
- Morris, M.C.; Schneider, J.A.; Tangney, C.C. Thoughts on B-vitamins and dementia. J. Alzheimer Dis. JAD 2006, 9, 429–433. [Google Scholar] [CrossRef]
- Albrahim, T. The potential role of nutritional components in improving brain function among patients with Alzheimers disease: A meta-analysis of RCT studies. Neurosciences 2020, 25, 4–17. [Google Scholar] [CrossRef]
- Tibshirani, R. Regression Shrinkage and Selection Via the Lasso. J. R. Stat. Soc. Ser. B 1996, 58, 267–288. [Google Scholar] [CrossRef]
- Soliman, O.S.; Rassem, A. Correlation Based Feature Selection Using Quantum Bio Inspired Estimation of Distribution Algorithm; Springer: Berlin/Heidelberg, Germany, 2012; pp. 318–329. [Google Scholar]
- Nova, D.; Estévez, P.A. A review of learning vector quantization classifiers. Neural Comput. Appl. 2014, 25, 511–524. [Google Scholar] [CrossRef]
- McKhann, G.; Drachman, D.; Folstein, M.; Katzman, R.; Price, D.; Stadlan, E.M. Clinical diagnosis of Alzheimer’s disease: Report of the NINCDS-ADRDA Work Group under the auspices of Department of Health and Human Services Task Force on Alzheimer’s Disease. Neurology 1984, 34, 939–944. [Google Scholar] [CrossRef] [PubMed]
- Kim, J.; Ahn, J.K.; Cheong, Y.E.; Lee, S.-J.; Cha, H.-S.; Kim, K.H. Systematic re-evaluation of the long-used standard protocol of urease-dependent metabolome sample preparation. PLoS ONE 2020, 15, e0230072. [Google Scholar] [CrossRef]
- Vignoli, A.; Ghini, V.; Meoni, G.; Licari, C.; Takis, P.G.; Tenori, L.; Turano, P.; Luchinat, C. High-Throughput Metabolomics by 1D NMR. Angew. Chem. Int. Ed. 2019, 58, 968–994. [Google Scholar] [CrossRef]
- Ravanbakhsh, S.; Liu, P.; Bjorndahl, T.C.; Mandal, R.; Grant, J.R.; Wilson, M.; Eisner, R.; Sinelnikov, I.; Hu, X.; Luchinat, C.; et al. Accurate, fully-automated NMR spectral profiling for metabolomics. PLoS ONE 2015, 10, e0124219. [Google Scholar] [CrossRef]
- Chong, J.; Soufan, O.; Li, C.; Caraus, I.; Li, S.; Bourque, G.; Wishart, D.S.; Xia, J. MetaboAnalyst 4.0: Towards more transparent and integrative metabolomics analysis. Nucleic Acids Res. 2018, 46, W486–W494. [Google Scholar] [CrossRef]
- Chong, J.; Wishart, D.S.; Xia, J. Using MetaboAnalyst 4.0 for Comprehensive and Integrative Metabolomics Data Analysis. Curr. Protoc. Bioinform. 2019, 68, e86. [Google Scholar] [CrossRef]
- Hall, M.; Frank, E.; Holmes, G.; Pfahringer, B.; Reutemann, P.; Witten, I.H. The WEKA data mining software: An update. SIGKDD Explor. Newsl. 2009, 11, 10–18. [Google Scholar] [CrossRef]


| Controls | MCI | AD | P-Value | |
|---|---|---|---|---|
| n | 29 | 10 | 20 | |
| Age, Mean (SD) | 79.12 (6.28) | 76.57 (9.37) | 79.92 (9.11) | 0.43 a |
| Gender | ||||
| Male | 13 | 5 | 9 | 0.56 b |
| Female | 16 | 5 | 11 |
| Name | Mean (SD) of HC | Mean (SD) of MCI | Mean (SD) of AD | P-Value HC vs MCI | P-Value MCI vs AD | P-Value HC vs AD |
|---|---|---|---|---|---|---|
| 2-Hydroxybutyric acid | 2.774 (1.379) | 2.431 (1.244) | 4.271 (2.599) | 0.4368 (W) | 0.01762 (W) | 0.0423 (W) |
| 2-Hydroxyisovaleric acid | 0.948 (0.352) | 0.891 (0.351) | 0.013 (0.014) | 0.2522 | 0.03331 (W) | 0.0461 (W) |
| 3-Hydroxybutyric acid | 3.938 (5.098) | 2.559 (2.904) | 3.295 (2.450) | 0.0495 (W) | 0.0795 (W) | 0.0832(W) |
| 3-Hydroxyisovaleric acid | 3.861 (1.909) | 2.833 (0.929) | 3.393 (1.350) | 0.0048 | 0.0347 (W) | 0.1528 (W) |
| 5-Aminopentanoic acid | 3.955 (4.715) | 2.882 (2.831) | 3.445 (3.628) | 0.0308 (W) | 0.0257 (W) | 0.7668 (W) |
| Alpha-ketoisovaleric acid | 3.402 (1.864) | 2.564 (1.548) | 1.015 (0.904) | 0.0463 (W) | 0.0411 (W) | 0.0307 (W) |
| C6:1 | 0.009 (0.007) | 0.014 (0.012) | 0.008 (0.008) | 0.1643 (W) | 0.0166 (W) | 0.2476 (W) |
| Cytosine | 6.279 (7.311) | 11.623 (15.351) | 19.403 (8.093) | 0.0487 (W) | 0.0386 (W) | 0.06467 (W) |
| D-Glucose | 14.035 (8.563) | 9.128 (3.037) | 13.541 (6.780) | 0.0336 (W) | 0.01232 | 0.0204 |
| Dimethylsulfone | 9.238 (7.167) | 5.028 (3.839) | 4.173 (5.835) | 0.9646 | 0.0190 (W) | 0.0820 (W) |
| Guanidoacetic acid | 15.031 (9.884) | 9.077 (3.838) | 16.389 (7.515) | 0.0103 | 0.0038 (W) | 0.4371 (W) |
| Hippuric acid | 55.489 (7.874) | 40.655 (6.302) | 57.376 (6.537) | 0.3908 (W) | 0.0111 (W) | 0.9945 |
| Mannitol | 13.260 (4.916) | 17.071 (6.889) | 7.808 (6.440) | 0.4368 (W) | 0.0429 (W) | 0.1414 (W) |
| Methanol | 52.958 (6.169) | 59.581 (5.870) | 47.690 (3.050) | 0.0266 (W) | 0.0021 | 0.0552 (W) |
| PC aa C32:0 | 0.019 (0.430) | 0.02 (0.001) | 0.02 (0.003) | 0.1850 (W) | 0.0403 (W) | 0.4136 (W) |
| Trimethylamine | 0.958 (2.582) | 3.073 (5.811) | 1.197 (3.040) | 0.0121 (W) | 0.0412 (W) | 0.0439 (W) |
| Tryptophan | 22.649 (22.057) | 20.443 (11.526) | 17.337 (9.148) | 0.4646 | 0.0114 (W) | 0.8012 (W) |
| Alanine | 7.553 (7.690) | 6.386 (3.828) | 7.401 (3.007) | 0.8868 (W) | 0.0439 (W) | 0.7395 (W) |
| Proline | 4.727 (2.369) | 5.641 (3.053) | 6.804 (3.828) | 0.4954 (W) | 0.3735 (W) | 0.0394 |
| Pyridoxine | 0.976 (1.215) | 0.477 (0.375) | 0.390 (0.373) | 0.2720 (W) | 0.5884 (W) | 0.0249 (W) |
| Isoleucine | 1.563 (0.917) | 1.283 (0.740) | 0.968 (0.416) | 0.7158 (W | 0.02364 | 0.9438 (W) |
| Myo-inositol | 18.945 (6.379) | 15.869 (8.629) | 16.034 (5.995) | 0.0331 (W) | 0.0134 | 0.3440 (W) |
| Trimethylamine n-oxide | 10.229 (7.735) | 19.907 (10.822) | 18.864 (11.571) | 0.0425 | 0.7488 | 0.0134 |
| Glycolic acid | 12.043 (7.354) | 15.671 (9.141) | 8.274 (4.972) | 0.9370 (W) | 0.3735 (W) | 0.0518 |
| Acetic acid | 6.136 (1.867) | 14.663 (2.450) | 9.336 (2.758) | 0.0485 (W) | 0.0103 | 0.7548 (W) |
| Acetone | 0.884 (0.802) | 1.442 (1.767) | 1.068 (0.907) | 0.7856 (W) | 0.0446 | 1.0000 (W) |
| PC ae C36:4 | 0.002 (0.001) | 0.002 (0.003) | 0.019 (0.034) | 0.0134 (W) | 0.0495 (W) | 0.2720 (W) |
| SM C26:0 | 0.674 (0.974) | 0.350 (0.876) | 0.674 (0.974) | 0.0475 (W) | 0.0457 (W) | 0.1643 (W) |
| PC ae C36:0 | 2.376 (0.769) | 1.622 (3.323) | 2.878 (1.428) | 0.02241 | 0.0403 (W) | 0.3934 (W) |
| Caffeine | 2.934 (1.724) | 1.962 (2.014) | 2.274 (1.375) | 0.0491 (W) | 0.3115 (W) | 0.0691 (W) |
| Isobutyric acid | 1.237 (0.840) | 1.698 (1.201) | 2.776 (1.724) | 0.0406 (W) | 0.0646 (W) | 0.0628 (W) |
© 2020 by the authors. Licensee MDPI, Basel, Switzerland. This article is an open access article distributed under the terms and conditions of the Creative Commons Attribution (CC BY) license (http://creativecommons.org/licenses/by/4.0/).
Share and Cite
Yilmaz, A.; Ugur, Z.; Bisgin, H.; Akyol, S.; Bahado-Singh, R.; Wilson, G.; Imam, K.; Maddens, M.E.; Graham, S.F. Targeted Metabolic Profiling of Urine Highlights a Potential Biomarker Panel for the Diagnosis of Alzheimer’s Disease and Mild Cognitive Impairment: A Pilot Study. Metabolites 2020, 10, 357. https://doi.org/10.3390/metabo10090357
Yilmaz A, Ugur Z, Bisgin H, Akyol S, Bahado-Singh R, Wilson G, Imam K, Maddens ME, Graham SF. Targeted Metabolic Profiling of Urine Highlights a Potential Biomarker Panel for the Diagnosis of Alzheimer’s Disease and Mild Cognitive Impairment: A Pilot Study. Metabolites. 2020; 10(9):357. https://doi.org/10.3390/metabo10090357
Chicago/Turabian StyleYilmaz, Ali, Zafer Ugur, Halil Bisgin, Sumeyya Akyol, Ray Bahado-Singh, George Wilson, Khaled Imam, Michael E. Maddens, and Stewart F. Graham. 2020. "Targeted Metabolic Profiling of Urine Highlights a Potential Biomarker Panel for the Diagnosis of Alzheimer’s Disease and Mild Cognitive Impairment: A Pilot Study" Metabolites 10, no. 9: 357. https://doi.org/10.3390/metabo10090357
APA StyleYilmaz, A., Ugur, Z., Bisgin, H., Akyol, S., Bahado-Singh, R., Wilson, G., Imam, K., Maddens, M. E., & Graham, S. F. (2020). Targeted Metabolic Profiling of Urine Highlights a Potential Biomarker Panel for the Diagnosis of Alzheimer’s Disease and Mild Cognitive Impairment: A Pilot Study. Metabolites, 10(9), 357. https://doi.org/10.3390/metabo10090357