Abstract
In this paper, the magnetic flux density distribution on the cross-sections of a transformer core is studied. The core for this study consists of two identical U-shaped cores joint at their open surfaces with known air gaps. The magnetic flux density at one of their joint boundary surfaces was measured for different air gaps. A finite element model (FEM) was built to simulate the magnetic flux density and compared with experiment data. Using the validated FEM, the distributed magnetic flux density on the cross-section of the core structure can be obtained when the air gap approaches zero. An engineering model of the density based on the Ampere’s circuit law was also developed and used to explain the relationship between air gap and mean magnetic flux density on the cross-section. The magnetic flux density on the cross-section was found to have a convex-shaped distribution and could be described by an empirical formula. Using this approach, the magnetic flux density distribution in cores with different interlayer insulation was obtained and discussed. This method could also examine the leakage of magnetic flux density in the air gap region when the distance is non-zero, and the relationship between the leakage field and the field in the core structure. The proposed method and model can provide a more detailed understanding for the magnetic field of transformer cores and potential application in designing quiet transformers and condition monitoring.
1. Introduction
An understanding of the magnetic flux density distribution in a transformer core is important for transformer vibration analysis, noise prediction, core loss control, inductor design and manufacturing [1,2,3]. Measurements of flux density for individual core’s packages, using wires wound in each package of the limbs and yokes, have indicated that the centre package of the core had the minimum magnetic flux density [4]. Enokizono et al. used this wound-wire approach for an experimental study of the flux density variation on each sheet of a single-phase and three-phase wound core [5,6]. However, experiments based on wound-wires restricts the measurement to only the core’s local magnetic flux. The magnetic field inside the core can also be measured by using a search coil placed inside holes drilled into the core [7]. Shilyashki measured the magnetic flux density inside the core by inserting a pin sensor with pickup coil to the measurement channels [1,8]. However, the large discontinuity in the magnetic flux within the holes may introduce unpredictable perturbations in the magnetic field, requiring detailed correction of the data. Further, this method also limits the measurement only in one line of the cross-section.
Some experimental and numerical methods have also been applied to better understand the cross-section magnetic distribution within a transformer. Shilyashki et al. measured the peripheral core regions’ magnetic induction with a tangential induction coil, which was placed on the core’s surface in air. This approach relates the desired magnetic field on the inner surface to the magnetic continuity condition measured on the boundary [2]. However, this indirect measurement cannot detect the magnetic distribution inside the core. Finite element methods were used by several scholars [9,10] and verified by physical quantities related to the magnetic induction, including winding inductance, coil current and iron loss. However, the magnetic flux density by using FEM was not adequately validated. For example, convex distributions have been observed by some researchers [4,5], while other researchers found it to be concave, even where experiments have extremely similar configurations [11,12,13]. Therefore, a more reliable approach is needed to provide a clearer understanding of the internal magnetic field within transformers.
In this paper, the magnetic flux density within the cross-section of cores was initially investigated by a finite element model. The distribution of the flux density was verified using an experiment and described by an empirical formula. Subsequently, the relationship between cores’ interlayer insulation and their magnetic distribution was studied and discussed. Using the two U-shaped cores, the leakage magnetic field in the gap region was also investigated using an asymptotic approach. The aims of this paper are to provide an understanding and model for the distributed magnetic flux density in unbroken (continuous) transformer cores. This understanding would aid applications which require an estimation of electromagnetic force density and magnetostriction within the core material in a transformer, parameters which cannot otherwise be directly measured. These applications include noise reduction, and condition monitoring of transformers by indirectly monitoring the emitted vibration, where quantifying such parameters is for fault diagnosis [14].
2. Experiment Setup
A two-phase two-limb transformer was investigated in this paper, whose configuration is shown in Figure 1a. The length of yokes and limbs of the core, A and B, are 500 mm and 350 mm, respectively. The width (w) of the yokes and the limbs are 70 mm. The core contains 150 laminated thin silicon steel sheets aligned in the yz-plane, making the core is 70 mm thick (h). Two coils of 170 turns are wrapped on the two limbs using insulated 12 AWG Gauge copper wires.
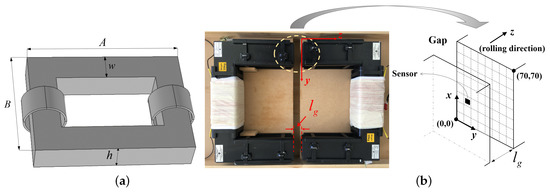
Figure 1.
(a) The configuration of the two-phase two-limb transformer; (b) Photo of the two U-shaped cores to form the transformer and details of the air gap region.
The experimental rig shown in Figure 1b was used for the examination of the magnetic flux density distribution on the cross-section of the transformer core. The rig consists of two U-shaped cores. When the distance between the surfaces of the cores and the connection interfaces approaches zero, the rig becomes the transformer shown in Figure 1a. The open ends of the U-shaped cores were re-painted to ensure the integrity of the insulation. The cores were mounted on a base structure such that the gap distance between them can be readily adjusted. Investigated started from 2.5 mm to 100 mm, {2.5, 3, 4, 5, 6, 7, 8, 9, 10, 15, 20, 25, 30, 40, 50, 60, 70, 80, 90, 100}. The two coils were connected to the inphase and inverted output of the same signal generator in order to generate a continuous field within the core at 50 Hz. A custom built miniature hall sensor (accuracy: 10 T, size: 4 mm × 2.5 mm × 1.5 mm ) was used to measure the peak value of the magnetic flux density at 50 Hz (in the rolling direction: z) on one surface of the cross-section. The cross-sectional surface for the measurement was divided into equal-distanced grids to allow spatial measurement of the density as shown inset in Figure 1b.
Since the normal component of the magnetic flux density is continuous across the boundary, the magnetic flux density on the U-shaped core’s cross-section in the core material () is equal to the flux density in the air gap () on the surface:
The distributed magnetic flux density at the boundary surface was measured under all investigated . The distributed magnetic flux density on the cross-section was used to compare and validate the results from the FEM. Subsequently, at was simulated by the FEM. In other words, the normal magnetic flux density on the cross-section of the original intact two-phase two-limb transformer () illustrated in Figure 1a can be obtained by the validated FEM simulation after comparison with experimental results at .
3. FEM Simulation
The magnetic flux density in the air gap of the transformer was simulated by using FEM [15,16,17,18] for different values of . The finite element software provided the ability to calculate the time dependent current in the coils for periods of 0.1 s to 0.2 s stepped by 0.5 ms. The FEM included models for both magnetic fields and electrical circuits. Two sinusoidal voltages were used as the excitation of the two coils using an electrical circuit interface, with a peak applied voltage of 35.89 V and frequency of 50 Hz. The resistor and inductor of coils were set to 0.36 and 12 mH, respectively, which agree with the measured values in the system. With hysteresis effects neglected in the core, the governing equations for the simulation of magnetic field are as follows:
where is the vector magnetic potential and is the coil current density. is the conductivity. The effective conductivity in the cores was set to 10,000 S/m using experimentally corrected values [17]. The relationship between magnetic flux density and the magnetic field was defined by an experimentally obtained curve as = from measurements on the U-shaped cores. The mesh used in the simulation is shown in Figure 2. For better accuracy, the investigated surface on the cross-section was divided into fine equal-distanced grids, twice grid density than the experiment. In order to cover the experiment distances and observe a larger range of variation in FEM, the simulated air gaps were set to range from 0 mm to 150 mm.

Figure 2.
The mesh used in the FEM simulation.
4. Result and Discussion
4.1. Validation of FEM Simulation
The FEM was validated by comparison with experimental data on the whole surface, using gap distances varying from 2.5 mm to 100 mm. An engineering model based on Ampere’s circuit law was derived to verify the simulated mean magnetic flux density on the cross-section.
4.1.1. Comparison between Experiment and FEM Data
Experimental results of U-shaped cores for 64 subsections under all investigated air gap distances were compared with the FEM results. Relative errors () between the FEM simulated () and experiment measured ( ) were calculated based on Equation (5). Root mean square () of each investigated location’s relative error is expressed as Equation (6), where is the set of investigated air gap distances with cardinality .
Data of U-shaped cores on location , and based on the coordinates in Figure 1b and Figure 3a are shown in Figure 3b. For clarity, each curve in Figure 3b is offset from the one above by −30 mT. It is clear that (black stars in Figure 3b) are close to (red circles in Figure 3b). The average root mean squares of all investigated subsections of U-shaped cores is 0.068. This low indicates the excellent agreement between the FEM and the experimental system built for this analysis.
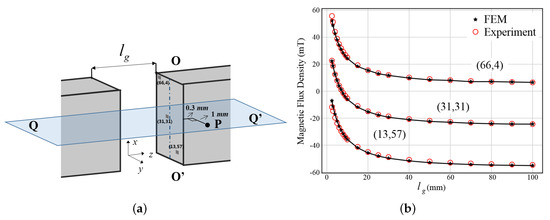
Figure 3.
(a) Illustration of cross-section and air gap region of U-shaped cores; (b) Simulated and measured of location , and under different air gap distances. For clarity, each curve is offset from the one above by −30 mT.
4.1.2. The Engineering Model
By considering Kirchhoff’s voltage law for the electrical circuit, the current in the coils can be described by:
where , , t and are the amplitude, angular frequency, time and phase of the excitation voltage, respectively; N, R and is the number of turn, resistance and current for each coil, respectively; is the total magnetic flux in the core. Applying Ampere’s circuital law to the closed loop for the magnetic flux density in the core structure as shown in Figure 1b, the total magnetic flux in the loop of two U-shaped cores can be written as [19]
where S is the cross-section area; is magnetic path length of the whole structure (including the two U-shapes); and are the permeability in the core and air, respectively; is a factor related to the fringing effect of the magnetic field and becomes more significant as increases. Combining Equations (7) and (8), the magnetic flux is
where , C is an arbitrary constant determined by the initial conditions. Ignoring the transient attenuation part and using the peak value of sinusoidal steady-state part () of , the mean magnetic flux density on the cross-section is [20]
where ; , and are the coefficients of the fringing effect model and depend on the cores’ mechanical and electromagnetic properties. Given the excitation voltage, the mean magnetic flux density described by the engineering model in Equation (10) is a function of . Due to the uncertainty of the mechanical and electromagnetic property, the coefficients , and are difficult to determine through direct measurement. Therefore, they were obtained by minimizing the least mean square error (LMSE) between the data and the model. , and for the experiment and FEM data, with the optimized results shown in Table 1.

Table 1.
Coefficients , and for experiment and FEM data.
The measured and FEM simulated mean magnetic flux density on the cross-section with their optimized engineering models are shown in Figure 4. The results for the FEM simulation are shown (black stars) along with measured data (red circles). Using the engineering model with parameters from Table 1, model approximations to the FEM (solid black line) and experiment (dotted red line) are also shown. Excellent agreement was obtained between the FEM, measurement and engineering models under all values of gap length. The correlation coefficients between the engineering model, measured and FEM simulated mean flux density of the cross-section were calculated to verify FEM simulation. The correlation coefficients for the measured data and simulated data to their optimized engineering curves were 99.95% and 99.99%, respectively. These high correlation coefficients indicate that the FEM and the parameters chosen describe the physical system extremely well. The derived engineering model also provides a useful analytical form for the relationship between the gap length () and the mean magnetic flux density.

Figure 4.
The measured and simulated mean magnetic flux density with their optimized engineering models on whole cross-section of the U-shaped cores.
4.2. Leakage Magnetic Flux Density in the Air Gap Region
On the cross-section, it could be observed in Figure 4 that the mean magnetic flux density increases with the decrease of the gap. In a zy-plane within the air gap region between the two core end-faces, the cross-section of the magnetic field was also simulated for different gap distances. Using this approach, the leakage magnetic flux density distribution in the air on plane Q-Q’ in Figure 3a are shown in Figure 5. The driving voltage for all the cases is the same (35.89 V). It can be seen that the magnetic flux is more concentrated in the gap region (the rectangular region between the two U-shape cores) when the gap distance is reduced. As the gap increases, a large proportion of the magnetic flux escapes from the gap region and field is concentrated at the corners of the cut section. The fringing effect associated with the air gaps and the finite cross-section area of the core result in a higher magnetic flux density on the boundary of the cross-section than that flux density near the center of the core. This observation matches with previous analytical and experimental reports of fringing effects [20,21] and further validates the FEM in this paper accurately representing the physical system.
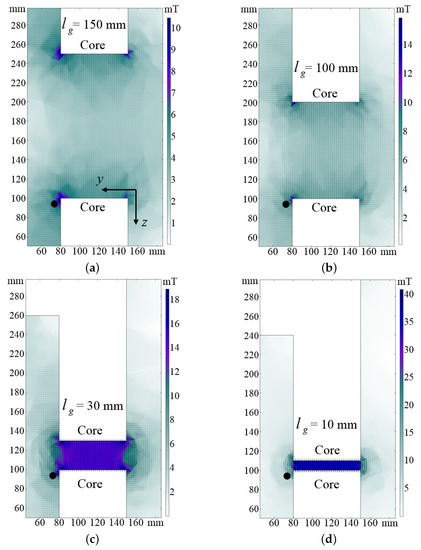
Figure 5.
Leakage magnetic flux density distribution in the air gap region for distance (a) 150 mm, (b) 100 mm (c) 30 mm and (d) 10 mm on cut plane Q-Q’. The black dot represents the point P.
The leakage magnetic flux density was examined for a series of air gap distances at a specific point P, the black dot shown in Figure 3a and Figure 5. Point P is located in the middle cut plane Q-Q’, offset 1 mm in the y-direction and 0.3 mm in the z-direction from the surface of the core. The relationship between the three-direction magnetic flux density on point P and air gap distance is shown in Figure 6. Obviously, the magnetic flux density in the x direction is nearly zero and far less than the other two directions, which is reasonable due to the structural symmetry of the transformer along the cut plane Q-Q’. With the increase of gap distance from zero, the leakage magnetic flux increases at first, as the rising edges in both y and z directions shown in Figure 6. As the propagating direction for oscillating magnetic field is in the z direction, the magnetic flux density in that direction is larger than that of the y direction in the region close to the face of the core. When the gap increases to a certain extent, the magnetic flux drops due to the increased magnetic reluctance of the magnetic path. The divergence of magnetic flux density also becomes larger in the gap region, thus the magnetic flux density in the z direction becomes lower than that of the y direction at a distance of about 20 mm gap distance. The similar leakage field may also be found in electromagnetic rotating machines. The above observed phenomena (shown in Figure 4, Figure 5 and Figure 6) of magnetic flux density changing against the air gap distance may provide some guidance for gap length design in other rotating machine with magnetic core containing air gaps [22].
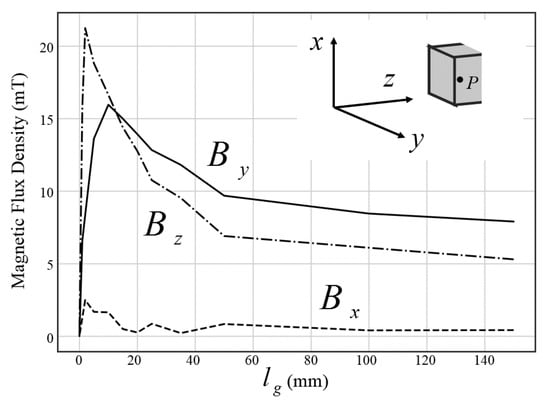
Figure 6.
The components of magnetic flux density vector at point P as a function of .
4.3. Distributed Magnetic Flux Density on the Cross-Section of the Transformer Core
Based on the verified FEM, as the air gap distance approaches zero, the distributed magnetic flux density on the cross-section of the original two-phase two-limb transformer was calculated as shown in Figure 7. The distribution results show that the normal magnetic flux density on the cross-section is not uniform. The flux density at the center is smaller than the edges. The overall shape are close to being symmetric (within the limits of the model accuracy), which is reasonable given the symmetry of cores across the laminations.

Figure 7.
The distributed magnetic flux density on the cross-section of the transformer core when mm.
Previous experimental and FEM reports in the literature have also reported a similar result introduction [4,5,7,9], supporting the FEM’s identification of the convex shape distribution on the cross-section. This convex distribution may be caused by the eddy current inside the core. The magnetic field excited by coils generates eddy current on the cross-section. Following Lenz’s law, the eddy current produces the opposite magnetic field, which in turn counteracts original magnetic field. With concentric-loop distributed on the cross-section of the core [23,24], eddy current counteracts the most on the center area of the magnetic field. Therefore, the cross-section presents the lower magnetic flux density on the center of the core. With a different magnetic permeability compared with air, transformer insulation oil () will affect the leakage magnetic field, however this change is expected to be very small as the core permeability dominates over both air and oil permeability. Increase applied voltages may also affect the flux distribution due to the nonlinear hysteresis of the magnetic field in the core material, however such considerations were outside of the scope of this work.
For the practical use of the distributed field on the cross-section, an empirical formula may be used:
where , , , , and are coefficients determined by minimizing the LMSE between the distributed data and the empirical formula. Values of the coefficients for the transformer investigated in this paper are shown in Table 2. The correlation coefficient between the data and the formula is 97.52%, which indicates the model in Equation (11) well represents the physical distribution of the field.
Table 2.
Coefficients in the empirical formula for the magnetic flux density distribution on the cross-section of the investigated transformer.
On the other hand, the distribution of the magnetic flux density for the shortest gap distance, = 2.5 mm, obtained by experiment (red dotted lines with circles) and FEM (black solid lines with stars) are shown in Figure 8a,b, respectively. An interesting phenomena is that this distribution is not as convex as the distribution inside the core in Figure 7a. The distribution for non-zero may be caused by the fringing effect of the magnetic field. This indicates that the mechanism involved in magnetic distribution on the cross-section is different for the inside and the surface of the core.
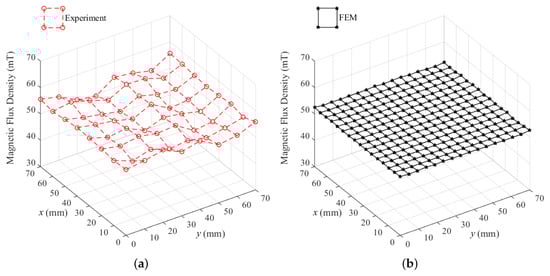
Figure 8.
The (a) experimental; and (b) FEM distribution of the magnetic flux density as the gap distance is mm.
4.4. The Influence of Insulation on the Distributed Magnetic Flux Density
To further investigate the distributed magnetic flux density on the cross-section, the influence of the core’s interlayer insulation on the magnetic distribution and the given empirical formula are discussed in this section. The normal electrical conductivity for silicon steel is approximate S/m. However, because of the insulation between adjacent silicon steel sheets, the actual conductivity of the structure is significantly reduced to a very small value. The insulation condition strongly affects the conductivity. Therefore, an effective conductivity in the FEM was used to represent the insulation of the core. The verified model was simulated under a series of conductivities with the gap distance of zero. The distributed magnetic flux density versus different conductivities from S/m to S/m on the median line O-O’ in Figure 3a is shown in Figure 9a.
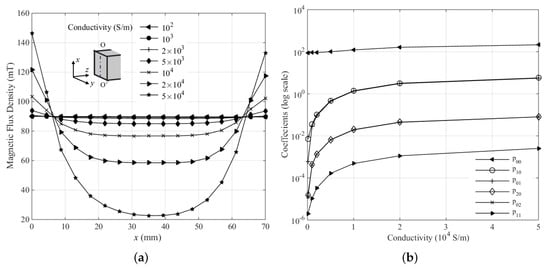
Figure 9.
(a) The magnetic flux density distribution on median line O-O’ under different conductivity from S/m to S/m based on the FEM; (b) The variation of coefficients (log scale) in the empirical formula along with the conductivity.
The data indicates that the shape of magnetic distribution varies from a ’plate’ to a ’bowl’ shape as the conductivity increases. This indicates that the magnetic distribution remains convex, regardless of the value of conductivity. However, the radius-of-curvature for the distribution increases as the conductivity increases. Using Maxwell’s equations, it could be observed that the higher the eddy current, the larger the curl of magnetic field. Therefore, the insulation of the transformer’s core has a strong influence on the cross-section’s magnetic flux density distribution. The coefficients (log scale) in the empirical formula for all simulated conductivities are shown in Figure 9, having a relatively high mean correlation coefficient of 98.05%. The constant term grows slowly with the increase of conductivity. The other coefficients are obviously smaller than , and increase with the conductivity. Coefficients and are close to and , respectively, which is quite reasonable due to the symmetry of the magnetic distribution on the cross-section.
The above observed phenomena is important in the research of transformers’ vibration analysis. As one of the most important sources for the core’s vibration, the electromagnetic and magnetostrictive force in the core is determined by the magnetic field. Once the insulation of the core is damaged, the fault can be detected through an analysis of the vibration caused by changes in the electromagnetic and magnetostrictive force, which also changes with the magnetic field. Further, since the conductivity is related to the energy loss, the results shown in this paper are expected to aim in the investigation of transformer loss analysis.
5. Conclusions
In this paper, the distributed magnetic flux density on the cross-section of a transformer core was investigated. A special test rig was designed with yokes cut and reconstructed into two identical U-shaped cores. The magnetic flux density on the cut surfaces was measured as the the gap distances reduced. A FEM was developed and verified by the measured data under a series of non-zero gap distances. A low error of 0.068 indicated excellent agreement between the experiment and FEM data for all investigated gap distances. An engineering model was presented to explain the change of mean magnetic flux density on the cross-section versus the gap distance, which was derived from Ampere’s circuit law, Kirchhoff’s voltage law, and a fringing flux model. Furthermore, as the distance approaches zero, the three dimensional asymptotic property of the leakage magnetic flux density in the gap region was also simulated and analysed. The magnetic flux density distribution of the original intact transformer was acquired by simulating the two U-shaped cores as their distance approached zero. The proposed magnetic flux density distribution across the cores’ cross-section was shown to have an overall convex shape, which may be explained by the counteraction of eddy currents associated with Lenz’ law. An empirical formula was used to describe this magnetic distribution. Finally, the influence of the insulation on the magnetic flux density distribution and coefficients of the formula was studied by simulating different conductivities when a zero gap distance was used. The distribution remained convex over a range of different core conductivities, with a radius-of-curvature that increases with the increase of conductivity. Although the mechanism of this magnetic distribution across the core’s cross-section needs further research, the observed results are meaningful for transformer design, fault diagnosis and noise control.
Author Contributions
Conceptualization, J.P., L.L. and X.D.; methodology, L.L., J.Z. and X.D.; software, L.L. and X.D.; validation, L.L. and X.D.; formal analysis, L.L. and X.D.; investigation, J.P., A.K., L.L. and X.D.; resources, J.P., H.H. and J.Z.; data curation, L.L. and X.D.; writing—original draft preparation, L.L.; writing—review and editing, J.P., A.K., D.M., L.L. and X.D.; visualization, L.L. and X.D.; supervision, J.P. and A.K.; project administration, J.P.; funding acquisition, J.P., H.H. and J.Z.
Funding
This project was supported by the China National Science Foundation (Grant No. 61603335, 11574269, 51875510) and the Natural Science Foundation of Zhejiang Province, China (Grant No. LY19F030024).
Acknowledgments
The second author would like to extend their gratitude to the UWA International Postgraduate Research Scholarship.
Conflicts of Interest
The authors declare no conflict of interest. The funders had no role in the design of the study; in the collection, analyses, or interpretation of data; in the writing of the manuscript, or in the decision to publish the results.
References
- Pfützner, H.; Shilyashki, G.; Hamberger, P.; Aigner, M.; Hofbauer, F.; Palkovits, M.; Trenner, G.; Gerstbauer, E.; Matkovic, I.; Galabov, V. Automatic 3-D building factor analyses of a grain-oriented model transformer core. IEEE Trans. Magn. 2014, 50, 1–4. [Google Scholar] [CrossRef]
- Shilyashki, G.; Pfützner, H.; Palkovits, M.; Hamberger, P.; Aigner, M. A tangential induction sensor for 3-D analyses of peripheral flux distributions in transformer cores. IEEE Trans. Magn. 2015, 51, 1–6. [Google Scholar] [CrossRef]
- Abu-Siada, A.; Budiri, J.; Abdou, A.F. Solid State Transformers Topologies, Controllers, and Applications: State-of-the-Art Literature Review. Electronics 2018, 7, 298. [Google Scholar] [CrossRef]
- Pfutzner, H.; Bengtsson, C.; Booth, T.; Loffler, F.; Gramm, K. Three-dimensional flux distributions in transformer cores as a function of package design. IEEE Trans. Magn. 1994, 30, 2713–2727. [Google Scholar] [CrossRef]
- Enokizono, M.; Todaka, T.; Kihara, K. Flux distribution in magnetic core with wound strips of laminations. J. Magn. Magn. Mater. 1992, 112, 203–206. [Google Scholar] [CrossRef]
- Enokizono, M.; Todaka, T.; Nakamura, K. Flux distribution in a wound core of a single-phase transformer. J. Magn. Magn. Mater. 1996, 160, 61–62. [Google Scholar] [CrossRef]
- Nakata, T.; Fujiwara, K.; Takahashi, N.; Nakano, M.; Okamoto, N. An improved numerical analysis of flux distributions in anisotropic materials. IEEE Trans. Magn. 1994, 30, 3395–3398. [Google Scholar] [CrossRef]
- Shilyashki, G.; Pfützner, H.; Hamberger, P.; Aigner, M.; Gerstbauer, E.; Palkovits, M.; Trenner, G. Pin sensor for interior induction measurements in transformer cores. IEEE Trans. Magn. 2015, 51, 1–4. [Google Scholar] [CrossRef]
- Abeywickrama, K.; Podoltsev, A.D.; Serdyuk, Y.V.; Gubanski, S.M. Computation of parameters of power transformer windings for use in frequency response analysis. IEEE Trans. Magn. 2007, 43, 1983–1990. [Google Scholar] [CrossRef]
- Kaimori, H.; Kameari, A.; Fujiwara, K. FEM computation of magnetic field and iron loss in laminated iron core using homogenization method. IEEE Trans. Magn. 2007, 43, 1405–1408. [Google Scholar] [CrossRef]
- Marketos, F.; Marnay, D.; Ngnegueu, T. Experimental and numerical investigation of flux density distribution in the individual packets of a 100 kVA transformer core. IEEE Trans. Magn. 2012, 48, 1677–1680. [Google Scholar] [CrossRef]
- Loizos, G.; Kefalas, T.; Kladas, A.; Souflaris, T.; Paparigas, D. Flux distribution in single phase, Si–Fe, wound transformer cores. J. Magn. Magn. Mater. 2008, 320, e874–e877. [Google Scholar] [CrossRef]
- Loizos, G.; Kefalas, T.D.; Kladas, A.G.; Souflaris, A.T. Flux distribution analysis in three-phase Si-Fe wound transformer cores. IEEE Trans. Magn. 2010, 46, 594–597. [Google Scholar] [CrossRef]
- Zheng, J.; Huang, H.; Pan, J.; Zhang, Y. Identification of the nonlinear vibration system of power transformers. Meas. Sci. Technol. 2017, 28, 015005. [Google Scholar]
- Bai, B.; Bing, X.; Jin, L. An analysis to force received in transformer core under DC bias conditions. In Proceedings of the 2011 International Conference on Electrical Machines and Systems, Beijing, China, 20–23 August 2011. [Google Scholar]
- Zhafran, Z.M.; Isa, M.; Hashim, U.; Rahim, A.R.A. Analysis of parasitic components with various sizes of coils in high frequency micro-fabricated transformer. In Proceedings of the 2015 2nd International Conference on Biomedical Engineering, Penang, Malaysia, 30–31 March 2015. [Google Scholar]
- Hu, D.; Sheng, J.; Ma, J.; Yao, L.; Li, Z.; Hong, Z.; Jin, Z. Characteristic Tests and Electromagnetic Analysis of a Novel HTS Partial Core Transformer. IEEE Trans. Appl. Supercond. 2016, 26, 1–5. [Google Scholar]
- Du, X.; Pan, J.; Guzzomi, A. Modeling the Hysteresis Characteristics of Transformer Core under Various Excitation Level via On-Line Measurements. Electronics 2018, 7, 390. [Google Scholar] [CrossRef]
- Ayachit, A.; Kazimierczuk, M. Sensitivity of Effective Relative Permeability for Gapped Magnetic Cores with Fringing Effect. IET Circuits Devices Syst. 2017, 11, 209–215. [Google Scholar] [CrossRef]
- García Espinosa, A.; Riba Ruiz, J.R.; Cusido Roura, J.; Romeral Martínez, J.L.; Ortega Redondo, J.A. Dynamic evaluation of fringing flux in linear electromechanical devices. J. Electr. Eng. 2010, 10, 1–8. [Google Scholar]
- Roque, A.; Sousa, D.; Margato, E.; Machado, V.; Sebastiao, P.; Marques, G. Magnetic Flux Density Distribution in the Air Gap of a Ferromagnetic Core with Superconducting Blocks: 3D Analysis and Experimental NMR results. IEEE Trans. Appl. Supercond. 2015, 25, 1–9. [Google Scholar] [CrossRef]
- Liu, M.; Hubert, O.; Mininger, X.; Bouillault, F.; Bernard, L. Calculation of magnetostriction induced deformations in grain oriented and non-oriented silicon iron transformer cores thanks to an imposed magnetic flux method. In Proceedings of the Compumag 2015, Montreal, QC, Canada, 28 June–2 July 2015. [Google Scholar]
- Hahne, P.; Dietz, R.; Rieth, B.; Weiland, T. Determination of anisotropic equivalent conductivity of laminated cores for numerical computation. IEEE Trans. Magn. 1996, 32, 1184–1187. [Google Scholar] [CrossRef]
- Zheng, W.; Cheng, Z. An Inner-Constrained Separation Technique for 3-D Finite-Element Modeling of Grain-Oriented Silicon Steel Laminations. IEEE Trans. Magn. 2012, 48, 2277–2283. [Google Scholar] [CrossRef]
© 2019 by the authors. Licensee MDPI, Basel, Switzerland. This article is an open access article distributed under the terms and conditions of the Creative Commons Attribution (CC BY) license (http://creativecommons.org/licenses/by/4.0/).