Author Contributions
Conceptualization, C.-I.S. and J.-T.H.; Data curation, C.I.S., S.-C.W. and M.-F.C.; Formal analysis, C.-I.S., J.-T.H., S.-C.W. and M.-F.C.; Funding acquisition, J.-T.H.; Investigation, C.-I.S., S.-C.W. and M.-F.C.; Methodology, C.-I.S. and J.-T.H.; Project administration, J.-T.H.; Resources, J.-T.H.; Software, C.-I.S., S.-C.W. and M.-F.C.; Supervision, J.-T.H.; Validation, C.-I.S., S.-C.W. and M.-F.C.; Visualization, C.-I.S., S.-C.W. and M.-F.C.; Writing—original draft, C.-I.S.; Writing—review & editing, C.-I.S. and J.-T.H.
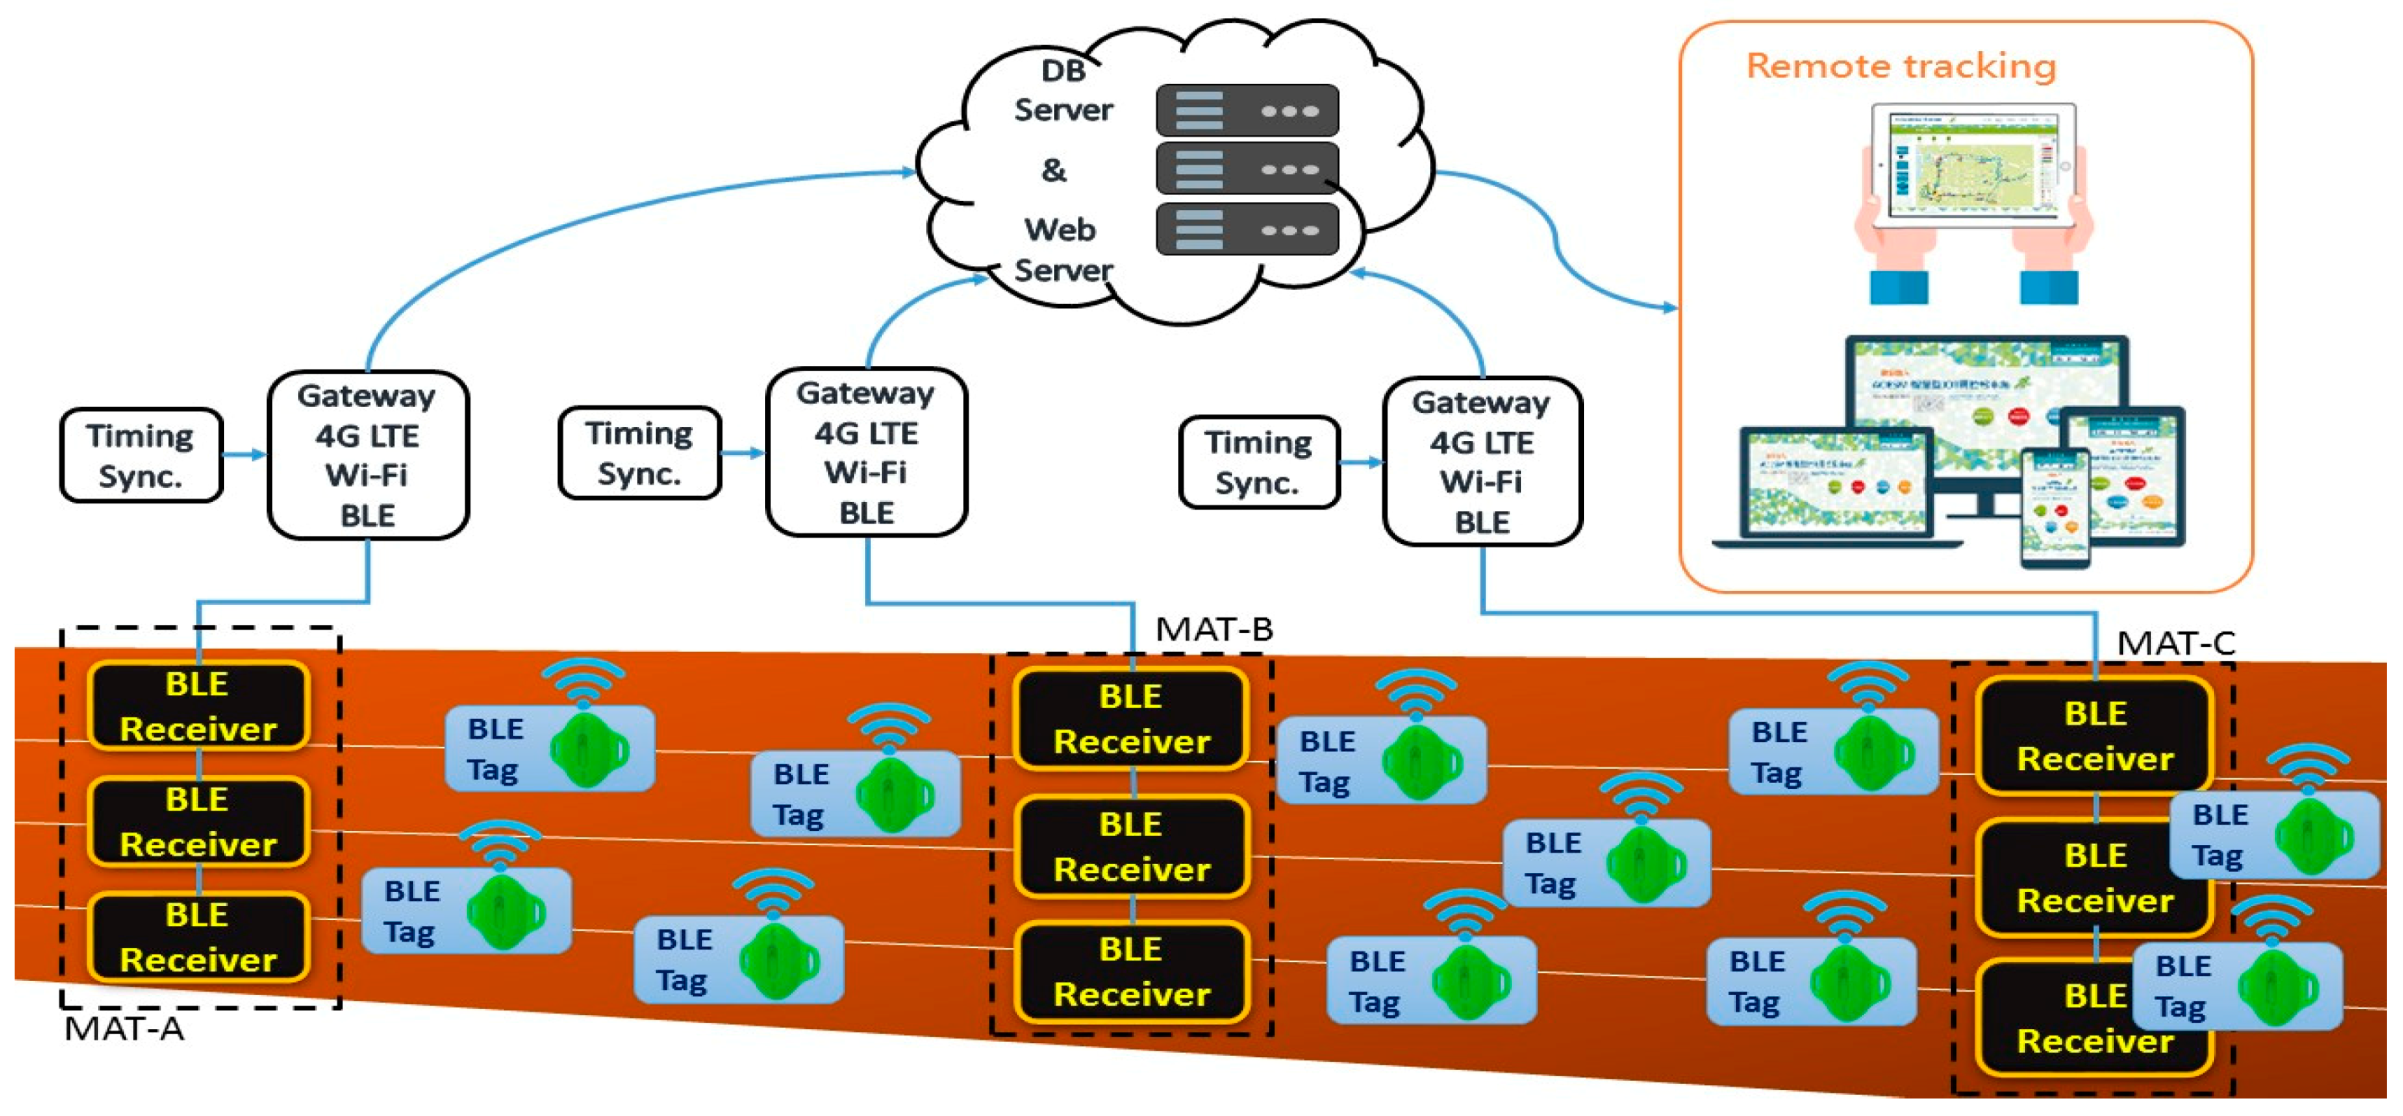
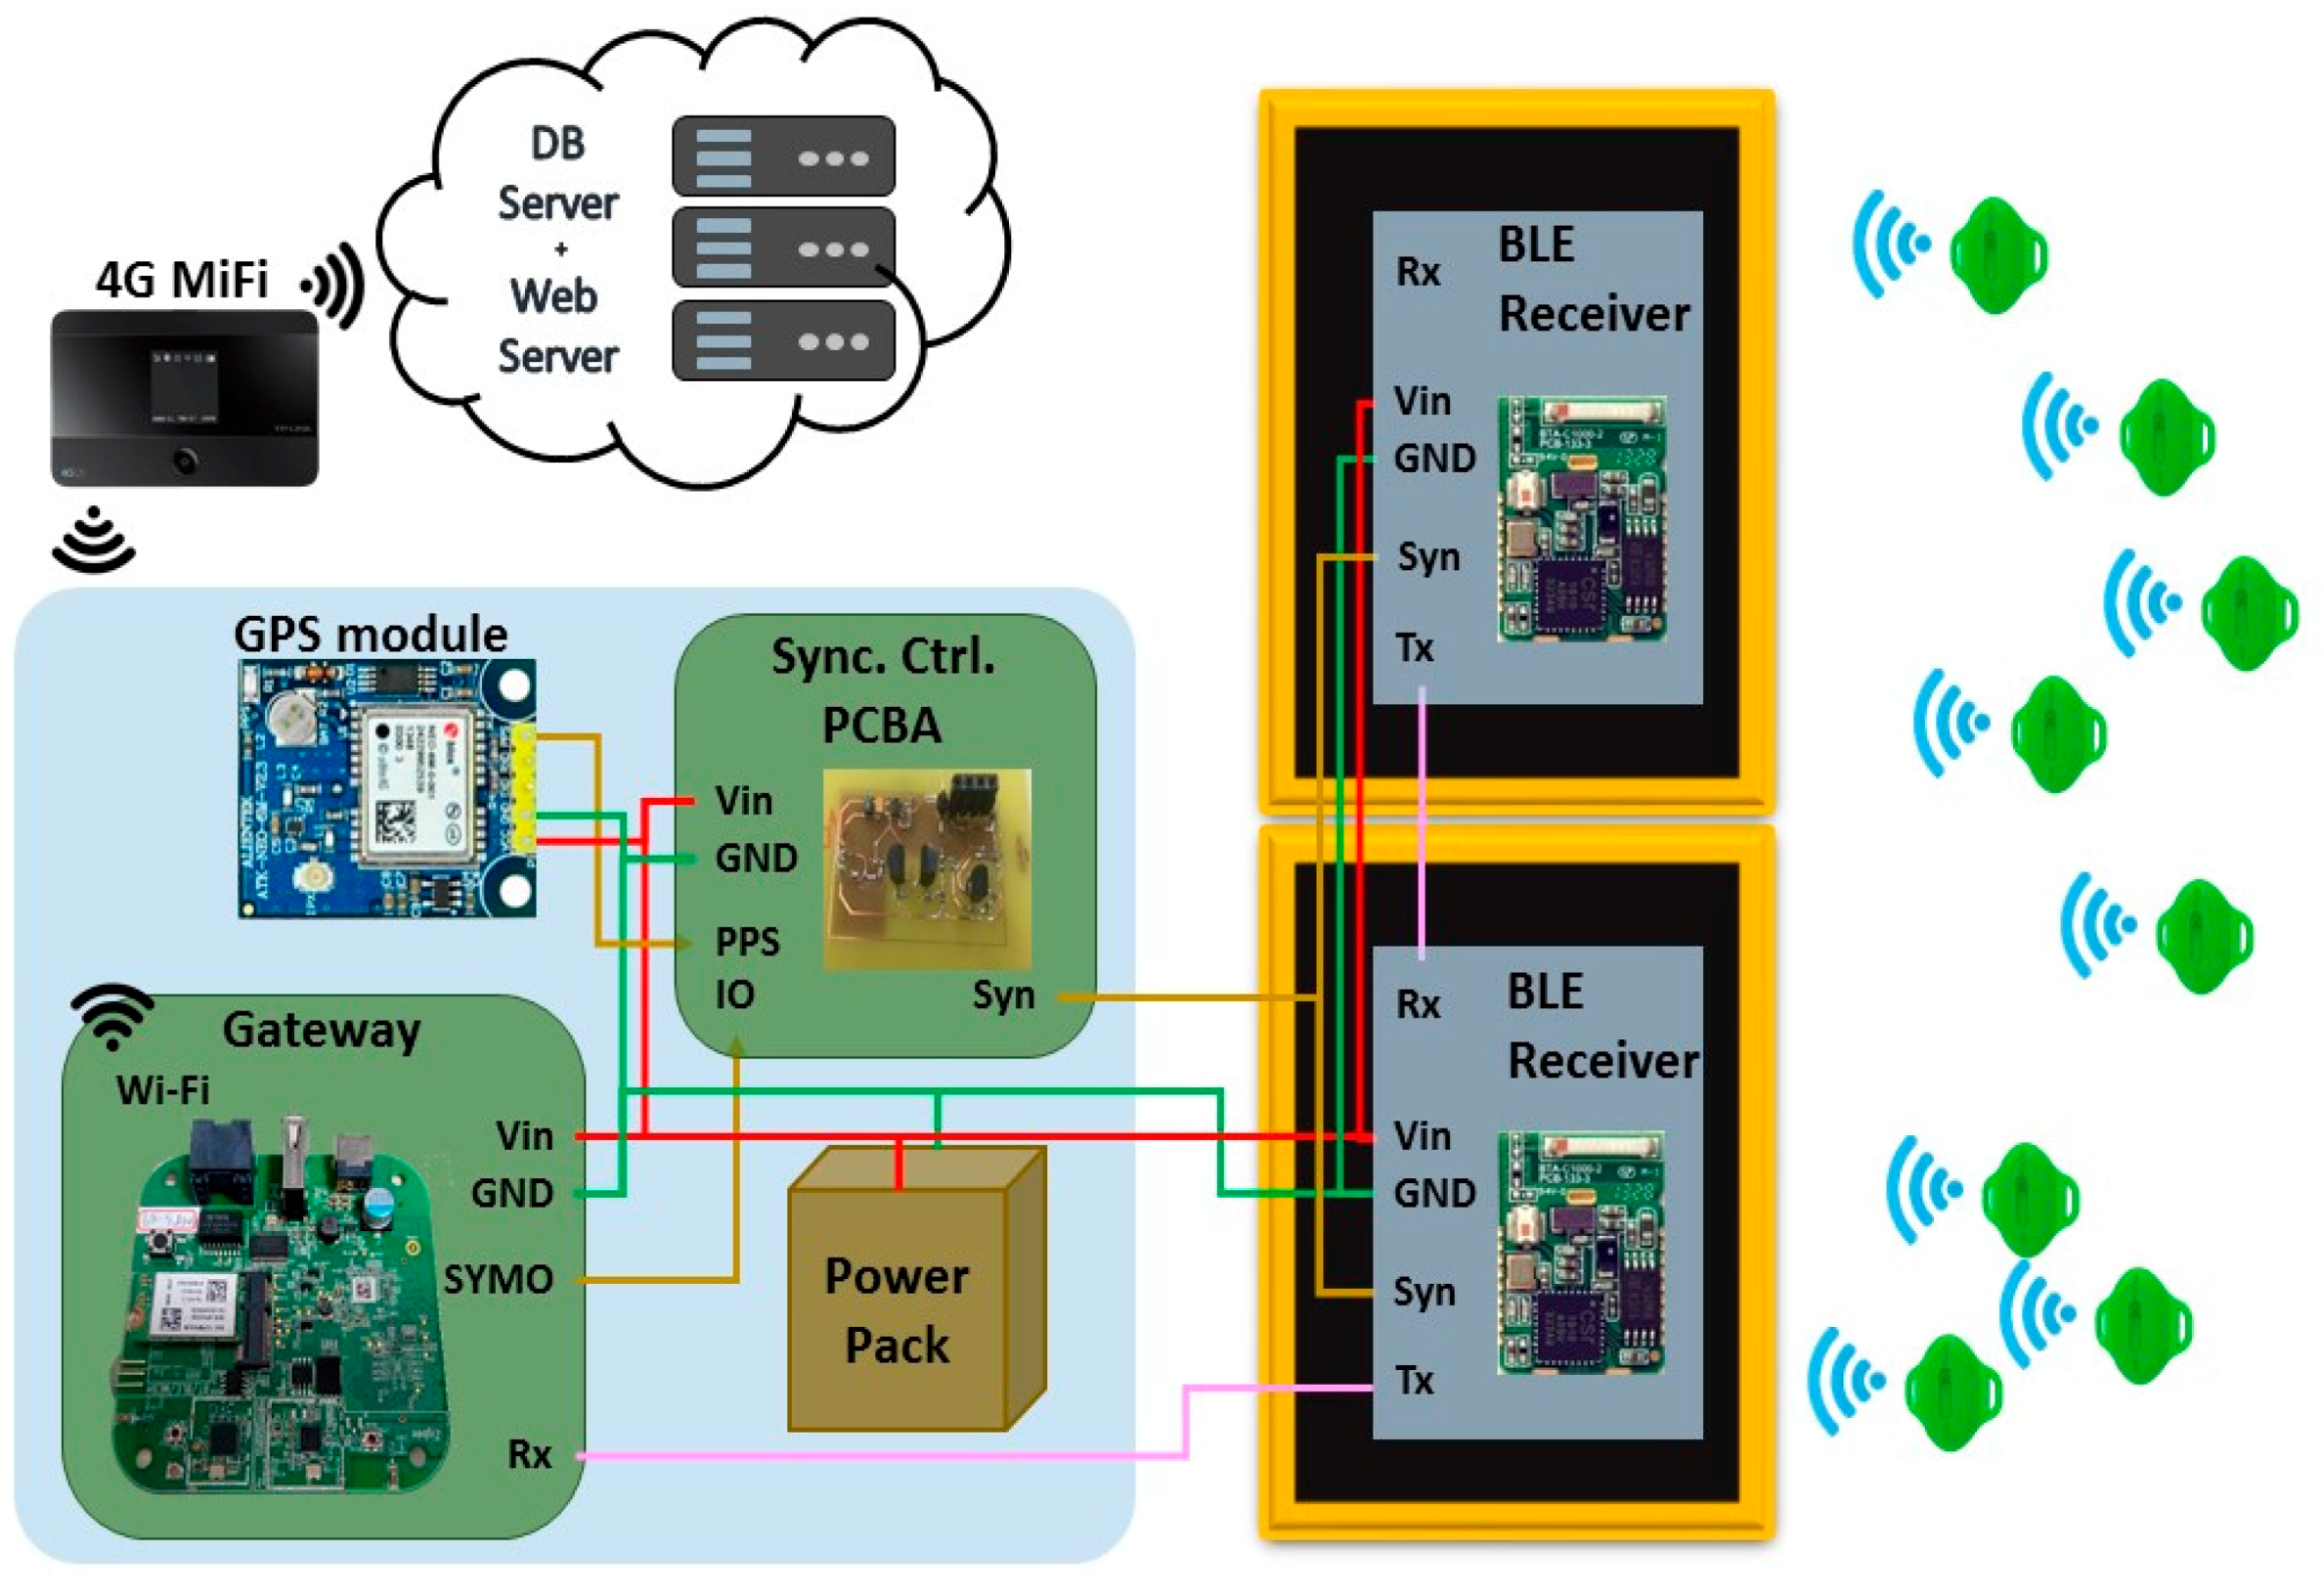
Figure 1.
The application structure. DB, database; BLE, Bluetooth Low-Energy; MAT, There are several BLE Receivers connected in series as a longer mat.
Figure 1.
The application structure. DB, database; BLE, Bluetooth Low-Energy; MAT, There are several BLE Receivers connected in series as a longer mat.
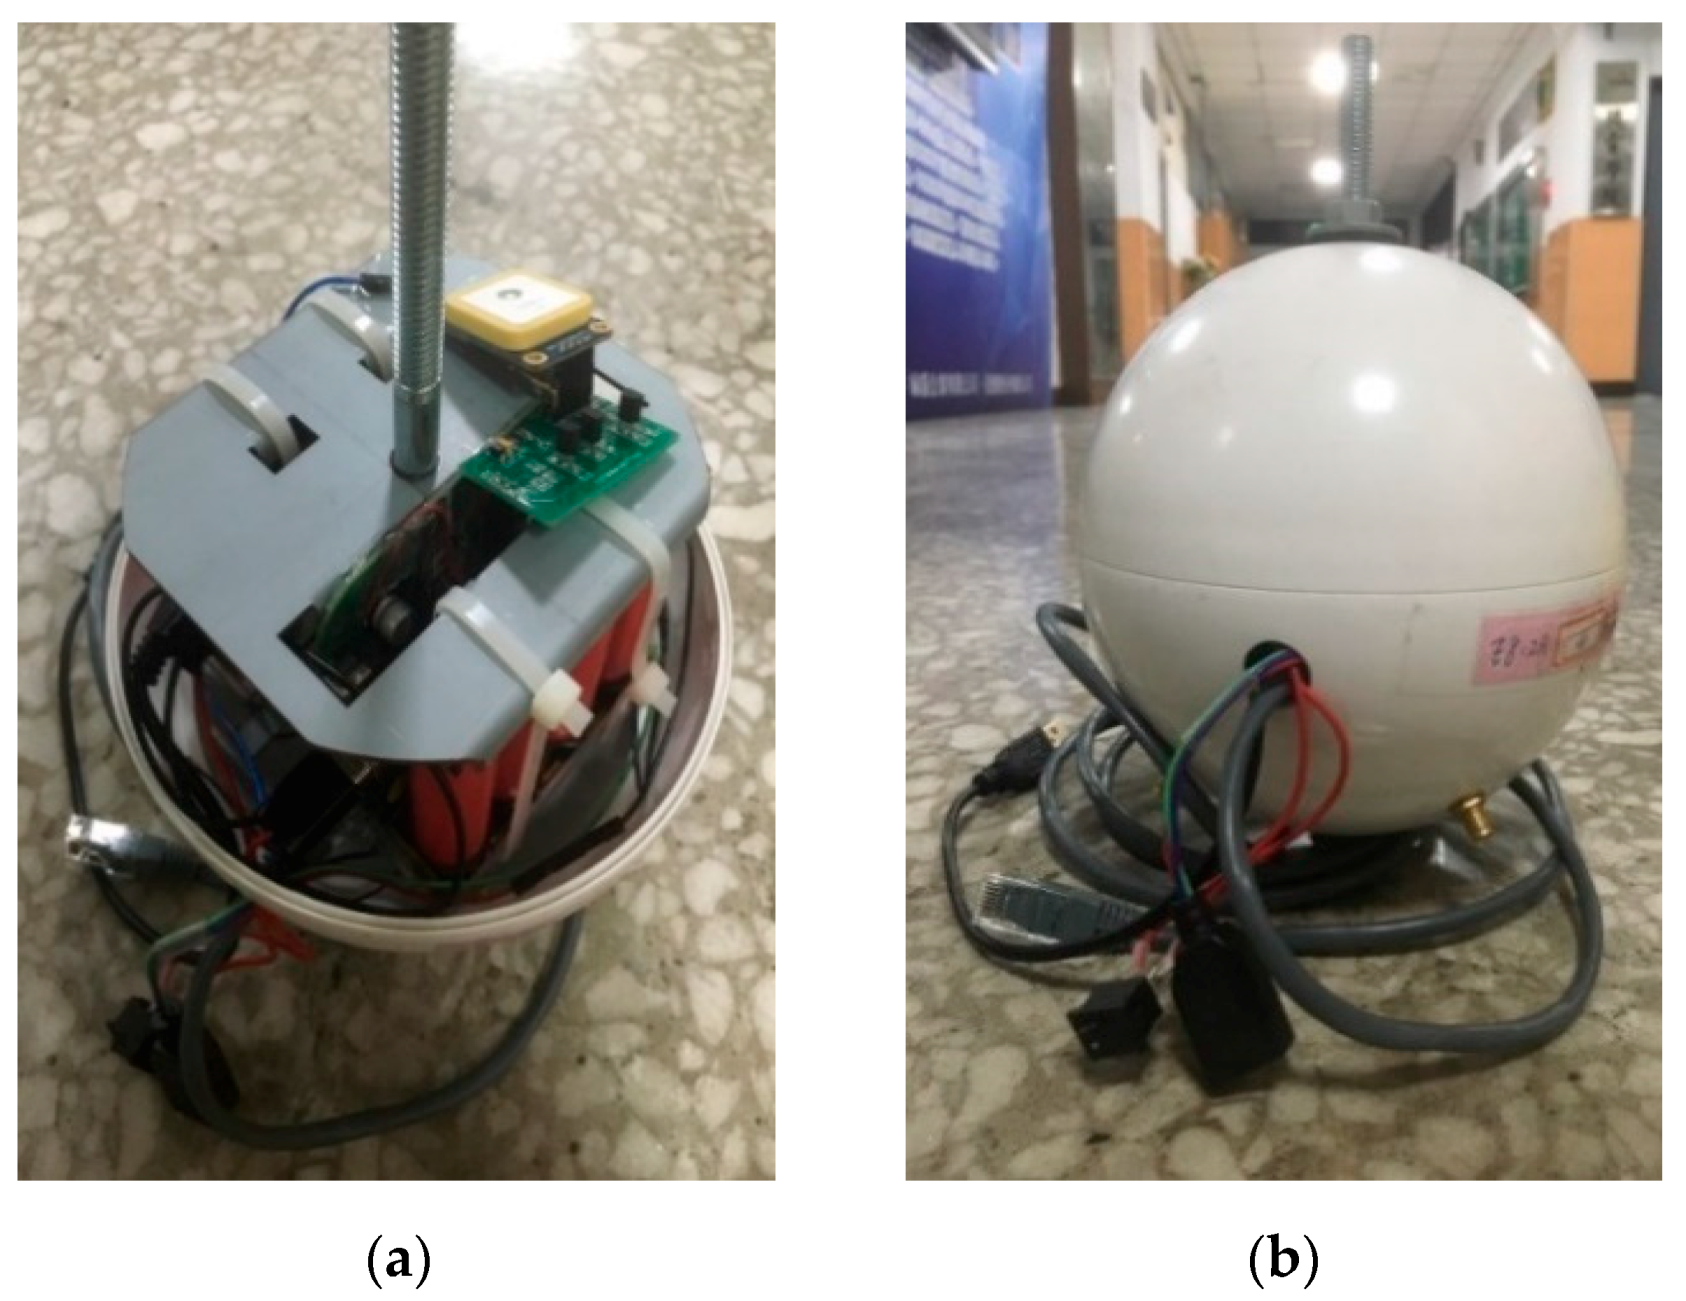
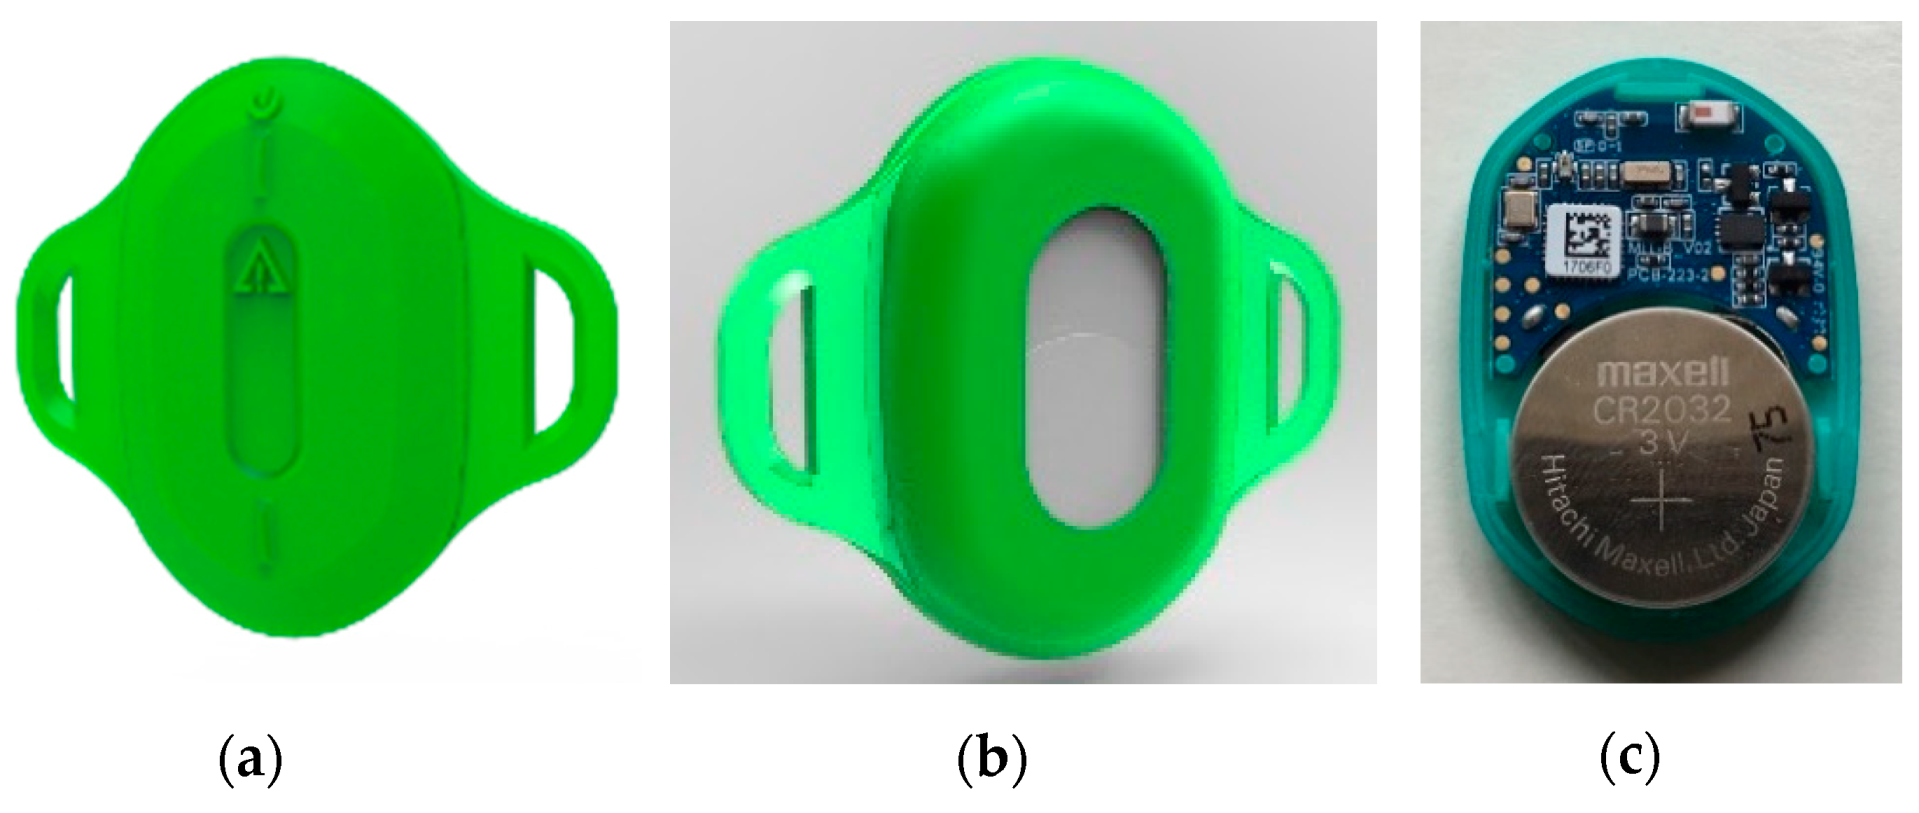
Figure 2.
The BLE Tag. (a) Stereoscopic appearance; (b) back view; (c) internal component.
Figure 2.
The BLE Tag. (a) Stereoscopic appearance; (b) back view; (c) internal component.
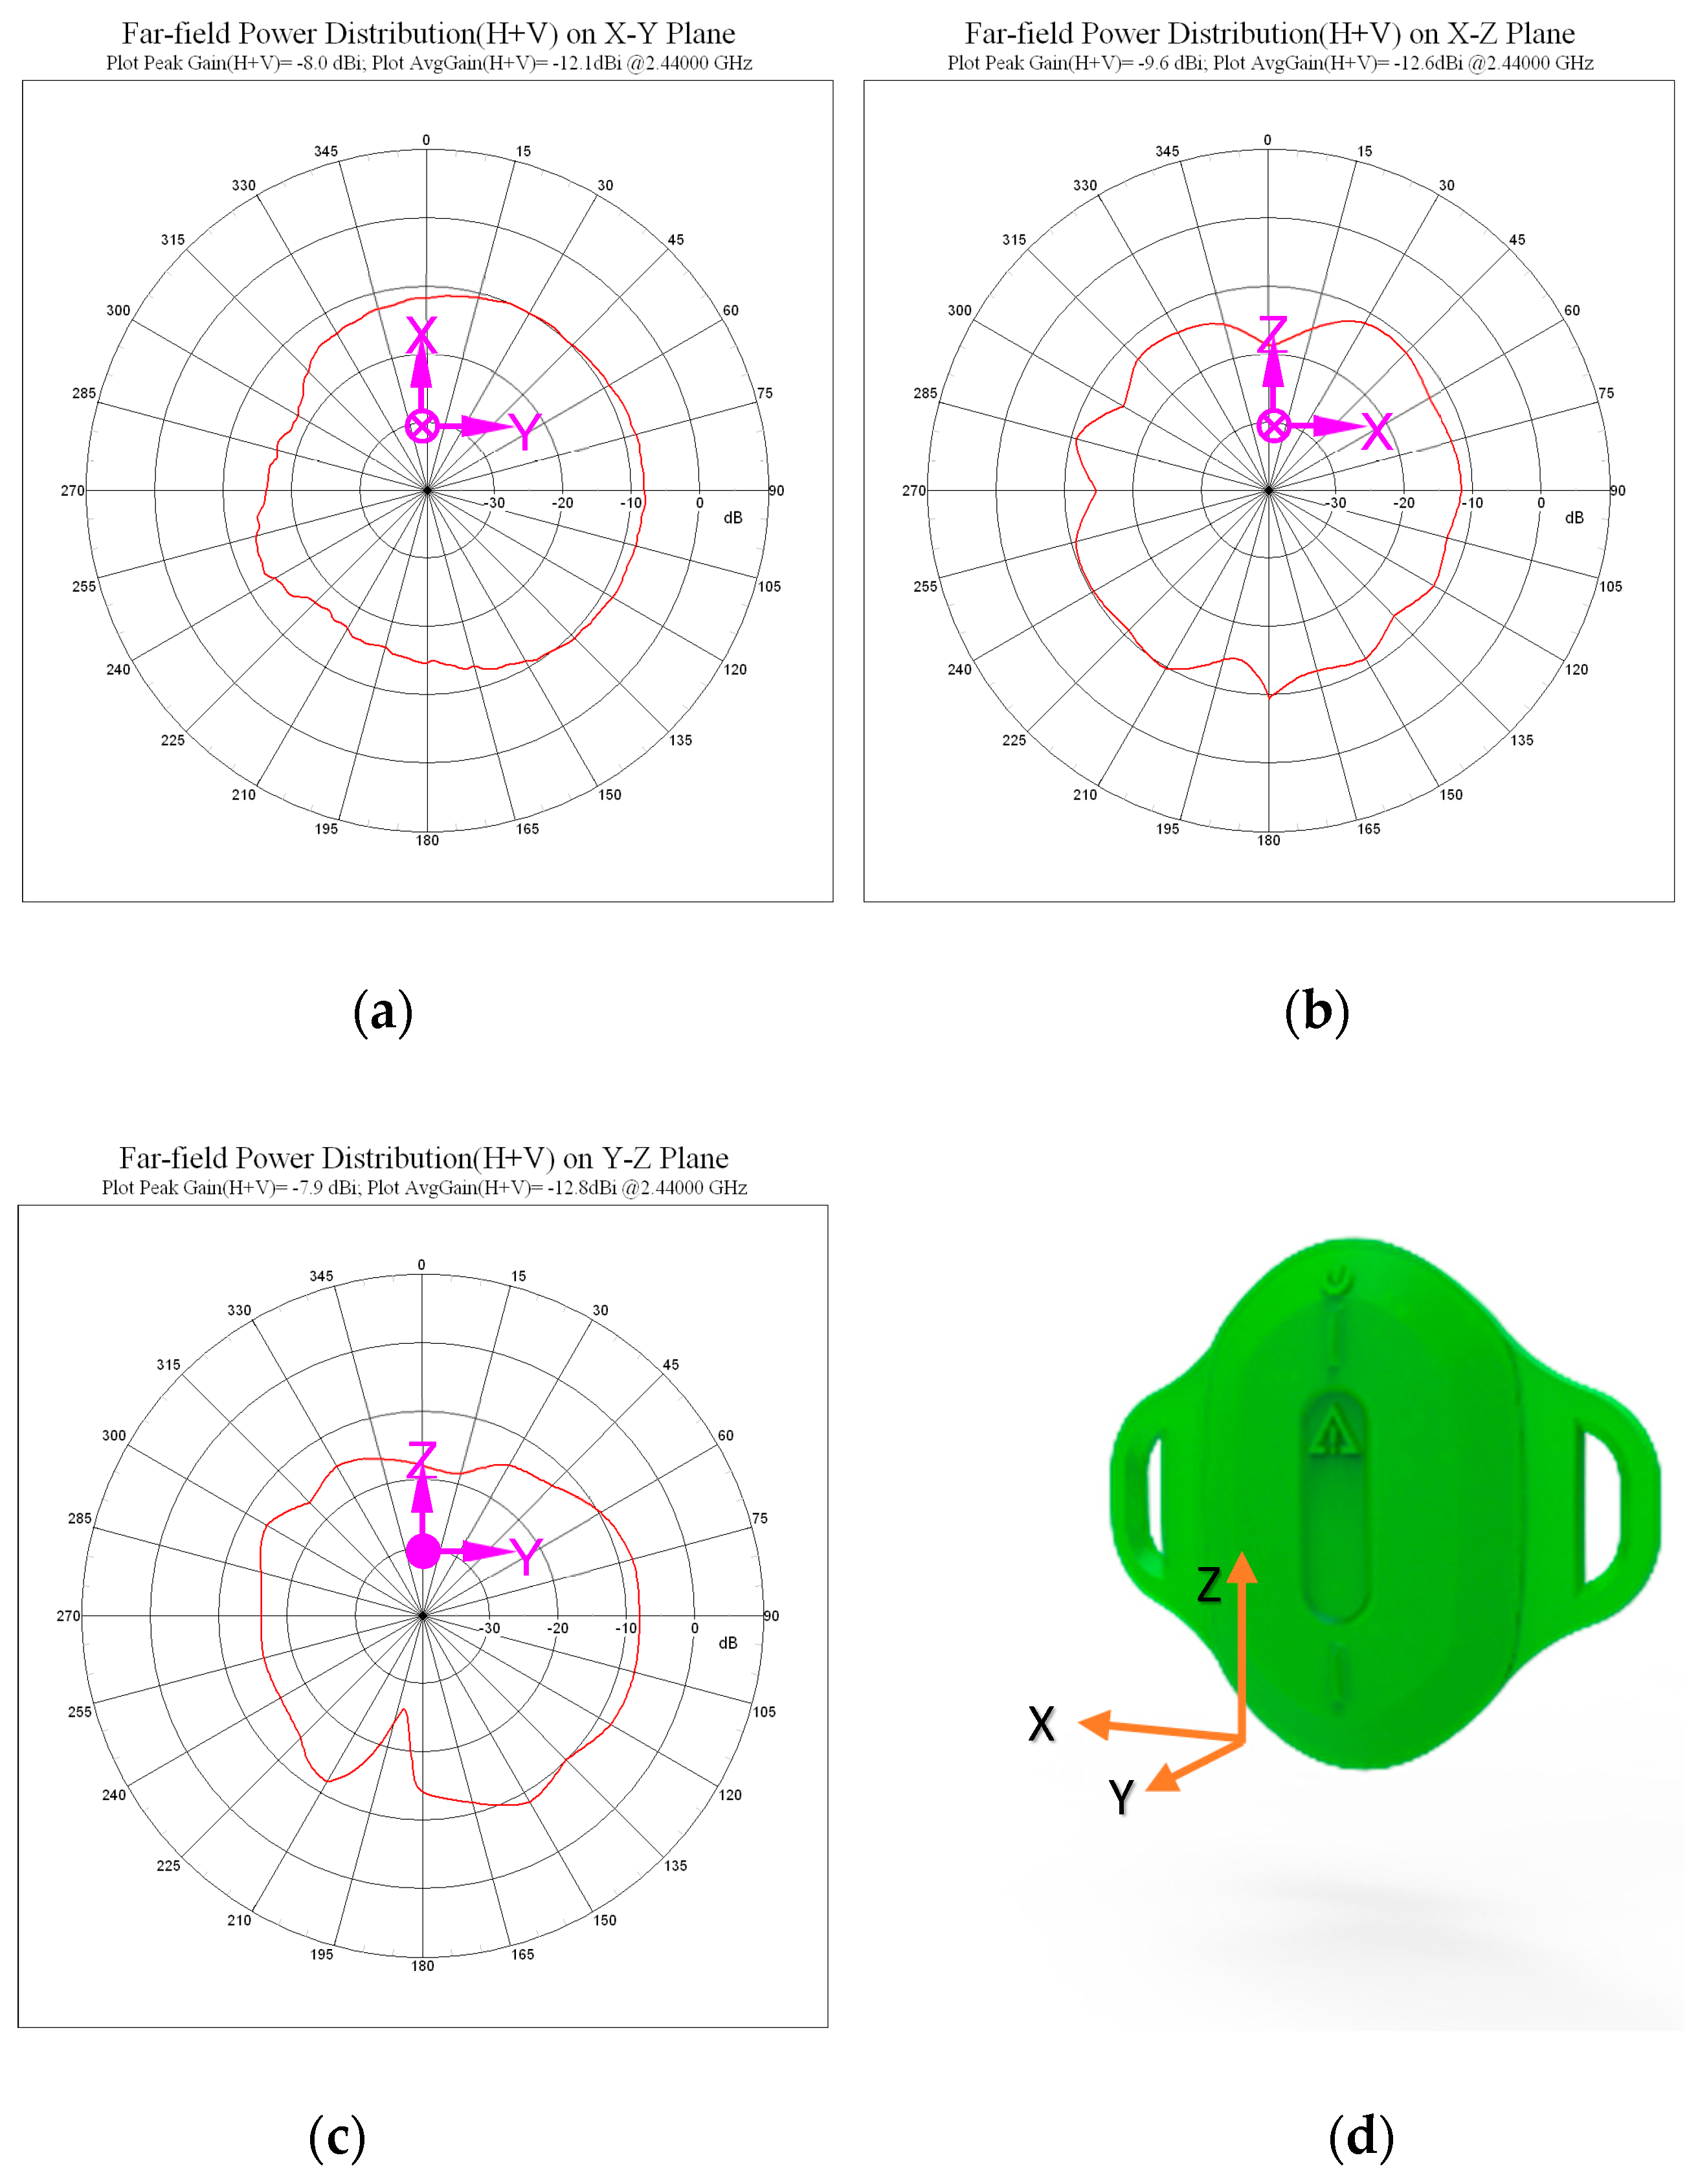
Figure 3.
The radiation far-field power distribution of the BLE Tag. (a) The X-Y plane; (b) the X-Z plane; (c) the Y-Z plane; and (d) the coordinate axis directions.
Figure 3.
The radiation far-field power distribution of the BLE Tag. (a) The X-Y plane; (b) the X-Z plane; (c) the Y-Z plane; and (d) the coordinate axis directions.
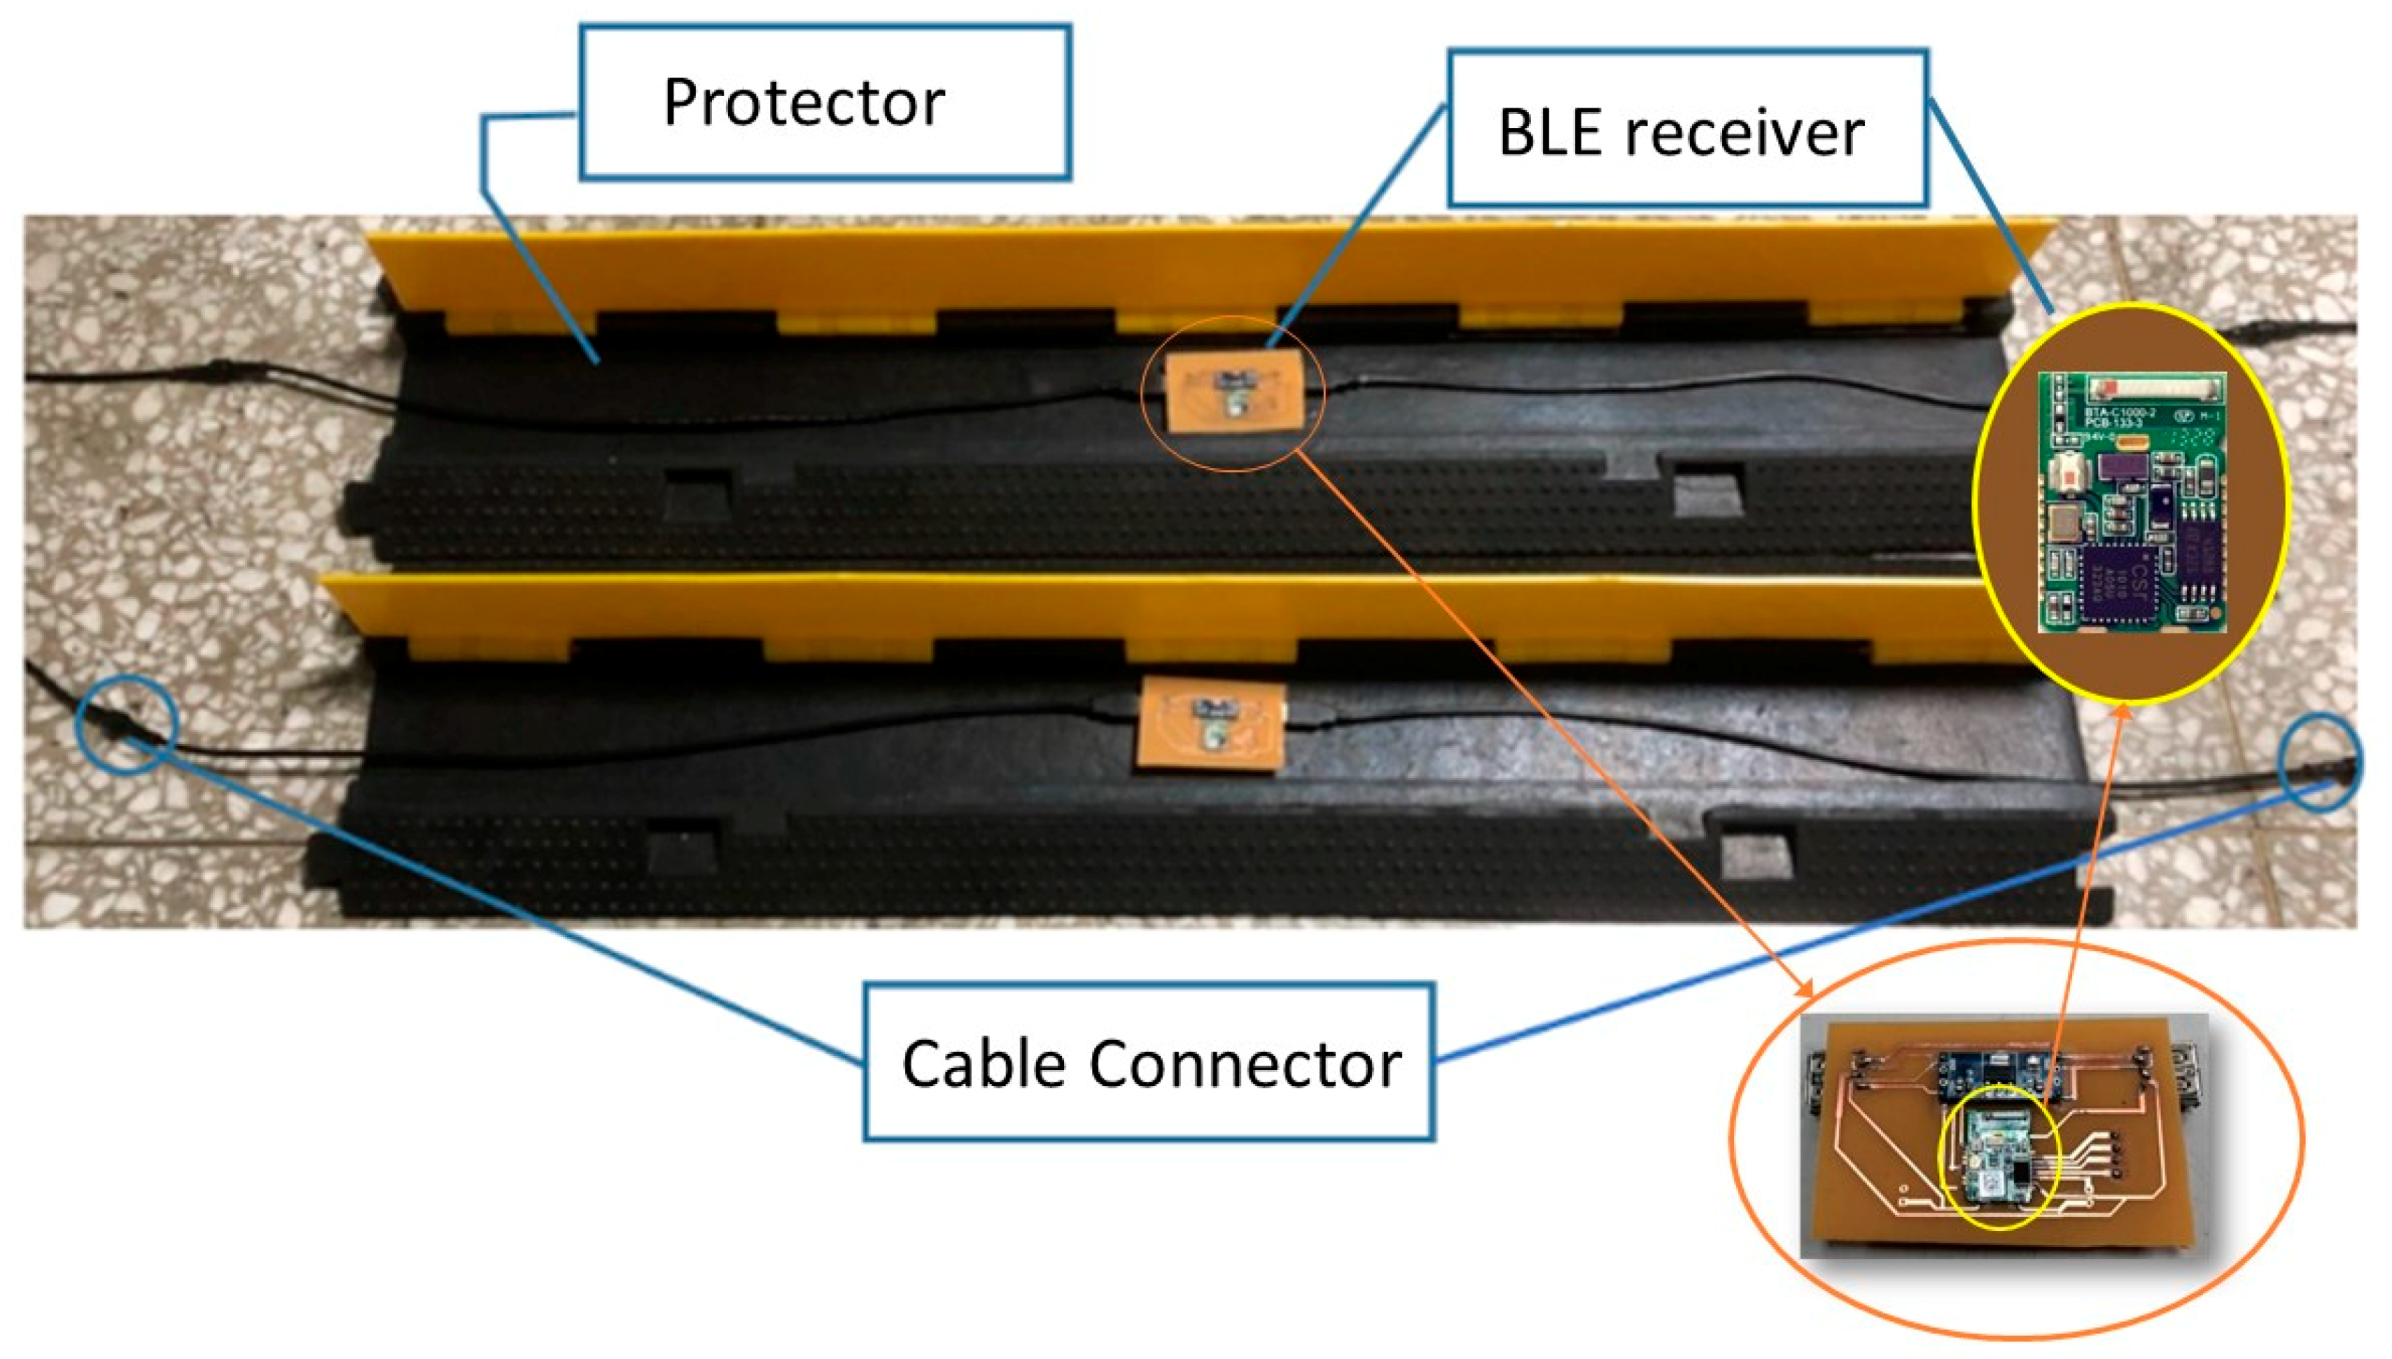
Figure 4.
A BLE Receiver in a yellow jacket cable protector.
Figure 4.
A BLE Receiver in a yellow jacket cable protector.
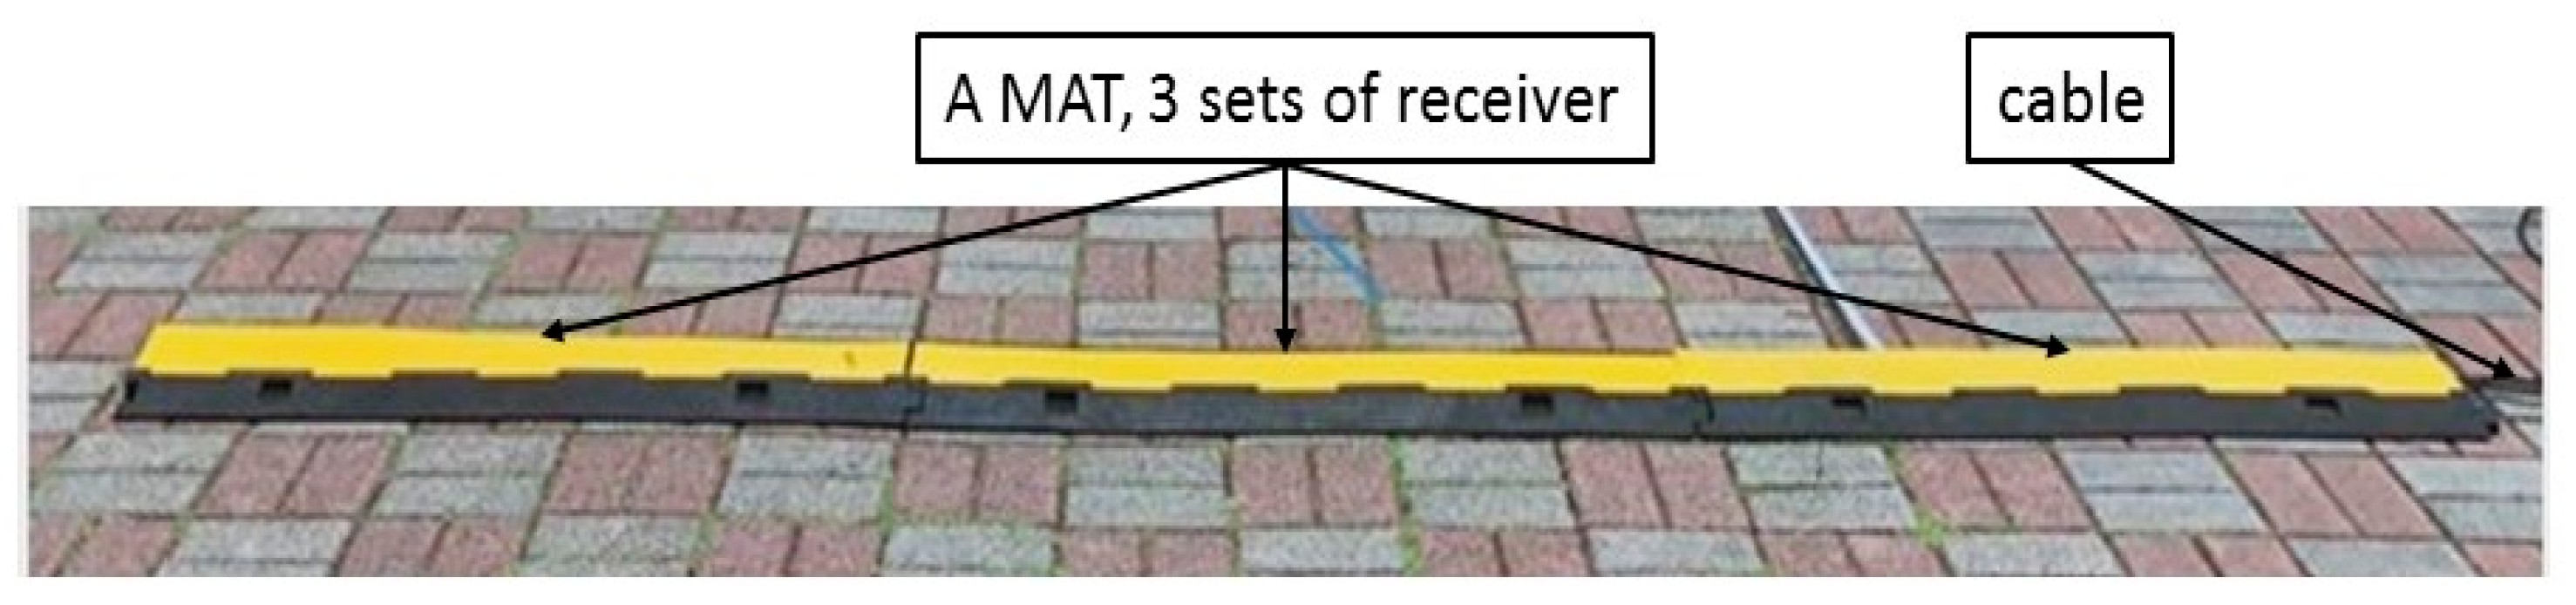
Figure 5.
A MAT with a set of three BLE Receivers.
Figure 5.
A MAT with a set of three BLE Receivers.
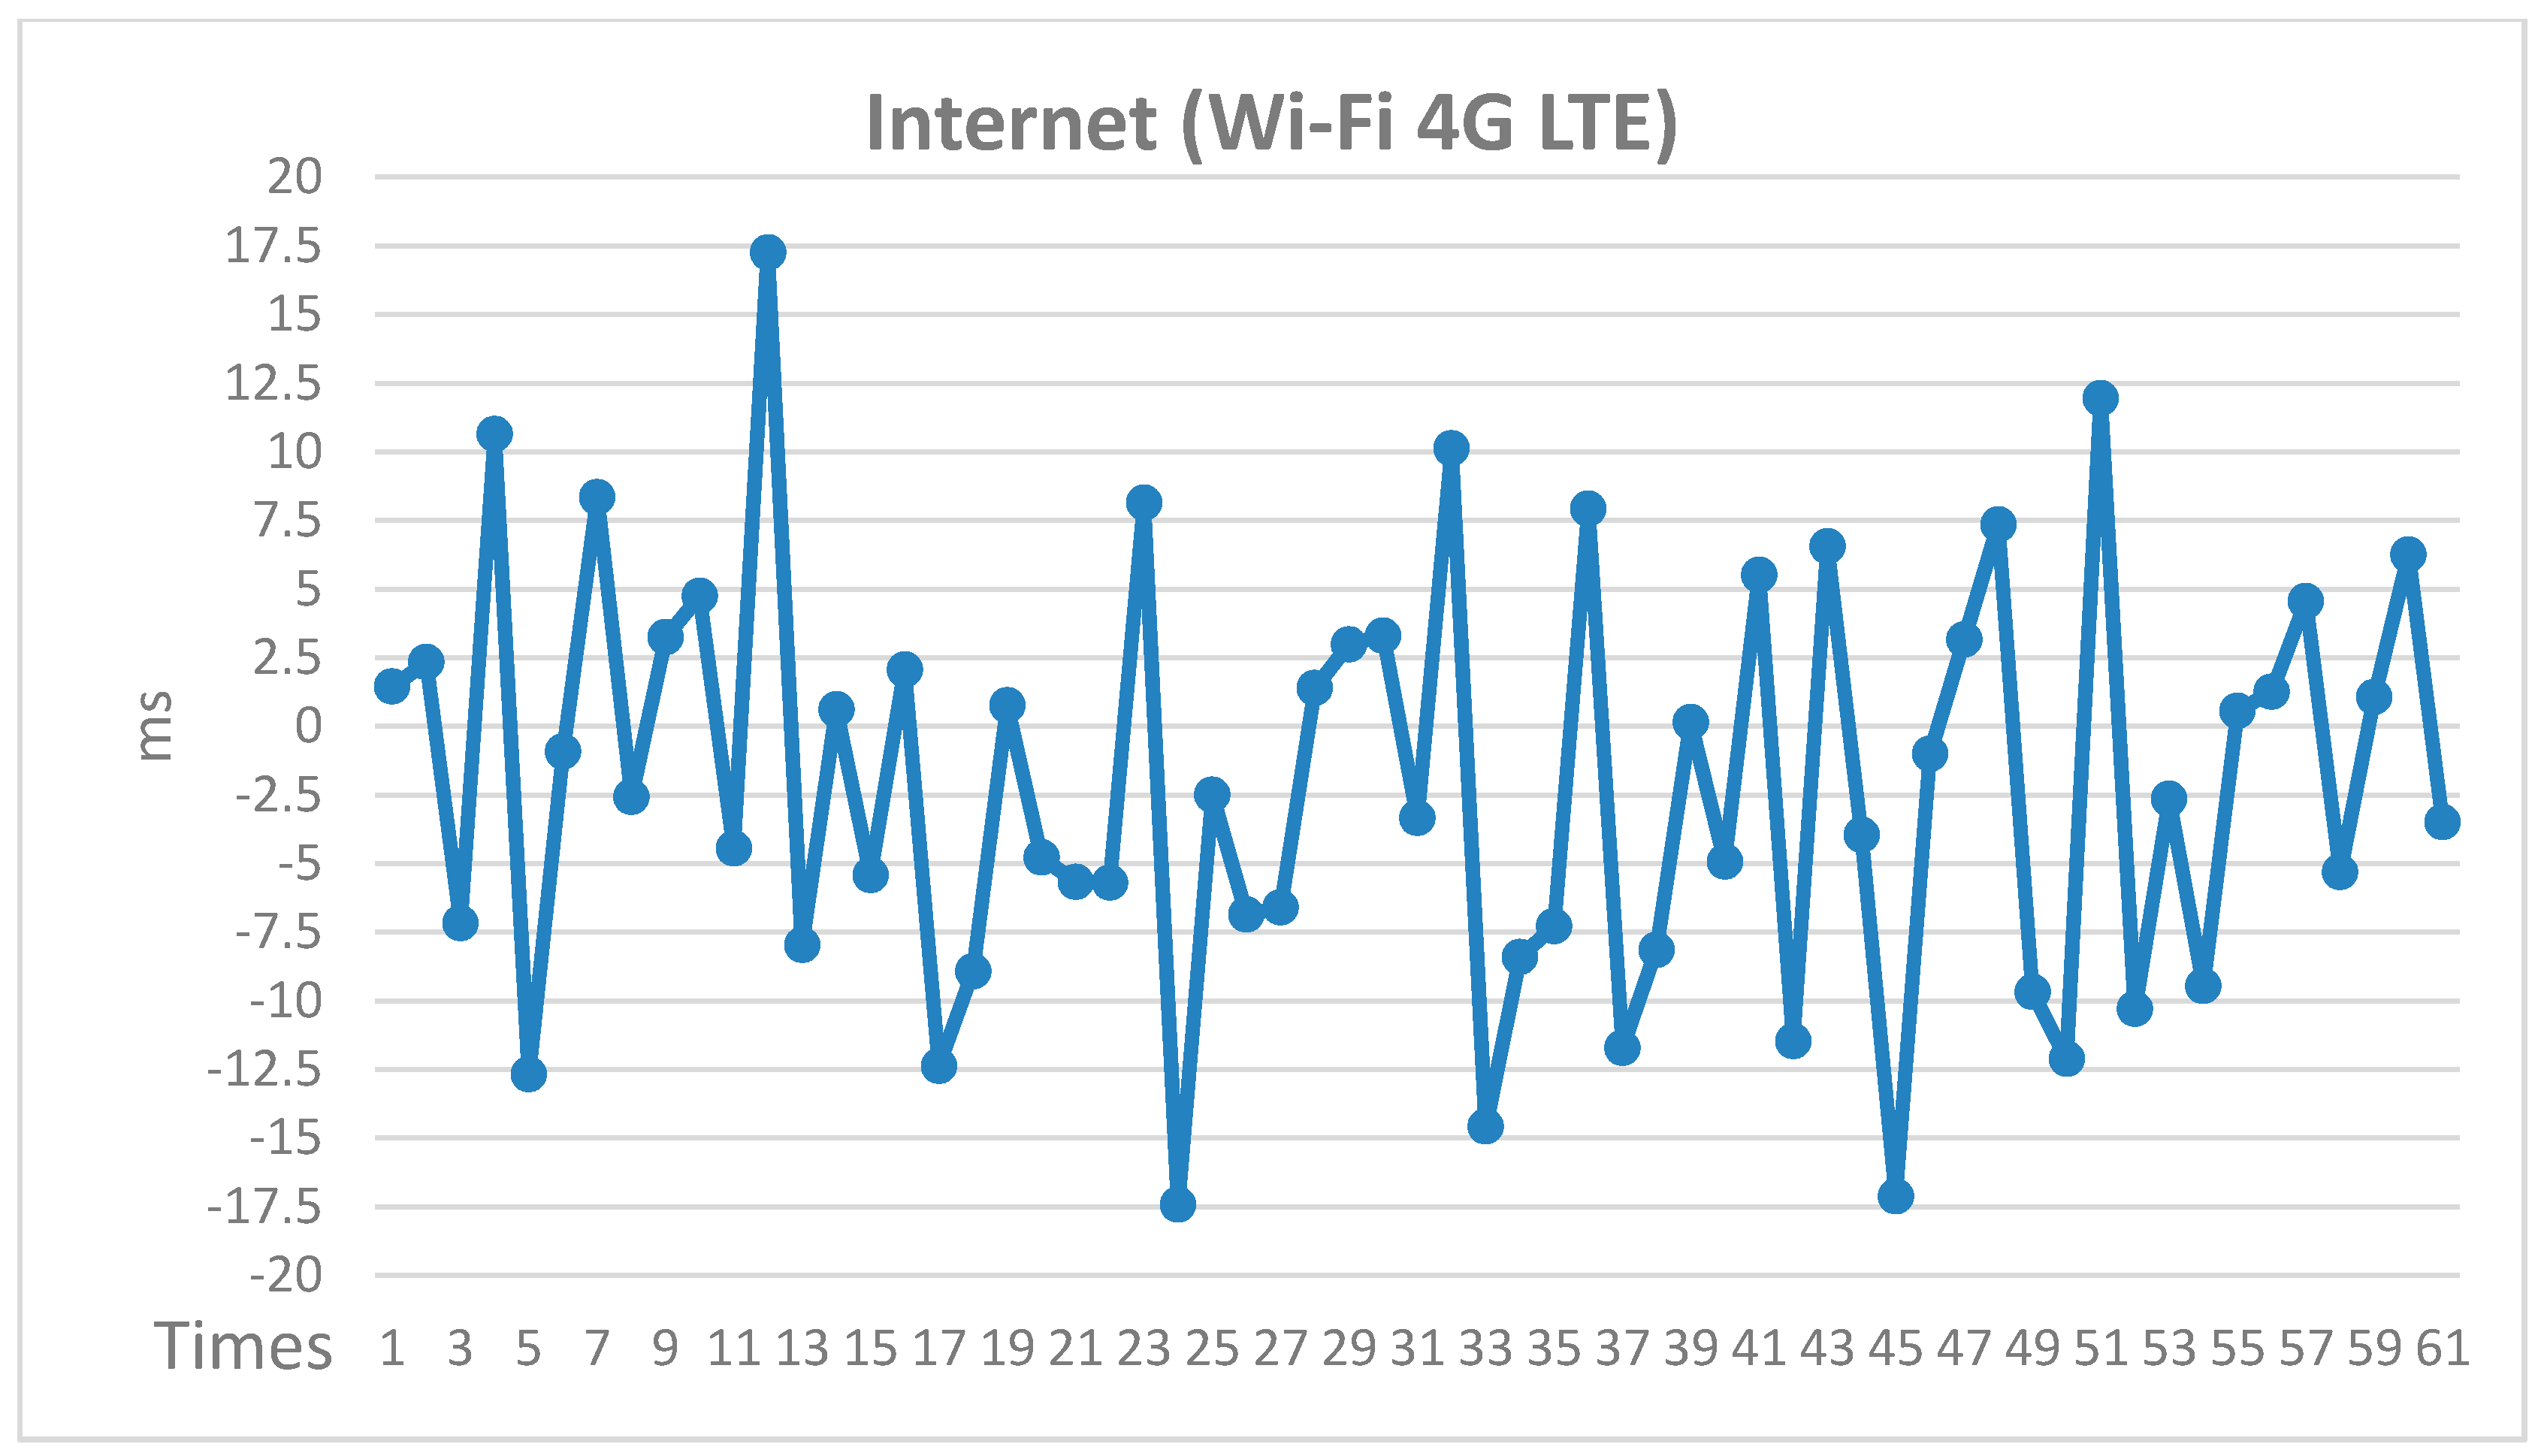
Figure 6.
The Network Time Protocol (NTP) synchronization test results.
Figure 6.
The Network Time Protocol (NTP) synchronization test results.
Figure 7.
The Gateway. (a) The internal structure and (b) appearance.
Figure 7.
The Gateway. (a) The internal structure and (b) appearance.
Figure 8.
The Gateway, global positioning system (GPS), and synchronization control board connected to the BLE Receivers. PCBA, Printed Circuit Board Assembly; GND, ground; PPS, pulse-per-second; IO, input output; SYMO, synchronous mask output.
Figure 8.
The Gateway, global positioning system (GPS), and synchronization control board connected to the BLE Receivers. PCBA, Printed Circuit Board Assembly; GND, ground; PPS, pulse-per-second; IO, input output; SYMO, synchronous mask output.
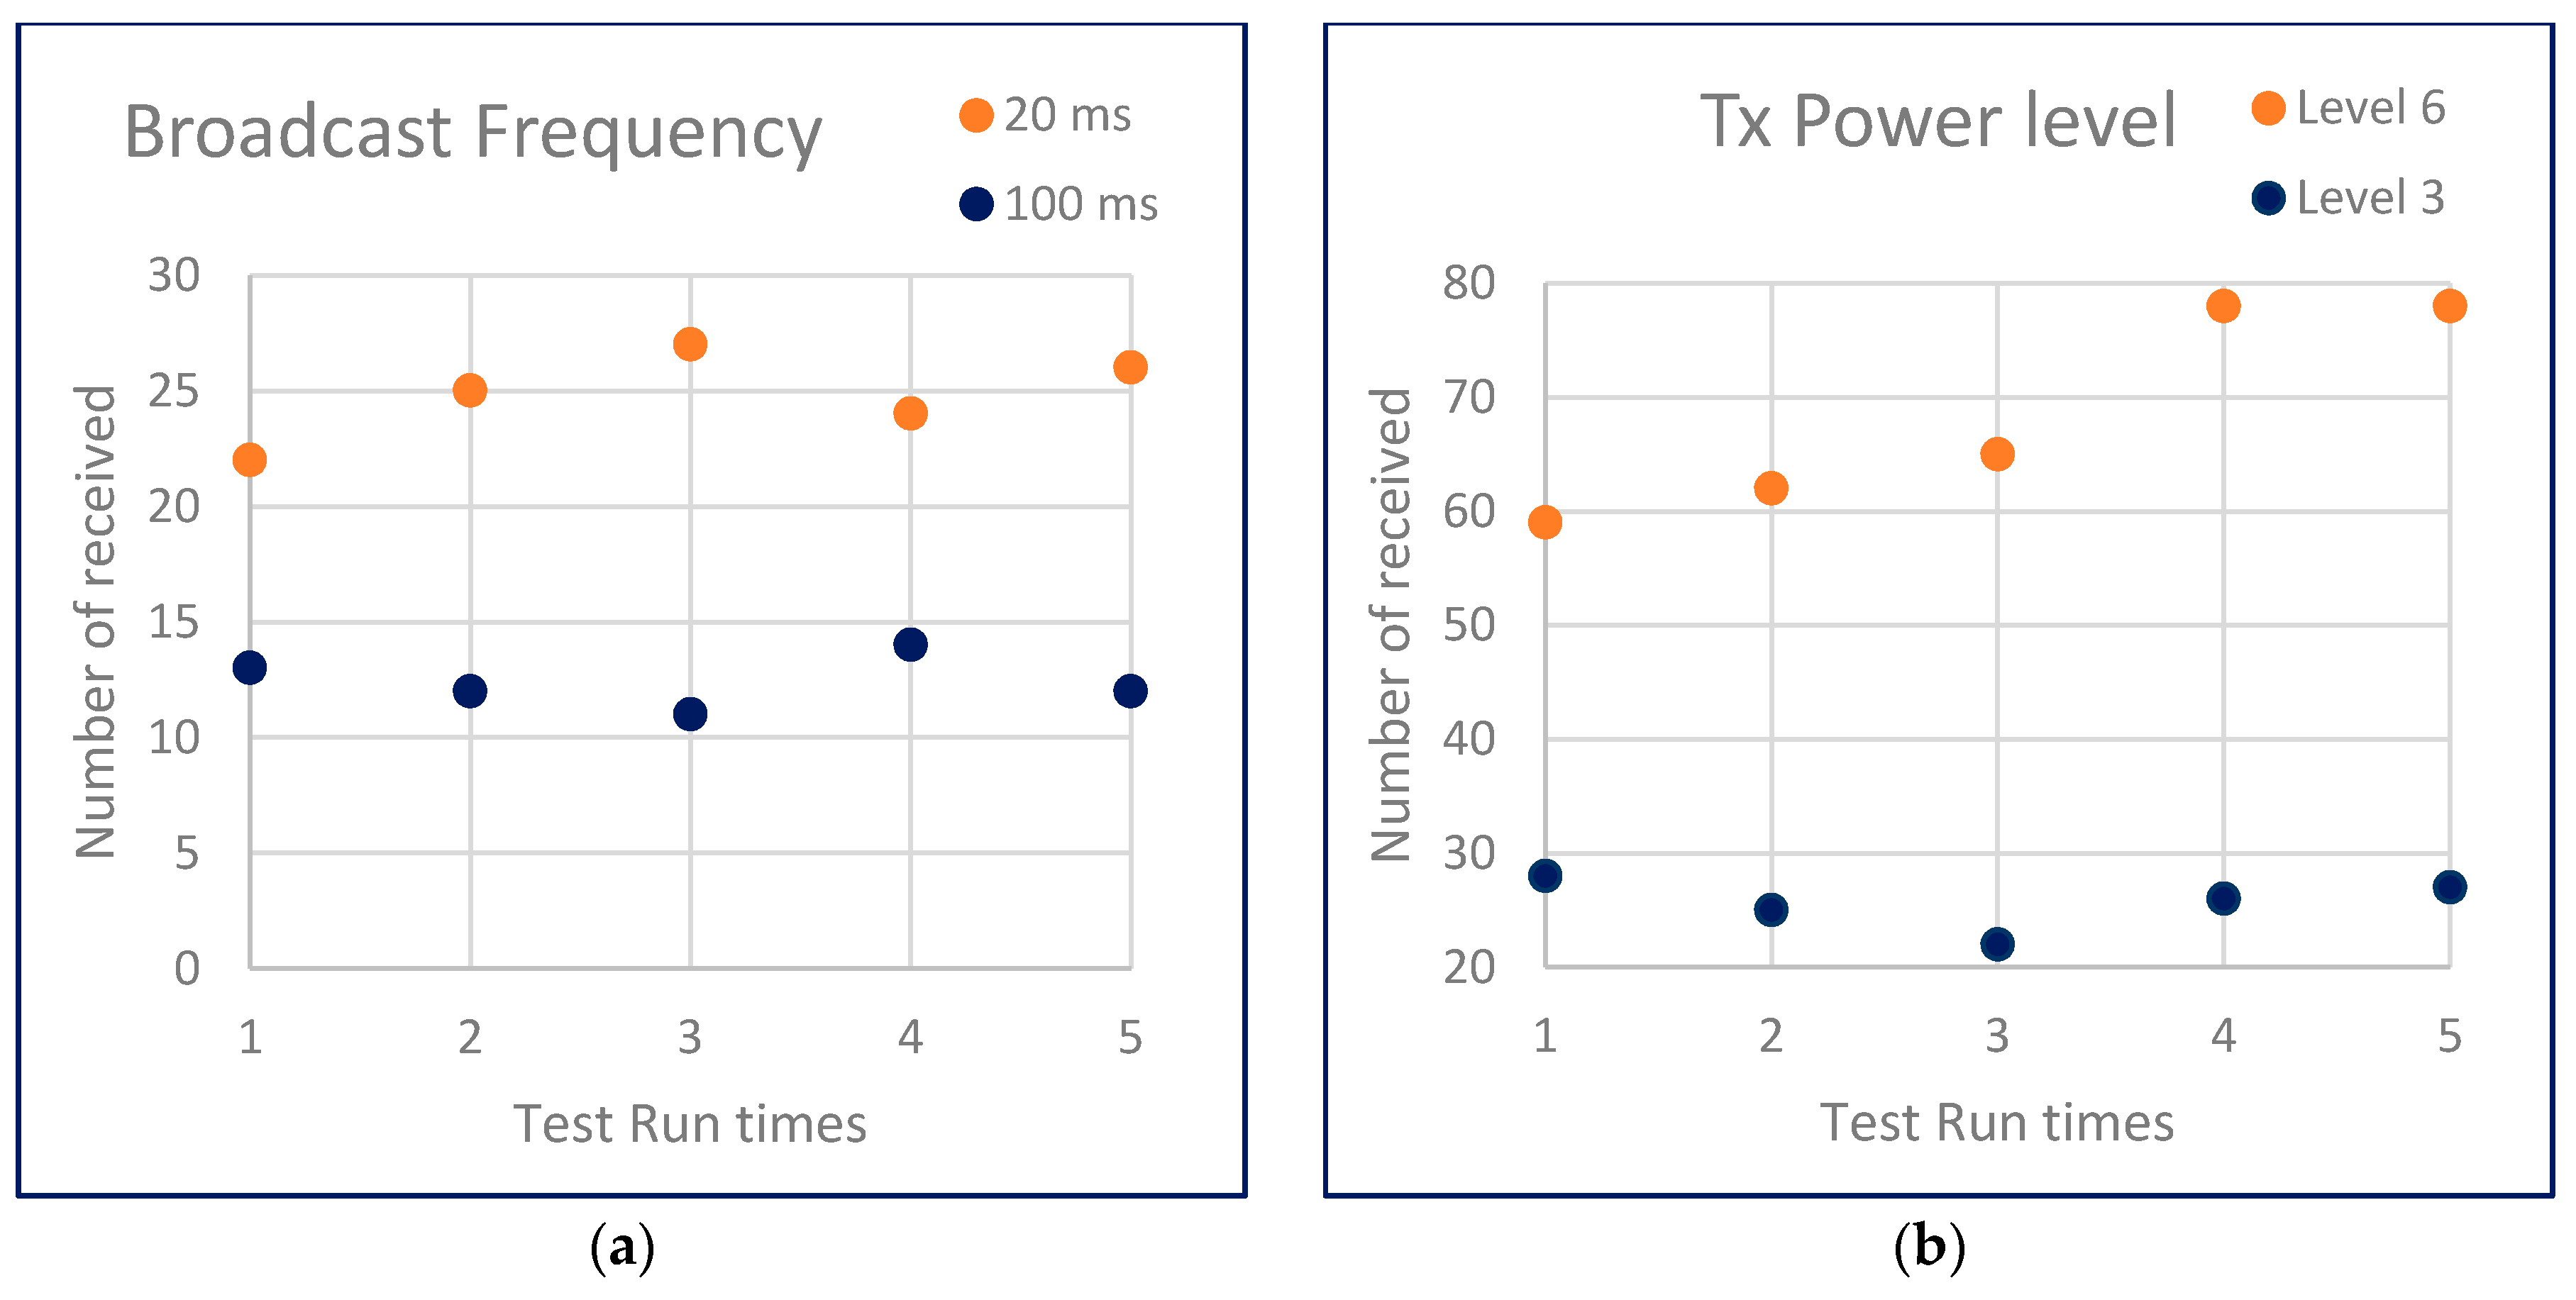
Figure 9.
The experiment of (a) the five times broadcast frequency test; and (b) the five times Tx Power level test.
Figure 9.
The experiment of (a) the five times broadcast frequency test; and (b) the five times Tx Power level test.
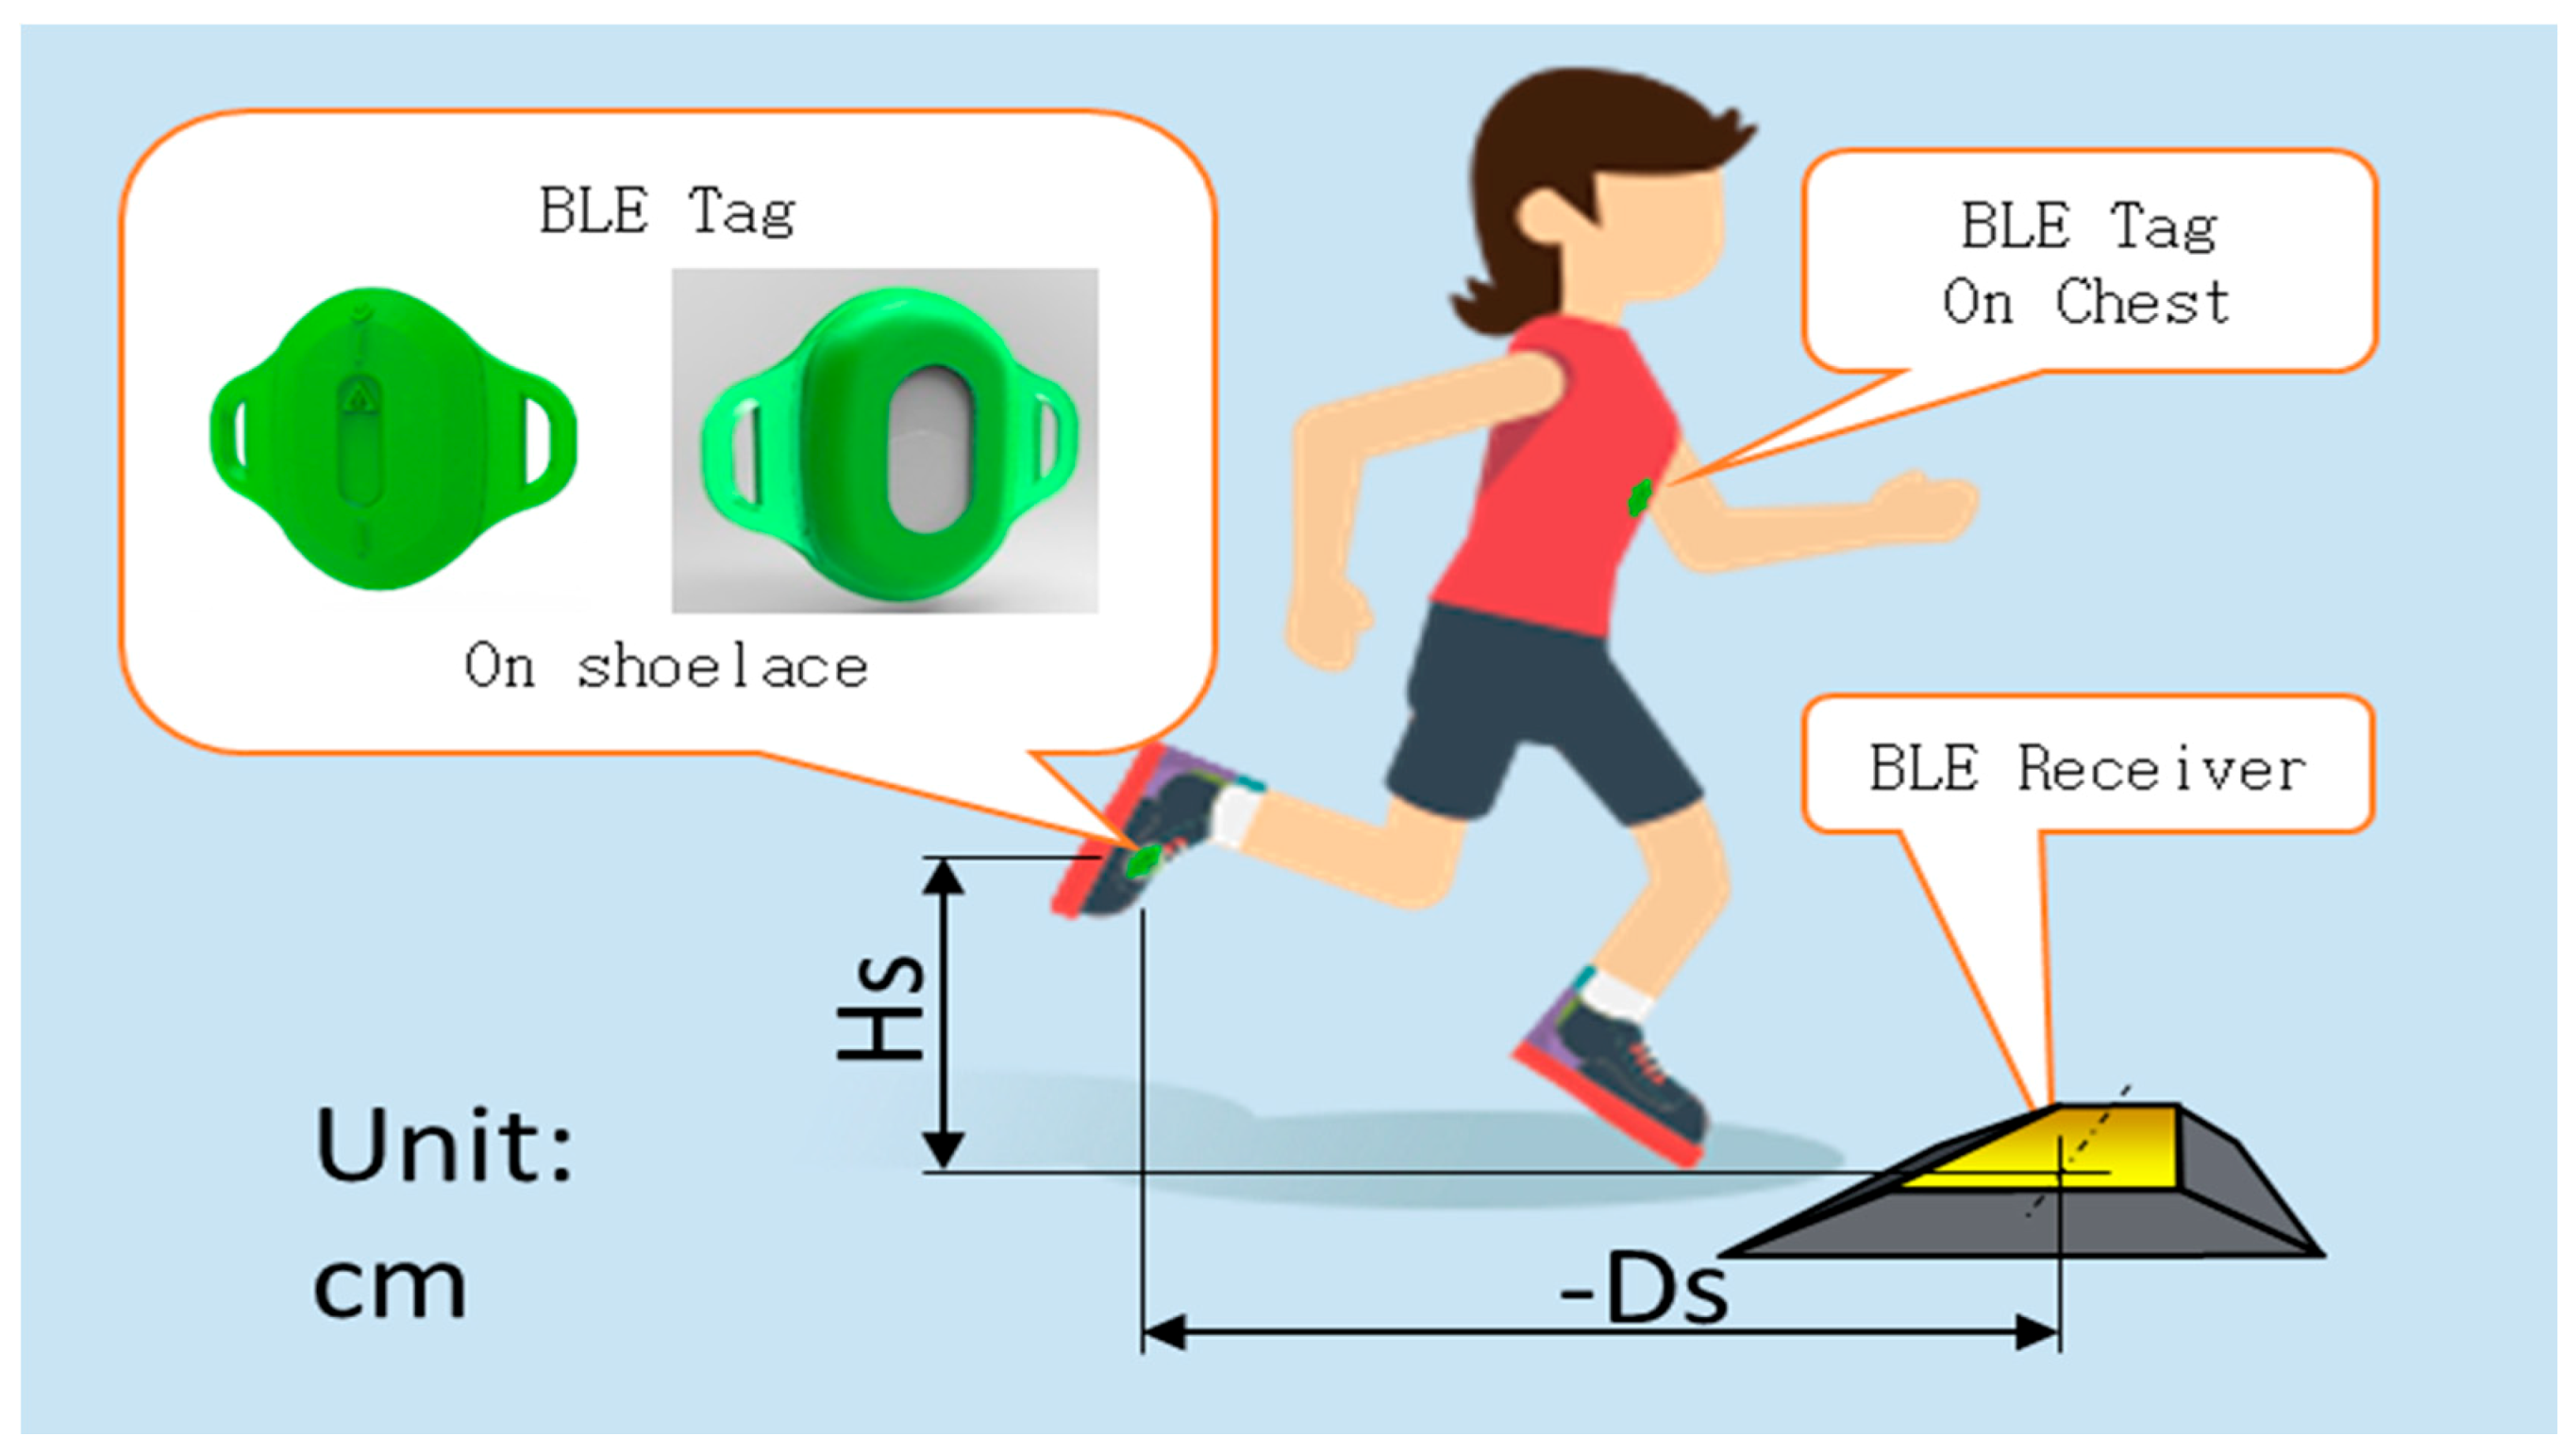
Figure 10.
The received signal strength experiment.
Figure 10.
The received signal strength experiment.
Figure 11.
Static experiment to test the strength of RSSI (Received Signal Strength Indicator) at different locations.
Figure 11.
Static experiment to test the strength of RSSI (Received Signal Strength Indicator) at different locations.
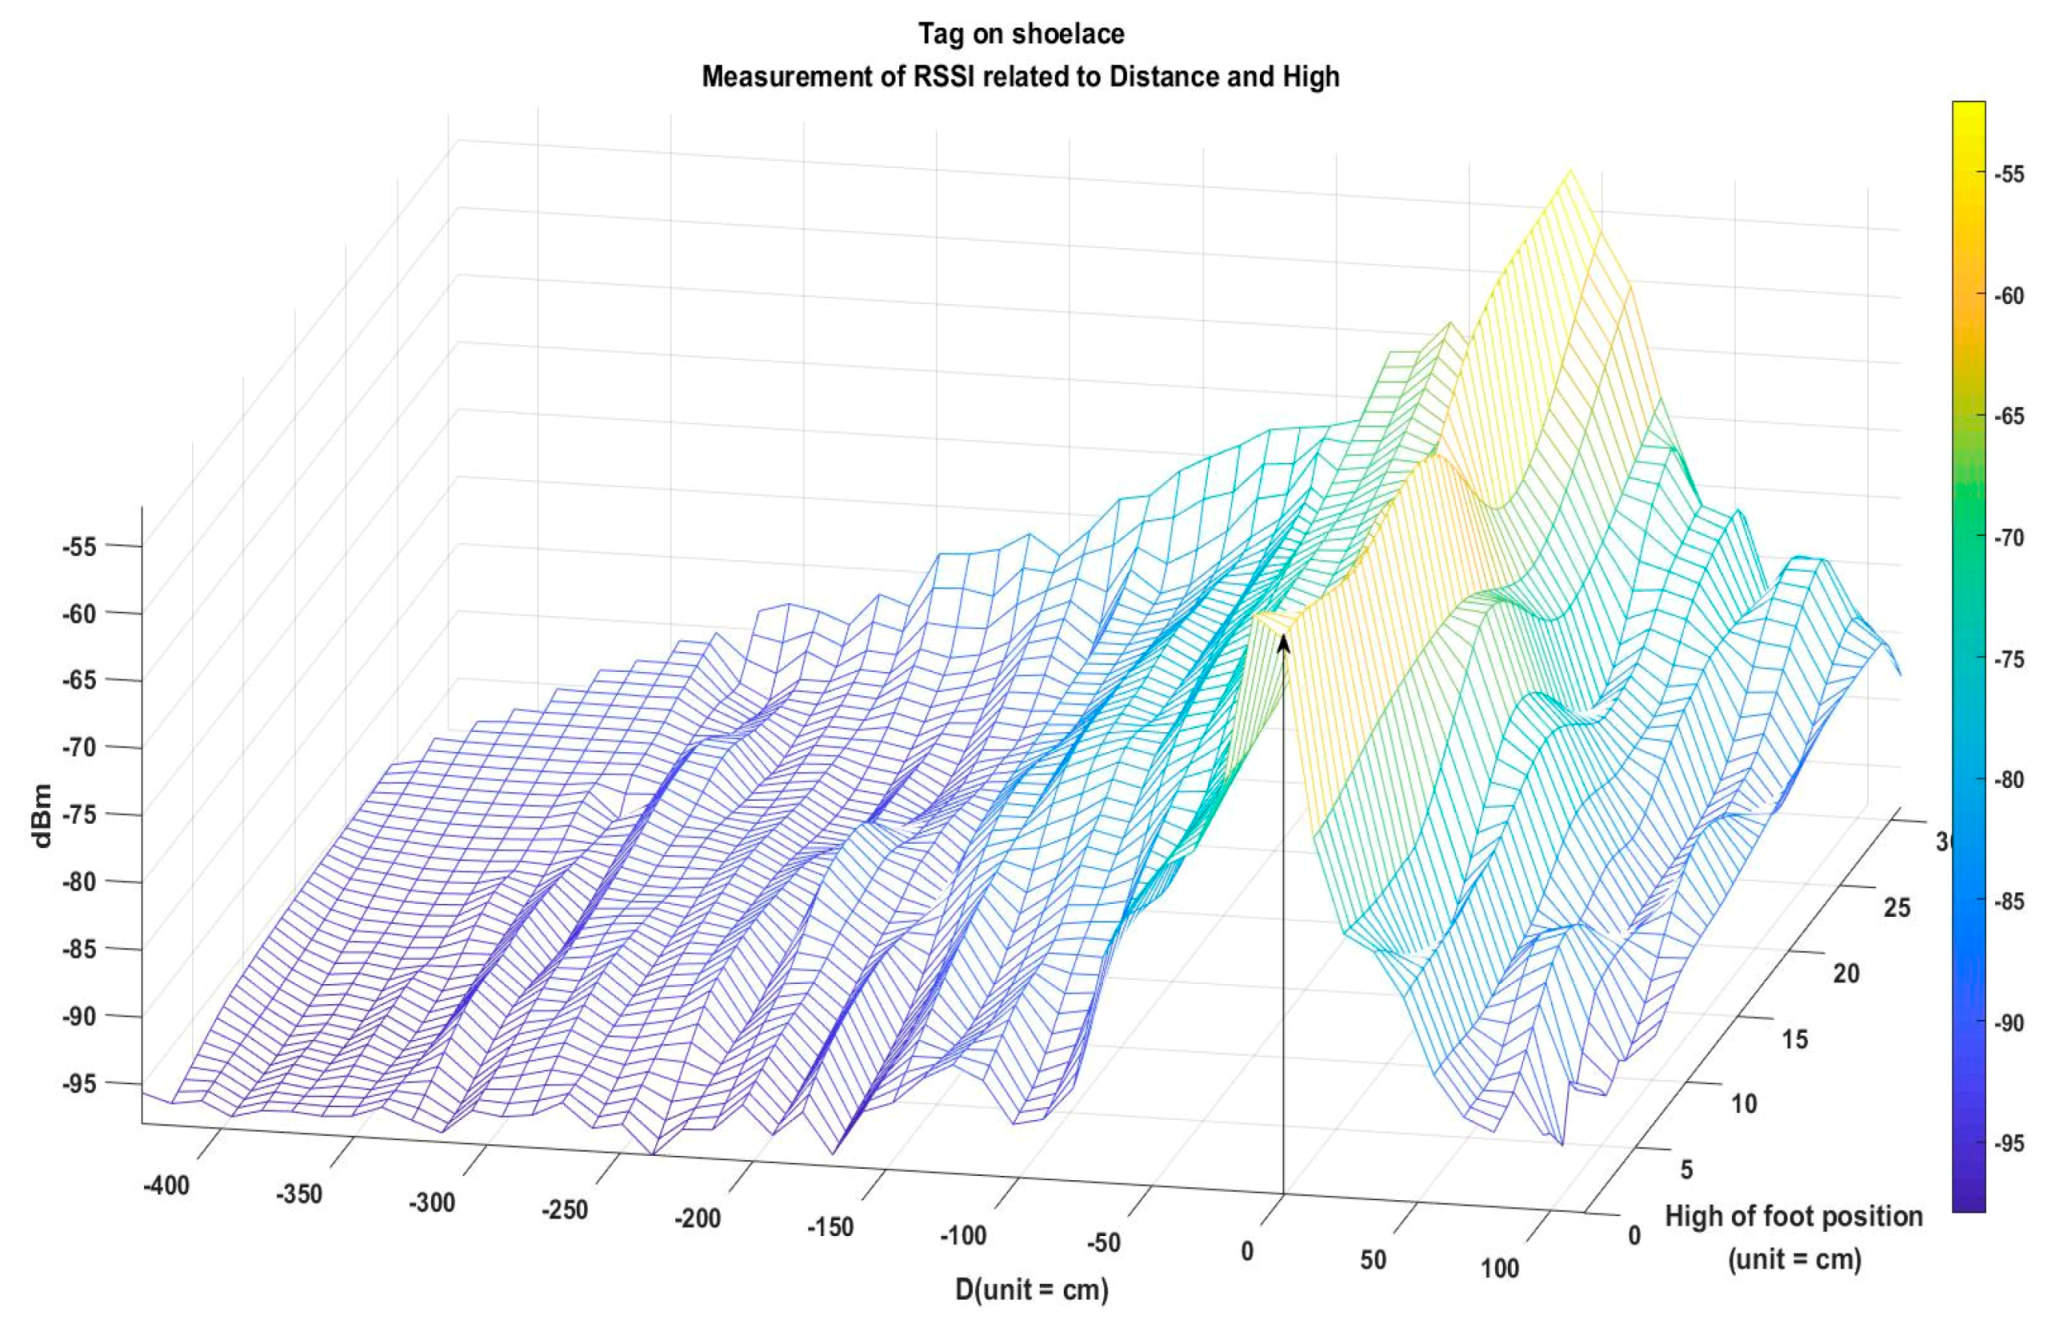
Figure 12.
Static experiment to test the strength of RSSI at different locations.
Figure 12.
Static experiment to test the strength of RSSI at different locations.
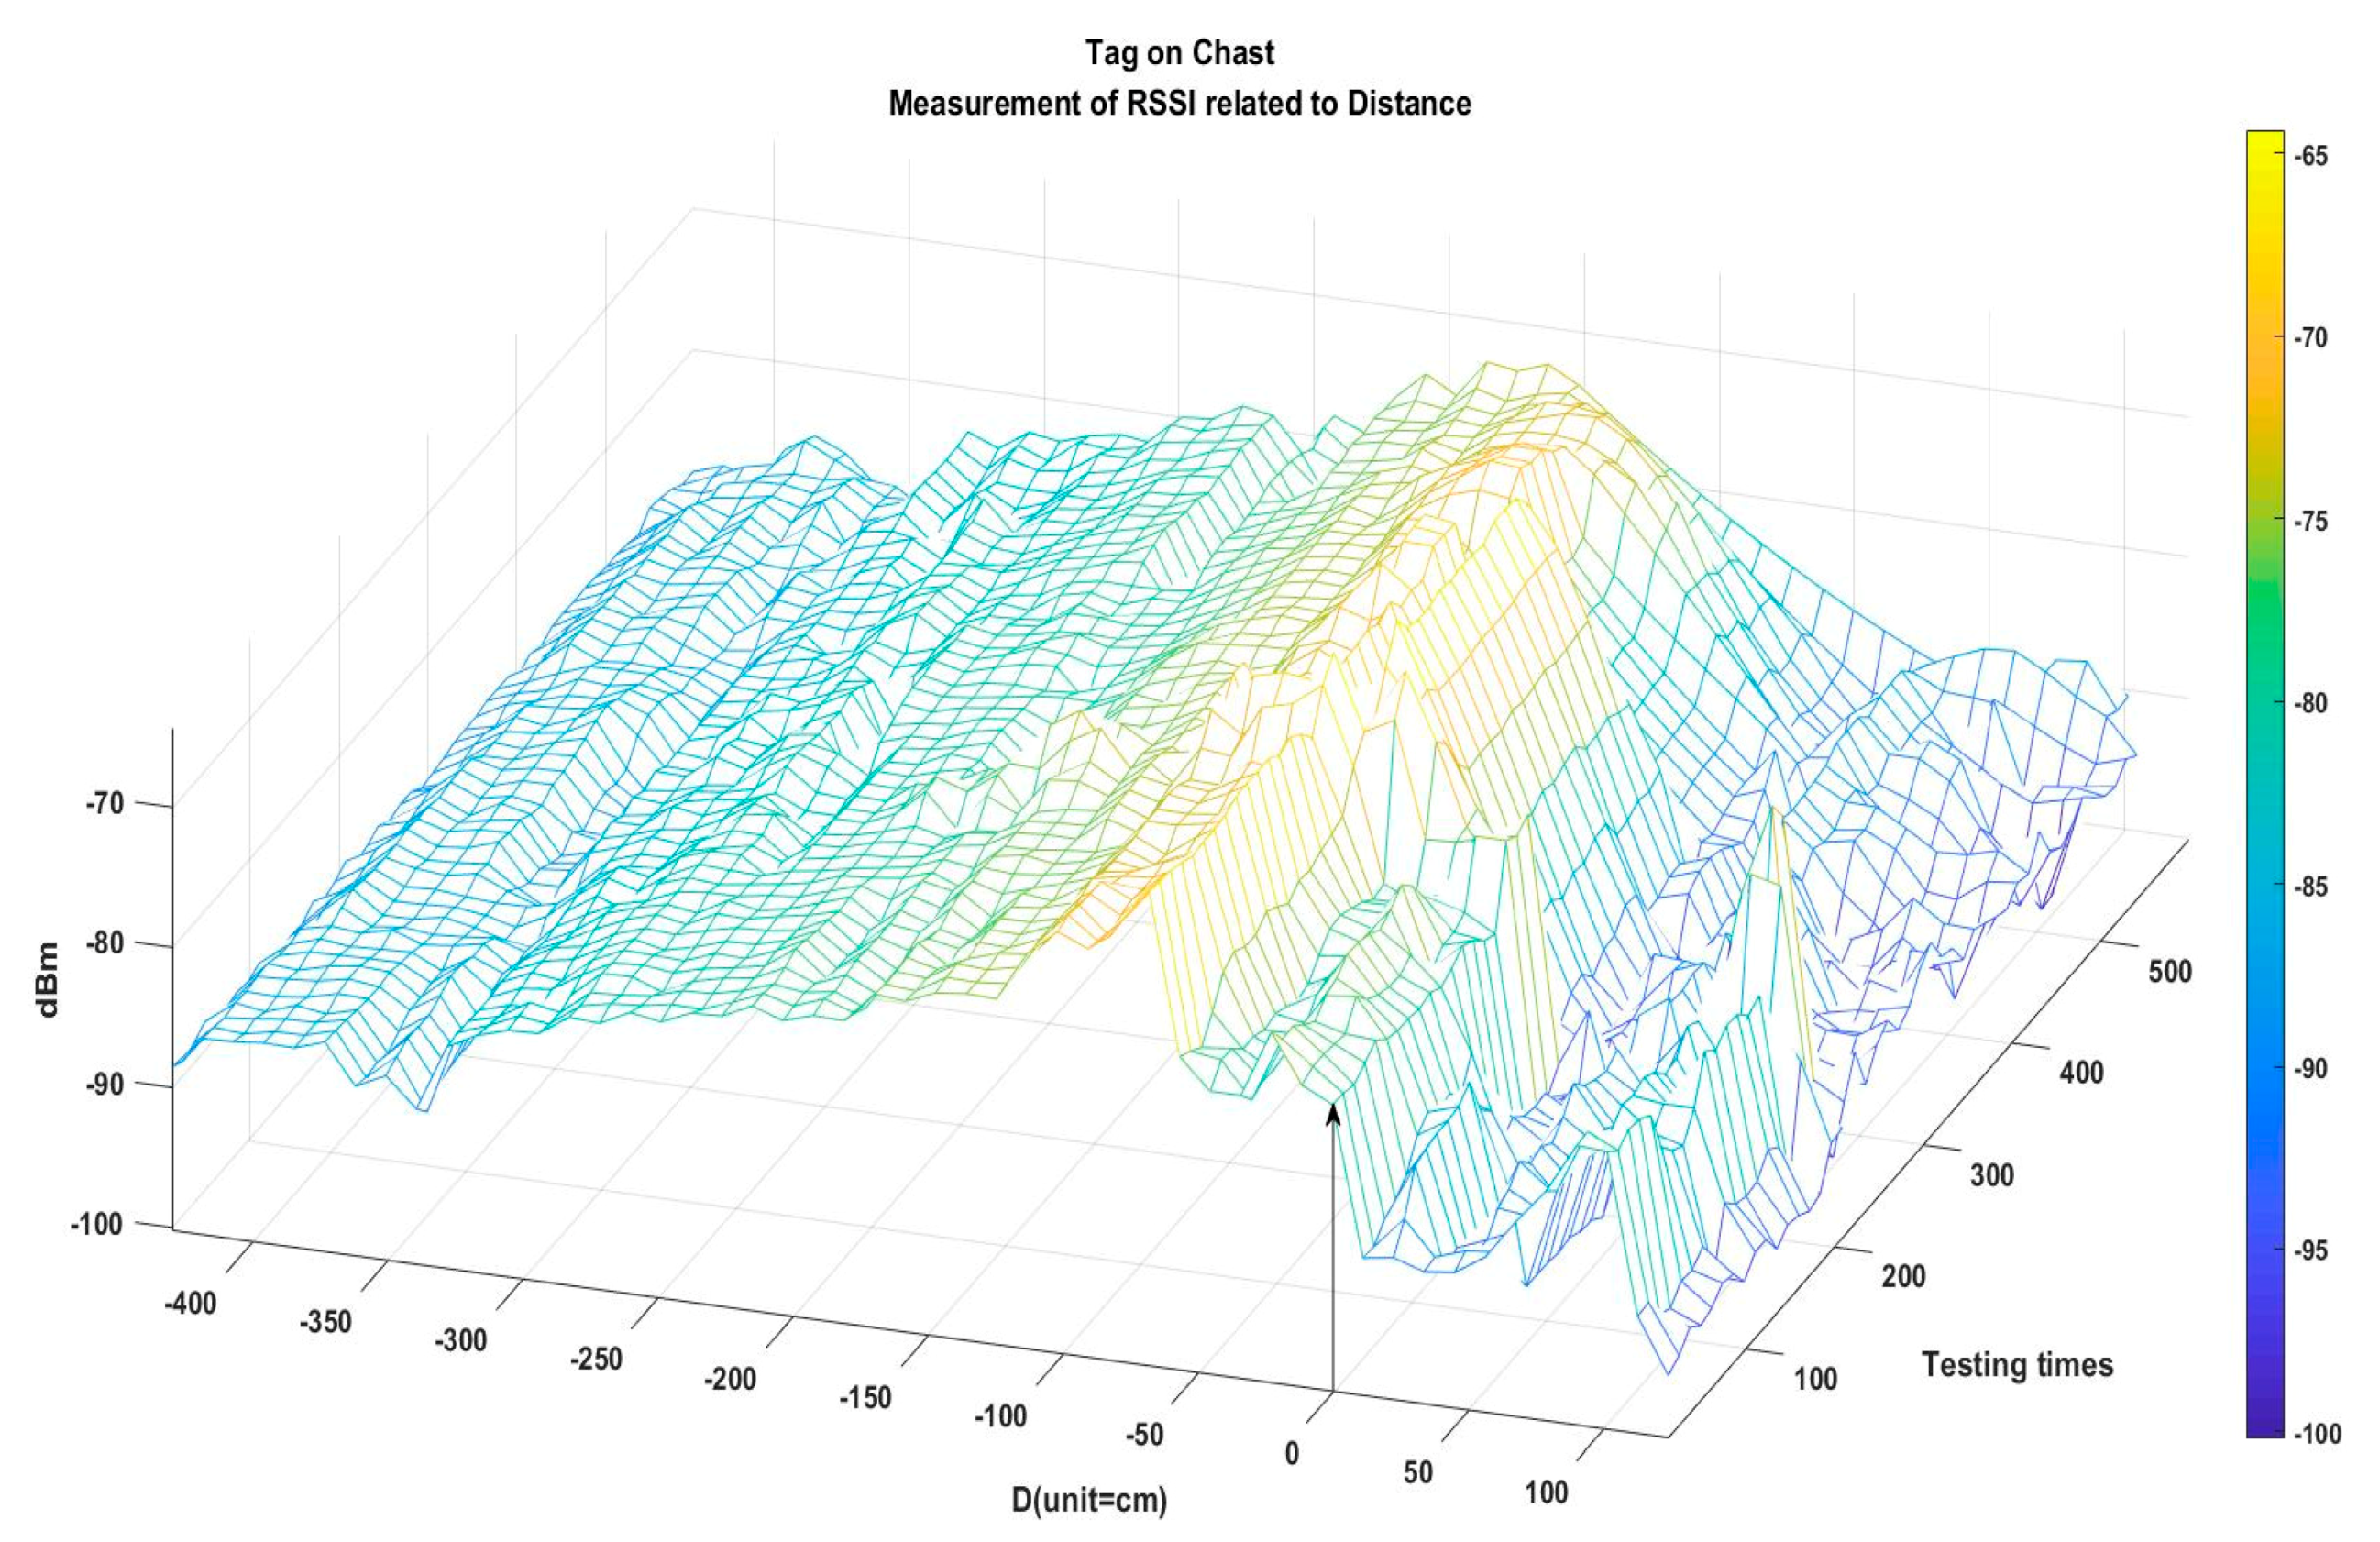
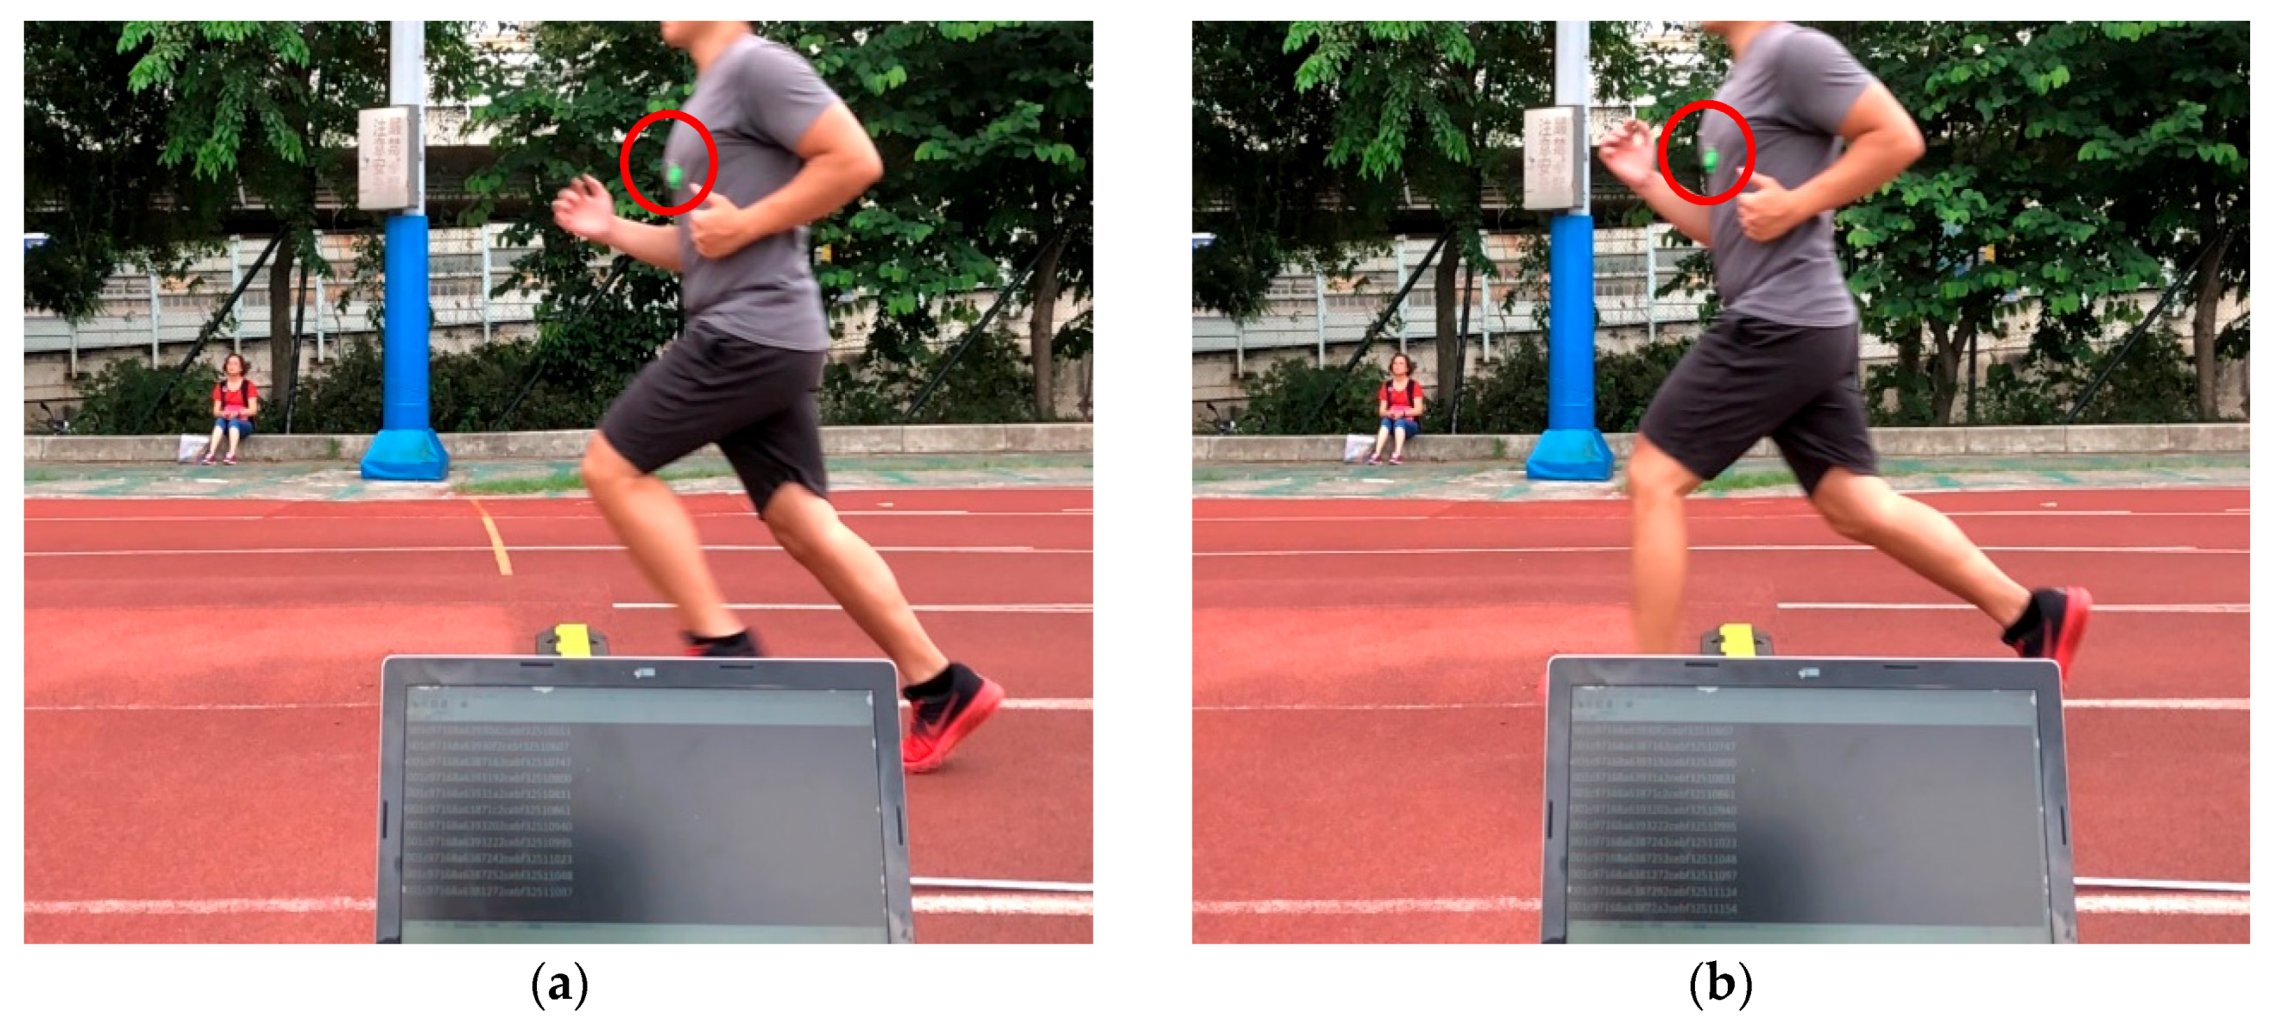
Figure 13.
The dynamic experiment to test the RSSI related to the different runner locations. (a) Shows the time at which the biggest RSSI was received. (b) Shows the time of the BLE Tag on top of the mat.
Figure 13.
The dynamic experiment to test the RSSI related to the different runner locations. (a) Shows the time at which the biggest RSSI was received. (b) Shows the time of the BLE Tag on top of the mat.
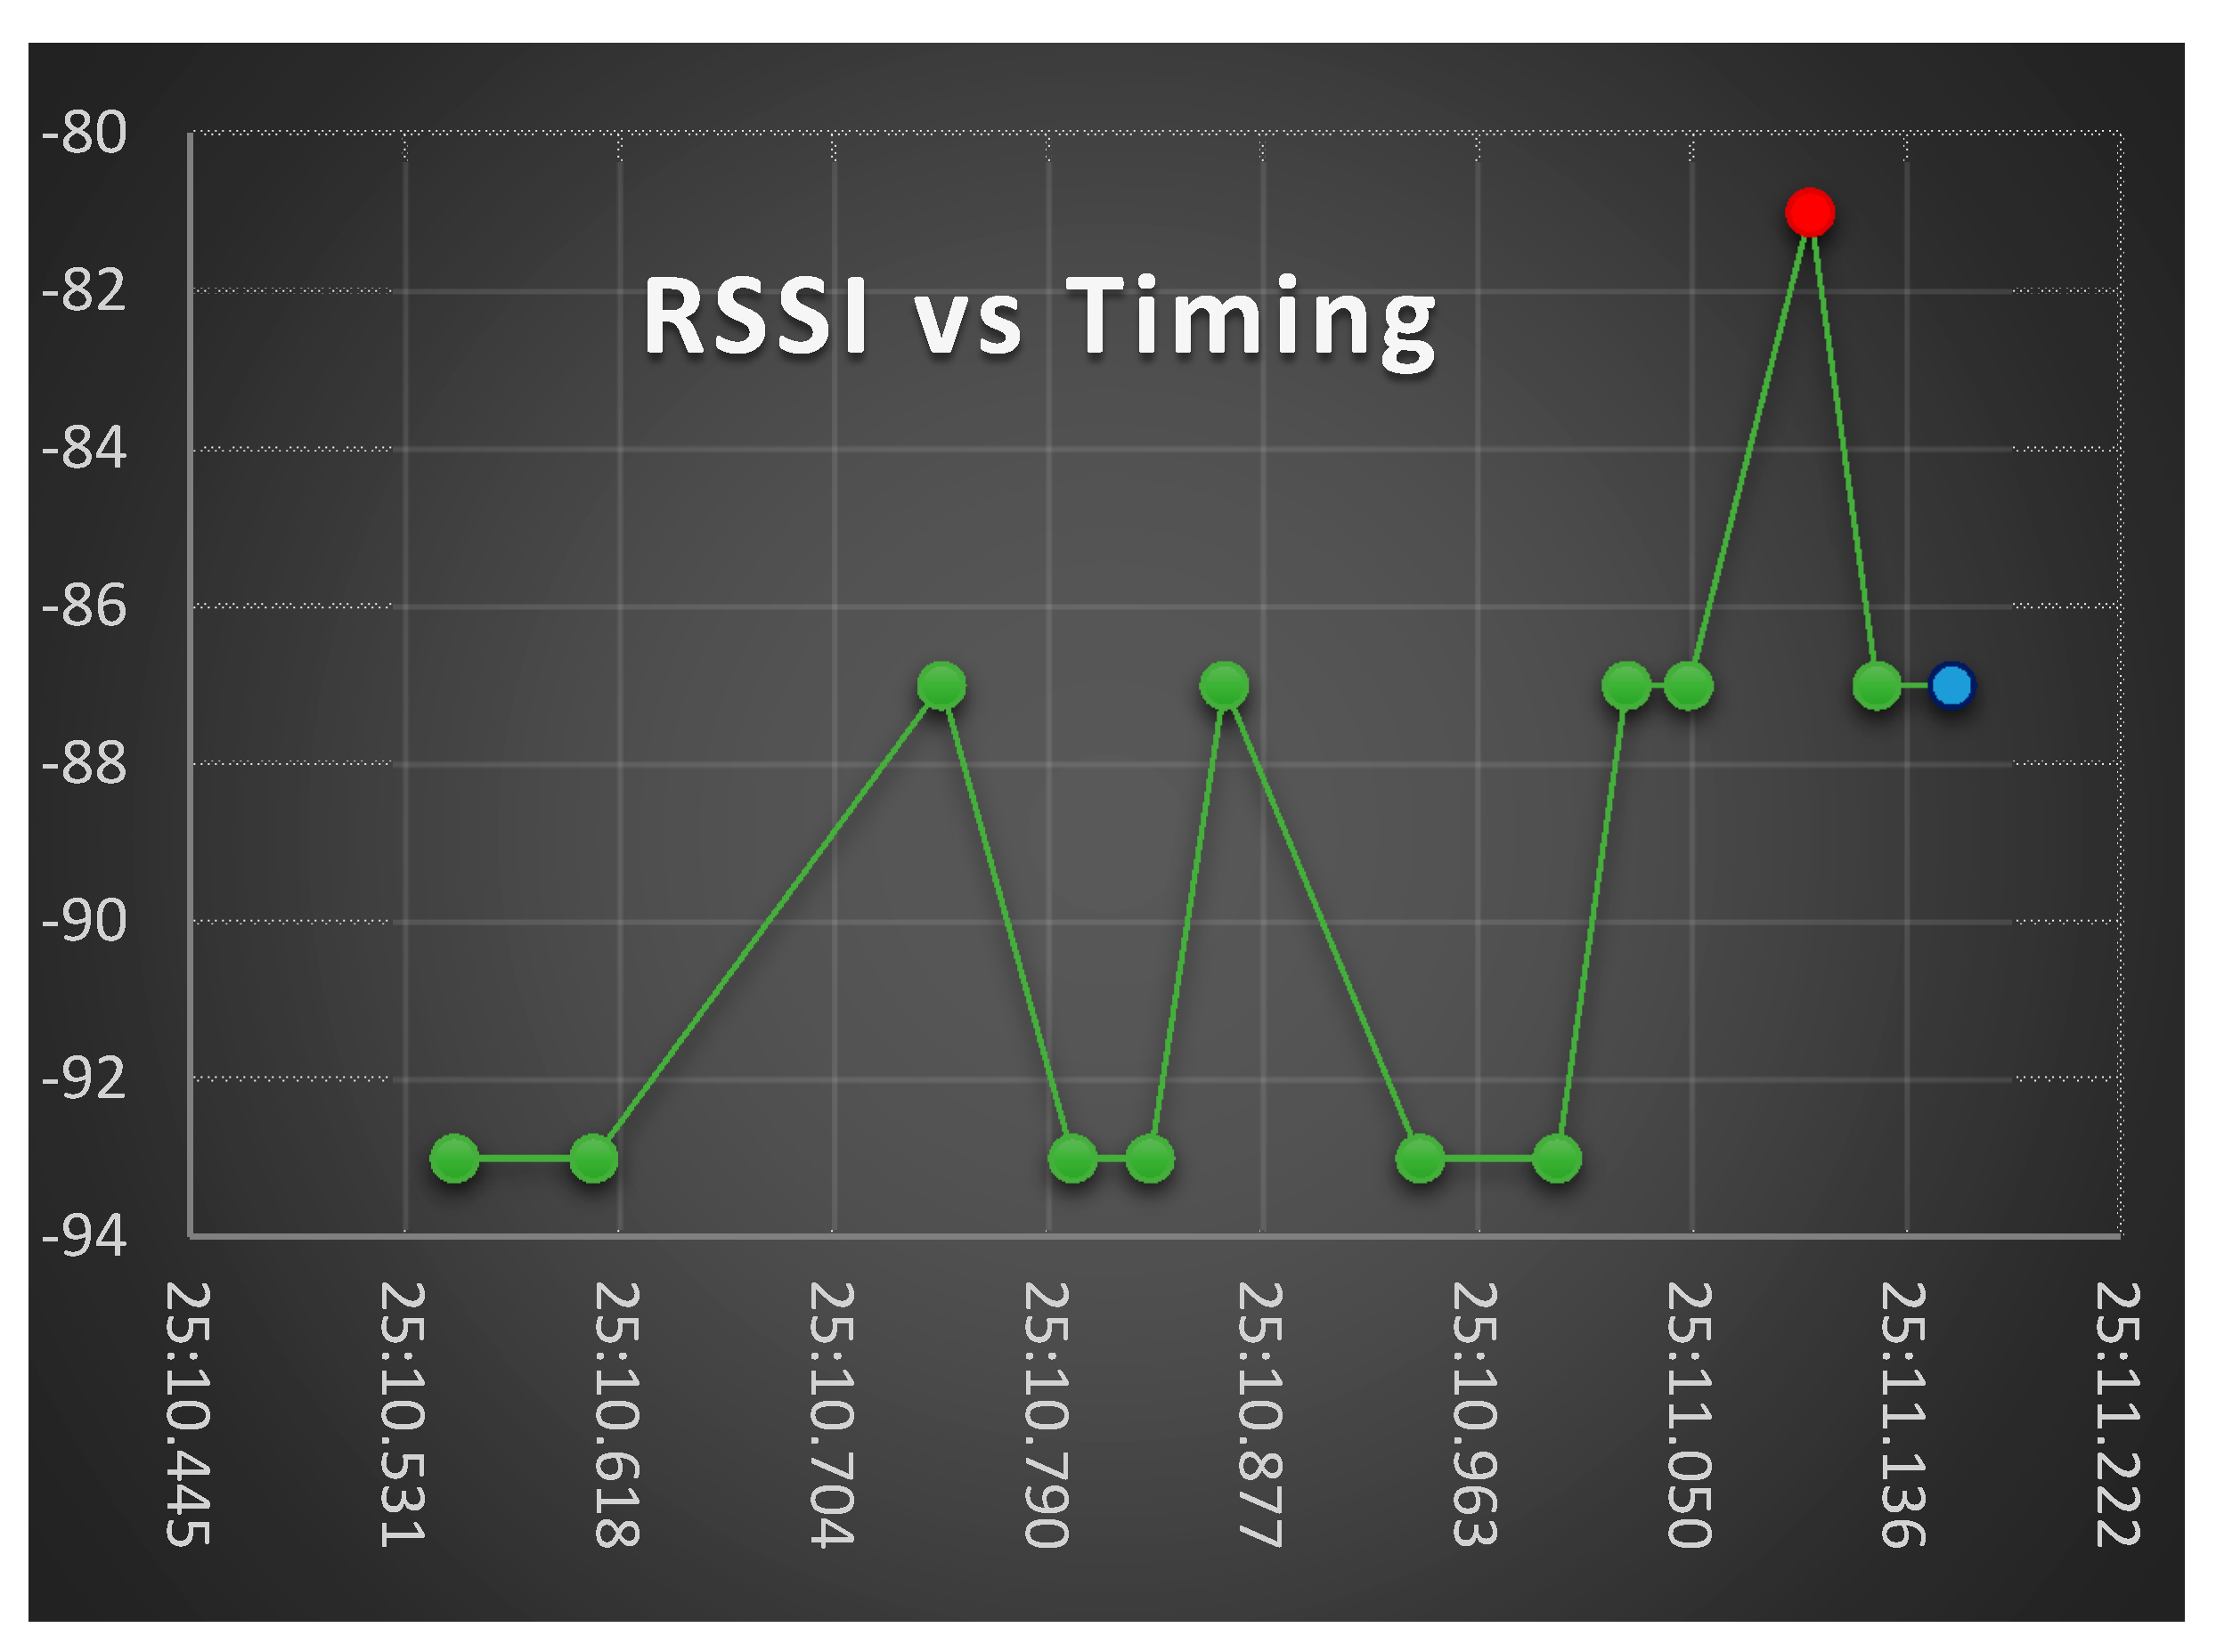
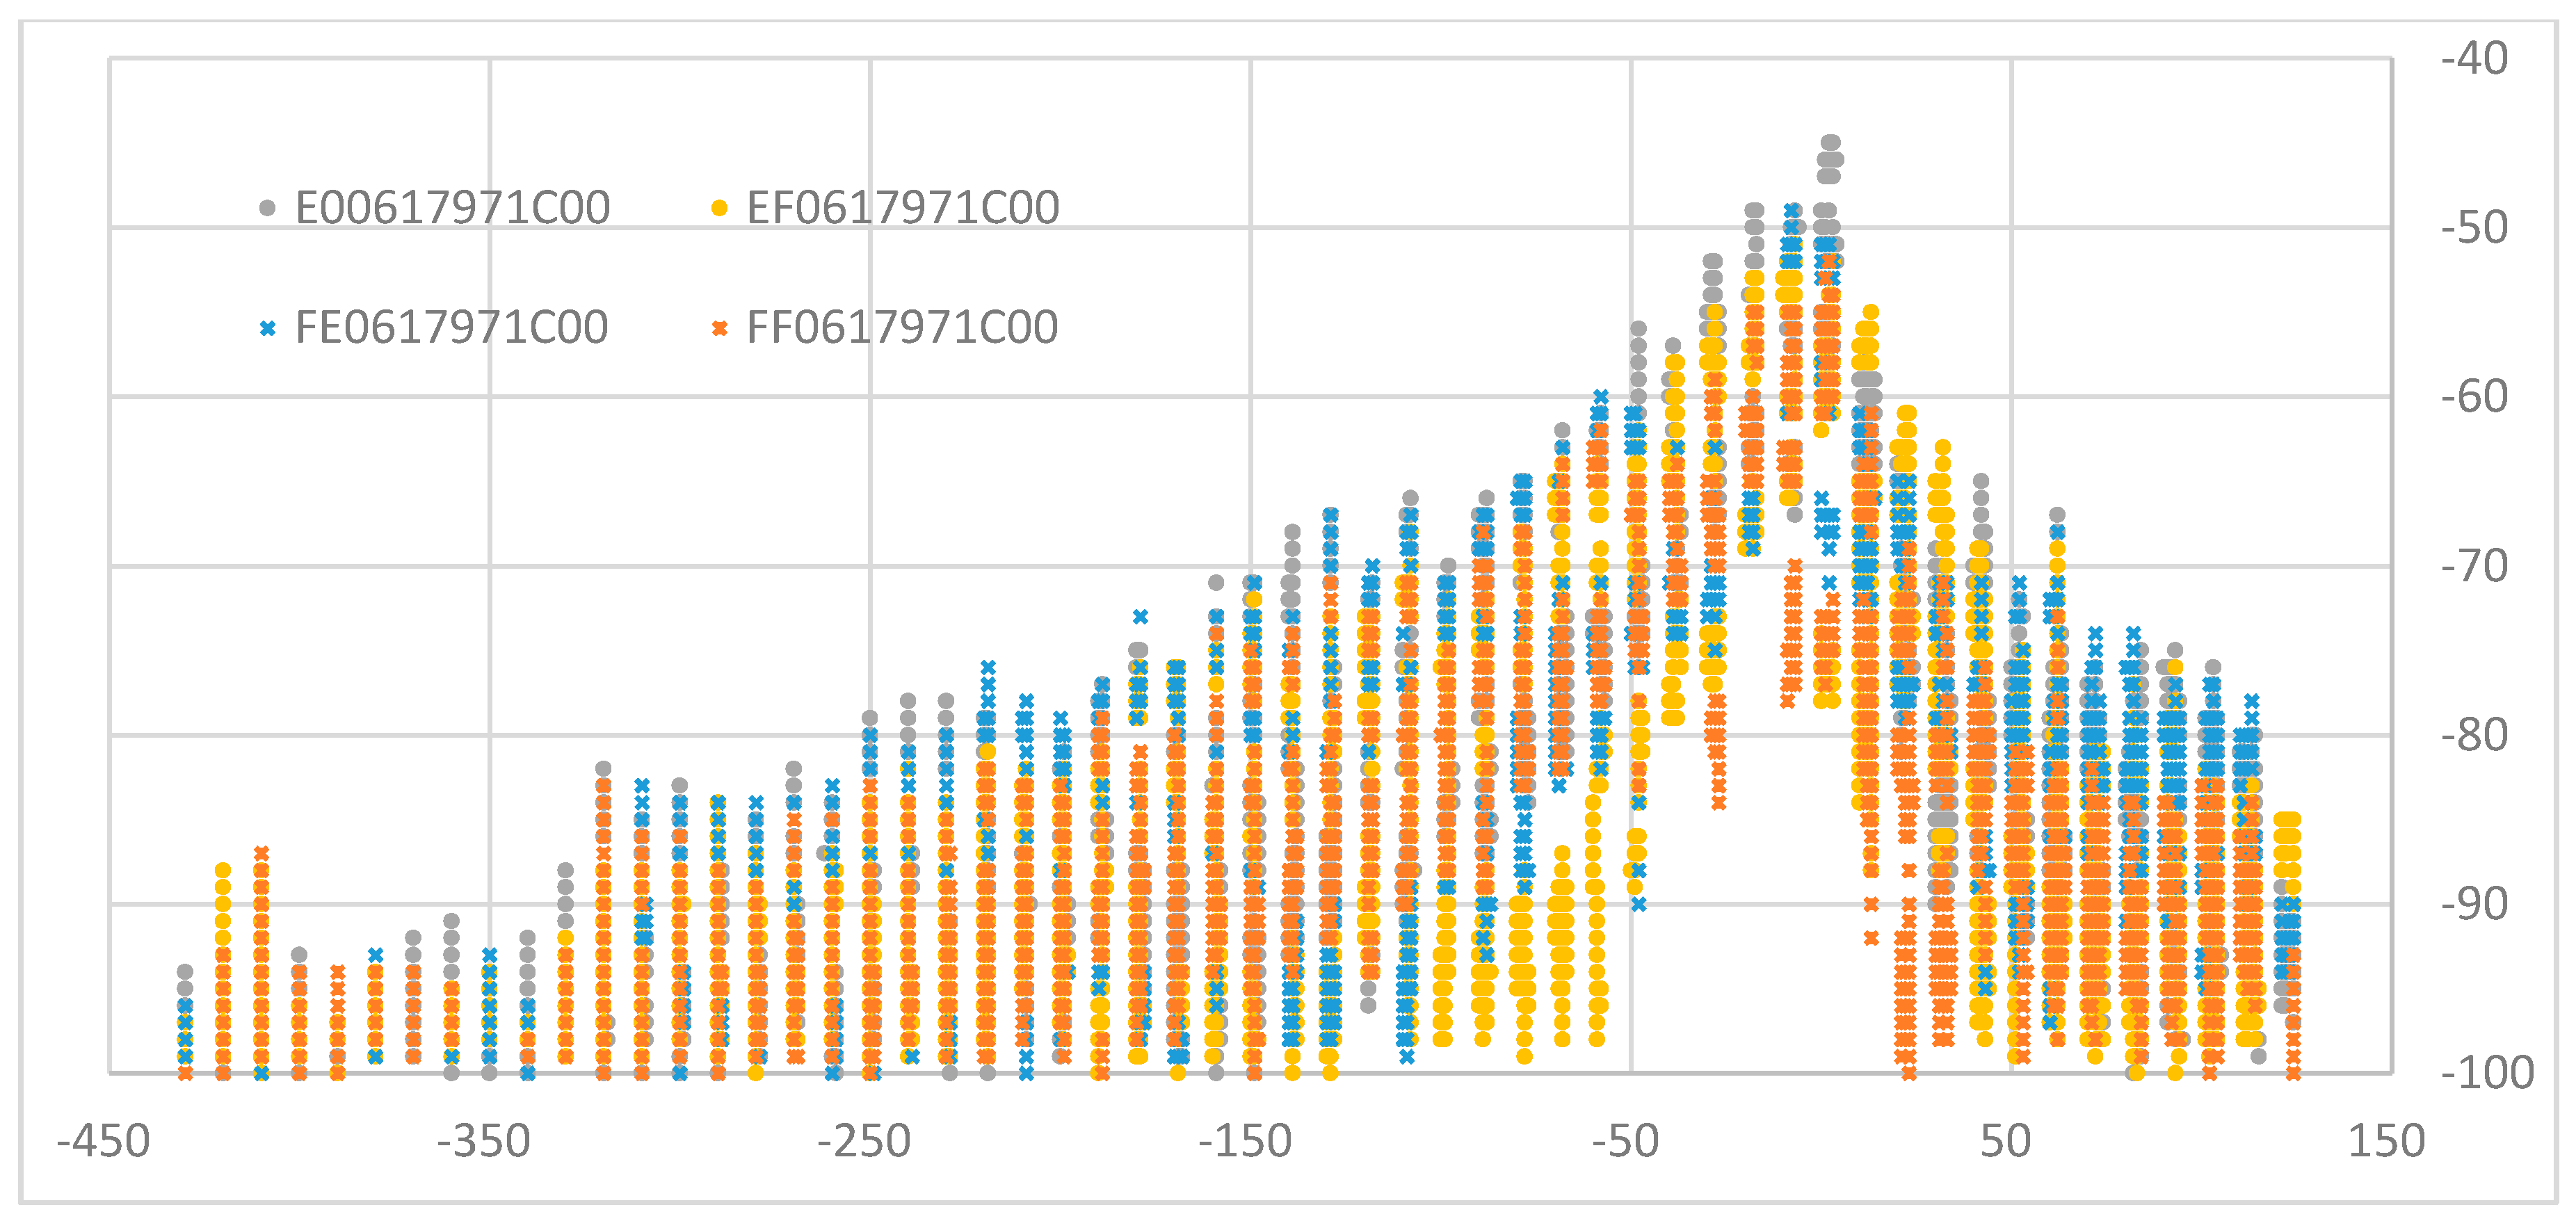
Figure 14.
The RSSI on the BLE Receiver related to the receiving time.
Figure 14.
The RSSI on the BLE Receiver related to the receiving time.
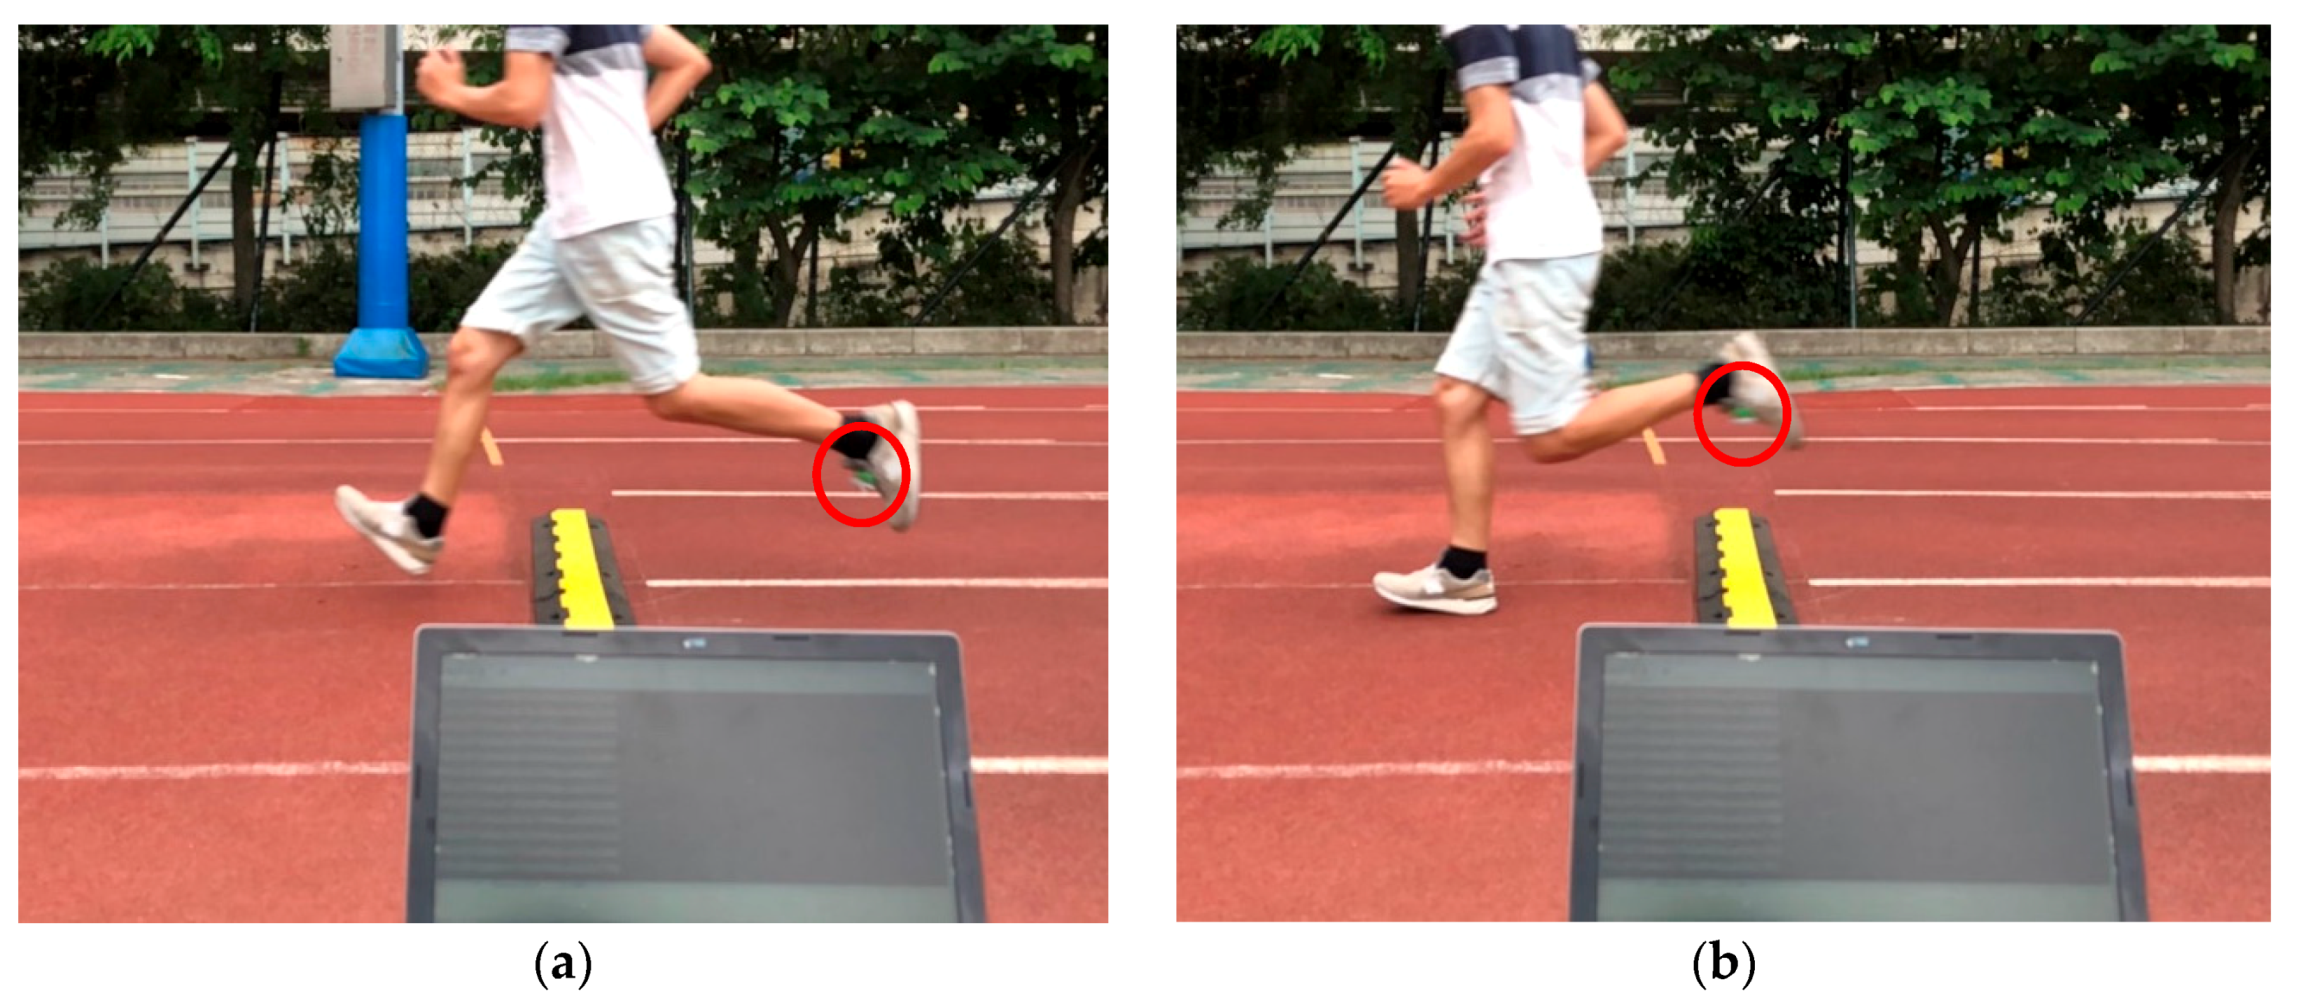
Figure 15.
The dynamic experiment to test the RSSI related to the different locations, while the BLE Tag is on the instep. (a) Shows the time of the runner on top of the mat. (b) Shows the time at which the biggest RSSI was received.
Figure 15.
The dynamic experiment to test the RSSI related to the different locations, while the BLE Tag is on the instep. (a) Shows the time of the runner on top of the mat. (b) Shows the time at which the biggest RSSI was received.
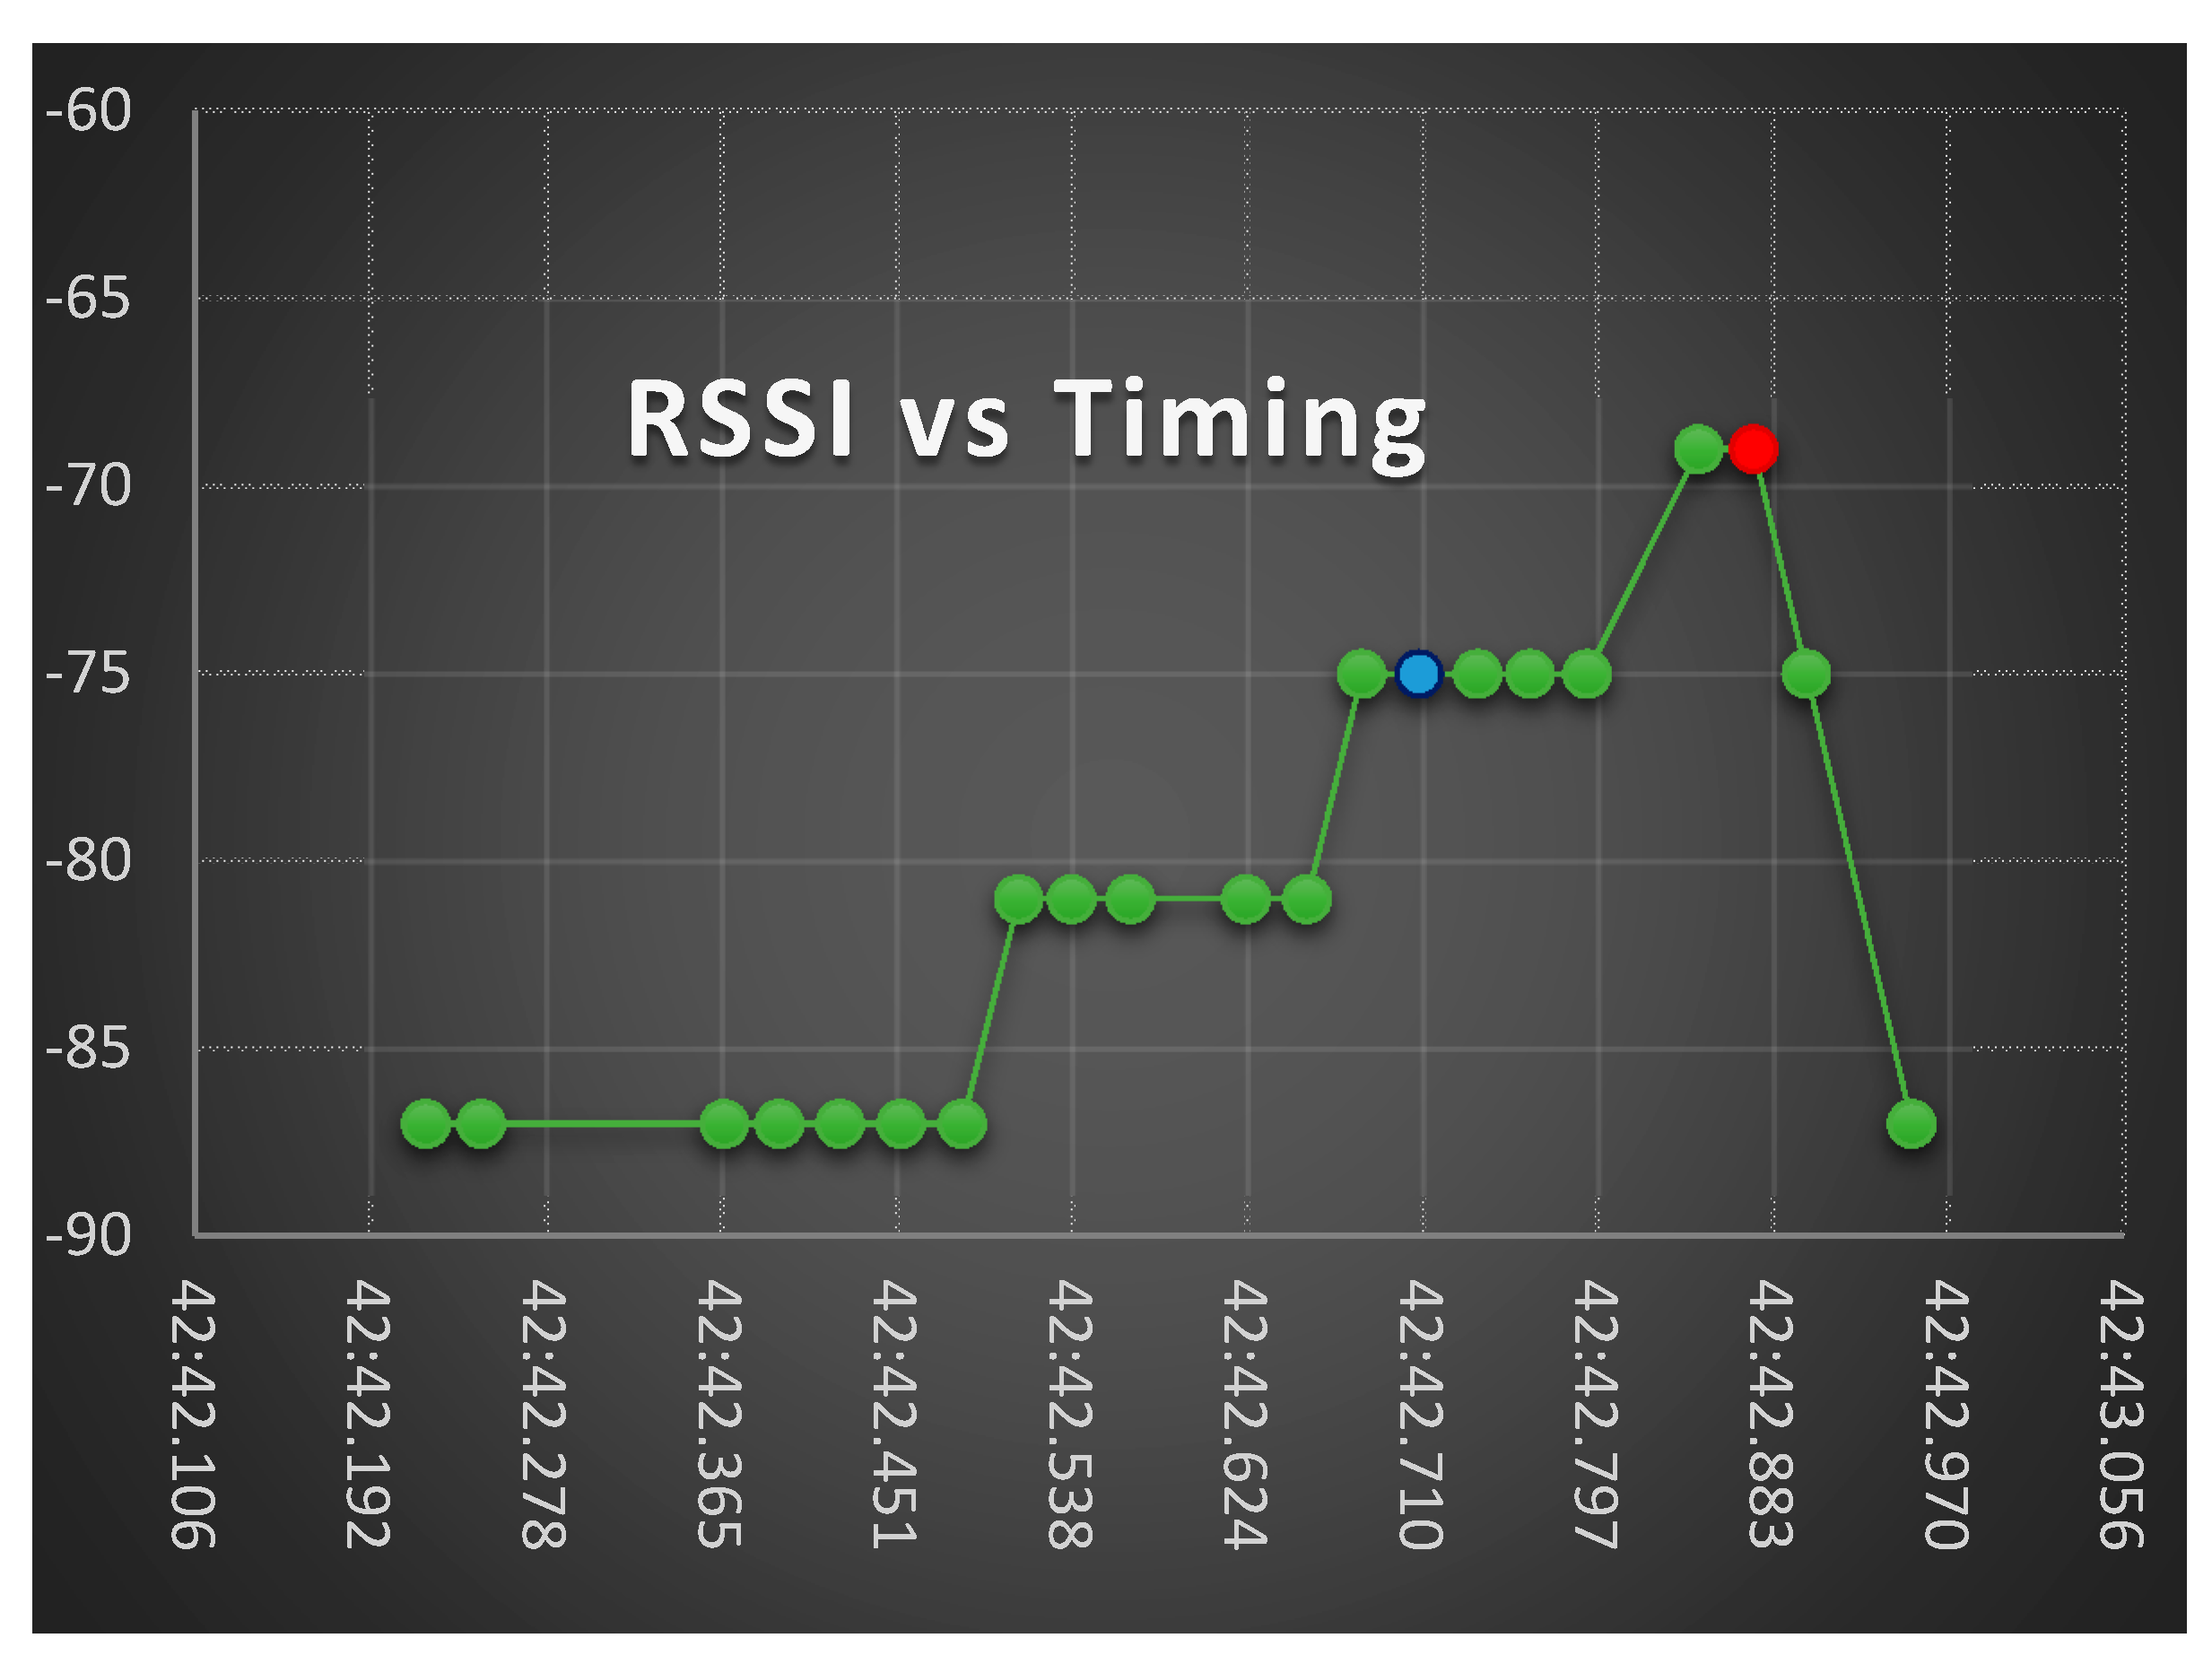
Figure 16.
The RSSI on the BLE Receiver related to the receiving time.
Figure 16.
The RSSI on the BLE Receiver related to the receiving time.
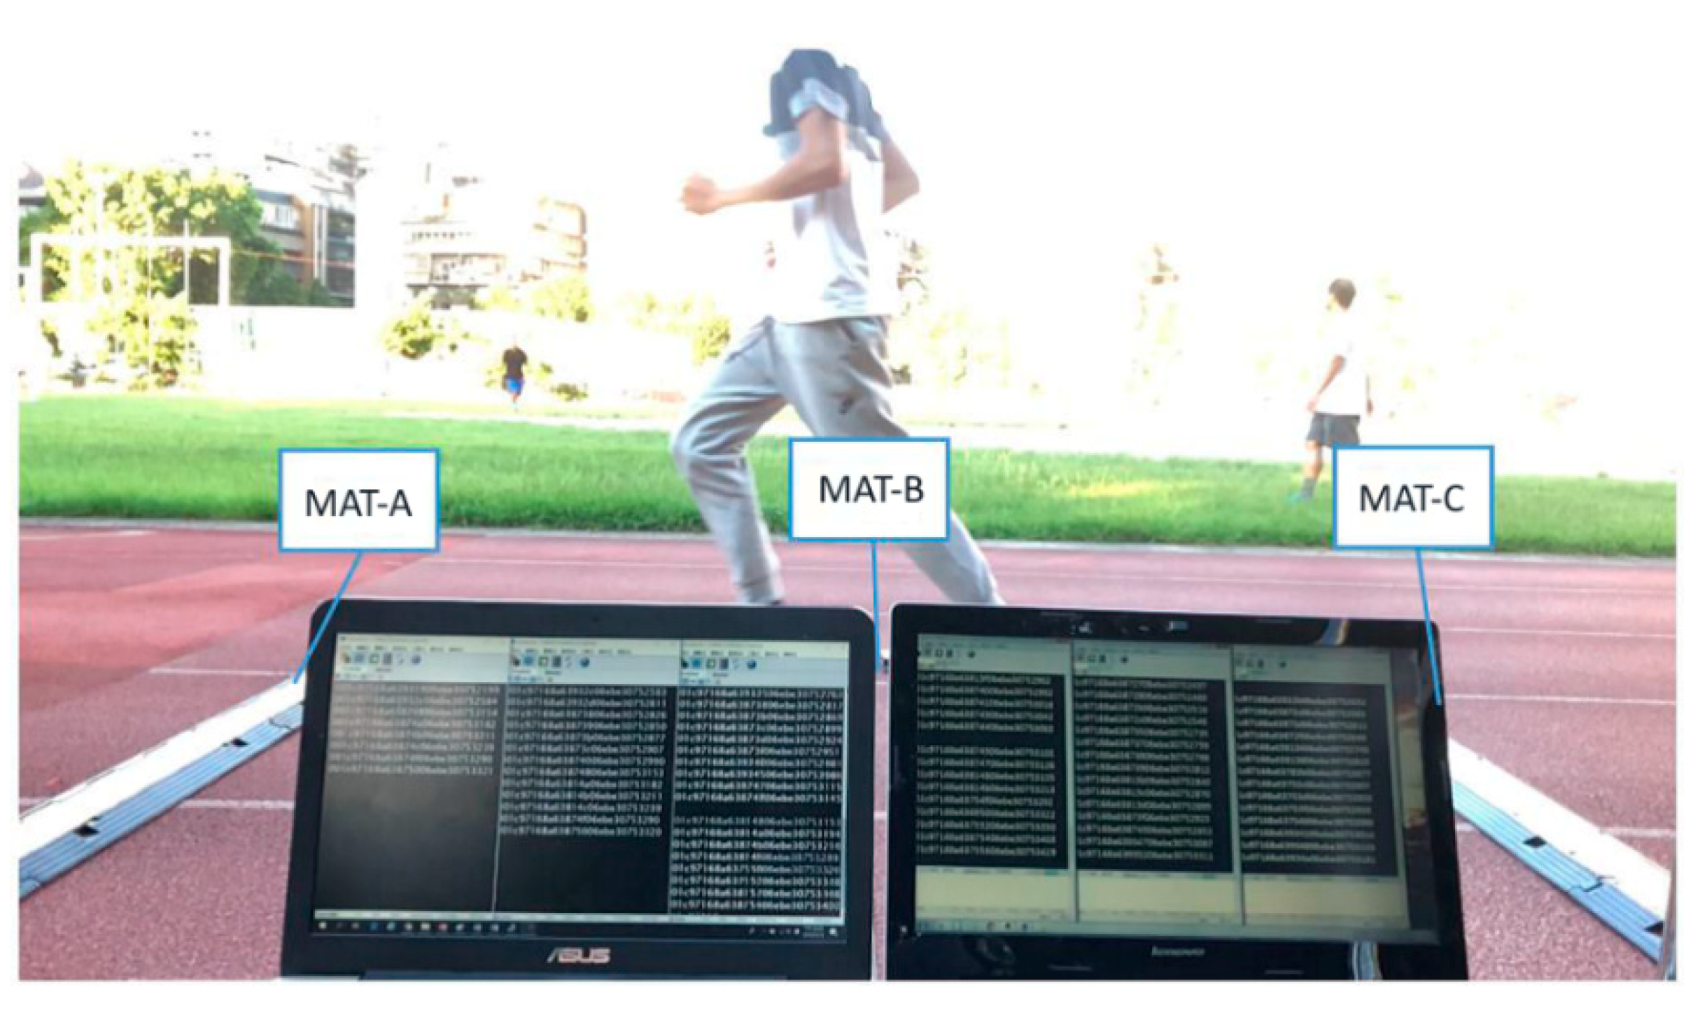
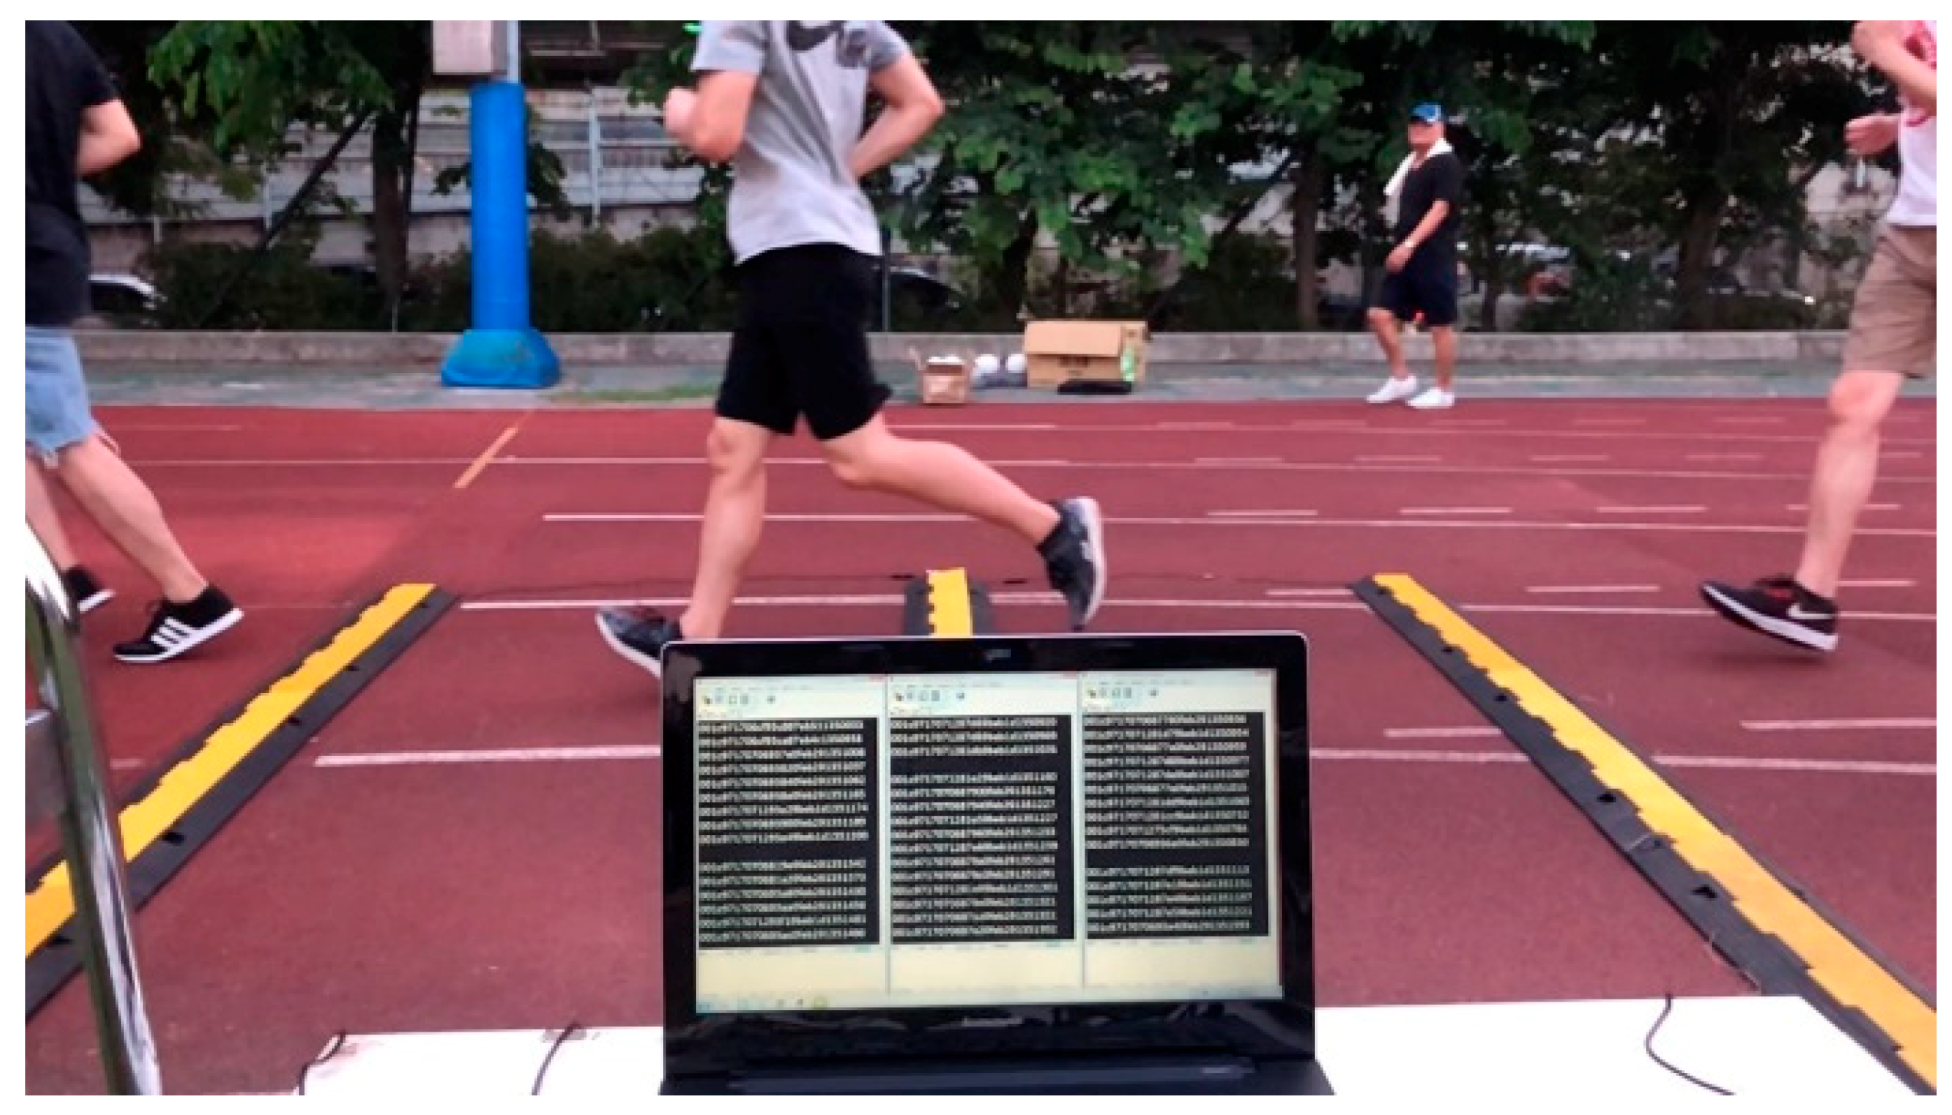
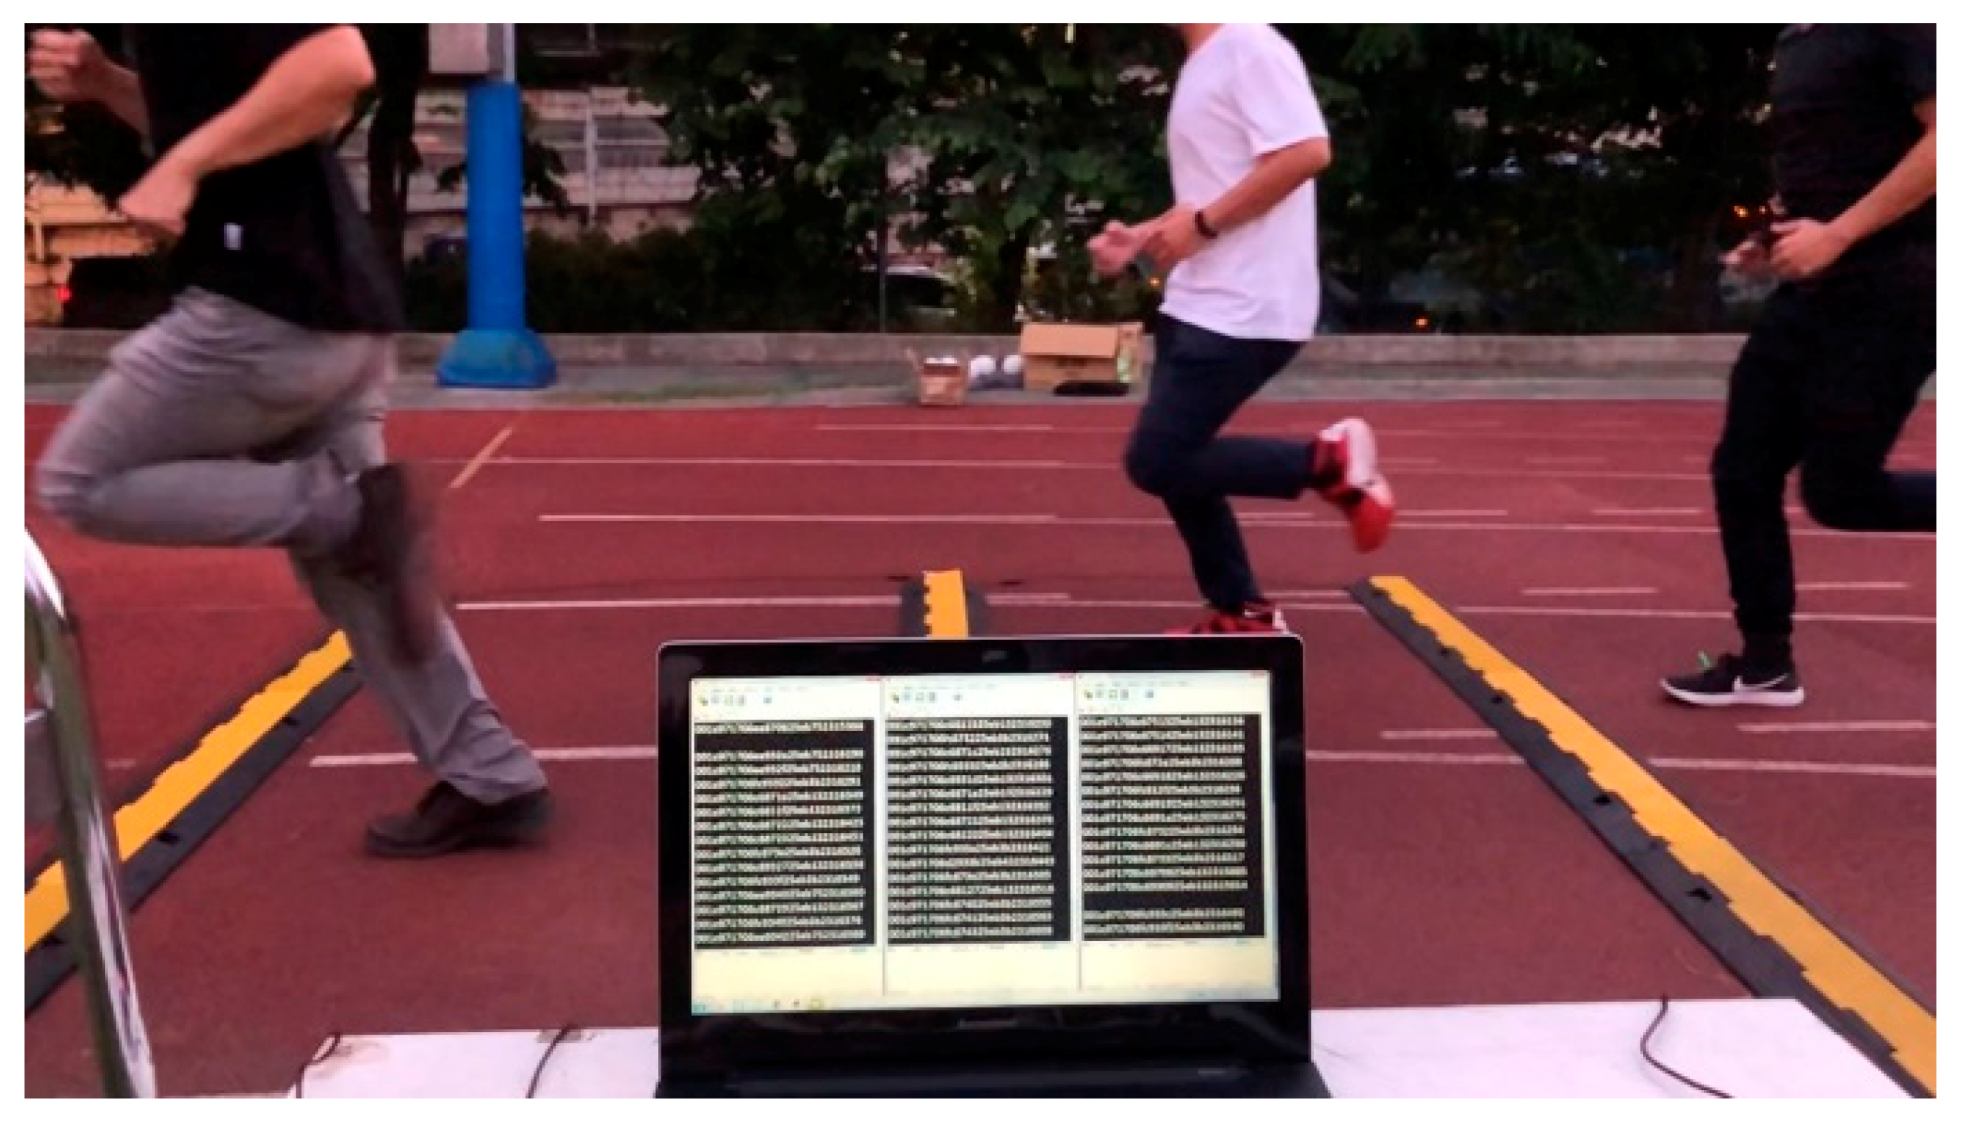
Figure 17.
The dynamic experiment of three sets of MAT when a BLE Tag is on the runner’s chest.
Figure 17.
The dynamic experiment of three sets of MAT when a BLE Tag is on the runner’s chest.
Figure 18.
Four runners with a BLE Tag on their respective chests ran through the three sets of MAT one by one.
Figure 18.
Four runners with a BLE Tag on their respective chests ran through the three sets of MAT one by one.
Figure 19.
Four runners with a BLE Tag on their respective insteps ran through the three sets of MAT one by one.
Figure 19.
Four runners with a BLE Tag on their respective insteps ran through the three sets of MAT one by one.
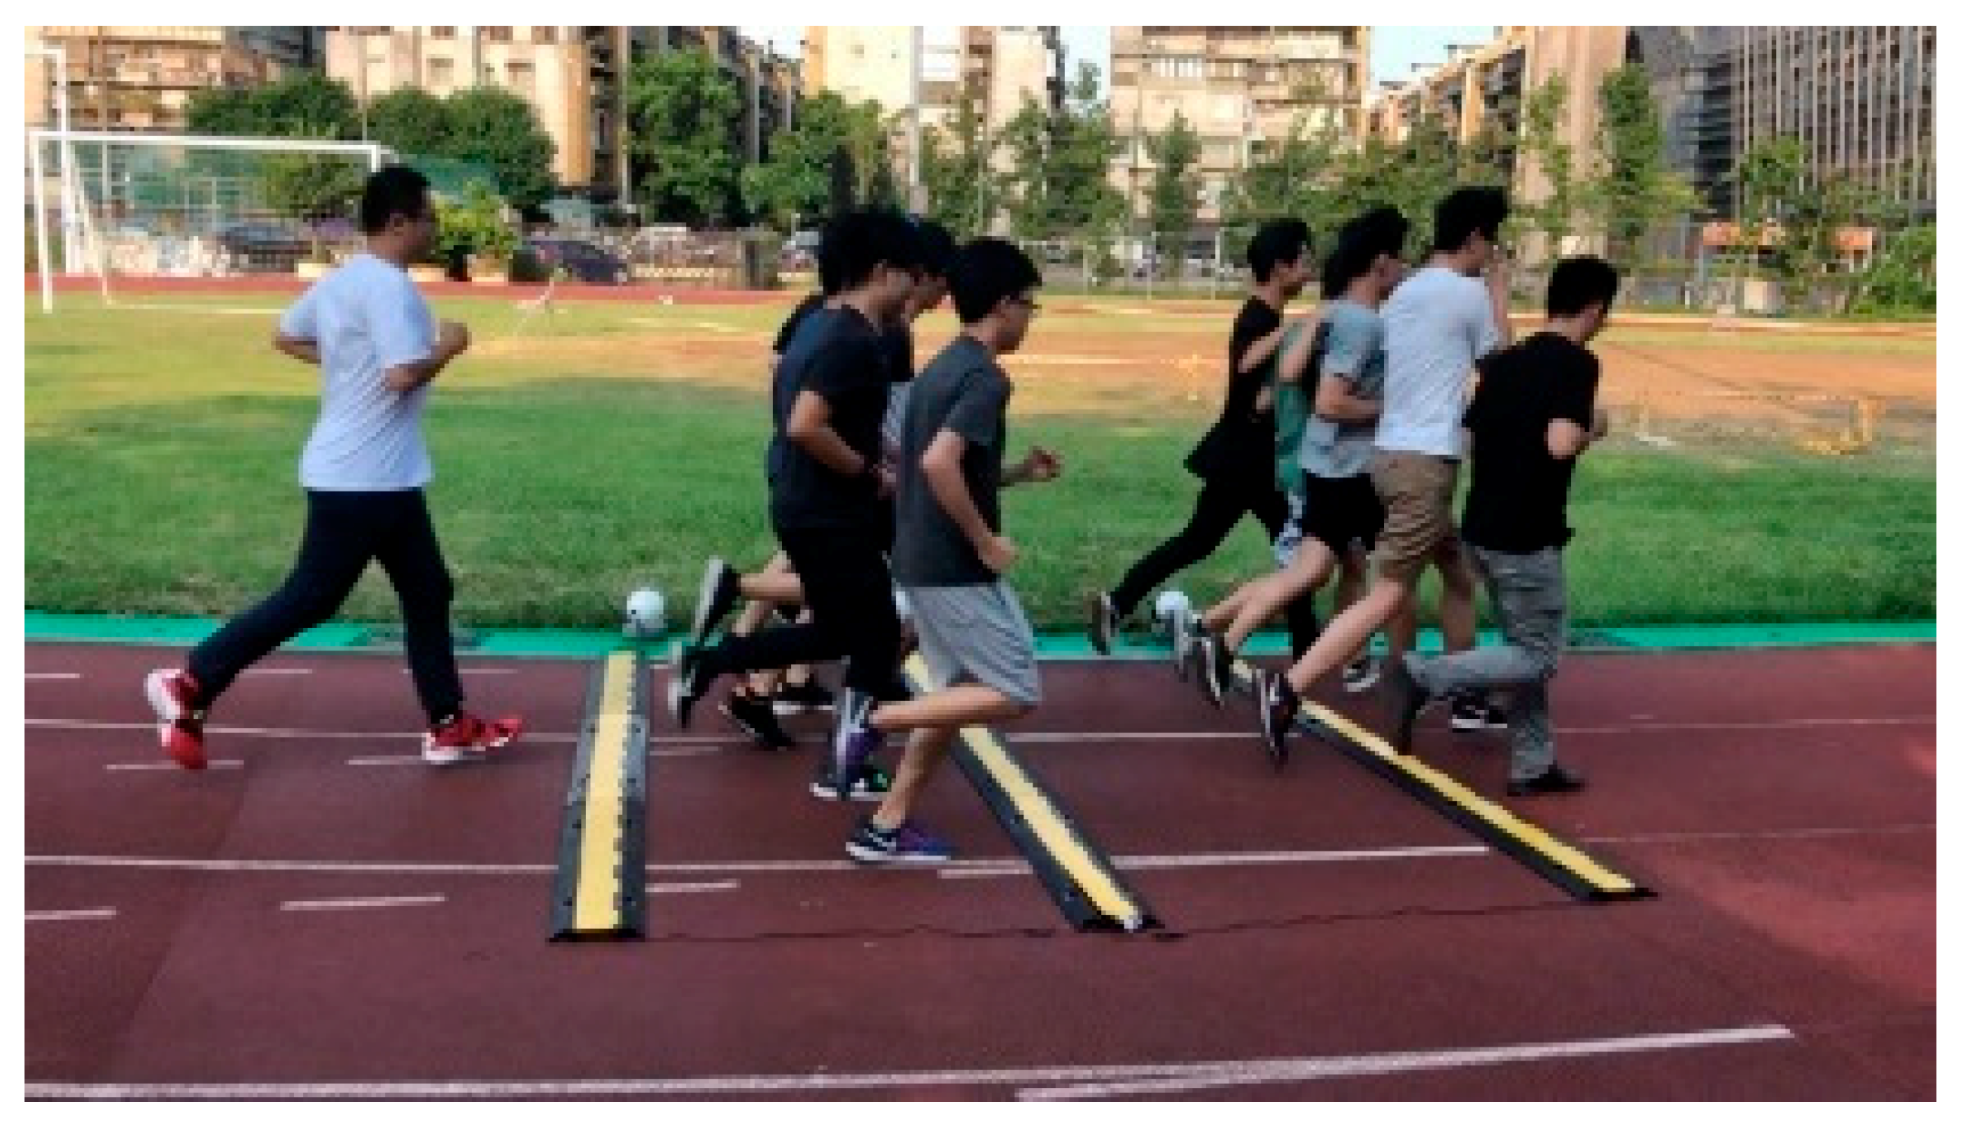
Figure 20.
Runners with 20 different BLE Tag configurations, running through three sets of MAT.
Figure 20.
Runners with 20 different BLE Tag configurations, running through three sets of MAT.
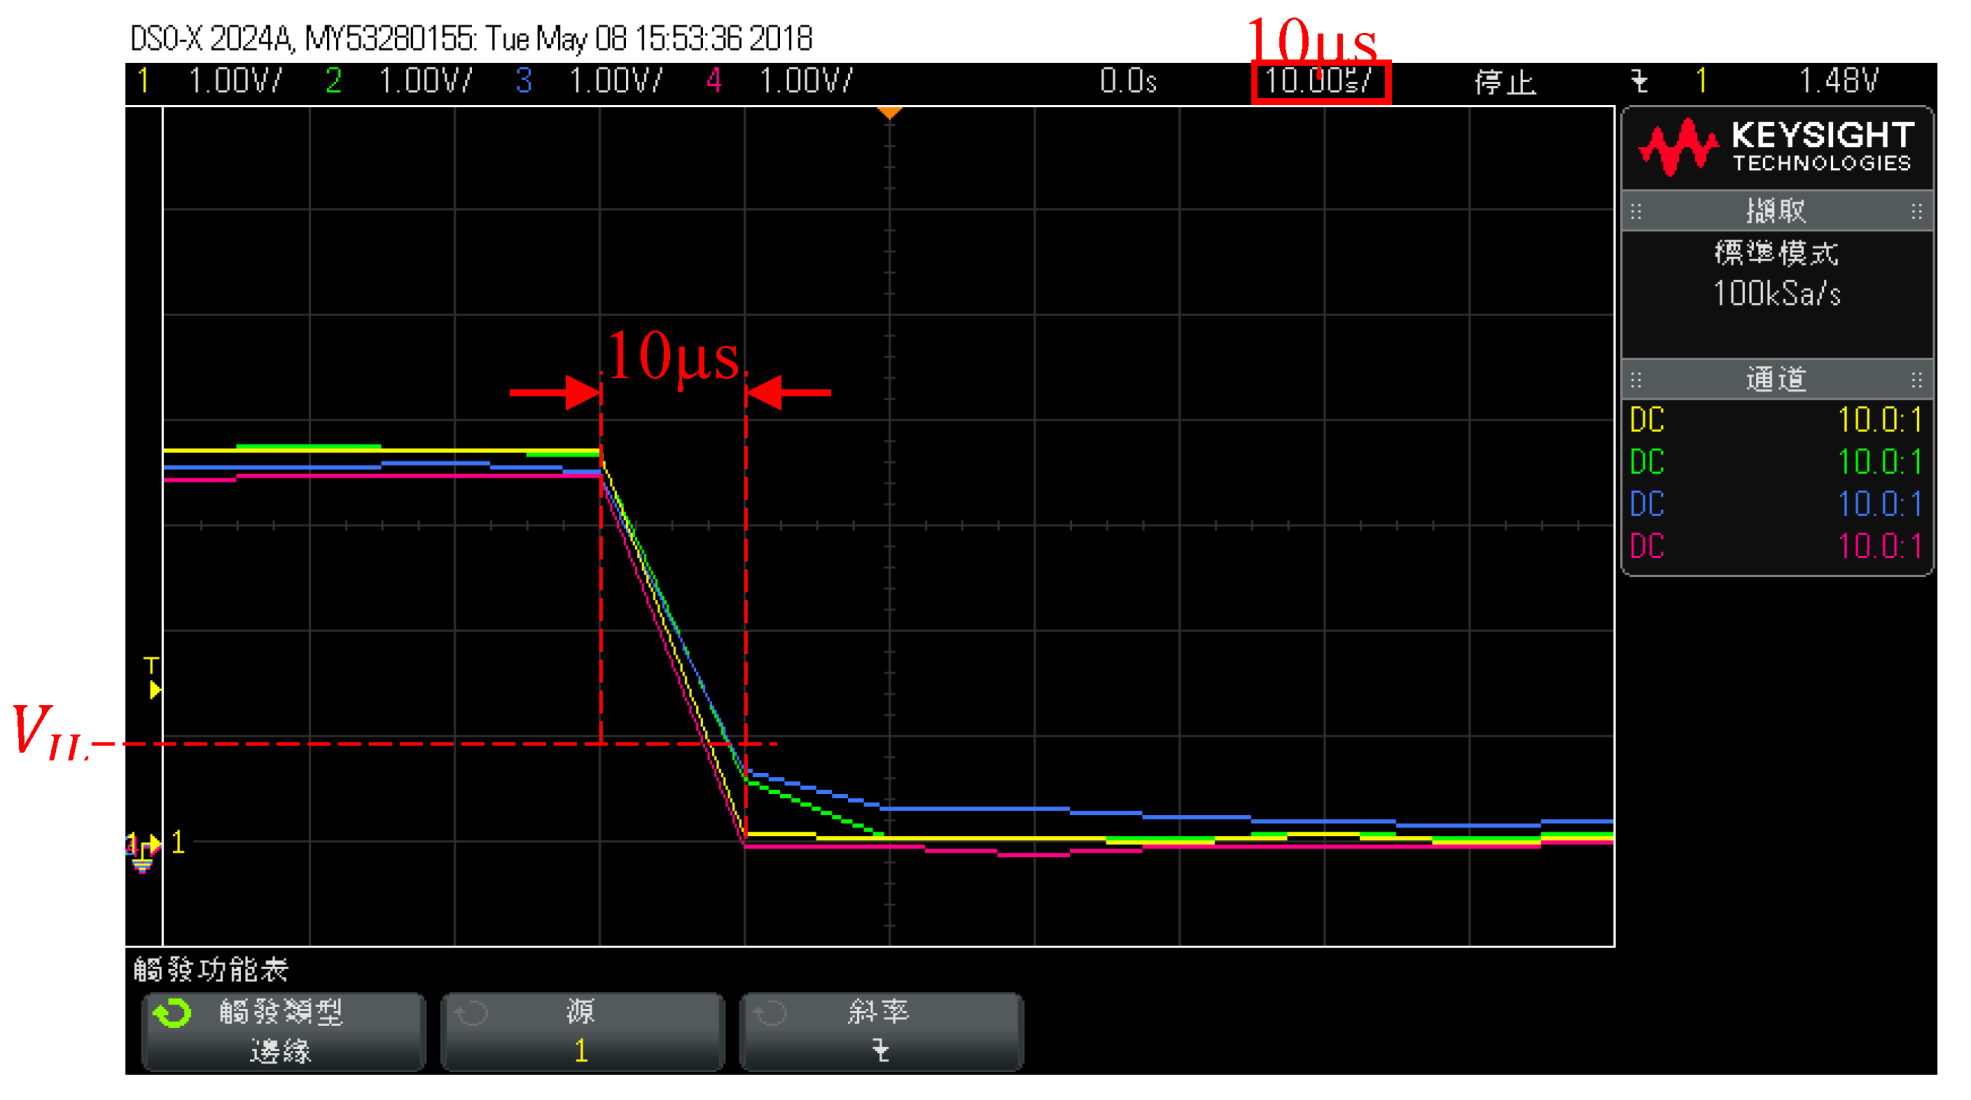
Figure 21.
The time synchronization experiment assisted by PPS (pulse-per-second) of GPS (global positioning system).
Figure 21.
The time synchronization experiment assisted by PPS (pulse-per-second) of GPS (global positioning system).
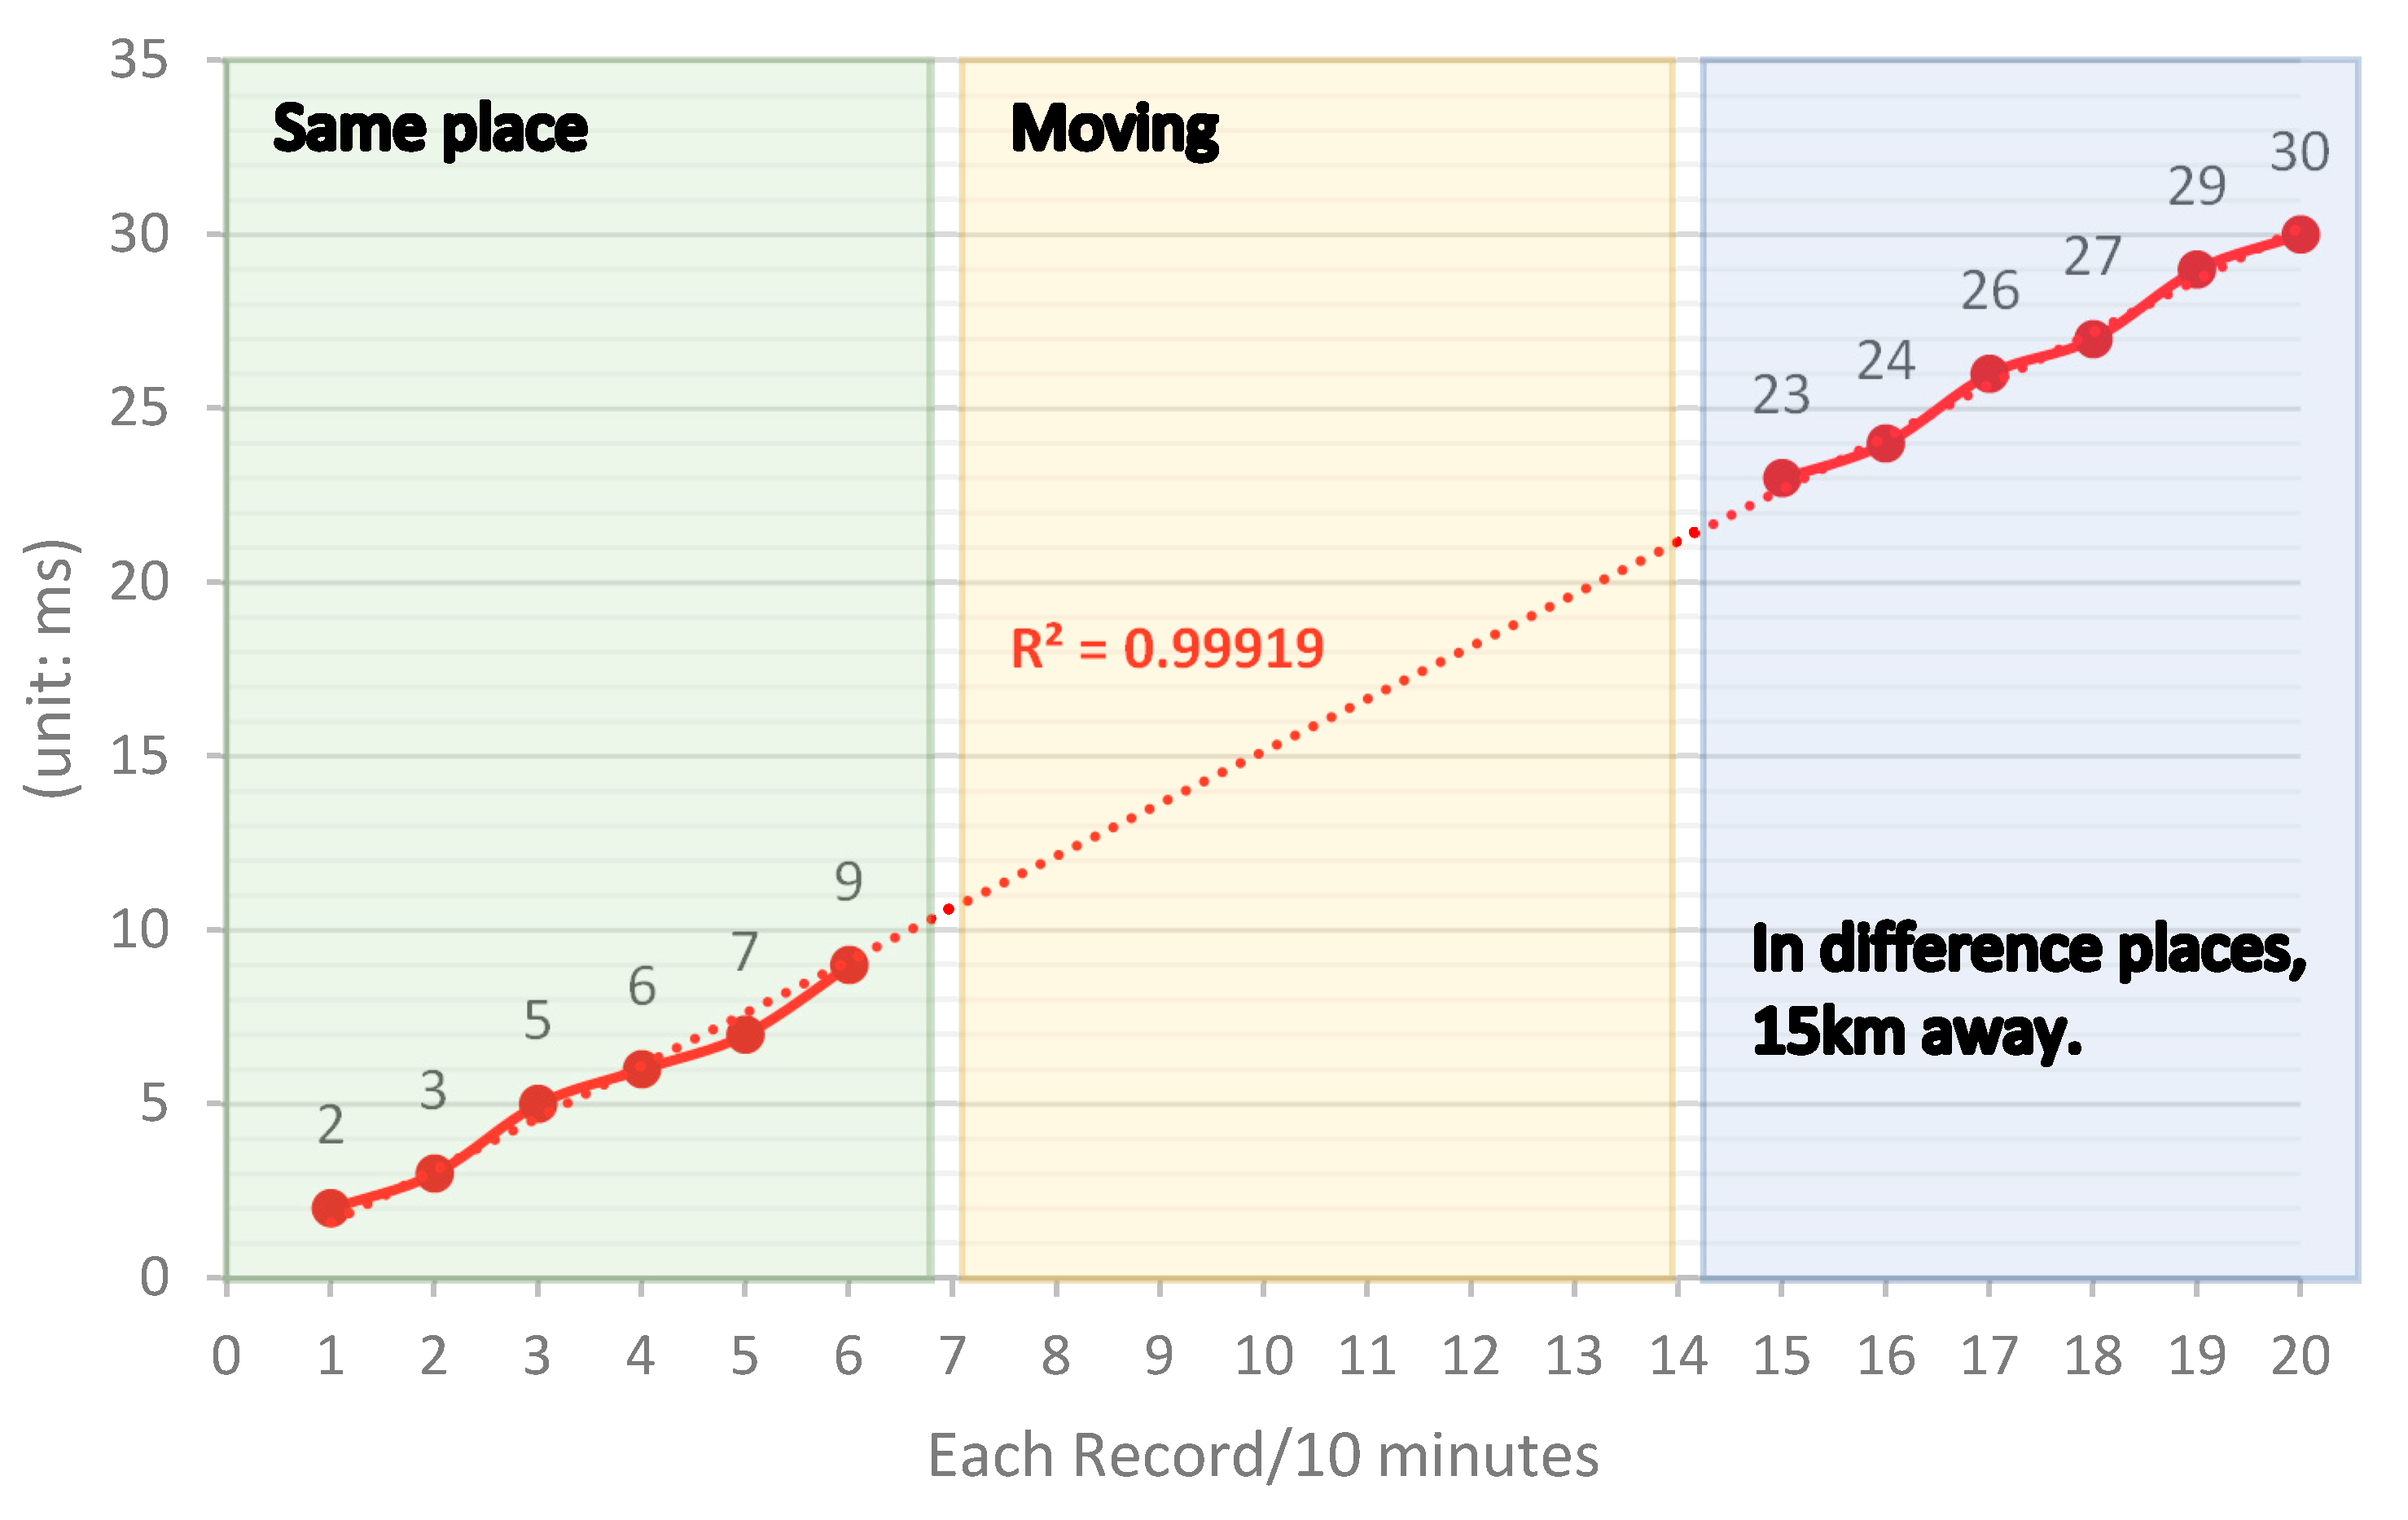
Figure 22.
The time synchronization experiment with a distance of 15 km.
Figure 22.
The time synchronization experiment with a distance of 15 km.
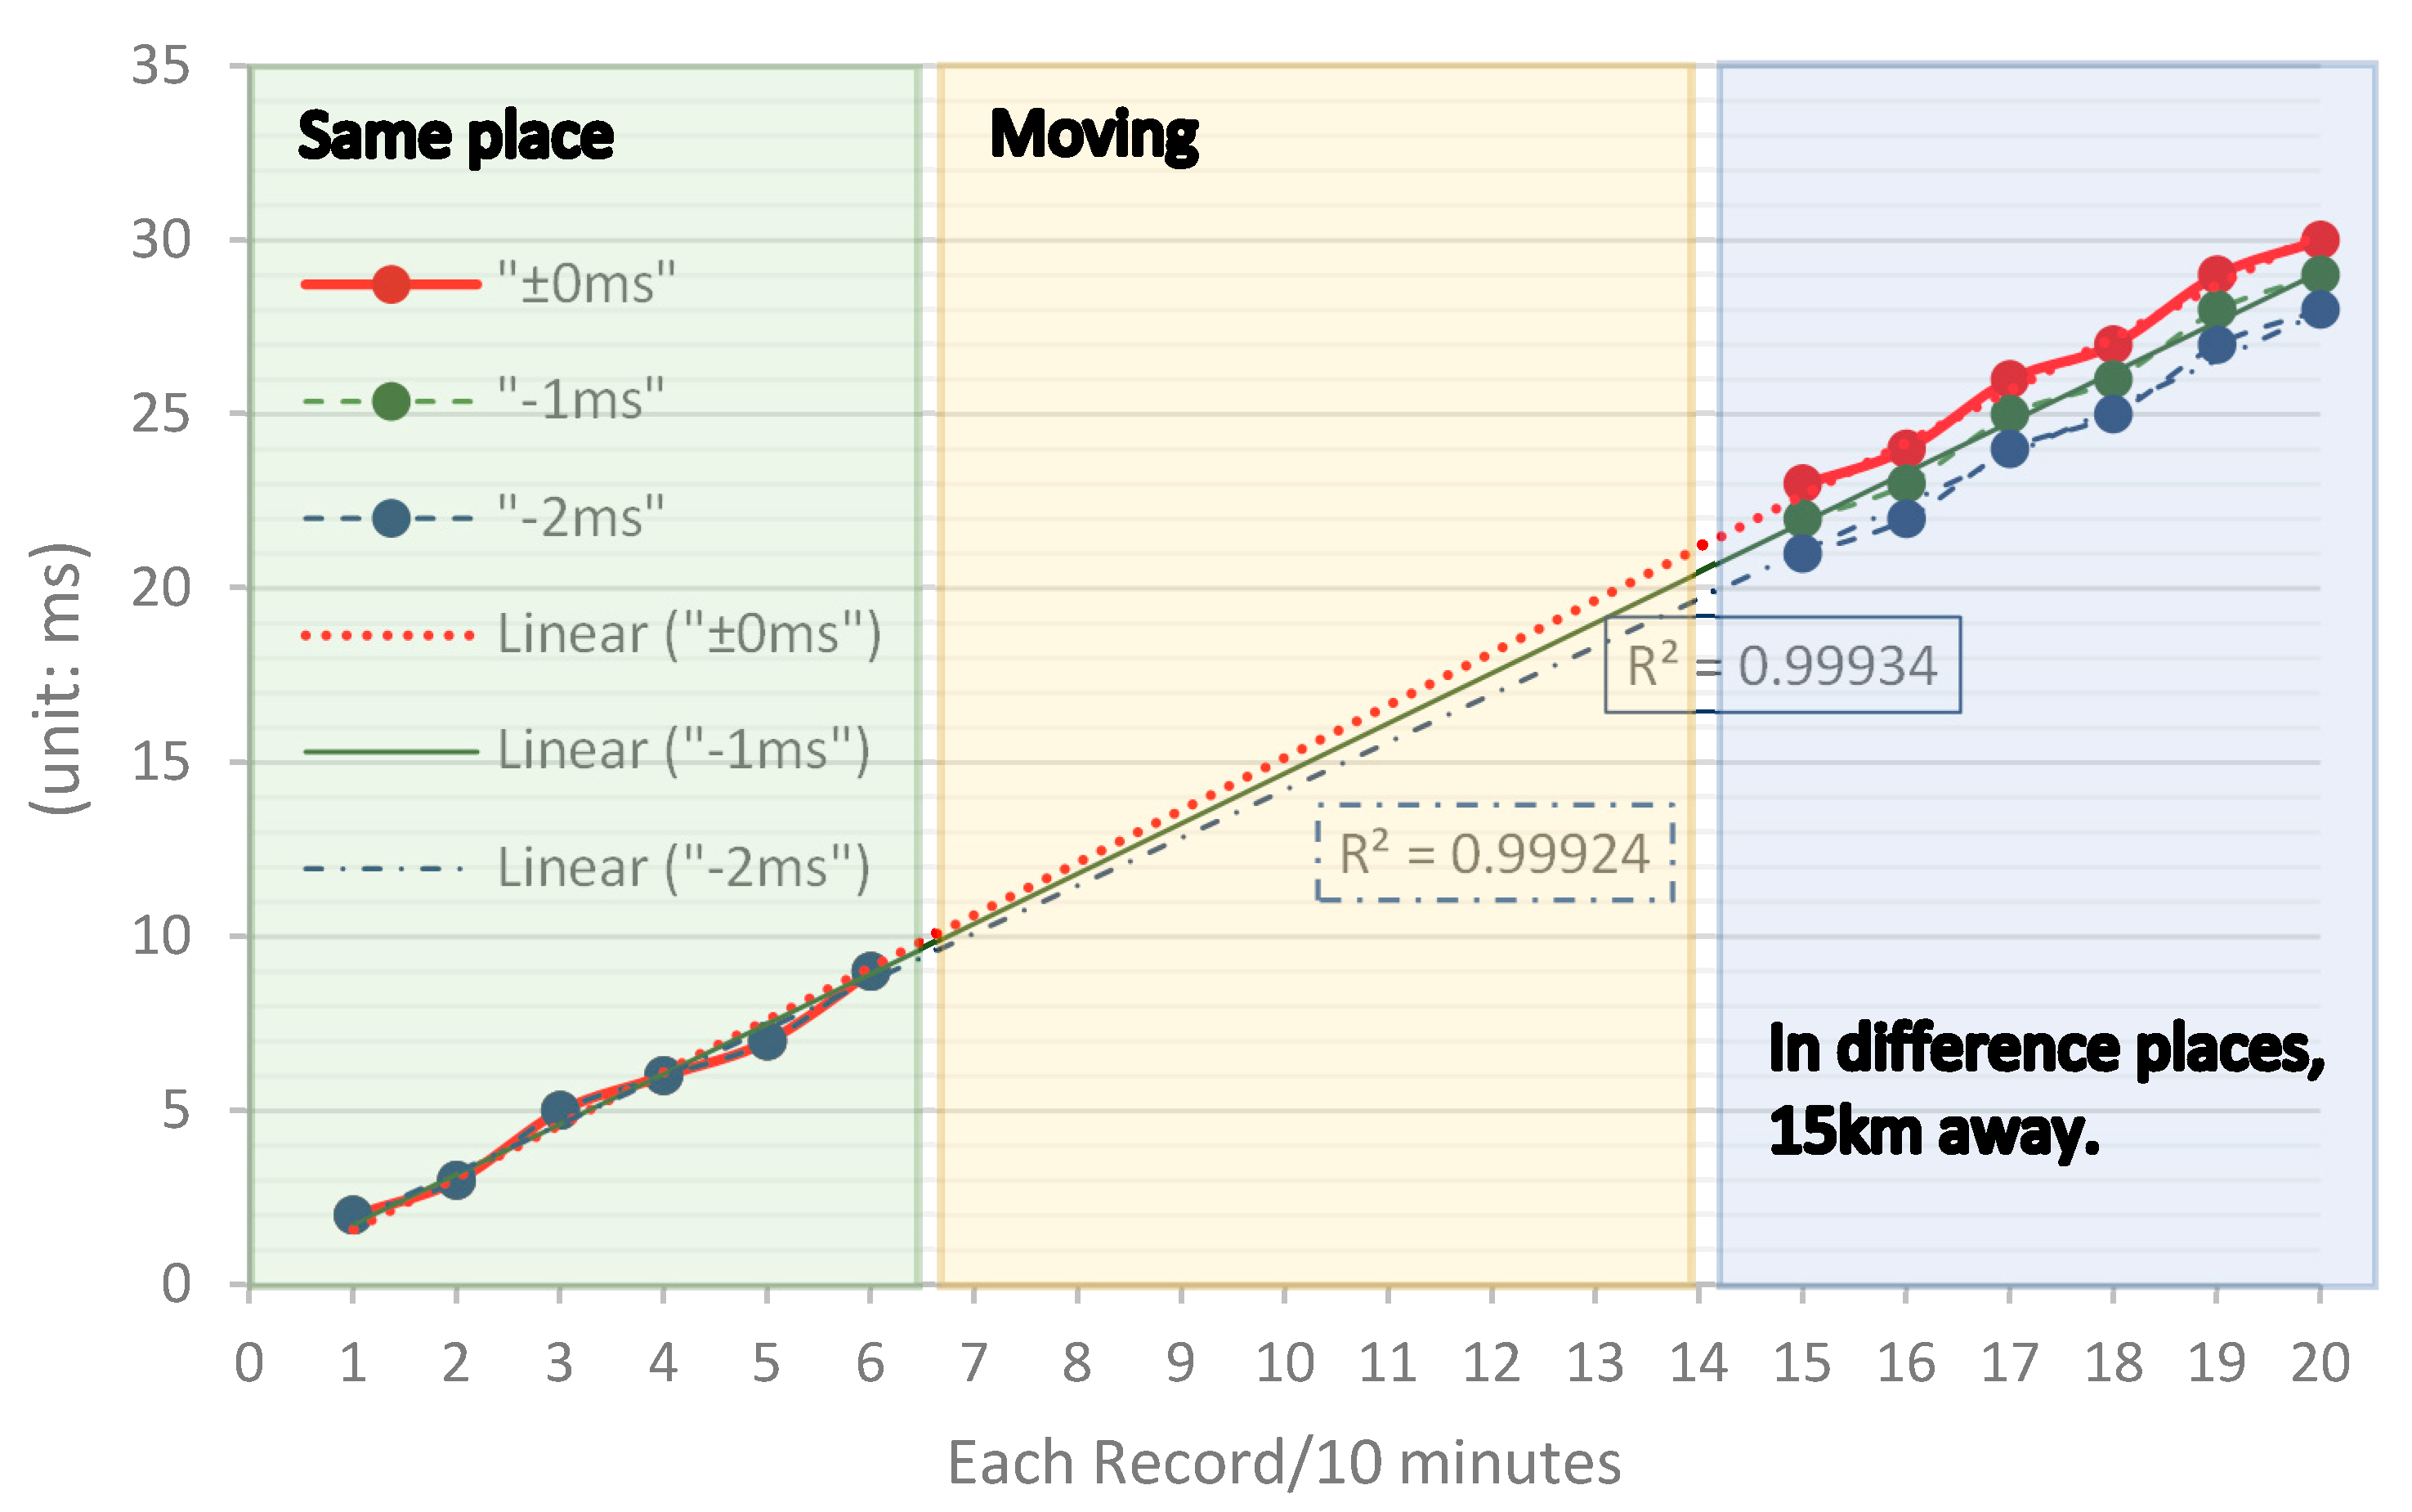
Figure 23.
Comparison of synchronized experiments with −1 ms and −2 ms corrections.
Figure 23.
Comparison of synchronized experiments with −1 ms and −2 ms corrections.
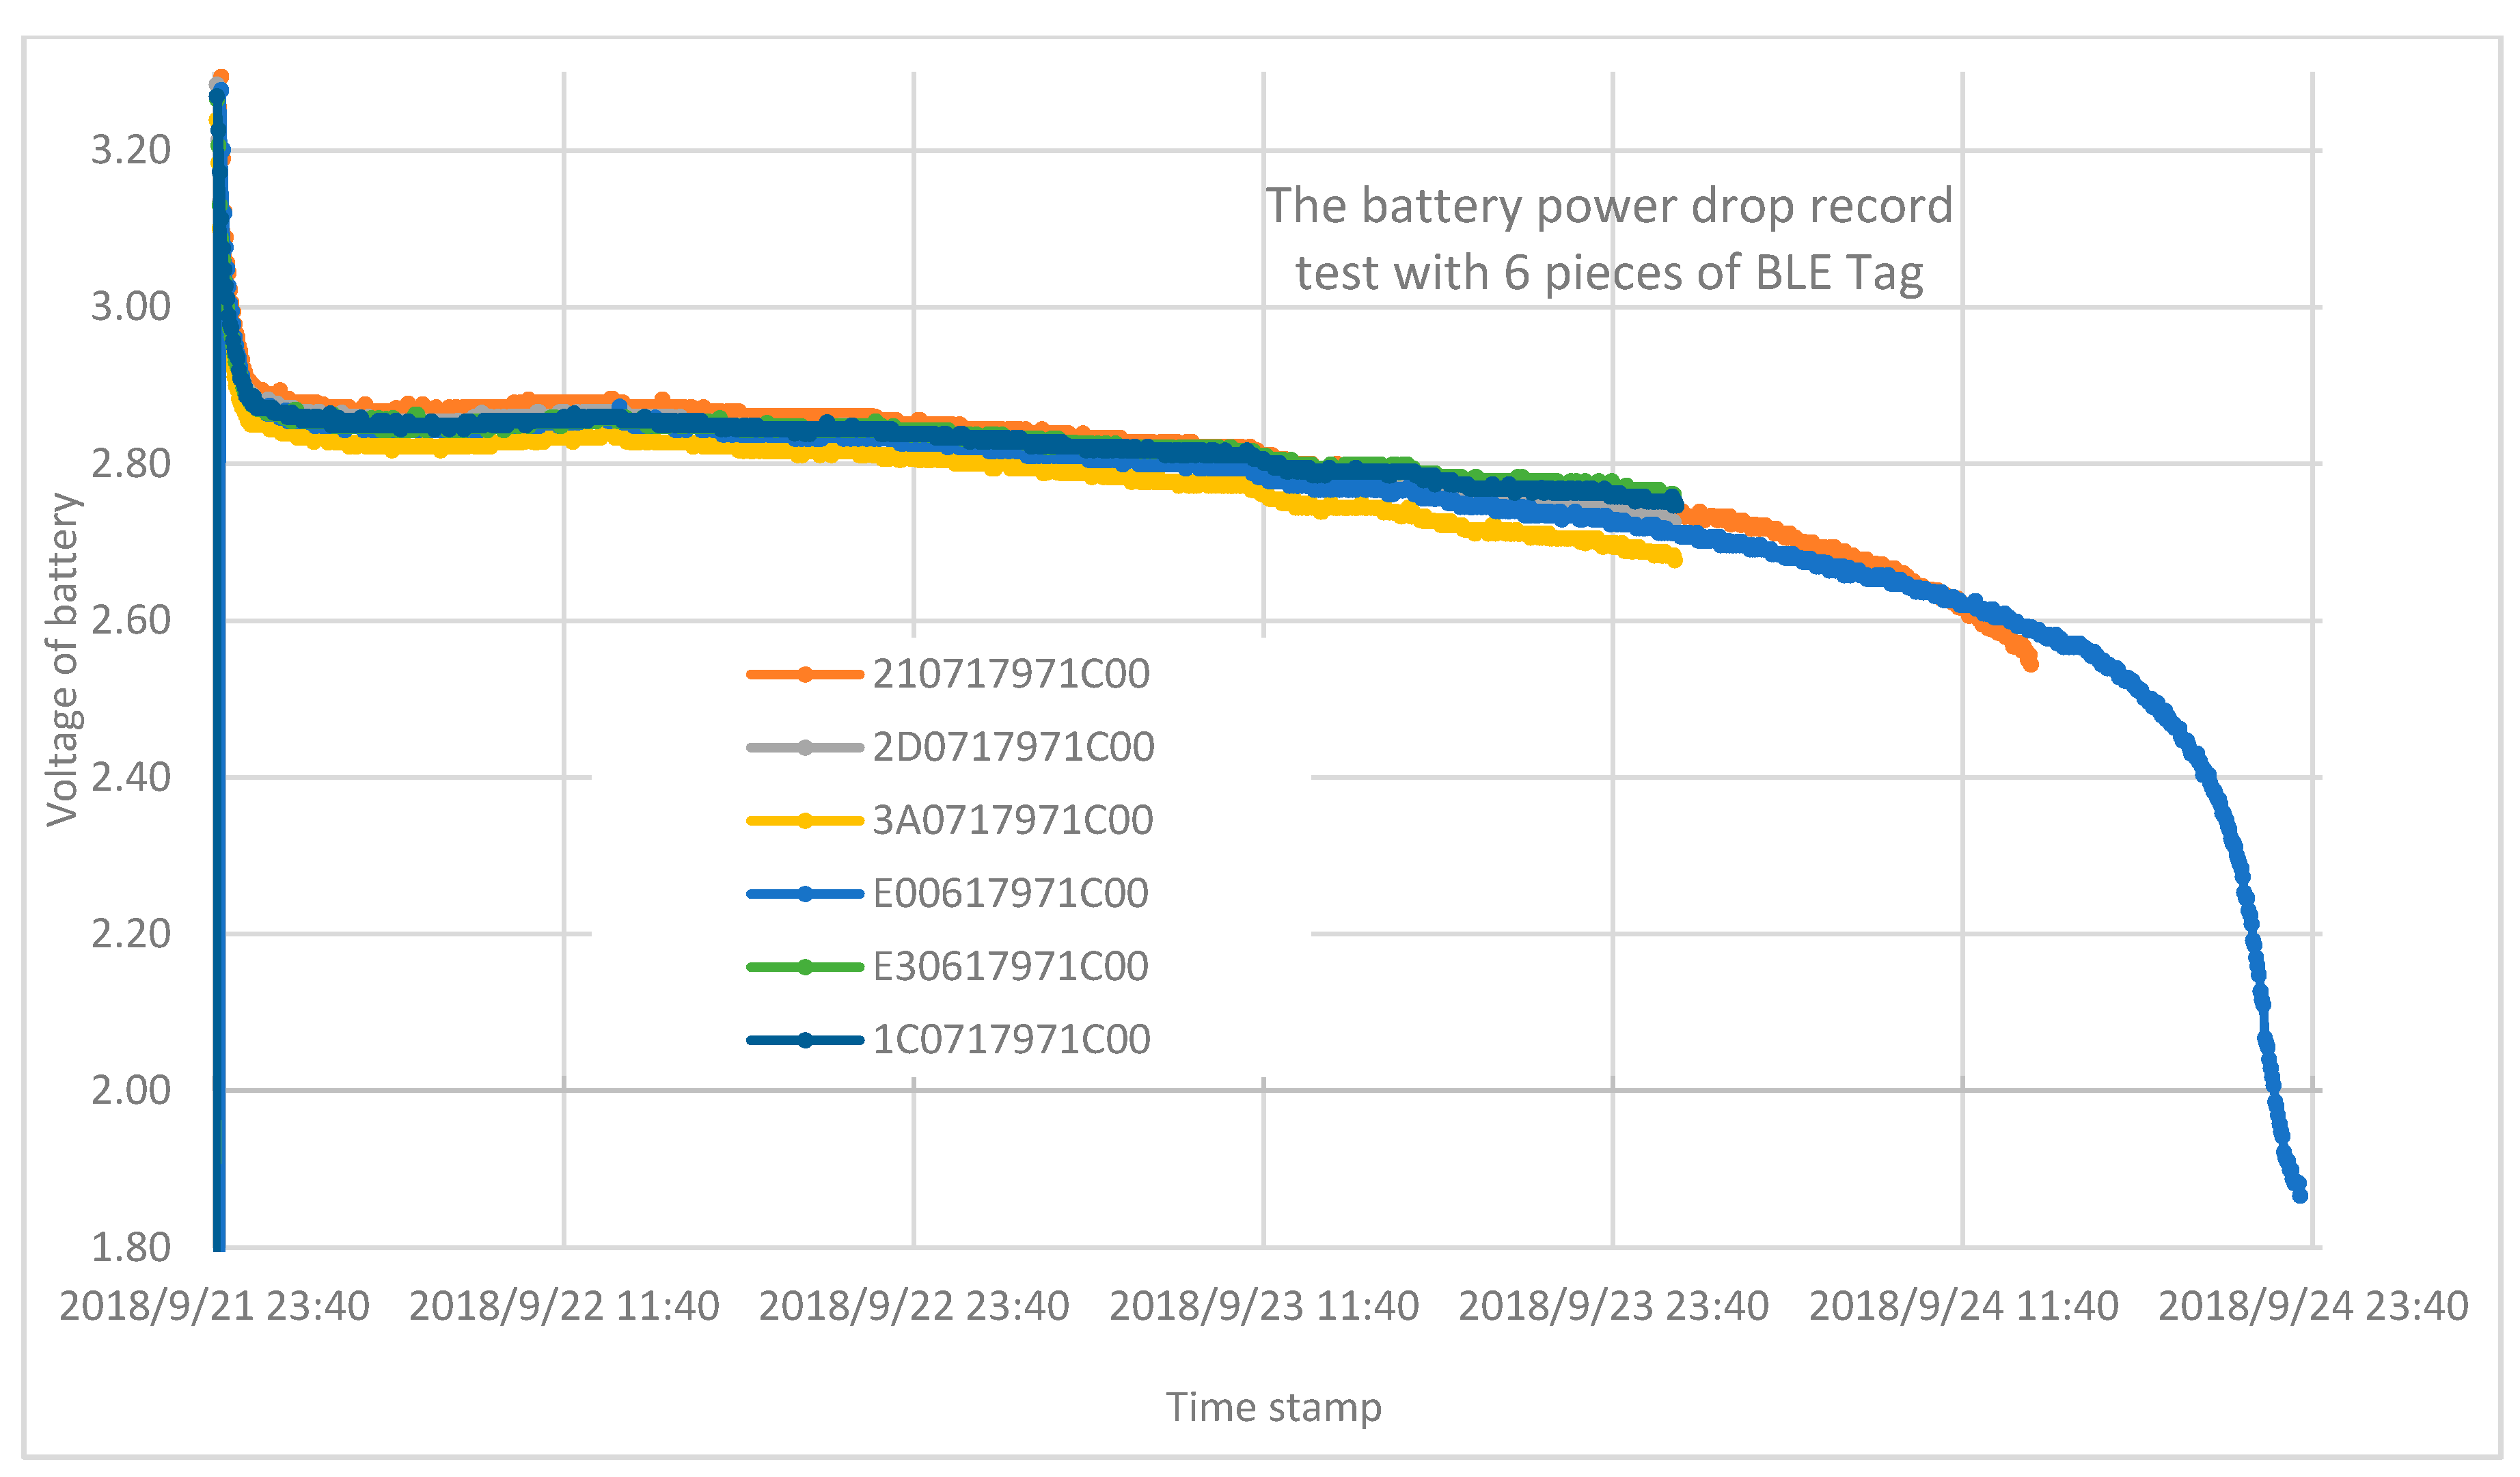
Figure 24.
Six BLE Tags working time experiment recorded using six CR2032 batteries.
Figure 24.
Six BLE Tags working time experiment recorded using six CR2032 batteries.
Table 1.
One dynamic experiment in which the BLE Tag was on the chest.
Table 1.
One dynamic experiment in which the BLE Tag was on the chest.
| Received Data from BLE Receiver | RSSI | Timing (MM:SS.ms) |
|---|
| 001c97168a63930d2cebf32510551 | −93 | 25:10.551 |
| 001c97168a63930f2cebf32510607 | −93 | 25:10.607 |
| 001c97168a6387162cebf32510747 | −87 | 25:10.747 |
| 001c97168a6393192cebf32510800 | −93 | 25:10.800 |
| 001c97168a63931a2cebf32510831 | −93 | 25:10.831 |
| 001c97168a63871c2cebf32510861 | −87 | 25:10.861 |
| 001c97168a6393202cebf32510940 | −93 | 25:10.940 |
| 001c97168a6393222cebf32510995 | −93 | 25:10.995 |
| 001c97168a6387242cebf32511023 | −87 | 25:11.023 |
| 001c97168a6387252cebf32511048 | −87 | 25:11.048 |
| 001c97168a6381272cebf32511097 | −81 | 25:11.097 |
| 001c97168a6387292cebf32511124 | −87 | 25:11.124 |
| 001c97168a63872a2cebf32511154 | −87 | 25:11.154 |
Table 2.
The dynamic experiment when the Tx power of the BLE Tag on the chest is set at Level 3.
Table 2.
The dynamic experiment when the Tx power of the BLE Tag on the chest is set at Level 3.
| On Chest Tx Level 3 | Passing Time (mm:ss.ms) | RSSI Max Time (mm:ss.ms) | Time Difference |
|---|
| Run 1 | 31:06.972 | 31:06.903 | −69 ms |
| Run 2 | 31:50.393 | 31:50.320 | −73 ms |
| Run 3 | 32:38.049 | 32:37.645 | −404 ms |
| Run 4 | 33:00.558 | 33:00.510 | −48 ms |
| Run 5 | 33:23.203 | 33:23.118 | −85 ms |
| Run 6 | 03:11.832 | 03:11.741 | −91 ms |
| Run 7 | 03:40.135 | 03:39.702 | −433 ms |
| Run 8 | 04:03.985 | 04:03.643 | −342 ms |
| Run 9 | 04:23.866 | 04:23.780 | −86 ms |
| Run 10 | 04:46.991 | 04:46.923 | −68 ms |
| Run 11 | 05:07.672 | 05:07.308 | −364 ms |
| Run 12 | 05:32.707 | 05:32.631 | −76 ms |
| Run 13 | 05:56.183 | 05:56.120 | −63 ms |
| Run 14 | 06:15.596 | 06:15.464 | −132 ms |
| Run 15 | 06:34.881 | 06:34.510 | −371 ms |
| Run 16 | 06:52.639 | 06:52.587 | −52 ms |
| Run 17 | 07:11.363 | 07:11.075 | −288 ms |
| Run 18 | 07:30.717 | 07:30.644 | −73 ms |
Table 3.
The dynamic experiment when the Tx power of the BLE Tag on the chest is set at Level 4.
Table 3.
The dynamic experiment when the Tx power of the BLE Tag on the chest is set at Level 4.
| On Chest Tx Level 4 | Passing Time (mm:ss.ms) | RSSI Max Time (mm:ss.ms) | Time Difference |
|---|
| Run 1 | 18:09.802 | 18:09.774 | −28 ms |
| Run 2 | 19:42.485 | 19:42.397 | −88 ms |
| Run 3 | 20:22.244 | 20:22.190 | −54 ms |
| Run 4 | 20:49.133 | 20:49.005 | −128 ms |
| Run 5 | 21:26.809 | 21:26.670 | −139 ms |
| Run 6 | 21:59.378 | 21:59.326 | −52 ms |
| Run 7 | 22:35.270 | 22:35.220 | −50 ms |
| Run 8 | 23:04.321 | 23:04.194 | −127 ms |
| Run 9 | 23:33.283 | 23:33.112 | −171 ms |
| Run 10 | 24:02.906 | 24:02.858 | −48 ms |
| Run 11 | 25:11.154 | 25:11.097 | −57 ms |
| Run 12 | 25:39.325 | 25:39.251 | −74 ms |
| Run 13 | 26:08.478 | 26:08.177 | −301 ms |
| Run 14 | 26:40.792 | 26:40.712 | −80 ms |
| Run 15 | 27:30.097 | 27:30.045 | −52 ms |
| Run 16 | 28:06.836 | 28:06.778 | −58 ms |
| Run 17 | 28:48.745 | 28:48.718 | −27 ms |
| Run 18 | 29:35.930 | 29:35.849 | −81 ms |
Table 4.
The dynamic experiment when the Tx power of the BLE Tag on the chest is set at Level 5.
Table 4.
The dynamic experiment when the Tx power of the BLE Tag on the chest is set at Level 5.
| On Chest Tx Level 5 | Passing Time (mm:ss.ms) | RSSI Max Time (mm:ss.ms) | Time Difference |
|---|
| Run 1 | 07:28.039 | 07:28.066 | 27 ms |
| Run 2 | 09:01.095 | 09:01.014 | −81 ms |
| Run 3 | 00:39.815 | 00:39.759 | −56 ms |
| Run 4 | 01:05.709 | 01:05.794 | 85 ms |
| Run 5 | 01:36.125 | 01:35.985 | −140 ms |
| Run 6 | 01:57.592 | 01:57.300 | −292 ms |
| Run 7 | 02:20.510 | 02:20.325 | −185 ms |
| Run 8 | 02:40.529 | 02:40.504 | −25 ms |
| Run 9 | 03:00.786 | 03:00.671 | −115 ms |
| Run 10 | 03:27.269 | 03:27.217 | −52 ms |
| Run 11 | 03:58.143 | 03:58.090 | −53 ms |
| Run 12 | 04:24.276 | 04:24.224 | −52 ms |
| Run 13 | 04:46.854 | 04:46.717 | −137 ms |
| Run 14 | 05:09.454 | 05:09.349 | −105 ms |
| Run 15 | 05:35.028 | 05:34.941 | −87 ms |
| Run 16 | 05:56.379 | 05:56.141 | −238 ms |
| Run 17 | 06:19.792 | 06:19.738 | −54 ms |
| Run 18 | 06:42.226 | 06:41.998 | −228 ms |
Table 5.
Comparison of different Tx power levels with the BLE Tag on the chest.
Table 5.
Comparison of different Tx power levels with the BLE Tag on the chest.
| Place on Chest | Tx Power Level 3 | Tx Power Level 4 | Tx Power Level 5 |
|---|
| The MAX of Time Difference | −48 | −27 | 85 |
| The MIN of Time Difference | −433 | −301 | −292 |
| Mean, AVERAGE() | −173.22 | −89.72 | −99.33 |
| The Standard Deviation | 140.59 | 64.21 | 91.61 |
Table 6.
One dynamic experiment in which the BLE Tag was on the chest.
Table 6.
One dynamic experiment in which the BLE Tag was on the chest.
| Received Data from BLE Receiver | RSSI | Timing (MM:SS.ms) |
|---|
| 001c97168a6387534febce4242219 | −87 | 42:42.219 |
| 001c97168a6387554febce4242246 | −87 | 42:42.246 |
| 001c97168a63875a4febce4242366 | −87 | 42:42.366 |
| 001c97168a63875c4febce4242393 | −87 | 42:42.393 |
| 001c97168a63875d4febce4242423 | −87 | 42:42.423 |
| 001c97168a63875f4febce4242453 | −87 | 42:42.453 |
| 001c97168a6387604febce4242483 | −87 | 42:42.483 |
| 001c97168a6381624febce4242511 | −81 | 42:42.511 |
| 001c97168a6381634febce4242537 | −81 | 42:42.537 |
| 001c97168a6381644febce4242566 | −81 | 42:42.566 |
| 001c97168a6381674febce4242623 | −81 | 42:42.623 |
| 001c97168a6381694febce4242653 | −81 | 42:42.653 |
| 001c97168a63756a4febce4242680 | −75 | 42:42.680 |
| 001c97168a63756b4febce4242708 | −75 | 42:42.708 |
| 001c97168a63756d4febce4242737 | −75 | 42:42.737 |
| 001c97168a63756e4febce4242763 | −75 | 42:42.763 |
| 001c97168a63756f4febce4242791 | −75 | 42:42.791 |
| 001c97168a6369724febce4242846 | −69 | 42:42.846 |
| 001c97168a6369734febce4242873 | −69 | 42:42.873 |
| 001c97168a6375754febce4242899 | −75 | 42:42.899 |
| 001c97168a6387774febce4242951 | −87 | 42:42.951 |
Table 7.
The dynamic experiment when the Tx power of the BLE Tag on the instep is set at Level 3.
Table 7.
The dynamic experiment when the Tx power of the BLE Tag on the instep is set at Level 3.
| On Instep Tx Level 3 | Passing Time (mm:ss.ms) | RSSI Max Time (mm:ss.ms) | Time Difference |
|---|
| Run 1 | 15:31.843 | 15:31.820 | −23 ms |
| Run 2 | 15:52.057 | 15:51.969 | −88 ms |
| Run 3 | 16:11.305 | 16:11.467 | 162 ms |
| Run 4 | 16:28.681 | 16:28.867 | 186 ms |
| Run 5 | 16:46.907 | 16:47.129 | 222 ms |
| Run 6 | 17:04.336 | 17:04.280 | −56 ms |
| Run 7 | 17:26.137 | 17:26.168 | 31 ms |
| Run 8 | 17:44.774 | 17:44.936 | 162 ms |
| Run 9 | 18:03.881 | 18:04.010 | 129 ms |
| Run 10 | 18:23.226 | 18:23.422 | 196 ms |
| Run 11 | 18:39.643 | 18:39.669 | 26 ms |
| Run 12 | 18:59.678 | 18:59.726 | 48 ms |
| Run 13 | 19:19.453 | 19:19.510 | 57 ms |
| Run 14 | 19:39.730 | 19:39.785 | 55 ms |
| Run 15 | 20:00.773 | 20:00.995 | 222 ms |
| Run 16 | 20:19.660 | 20:19.574 | −86 ms |
| Run 17 | 20:55.295 | 20:55.516 | 221 ms |
| Run 18 | 21:13.274 | 21:13.323 | 49 ms |
Table 8.
The dynamic experiment when the Tx power of the BLE Tag on the instep is set at Level 4.
Table 8.
The dynamic experiment when the Tx power of the BLE Tag on the instep is set at Level 4.
| On Instep Tx Level 4 | Passing Time | RSSI Max Time | Time Difference |
|---|
| Run 1 | 36:34.404 | 36:34.329 | −75 ms |
| Run 2 | 38:06.331 | 38:06.269 | −62 ms |
| Run 3 | 38:49.538 | 38:49.512 | −26 ms |
| Run 4 | 39:22.899 | 39:22.848 | −51 ms |
| Run 5 | 39:52.109 | 39:52.136 | 27 ms |
| Run 6 | 40:22.510 | 40:22.722 | 212 ms |
| Run 7 | 40:51.778 | 40:51.916 | 138 ms |
| Run 8 | 41:20.363 | 41:20.304 | −59 ms |
| Run 9 | 41:43.551 | 41:43.500 | −51 ms |
| Run 10 | 42:08.160 | 42:08.133 | −27 ms |
| Run 11 | 42:42.708 | 42:42.873 | 165 ms |
| Run 12 | 43:10.598 | 43:10.571 | −27 ms |
| Run 13 | 43:37.672 | 43:37.672 | 0 ms |
| Run 14 | 44:02.936 | 44:03.209 | 273 ms |
| Run 15 | 44:26.617 | 44:26.617 | 0 ms |
| Run 16 | 44:49.645 | 44:49.786 | 141 ms |
| Run 17 | 45:11.313 | 45:11.553 | 240 ms |
| Run 18 | 45:37.601 | 45:37.732 | 131 ms |
Table 9.
The dynamic experiment when the Tx power of the BLE Tag on the instep is set at Level 5.
Table 9.
The dynamic experiment when the Tx power of the BLE Tag on the instep is set at Level 5.
| On Instep Tx Level 5 | Passing Time (mm:ss.ms) | RSSI Max Time (mm:ss.ms) | Time Difference |
|---|
| Run 1 | 01:05.524 | 01:05.438 | −86 ms |
| Run 2 | 01:27.805 | 01:27.834 | 29 ms |
| Run 3 | 02:09.519 | 02:09.436 | −83 ms |
| Run 4 | 02:31.878 | 02:32.099 | 221 ms |
| Run 5 | 02:53.801 | 02:53.719 | −82 ms |
| Run 6 | 03:18.043 | 03:18.215 | 172 ms |
| Run 7 | 03:42.669 | 03:42.590 | −79 ms |
| Run 8 | 04:18.299 | 04:18.271 | −28 ms |
| Run 9 | 04:41.760 | 04:41.645 | −115 ms |
| Run 10 | 05:07.616 | 05:07.831 | 215 ms |
| Run 11 | 05:30.455 | 05:30.653 | 198 ms |
| Run 12 | 05:51.998 | 05:52.265 | 267 ms |
| Run 13 | 06:19.755 | 06:19.643 | −112 ms |
| Run 14 | 06:41.323 | 06:41.214 | −109 ms |
| Run 15 | 07:09.707 | 07:09.620 | −87 ms |
| Run 16 | 07:30.167 | 07:30.417 | 250 ms |
| Run 17 | 07:53.473 | 07:53.657 | 184 ms |
| Run 18 | 08:16.632 | 08:16.515 | −117 ms |
Table 10.
Comparison of different Tx power levels with the BLE Tag on the instep. STDEVPA(), calculate function of standard deviation.
Table 10.
Comparison of different Tx power levels with the BLE Tag on the instep. STDEVPA(), calculate function of standard deviation.
| Place on Instep | Tx Power Level 3 | Tx Power Level 4 | Tx Power Level 5 |
|---|
| The MAX of Time Difference | 222 | 273 | 267 |
| The MIN of Time Difference | −88 | −75 | −117 |
| Mean, AVERAGE() | 84.06 | 52.72 | 35.44 |
| The Standard Deviation, STDEVPA() | 103.76 | 113.37 | 148.45 |
Table 11.
The dynamic experiment of three sets of MAT when a BLE Tag is on the runner’s chest.
Table 11.
The dynamic experiment of three sets of MAT when a BLE Tag is on the runner’s chest.
| On Chest Tx Level 4 | MAT-A Time Difference | MAT-B Time Difference | MAT-C Time Difference | AVG. |
|---|
| Run 1 | 31 ms | 49 ms | 113 ms | 64.3 ms |
| Run 2 | 89 ms | 50 ms | 51 ms | 63.3 ms |
| Run 3 | 52 ms | 74 ms | 146 ms | 90.6 ms |
| Run 4 | 52 ms | 28 ms | 25 ms | 35 ms |
| Run 5 | 161 ms | 24 ms | 110 ms | 65 ms |
| Run 6 | 28 ms | 25 ms | 77 ms | 43.3 ms |
| Run 7 | 45 ms | 26 ms | 130 ms | 67 ms |
| Run 8 | 57 ms | 55 ms | 31 ms | 47.6 ms |
| Run 9 | 115 ms | 31 ms | 81 ms | 75.6 ms |
| Run 10 | 55 ms | 56 ms | 25 ms | 45.3 ms |
| MAX | 161 | 74 | 146 | 98.33 |
| MIN | 28 | 24 | 25 | 35.00 |
| AVERAGE | 68.50 | 41.80 | 78.90 | 63.07 |
| STDEVPA | 39.49 | 16.39 | 42.59 | 19.77 |
Table 12.
The dynamic experiment of three sets of MAT when the BLE Tag is on the runner’s instep.
Table 12.
The dynamic experiment of three sets of MAT when the BLE Tag is on the runner’s instep.
| On Instep Tx Level 4 | MAT-A Time Difference | MAT-B Time Difference | MAT-C Time Difference | AVG. |
|---|
| Run 1 | −83 ms | 58 ms | −111 ms | −45.33 ms |
| Run 2 | −73 ms | 30 ms | −111 ms | −51.33 ms |
| Run 3 | −85 ms | 85 ms | −153 ms | −51.00 ms |
| Run 4 | −81 ms | 25 ms | −57 ms | −37.67 ms |
| Run 5 | 88 ms | 29 ms | 31 ms | 49.33 ms |
| Run 6 | 28 ms | −52 ms | 25 ms | 0.33 ms |
| Run 7 | 55 ms | −49 ms | 29 ms | 11.67 ms |
| Run 8 | −31 ms | −81 ms | 30 ms | −27.33 ms |
| Run 9 | −164 ms | −113 ms | −59 ms | −112.00 ms |
| Run 10 | 26 ms | −29 ms | 26 ms | 7.67 ms |
| MAX | 88 | 85 | 31 | 49.33 |
| MIN | −164 | −113 | −153 | −112.00 |
| AVERAGE | −32.00 | −9.70 | −35.00 | −25.57 |
| STDEVPA | 74.73 | 61.07 | 68.22 | 42.54 |
Table 13.
Comparison between one MAT and three sets of MAT.
Table 13.
Comparison between one MAT and three sets of MAT.
| Tx Power Level 4 | 1 MAT Tag on Chest | 1 MAT Tag on Instep | 3 Sets of MAT Tag on Chest | 3 Sets of MAT Tag on Instep |
|---|
| MAX | −27 | 273 | 98.33 | 49.33 |
| MIN | −301 | −75 | 35.00 | −112.00 |
| AVERAGE | −89.61 | 51.28 | 63.07 | −25.57 |
| STDEVPA | 64.21 | 112.05 | 19.77 | 42.54 |
Table 14.
The experiment in which two runners with a BLE Tag on their respective chests ran through three sets of MAT.
Table 14.
The experiment in which two runners with a BLE Tag on their respective chests ran through three sets of MAT.
| On Chest Tx Level 4 | MAT-A Runner-A | MAT-B Runner-A | MAT-C Runner-A | AVG Runner-A | MAT-A Runner-B | MAT-B Runner-B | MAT-C Runner-B | AVG Runner-B |
|---|
| Run 1 | 57 | 26 | 28 | 37.00 | 25 | 132 | 62 | 73.00 |
| Run 2 | 81 | −79 | −168 | −55.33 | 161 | 77 | 133 | 123.67 |
| Run 3 | 77 | 41 | 26 | 48.00 | 72 | 24 | 30 | 42.00 |
| Run 4 | 113 | 100 | 79 | 97.33 | 31 | 68 | 101 | 66.67 |
| Run 5 | 55 | 59 | 27 | 47.00 | 103 | 120 | 57 | 93.33 |
| MAX | 113 | 100 | 79 | 97.33 | 161 | 132 | 133 | 123.67 |
| MIN | 55 | −79 | −168 | −55.33 | 25 | 24 | 30 | 42.00 |
| AVERAGE | 76.60 | 29.40 | −1.60 | 34.80 | 78.40 | 84.20 | 76.60 | 79.73 |
| STDEVPA | 20.95 | 59.59 | 85.61 | 49.72 | 50.13 | 38.74 | 36.18 | 27.40 |
| Total STDEVPA | 46.01 |
Table 15.
The experiment in which two runners with a BLE Tag on their respective insteps ran through three sets of MAT.
Table 15.
The experiment in which two runners with a BLE Tag on their respective insteps ran through three sets of MAT.
| On Instep Tx Level 4 | MAT-A Runner-A | MAT-B Runner-A | MAT-C Runner-A | AVG Runner-A | MAT-A Runner-B | MAT-B Runner-B | MAT-C Runner-B | AVG Runner-B |
|---|
| Run 1 | 54 | −120 | 27 | −13.00 | 105 | −107 | −53 | −18.33 |
| Run 2 | 86 | −174 | 76 | −4.00 | −80 | 57 | −141 | −54.67 |
| Run 3 | 23 | −102 | −54 | −44.33 | 82 | −51 | 29 | 20.00 |
| Run 4 | −81 | 80 | −51 | −17.33 | 88 | −53 | 83 | 39.33 |
| Run 5 | −50 | 25 | −169 | −64.67 | 30 | 24 | −104 | −16.67 |
| MAX | 86 | 80 | 76 | −4.00 | 105 | 57 | 83 | 39.33 |
| MIN | −81 | −174 | −169 | −64.67 | −80 | −107 | −141 | −54.67 |
| AVERAGE | 6.40 | −58.20 | −34.20 | −28.67 | 45.00 | −26.00 | −37.20 | −6.07 |
| STDEVPA | 62.76 | 95.05 | 83.35 | 22.47 | 67.33 | 58.83 | 82.85 | 32.76 |
| Total STDEVPA | 30.28 |
Table 16.
The experiment in which four runners with a BLE Tag on their respective insteps ran through three sets of MAT.
Table 16.
The experiment in which four runners with a BLE Tag on their respective insteps ran through three sets of MAT.
| On Chest Tx Level 4 | MAT-A Runner-A | MAT-B Runner-A | MAT-C Runner-A | AVG Runner-A | MAT-A Runner-B | MAT-B Runner-B | MAT-C Runner-B | AVG Runner-B |
| Run 1 | 88 | 50 | 83 | 73.67 | 63 | 86 | 83 | 77.33 |
| Run 2 | 104 | 85 | 86 | 91.67 | 77 | 139 | 126 | 114.00 |
| Run 3 | 136 | 53 | 52 | 80.33 | 141 | 63 | 51 | 85.00 |
| Run 4 | 124 | 57 | 77 | 86.00 | 86 | 83 | 52 | 73.67 |
| Run 5 | 85 | 92 | 87 | 88.00 | 59 | 80 | 84 | 74.33 |
| MAX | 136 | 92 | 87 | 91.67 | 141 | 139 | 126 | 114.00 |
| MIN | 85 | 50 | 52 | 73.67 | 59 | 63 | 51 | 73.67 |
| AVERAGE | 107.40 | 67.40 | 77.00 | 83.93 | 85.20 | 90.20 | 79.20 | 84.87 |
| STDEVPA | 19.92 | 17.51 | 12.98 | 6.31 | 29.53 | 25.67 | 27.43 | 15.11 |
| On Chest Tx Level 4 | MAT-A Runner-C | MAT-B Runner-C | MAT-C Runner-C | AVG Runner-C | MAT-A Runner-D | MAT-B Runner-D | MAT-C Runner-D | AVG Runner-D |
| Run 1 | 108 | 81 | 104 | 97.67 | 135 | 57 | 55 | 82.33 |
| Run 2 | 80 | 103 | 63 | 82.00 | 79 | 92 | 59 | 76.67 |
| Run 3 | 84 | 29 | 61 | 58.00 | 26 | 52 | 49 | 42.33 |
| Run 4 | 108 | 62 | 80 | 83.33 | 84 | 57 | 82 | 74.33 |
| Run 5 | 99 | 91 | 92 | 94.00 | 54 | 80 | 85 | 73.00 |
| MAX | 108 | 103 | 104 | 97.67 | 135 | 92 | 85 | 82.33 |
| MIN | 80 | 29 | 61 | 58.00 | 26 | 52 | 49 | 42.33 |
| AVERAGE | 95.80 | 73.20 | 80.00 | 83.00 | 75.60 | 67.60 | 66.00 | 69.73 |
| STDEVPA | 11.81 | 25.86 | 16.55 | 13.87 | 36.16 | 15.60 | 14.67 | 14.07 |
| Total STDEVPA | 14.24 |
Table 17.
The experiment in which four runners with a BLE Tag on their respective chests ran through three sets of MAT.
Table 17.
The experiment in which four runners with a BLE Tag on their respective chests ran through three sets of MAT.
| On Instep Tx Level 4 | MAT-A Runner-A | MAT-B Runner-A | MAT-C Runner-A | AVG Runner-A | MAT-A Runner-B | MAT-B Runner-B | MAT-C Runner-B | AVG Runner-B |
| Run 1 | 81 | −146 | 49 | −5.33 | −55 | 110 | −89 | −11.33 |
| Run 2 | 54 | −87 | 78 | 15.00 | 53 | −161 | 100 | −2.67 |
| Run 3 | 161 | 74 | 89 | 108.00 | 82 | 81 | 69 | 77.33 |
| Run 4 | 30 | −63 | 60 | 9.00 | −132 | 29 | −134 | −79.00 |
| Run 5 | 83 | −94 | 80 | 23.00 | −109 | 84 | −153 | −59.33 |
| MAX | 161 | 74 | 89 | 108.00 | 82 | 110 | 100 | 77.33 |
| MIN | 30 | −146 | 49 | −5.33 | −132 | −161 | −153 | −79.00 |
| AVERAGE | 81.80 | −63.20 | 71.20 | 29.93 | −32.20 | 28.60 | −41.40 | −15.00 |
| STDEVPA | 44.12 | 73.75 | 14.55 | 40.12 | 85.65 | 98.38 | 105.33 | 54.32 |
| On Instep Tx Level 4 | MAT-A Runner-C | MAT-B Runner-C | MAT-C Runner-C | AVG Runner-C | MAT-A Runner-D | MAT-B Runner-D | MAT-C Runner-D | AVG Runner-D |
| Run 1 | 115 | −89 | 85 | 37.00 | 49 | 157 | 79 | 95.00 |
| Run 2 | 115 | 88 | 54 | 85.67 | 137 | 26 | 56 | 73.00 |
| Run 3 | 102 | 56 | 75 | 77.67 | 86 | 102 | 53 | 80.33 |
| Run 4 | −25 | 73 | −81 | −11.00 | −43 | 77 | 87 | 40.33 |
| Run 5 | −31 | 74 | −115 | −24.00 | −56 | 85 | −88 | −19.67 |
| MAX | 115 | 88 | 85 | 85.67 | 137 | 157 | 87 | 95.00 |
| MIN | −31 | −89 | −115 | −24.00 | −56 | 26 | −88 | −19.67 |
| AVERAGE | 55.20 | 40.40 | 3.60 | 33.07 | 34.60 | 89.40 | 37.40 | 53.80 |
| STDEVPA | 68.12 | 65.49 | 84.25 | 44.65 | 74.25 | 42.24 | 64.04 | 40.86 |
| Total STDEVPA | 51.82 |
Table 18.
Comparison of experiments with different numbers of runners, and different configurations of BLE Tags, in which runners ran through one or three sets of MAT.
Table 18.
Comparison of experiments with different numbers of runners, and different configurations of BLE Tags, in which runners ran through one or three sets of MAT.
| BLE Tag | 1 man | 1 man | 1 man | 1 man | 2 men | 2 men | 4 men | 4 men |
Tx Power
Level 4 | 1 MAT
Tag on chest | 1 MAT
Tag on instep | 3 MATs
Tag on chest | 3 MATs
Tag on instep | 3 MATs
Tag on chest | 3 MATs
Tag on instep | 3 MATs
Tag on chest | 3 MATs
Tag on instep |
| MAX | −27 | 273 | 98.33 | 49.33 | 123.67 | 39.33 | 114.00 | 108.00 |
| MIN | −301 | −75 | 35.00 | −112.00 | −55.33 | −64.67 | 42.33 | −79.00 |
| AVERAGE | −89.61 | 51.28 | 63.07 | −25.57 | 57.27 | −17.37 | 80.38 | 25.45 |
| STDEVPA | 64.21 | 112.05 | 19.77 | 42.54 | 46.01 | 30.28 | 14.24 | 51.82 |
| 6 times STDEVPA | ±192.63 | ±336.15 | ±59.31 | ±127.62 | ±138.03 | ±90.84 | ±42.72 | ±155.46 |
Table 19.
The experiment in which 20 BLE Tags passed through three sets of MAT.
Table 19.
The experiment in which 20 BLE Tags passed through three sets of MAT.
| Tag on Chest or at Back | MAT-A | MAT-B | MAT-C | Get Passing Time |
| Run 1 | 20 | 20 | 20 | 20 |
| Run 2 | 20 | 20 | 20 | 20 |
| Run 3 | 20 | 20 | 20 | 20 |
| Run 4 | 20 | 20 | 20 | 20 |
| Run 5 | 20 | 20 | 20 | 20 |
| Run 6 | 20 | 20 | 20 | 20 |
| Tag on Chest or on Instep | MAT-A | MAT-B | MAT-C | Get Passing Time |
| Run 1 | 20 | 20 | 20 | 20 |
| Run 2 | 20 | 20 | 20 | 20 |
| Run 3 | 20 | 20 | 20 | 20 |
| Run 4 | 20 | 20 | 20 | 20 |
| Run 5 | 20 | 20 | 20 | 20 |
| Run 6 | 20 | 20 | 19 | 20 |


