Abstract
With the improvement of computing power in terminal devices and their widespread application in emerging technology fields, ensuring secure access to terminals has become an important challenge in the current network environment. Traditional security authentication and trust evaluation methods have many shortcomings in dealing with dynamic and complex network environments, such as limited ability to respond to new threats and inability to adjust evaluation strategies in real time. In response to these issues, this article proposes a dynamic weighted authentication trust evaluation method driven by multimodal data under zero trust architecture. The method introduces user operation risk values and time coefficients, which can dynamically reflect the behavior changes of users and devices in different times and environments, achieving more flexible and accurate trust evaluation. In order to further improve the accuracy of the evaluation, this article also uses the dynamic entropy weight method to calculate the weights of the evaluation indicators. By coupling with the evaluation values, the terminal access security authentication trust score is obtained, and the current authentication trust level is determined to ensure the overall balance of the trust evaluation results. The experimental results show that compared with traditional evaluation algorithms based on information entropy and collaborative reputation, the average error of the method proposed in this study has been reduced by 87.5% and 75%, respectively. It has significant advantages in dealing with complex network attacks, reducing security vulnerabilities, and improving system adaptability.
1. Introduction
With the continuous improvement of computing power in terminal devices, terminals have gradually shifted from being business carriers to business providers, playing an increasingly important role in emerging technology fields such as computing power networks and distributed collaborative AI [1,2,3]. New technical solutions such as terminal-side computing power networks [4,5] and terminal-cloud collaborative computing paradigms [6,7] have become the focus of industry attention. However, due to the vast number and heterogeneity of terminal devices, the network environment is becoming increasingly complex, and concurrent access from large-scale terminals poses significant challenges in terms of data interaction diversification and security authentication. In addition, cybersecurity threats are constantly evolving, from traditional viruses and Trojans to ransomware and AI attacks [8,9,10,11], with attack methods becoming increasingly covert and complex. To effectively utilize the distributed computing power of terminals, it is urgent to conduct security authentication and trust evaluation for terminal access to prevent risks posed by new types of cyber threats [12,13].
The rise of the zero trust security framework emphasizes the need for rigorous authentication and authorization for every access, abandoning traditional boundary protection and static trust [14,15]. Its core principle is to not trust any entity by default under any circumstances, including internal users and devices, which sets higher requirements for security authentication and trust evaluation of terminal access. Through a multi-layered permission control mechanism, it ensures that only authorized users or devices can access sensitive information or resources, thereby establishing a comprehensive access policy and real-time monitoring mechanism to effectively prevent new types of cyber threats and ensure the security and stability of the system [12,16].
Some researchers have proposed a reputation model based on exponential distribution, which conducts comprehensive evaluation by dynamically updating trust values and introducing indirect trust [17]. However, it still struggles to cope with emerging threats in real-time adjustments. Other research [18] is based on information entropy theory, reducing the risk of data leakage through collaborative reputation among servers and homomorphic encryption. However, it is vulnerable to attack interference during the acquisition and dissemination of reputation information, leading to security risks. Some researchers [19] have utilized sketch technology to achieve efficient network host trust evaluation. However, the inherent security vulnerabilities of this technology make it susceptible to DoS attacks and data tampering. In addition, there are solutions that combine joint learning and analytic hierarchy processes [20], simplifying the trust evaluation model and achieving personalized customization. However, in the face of real-time changes in network topology, the model may still be exploited by attackers, increasing the risk of sensitive information leakage.
Prior schemes leave three gaps: (i) fixed-weight metrics quickly stale as the terminal is hijacked, (ii) once a node is compromised the static rule-set still grants broad access, and (iii) they only consider limited features, either user behavior or device status aspect. To close these holes, this paper proposes a multidimensional elastic authentication trust evaluation method based on the dynamic entropy weight method (MEA-DEW) under the zero trust architecture. Our MEA-DEW algorithm injects user operation risk, devices’ security status, and time coefficients to re-weight every access in real time, and fuses the fresh weights with entropy-weighted indicators so that a corrupted terminal immediately receives a sharply lower trust score and is quarantined to least-privilege. Thus, even after compromise the attack surface stays minimal and the evaluation adapts to complex, highly dynamic networks. The innovations and contributions of this paper are summarized as follows:
- Introduction of dynamic evaluation indicators: The algorithm incorporates user operational risk values and time coefficients, which can dynamically reflect the behavioral changes of users and devices across different times and environments. This enables more flexible and precise trust evaluation, addressing the shortcomings of traditional methods in the real-time adjustment of evaluation strategies.
- Determining indicator weights using the entropy weight method: The dynamic entropy weight method is employed to calculate the weights of evaluation indicators. This method exhibits strong adaptability, enabling the dynamic adjustment of weights based on the latest data, ensuring that the evaluation system consistently reflects the current security situation. By coupling with the evaluation values, a trust score for terminal access security authentication is derived, guaranteeing the overall balance of the trust evaluation results.
- Improved authentication coefficient calculation method: The calculation method of the authentication coefficient has been improved by introducing edit distance to measure the difference between the input value and the expected value. This enables a more accurate assessment of the degree of input error and allows for adjustments to the authentication strategy accordingly, making the authentication process more precise and flexible. At the same time, the calculation of the authentication coefficient in the case of multiple users is considered, enhancing the practicality of the algorithm. Edit distance is mainly used in fields such as text error correction and DNA sequence alignment (e.g., Levenshtein distance algorithm [21]), and has not yet been deeply integrated into dynamic trust evaluation scenarios. This paper introduces edit distance into dynamic trust evaluation for the first time.
- Establishing a comprehensive indicator system: Based on the zero trust security architecture, a multi-dimensional authentication and trust evaluation indicator system has been established, encompassing user activity, user reliability, device trustworthiness, and other factors. This system comprehensively considers the impact of various factors on the trust level of terminal access, enabling a more comprehensive assessment of the security status of users and devices.
2. System Model
Given the difficulty of implementing dynamic and real-time access control mechanisms, which makes it easier for attackers to obtain sensitive information, the zero trust principle is integrated into practical evaluation methods.By implementing an evaluation method based on the zero trust principle, the system minimizes access permissions, providing access only after successful identity and permission verification, effectively reducing the attack surface and lowering the potential risk of data leakage. This ensures that each terminal must undergo strict identity verification and trust evaluation when attempting to access resources. This paper proposes a MEA-DEW algorithm under the zero trust architecture. The flowchart of the massive terminal access security authentication trust evaluation process is shown in Figure 1.
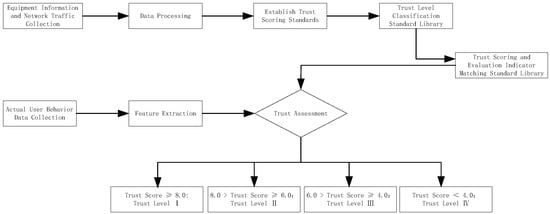
Figure 1.
Flow chart of terminal access security authentication trust assessment.
Following the process outlined in Figure 1, the system initiates the capture and collection of terminal access mobile data, encompassing user behavior data, device information, network traffic, and more. The data collection process necessitates ensuring data integrity and accuracy to facilitate subsequent trust evaluation. Based on the zero trust principle, the system ensures that all access requests undergo verification and authorization. Subsequently, the system selects quantifiable indicators and assigns corresponding weights based on business scenarios and security policies to reflect the impact of each indicator on the trustworthiness of the terminal. After cleaning, the collected raw data will be matched with the above indicators one by one, and the comprehensive trust score will be calculated based on the weights. According to a preset trust score threshold, the trust score is categorized into different trust levels [22]. When the trust score is ≥8.0, the trust level I is directly outputted. Conversely, if the trust score is further evaluated, when 6.0 ≤ trust score < 8.0, the trust level II is directly outputted; when 4.0 ≤ trust score < 6.0, the trust level III is outputted; and when the trust score < 4.0, the trust level IV is directly outputted. Based on the trust level to which the trust score belongs, the system outputs the corresponding trust evaluation result.
2.1. Secure Authentication Access Process
In scenarios where dynamic and real-time access control mechanisms are difficult to implement, simulating the access security authentication process provides an experimental environment. This allows for the optimization and adjustment of access control mechanisms under different attack scenarios and threat patterns. Such simulation helps identify vulnerabilities and weaknesses in the system, including considerations for malicious behavior, insider threats, and external attacks.
In actual terminal access security authentication, the process includes verifying data such as username, password, and dynamic tokens submitted by users requesting access to computing terminals. To prevent brute-force attacks, a strategy limiting the number of attempts is introduced. For each computing terminal, the system records the number of consecutive incorrect inputs. Once a predefined threshold is reached, the system automatically triggers a lockout or access restriction mechanism. Specifically, when the number of consecutive incorrect attempts exceeds the set limit, the terminal is temporarily locked or restricted.
In order to adapt to the flexibility of different security requirements, the calculation method of the authentication coefficient has been improved by introducing edit distance to measure the difference between input value and expected value. This method is suitable for scenarios that allow for certain errors, such as when the username or password is entered incorrectly. Through this approach, it is possible to more accurately assess the degree of input errors and adjust authentication strategies accordingly. The calculation of the authentication coefficient and the quantification of the authentication process are expressed as follows
where represents the authentication coefficient of a certain authentication factor (such as username, password, or dynamic token), is the actual input value (i.e., the string actually typed by the user), is the expected value (the expected reference string stored in the identity repository), is the length of , and represents the editing distance between two strings, that is, the minimum number of editing operations required to convert one string into another (including inserting, deleting, or replacing characters). This formula can effectively measure the difference between the input value and the expected value by calculating the edit distance between them and normalizing it with the length of the expected value. When the input perfectly matches the expected value, the edit distance is 0 and the authentication coefficient reaches its maximum value of 1. As the degree of mismatch increases, the authentication coefficient gradually decreases.
This method not only provides a way to quantify input errors, but also adapts to inputs of different lengths and contents, making the authentication process more accurate and flexible. Based on this, the comprehensive authentication score is calculated as
where is the estimate of that probability that quantifies Trust for access decisions, and the authentication coefficients for the username, password, and dynamic token are denoted as , and are the corresponding weight coefficients for each factor. The final comprehensive score S is obtained through a summation function, ensuring that the sum of the weights equals 1, so that the final score falls within a comparable range. If the expected value is a long and complex username, and the attacker randomly guesses a string of the same length, the denominator may be large. Thus, even if the similarity is low, the authentication coefficient could still be relatively high. Additionally, when the input value is longer than the expected value, extra characters can be penalized to ensure that even if the lengths match, the authentication coefficient will be low if the content does not match.
This formula calculates scores by weighting the authentication coefficients of different authentication factors, reflecting the importance of different authentication elements and their impact on security. In order to meet different security requirements, the allocation of weights can be adjusted according to the actual situation.
The above method calculates the authentication coefficient for each authentication factor based on the difference between the actual input and the expected value, and further calculates the comprehensive authentication score. This method not only provides a way to quantify input errors, but also adjusts the authentication process based on inputs of different lengths and contents, making it more accurate and flexible.
Before the process begins, a threshold is defined based on security policies and risk assessment. By default, , simplifying the decision logic: if , the request is considered legitimate; otherwise, it is rejected.
However, a single static threshold value may not be suitable for all scenarios, especially in environments with constantly changing security threats. Therefore, adjusting threshold values based on specific security policies and risk assessments is a key step in improving system adaptability and resilience. The threshold value can be adjusted according to the following methods.
(1) Risk assessment and threshold adjustment: Based on the security risk level faced by the system, the threshold value can be adjusted higher or lower. For example, in high-risk environments, it may be necessary to adjust the threshold value to 0.7 or higher to enhance security.
(2) Historical data analysis: Analyze past authentication attempts and results to identify reasonable threshold values. For example, by analyzing the proportion of incorrect access and the frequency of security vulnerabilities, threshold values can be effectively adjusted to achieve a better balance between security and efficiency.
(3) Dynamic adjustment mechanism: Implement a dynamic adjustment mechanism to adjust the threshold value based on real-time feedback from the system. For example, the system can automatically adjust the threshold value based on the recent authentication success rate and security events to adapt to the current security environment.
These adjustment strategies ensure that the security authentication process is both flexible and effective in addressing various security challenges. By combining attempt limits with the above authentication coefficient formulas, brute-force attacks and other security issues can be effectively mitigated, improving the efficiency and security of the access authentication process.
2.2. Acquisition of Terminal Access Behavior Data
In response to the constantly evolving threats and attack methods in the network environment, malicious behavior of internal users and devices, and the difficulty of dynamic real-time access control mechanisms, massive access behavior data is obtained to help identify normal and abnormal behavior patterns, determine potential risks, warn of possible security threats, and take corresponding measures. For data in the form of web pages, terminal access behavior data can be extracted by web crawlers. However, if the website provides API interfaces and RSS subscription functions, data can also be obtained by calling APIs and subscribing to RSS feeds. For non-web data, if authorized, users can directly access the database to obtain data, or analyze server log files (such as web server logs, database logs, application logs, etc.) and network monitoring tools (such as Wireshark, nmap, etc., [23]) to obtain user access behavior data.
Web crawler technology is a program or script that can automatically browse the web and extract information, especially suitable for collecting structured or unstructured data from web pages. Therefore, taking web crawling technology as an example, we used it to obtain terminal access behavior data. We used the BeautifulSoup tool in Python 3.9 to crawl access behavior data, website traffic, and user behavior data from news websites [24]. By browsing the website and viewing the webpage source code, it was found that the traffic information for each article is stored in a tag with a specific class name. We chose to use Python’s requests library to send HTTP requests and the BeautifulSoup library to parse HTML content. We extracted the traffic data of each article by writing Python scripts.
This technology plays a key role in search engines and is responsible for downloading web pages from the Internet. The result of obtaining behavior data for any terminal access is given by
where x represents the actual behavior data generated by terminal access, that is, various operations and data records generated by users when accessing the Internet or specific applications through terminal devices (such as computers, mobile phones, tablets, etc.), and f, respectively, represent the data and acquisition frequency within a fixed duration. When crawling terminal access behavior data, the concern is the coverage range of the data, especially the time range. For example, crawling user access logs from the past month to analyze user access patterns and behaviors. In this case, specify a time range and write a crawler or script to extract relevant data from this time range.
The records generated by different operations on data access, reading, modification, etc., need to have a unified format for easy identification and processing. A unified format ensures that all records contain necessary information such as operation type, timestamp, terminal identification, operation result, etc. If the data format is inconsistent, it can lead to the loss or error of key information, affecting the accuracy of trust evaluation. Therefore, the collected data should be saved in the specified format to improve the efficiency of data processing and reduce the time for parsing and data normalization. According to the above method, the collection results of terminal access behavior data in the access state can be obtained, and the final collection results of massive terminal access behavior data are as follows.
where represents the behavior data collection result of the i-th terminal, that is, the set of behavior data generated by each terminal within a specific time range is the number of computing power terminals applying for access. To ensure the quality of obtaining historical behavior data from the terminal, it is necessary to normalize the initially collected data. The processing can be quantitatively expressed as
where is the normalized data of each data point in the behavioral dataset; and are the maximum and minimum values of the initial historical behavior data obtained. After normalization, a set of data between 0 and 1 was obtained, which has a unified scale for subsequent analysis and comparison.
Data quality refers to the overall “health status” of data, including multiple aspects such as accuracy, completeness, consistency, timeliness, and interpretability. In the study of terminal access behavior data, high-quality data can more accurately reflect user behavior patterns. The indicators for measuring data quality usually include the following aspects:
- (1)
- The data is accurate and can truly reflect user behavior;
- (2)
- The data is complete and comprehensive, covering all the necessary information;
- (3)
- Consistency is maintained between data without any contradictions or conflicts;
- (4)
- The data record is unique, without duplication or redundancy;
- (5)
- The data conforms to business rules and logic, and is valid.
In order to ensure the quality of data, it is also necessary to filter and validate the data to eliminate outliers, missing data, or data that does not conform to business logic. In security authentication trust assessment, due to difficulties in data acquisition and annotation, only a limited number of samples can often be obtained. In this case, cluster analysis can serve as an effective method to explore the intrinsic structure and patterns of data, even without labels. For this purpose, the Density-Based Spatial Clustering of Applications with Noise (DBSCAN) algorithm is selected [25]. If the number of samples in the neighborhood of a point is less than the specified minimum number of samples, the point is considered as noise (i.e., outlier).
Firstly, preprocessing operations such as cleaning, feature selection, and feature scaling are performed on the raw data. In the DBSCAN algorithm, the neighborhood of each data point is first calculated. If the number of samples in the neighborhood is less than the preset minimum number, the point is marked as noise or an outlier. Otherwise, the point is considered as the core point or other points in its neighborhood are classified as the same cluster, achieving data quality evaluation and ensuring the accuracy and reliability of the data.
Repeat the above steps, including data crawling, normalization, filtering, and validation, to obtain access behavior data that meets quality requirements.
3. Design of Security Authentication Trust Assessment Algorithm
This section constructs a trust evaluation system under a zero trust architecture and presents the implementation process of the proposed MEA-DEW algorithm under dynamic weight calculation.
3.1. Authentication Trust Assessment System
Utilizing the massive amount of terminal access behavior data obtained, an authentication and trust evaluation index system is constructed to effectively reduce the possibility of attackers obtaining sensitive information. By simulating the security authentication process of massive computing power terminal access, it can be concluded that the influencing factors of authentication trust include user historical behavior habits, device credibility, application credibility, etc. Figure 2 shows the zero trust network architecture and authentication trust evaluation index system.
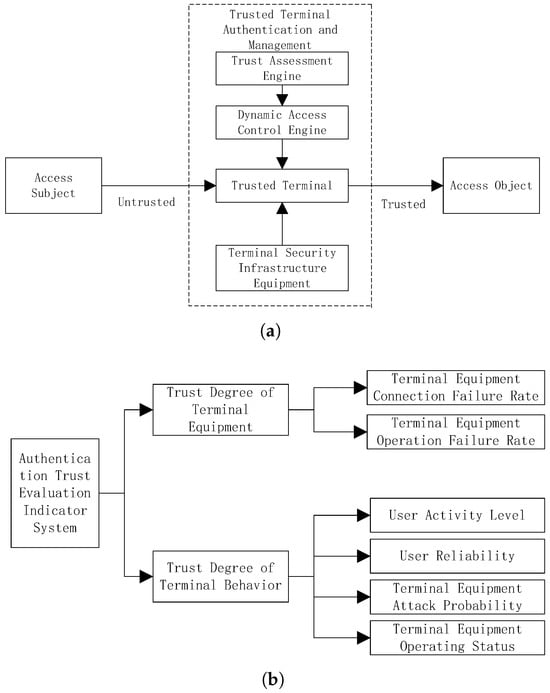
Figure 2.
Zero trust network architecture and trust evaluation indicator system structure. (a) Zero trust security architecture. (b) Authentication trust evaluation indicator system.
From Figure 2a, it can be seen that the zero trust security architecture can be divided into three main levels: access subject, trusted terminal authentication management, and access object. These three levels together form the core framework of the zero trust security architecture. In the process of constructing the zero trust security evaluation system shown in Figure 2b, various evaluation indicators were defined in detail, including terminal device connection failure rate and operation failure rate, user activity and reliability, and terminal device attack probability and operation status.
(1) The failure rate is a key indicator for measuring the stability of terminal equipment. Record the number of failures and total operating time of the equipment during operation. By dividing the number of failures by the total operating time, a ratio representing the number of failures per hour of equipment operation is obtained, known as the failure rate. The higher the failure rate, the worse the stability of the equipment.
(2) Attack probability is an important indicator used to measure the risk of a device being attacked by a network. A security vulnerability is a weak point in a device that may be exploited by attackers. Take into account multiple factors, including device security vulnerabilities, attack surface size, and historical attack data. Conduct regular security scans and vulnerability assessments on devices to identify potential security vulnerabilities.
(3) User activity is an important indicator for measuring user engagement and frequency of use. User activity indicators include login frequency, access duration, number of operations, etc. Calculate the average daily login frequency, average visit duration, and average operation frequency of users to evaluate their daily activity level.
(4) User reliability includes user behavior patterns, historical records, security verification results, etc. Identify user behavior patterns by analyzing data such as login time, access path, and operation frequency.
Access subject refers to any user or device attempting to access secure resources (i.e., access objects). Trusted terminal authentication management is responsible for authenticating the identity of the access subject and determining whether they have the authority to access specific resources, involving trust evaluation engines and dynamic access control engines to ensure the authenticity and trustworthiness of the access subject’s identity.
Under the principle of zero trust, we can construct an evaluation index system that includes user activity, user reliability, and device credibility. The user activity index is calculated as
where and , respectively, represent the user’s online time and the actual running time of accessing the platform. Among them, the user’s online time refers to the time difference between the user’s login to the page and the end of closing the browser. During this process, users may perform various operations such as browsing web pages, watching videos, conducting transactions, etc. In order to track user online time, the website saves the timestamp of the user’s login to the page and the timestamp of leaving the website through COOKIEs, and then subtracts these two timestamps to obtain the user’s online time. The actual running time of the access platform refers to the time period that the platform has experienced from startup to the present, including the active time period of users and the “idle” time period when no one is using it.
The threats and attack methods in the network environment are constantly changing, and traditional static security strategies cannot effectively respond. By calculating the user’s operational risk value, it is possible to dynamically adjust security policies and respond promptly to emerging threats. By combining user run risk values and time coefficients, more refined access control can be achieved. For example, for users who exhibit high risk values during sensitive time periods (such as system maintenance windows), stricter access control measures can be implemented. The risk value of user operation F and the time coefficient of user operation are given by
where , represents the weight of the -th risk factor; represents the quantitative value of the -th risk factor; represents the total number of risk factors; represents the user’s online time during the -th time period; represents the weight of the -th time period; represents the total number of time periods.
The risk value of user operation reflects the level of risk that user behavior may bring in the network, while the time coefficient of user operation considers the temporal characteristics of user activities. By combining these parameters, the security system can achieve more refined and dynamic trust assessment, thereby more effectively identifying potential security threats, adjusting access control policies in a timely manner, and improving overall security protection capabilities. The user reliability and device reliability indicators are given by
where and correspond to zero trust architecture coefficients and device user characteristic coefficients.
By setting different trust levels, the security status of users and devices can be more finely divided. The evaluation indicators include terminal device trust (such as connection failure rate and operation failure rate) and terminal behavior trust (user activity, user reliability, etc.). Firstly, assign a weight to each evaluation indicator (such as connection failure rate, operational failure rate, user activity, user reliability, etc.) that reflects the importance of each indicator in the overall evaluation. Multiply the score of each indicator by its weight, and then sum it up to obtain a comprehensive score as
where is the weight of the q-th indicator; is the score of the q-th indicator; Q is the total number of evaluation indicators; represents the authentication parameter; represents authorization parameters; represents the memory coefficient; o represents the adaptive coefficient. Among them, the memory coefficient reflects the system’s “memory” of the user or device’s historical behavior and is used to adjust the current trust evaluation. If the user has been reliable in the past, even if their current behavior is abnormal, the system may still give a high level of trust due to the memory coefficient, avoiding the evaluation of drastic changes caused by a single event and providing stability. The adaptive coefficient determines the system’s response speed to new information. A high value makes the system sensitive and quickly adjusts trust, while a low value conservatively responds slowly, helping the system to adapt to new threats and changes in a timely manner while maintaining stability. These two coefficients are both parameters used to adjust the evaluation results, and their effects are complementary. The memory coefficient ensures that the evaluation results have a certain historical stability, while the adaptive coefficient allows the system to respond quickly to new information. By combining these two coefficients, a trust evaluation model that considers both historical behavior and adapts to new changes can be obtained.
Based on the comprehensive score, a series of thresholds are set to divide the score range into intervals corresponding to the trust level. Assign corresponding trust levels based on the range of comprehensive scores:
Trust Level I: These users or devices perform well in evaluation metrics, have high security and credibility, and can enjoy all services and permissions provided by the system without additional security verification.
Trust Level II: These users or devices perform average on evaluation metrics and require further verification and observation. Regular security verifications such as captcha and SMS verification are required to access certain services or permissions.
Trust Level III: These users or devices perform poorly on evaluation metrics and may pose security risks. More stringent security verification is required, such as multi-factor authentication, manual auditing, etc., to access the system or service. Meanwhile, their access permissions and services will be restricted.
Trust Level IV: These users or devices perform extremely poorly on evaluation metrics, pose serious security risks, and will be denied access by the system.
Through the construction of this series of indicator systems, the security status of users and devices under zero trust architecture can be evaluated, providing strong support for the development of effective security policies.
3.2. Calculation of the Weight of Trust Evaluation Indicators
Due to the continuous evolution of attack methods in the network environment and the existence of malicious behavior among internal users and devices, the importance of evaluation indicators is constantly changing. The entropy weight method has strong adaptability and can dynamically adjust weights based on the latest data, ensuring that the evaluation system always reflects the current security situation and addressing the challenges of difficult dynamic access control. Therefore, the entropy weight method is used to calculate the weight values of all evaluation indicators in the massive terminal access security authentication trust evaluation system. Entropy is usually used to quantify the uncertainty or information content of indicators. The higher the entropy, the greater the amount of information contained in the indicator, and the greater its impact on the evaluation results. At the same time, the entropy weight method also has the characteristic of strong adaptability, which can adjust the weights according to the actual situation. The entropy value of the i-th indicator is calculated as follows.
where is the standardized value of the i-th indicator on the j-th sample; n is the number of samples; k is a constant. The calculation result of the weight of any trust evaluation index is as follows.
where represents the number of trust evaluation indicators set.
Equation (10) calculates the entropy value of the evaluation index, which reflects the degree of difference and information content of the index between different samples. Based on these entropy values, the weights of each indicator are further determined through Equation (11), and the weight size represents the importance of the indicator in the evaluation system. According to the above operation, the weight value calculation results of all indicators in the construction of a massive terminal access security authentication trust evaluation index system can be obtained.
3.3. Implementation of Security Authentication and Trust Assessment
In dynamic and real-time access control, authentication trust scores are dynamically adjusted based on weighted evaluation indices. This reflects system security in real-time, enabling agile adaptive decisions and enhancing defense against sensitive data breaches. The trust score is calculated by coupling evaluation indicators with their weight results, as follows.
where represents the credibility index value of the i-th indicator. Among them, six indicators are connection failure rate, operation failure rate, user activity, user reliability, terminal device attack probability, and terminal device operation probability. The sum of the weights of each indicator is set to 1.
By substituting the calculation results of indicators and weights into Equation (12), the calculation result of the terminal access security authentication trust score can be obtained. Match the calculation result of Equation (12) with the set level evaluation criteria to determine the evaluation result of the current massive terminal access security authentication trust level.
4. Simulation Results
In order to test the evaluation accuracy and application performance of the MEA-DEW algorithm proposed in this paper, relevant empirical analysis experiments were designed. By calculating relevant indicators, the performance test results of the MEA-DEW algorithm are obtained, and the advantages of the MEA-DEW algorithm in evaluating accuracy and application performance are reflected.
4.1. Experimental Preparation
The experimental setup consists of three key components: terminal devices, an access platform, and an optimized operation environment. There are 500 terminal devices, divided into mobile phones (200), fixed computers (150), and mobile computers (150). The mobile phones run Android (versions 9.0 to 12.0) and iOS (versions 14 to 16), with a mix of 4G/5G and Wi-Fi connections. The fixed computers run Windows and Linux, connected via wired or Wi-Fi, while mobile computers mainly use Wi-Fi. The devices are divided into normal and abnormal groups to simulate real-world security challenges.
The access platform relies on a MySQL 8.0 database that supports high availability and scalability for large-scale concurrent access. The database is hosted on a powerful system with dual Intel Xeon processors, 256 GB of memory, and 4TB of NVMe SSD storage. The network connects 200 fixed nodes in a star topology, with the core node hosting the database. The system ensures high-speed data transmission with 50 GB of bandwidth and 200 MB/s transfer speed.
To maintain secure and efficient communication, Nagios is used for real-time monitoring of network status, including dynamic port allocation. Security protocols like SNMP v3 and NetFlow are employed to monitor and analyze network traffic, while traffic shaping techniques prevent congestion. Additionally, a minimum conflict algorithm is implemented to reduce port conflicts, ensuring stable data transmission across all devices. These combined efforts aim to ensure the performance, security, and scalability of the system during the experiment.
In this experiment, access running programs were successfully imported into multiple massive terminal devices and corresponding access behavior data was generated. Figure 3 presents the characteristics of these data more clearly, detailing the trend of the amount of access behavior data over time.
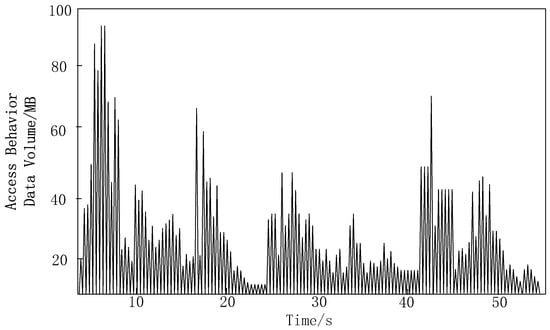
Figure 3.
Access Behavior Data Sample Diagram.
From the analysis of Figure 3, it can be seen that the data points are dense and widely distributed, indicating significant fluctuations in data volume. Within 10 s, the data volume rapidly increases and reaches a high peak, corresponding to the peak period of network activity. In other time periods, the data volume remains relatively stable, maintaining a lower mean level, which corresponds to the low period of network activity. This fluctuation not only reflects changes in data volume, but also reflects the dynamism and complexity of network activities.
As part of the functionality of building a web crawler program using BeautifulSoup in Python for parsing HTML and XML documents, a one-week historical access behavior data collection was conducted on a massive number of terminal devices in the target communication network. This tool has been customized and developed according to the requirements of this task, with the ability to meet specific crawling frequencies, multi threading, and asynchronous processing technologies. It can also control crawling frequencies and set proxy mechanisms to ensure the authenticity and validity of data. During the collection process, the crawler tool captured access behavior at a frequency of 100 times per minute, collecting over 5 million data points and generating an average of approximately 10 GB of data per terminal per day. After the data was collected, it was saved and processed by the server. Next, these raw data were cleaned and organized. Firstly, by comparing the key attributes of the data points, duplicate data points in the dataset were removed. Then, missing values were checked and processed, some missing values were estimated using interpolation, and other missing values were filled with appropriate statistics. In addition, statistical methods were used to detect and process outliers in the data. In terms of data format uniformity, this ensured that the format of all fields was consistent and that the necessary conversions had been made. Finally, based on the analysis requirements, some data were standardized. After data cleaning and organization, a dataset containing approximately 4.5 million valid data points was obtained. Crawlers were used instead of directly reading the raw data, mainly because the raw data is usually scattered across different terminal devices and there may be issues such as inconsistent data formats and delayed data updates. Using web crawling tools can automatically capture the latest and most comprehensive data from various terminal devices, and through data cleaning and organization, obtain a high-quality, unified format dataset, providing a solid foundation for subsequent user trust measurement.
Authentication is the foundation of the zero trust framework. Setting the authentication parameter to 1.0, the success or failure of authentication is the most critical factor in trust evaluation and has the highest weight. If authentication fails, regardless of other parameters, trust scores will be greatly negatively affected, emphasizing that ensuring identity authenticity is the top priority in a zero trust environment.
The authorization parameters reflect the level of permissions granted to the user. In the trust assessment, the weight of authorization parameters is 0.5, which is slightly less important compared to authentication. This setting means that even if authentication is successful, if the user’s authorization level does not match their behavior, the trust score will be affected, which helps prevent privilege escalation attacks and abuse of authorization.
The access frequency parameter is used to evaluate the frequency of user access to network resources. Set it to 0.1. Frequent access does not necessarily mean increased risk, as legitimate users may also require frequent access to resources. However, abnormal access frequency may indicate potential security threats and therefore needs to be considered as a minor factor.
The memory coefficient is used to measure the impact of users’ historical behavior patterns on current trust assessment. Set it to 0.7, where the user’s historical behavior plays a significant role in evaluating current trust. This setting helps the system adjust trust ratings based on the user’s past reliability and behavior patterns, and even if there are anomalies in current behavior, it can still give a certain level of trust based on historical records.
The adaptive coefficient dynamically adjusts the trust score based on real-time conditions, with an initial value of 0.3. With the passage of time and the accumulation of more data, the adaptive coefficient will adjust to respond more quickly to new behavioral patterns or environmental changes.
The optimized design of the massive terminal access security authentication trust evaluation algorithm based on zero trust selects Computing Network Toolkit (CNTK) as the development tool. CNTK is an open source deep learning framework specifically used to run and evaluate algorithms. Using CNTK tool, the optimized authentication trust evaluation algorithm is written into program code that can be run directly by the computer. In order to reflect the advantages of the optimization design evaluation algorithm in terms of accuracy and application effect, the traditional trust evaluation algorithm based on information entropy and the trust evaluation algorithm based on collaboration reputation and device feedback are compared experimentally, and the development and operation of related algorithms are completed under the same experimental environment.
4.2. Experimental Results
During the evaluation accuracy test experiment, determine the status of each terminal device and collect its access security authentication behavior data, thus determining the theoretical value of the terminal access security authentication trust score. Through the running of the MEA-DEW algorithm, the evaluation results including access security authentication trust score and level are obtained, as shown in Figure 4.
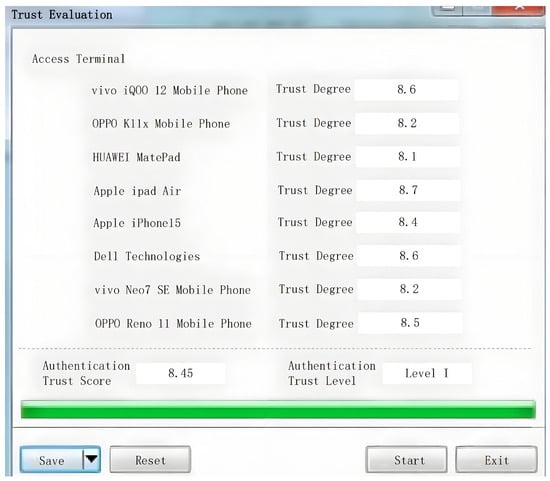
Figure 4.
Output results of the proposed MEA-DEW algorithm.
Figure 4 shows the output results of the MEA-DEW algorithm implemented by CNTK. These results include the access security authentication trust score of each terminal device and the corresponding trust level. These scores and grades are calculated by algorithms based on the security authentication behavior data of the terminal equipment. By choosing CNTK as the development tool, the MEA-DEW algorithm can be efficiently transformed into computer-executable program code. The open source nature of CNTK and its efficient processing capability for deep learning algorithms ensure fast and accurate evaluation of algorithms on massive terminal device data. This is mainly because the proposed MEA-DEW algorithm considers the principle of minimizing access rights and integrates a variety of evaluation indicators. This comprehensive and detailed evaluation system can more accurately reflect the actual security status of the terminal equipment, and provide a solid foundation for subsequent trust scoring and rating.
In order to ensure the credibility of the experimental results, adjust the operation and access status of mass terminal devices, repeat the operations of access, authentication, and trust evaluation, and obtain multiple groups of experimental results.
Taking the collaboration reputation algorithm between servers [18] and the sketch algorithm [19] in the literature as the comparison method of this paper, it can be seen from Figure 5 that although the three algorithms can resist attacks, the MEA-DEW algorithm proposed in this paper converges faster.
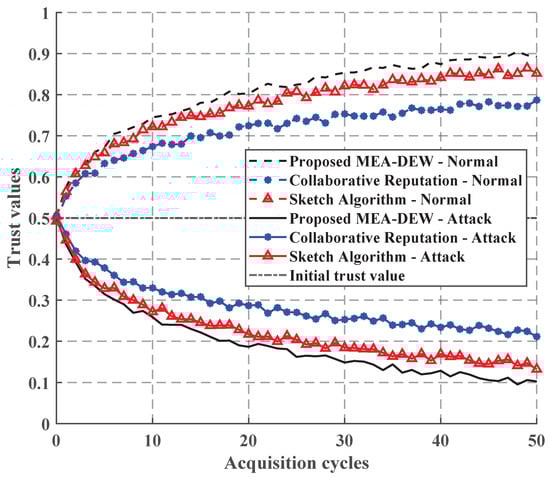
Figure 5.
Comprehensive evaluation of trust.
Figure 6 shows the trust comprehensive evaluation results of a terminal over time under intermittent attacks, in which the terminal performed well in the first 20 cycles, so the three algorithms all improved their trust values. From 20 cycles to 40 cycles, the terminal demonstrated attack behavior, and the three algorithms all identified its abnormal behavior and reduced their scores. After 40 cycles, the terminal returned to normal, and the three algorithms gradually improved their scores. It can also be seen from the curve trend in the figure that although the three algorithms have similar trends, the MEA-DEW algorithm proposed in this paper rises and falls faster than the other two methods, indicating that the MEA-DEW algorithm has higher sensitivity and more accurate evaluation results.
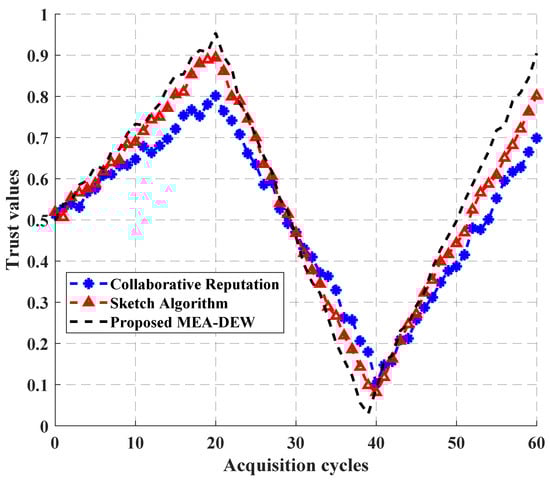
Figure 6.
Comprehensive evaluation of trust under intermittent attacks.
According to the trust evaluation results output by the massive terminal access security authentication trust evaluation algorithm, the access permission of the terminal is determined, and the test results of terminal device access and authentication status are obtained, as shown in Figure 6.
From Figure 7, we can obtain the collection results of normal and abnormal terminal device access and authentication result data. In order to realize the quantitative test of the evaluation accuracy and application effect of the evaluation algorithm, the scoring error is set as the quantitative test indicator of the evaluation accuracy. The numerical results of this indicator are as follows.
where P and are the output value and theoretical value of trust score, respectively. The theoretical value refers to the ideal or expected value of the terminal access security authentication trust score obtained through the determination of terminal device status and the collection of its access security authentication behavior data during the evaluation accuracy test experiment.
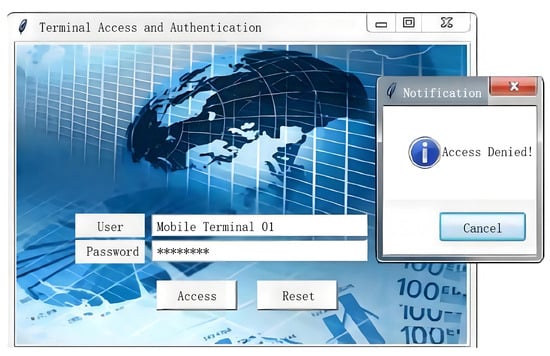
Figure 7.
Test results of terminal equipment access and authentication status.
The attacks come from all directions of the network, including but not limited to the Internet, internal networks, adjacent systems, malicious users, etc. It is set that there is a man in the middle attack in the malicious user of the internal network or the invaded terminal device. The attacker can intercept, view, and tamper with the data transmitted in the network, resulting in the disclosure of sensitive information, data tampering, or service interruption, which makes the severity higher. Attackers usually use tools such as ettercap and arpspoof to perform ARP spoofing attacks. First, use ARP spoofing technology to send forged ARP responses to other devices in the network, and associate their MAC address with the IP address of the target device. When other devices try to communicate with the target device, the packet will be sent to the attacker’s device. Attackers can intercept these packets, view or tamper with their contents, and then forward them to the target device to achieve man in the middle attacks. In addition, the test index to evaluate the application effect of the algorithm is the platform access risk, and the test result of access risk is given by
where N is the number of abnormal terminals allowed to access, indicates the degree of attack on the i-th terminal device or the frequency and severity of attack on each terminal device, that is, the attack intensity of abnormal terminals, where F is the attack frequency and S indicates the severity of the attack (rating); and denotes the probability of the i-th terminal device being attacked, that is, the attack probability of the abnormal terminal. And these two factors together determine the number of abnormal terminals, thus affecting the value of platform access risk. When the number of abnormal terminals increases, the access risk value will also increase, which means that the security risk will increase. Finally, it is calculated that the smaller the trust score error of massive terminal access security authentication, the higher the evaluation accuracy of the corresponding algorithm, and the larger the access risk value, indicating the better the application performance of the corresponding evaluation algorithm.
Through the statistics of relevant data, the quantitative test results of the evaluation accuracy of the terminal access security authentication trust evaluation algorithm based on zero trust are obtained, as shown in Table 1. Substitute the data in Table 1 into Equation (13), and the average values of the output scoring errors of the three evaluation algorithms are 0.08, 0.04, and 0.01, respectively. Compared with the two traditional methods, the MEA-DEW method in this paper reduces the values to 0.07 and 0.03, respectively, and the reduction amplitude reaches 87.5% and 75%. In addition, through the statistics of relevant data and the calculation of Equation (13), the test results of access risk are compared, as shown in Figure 8.

Table 1.
Evaluation accuracy test data table.
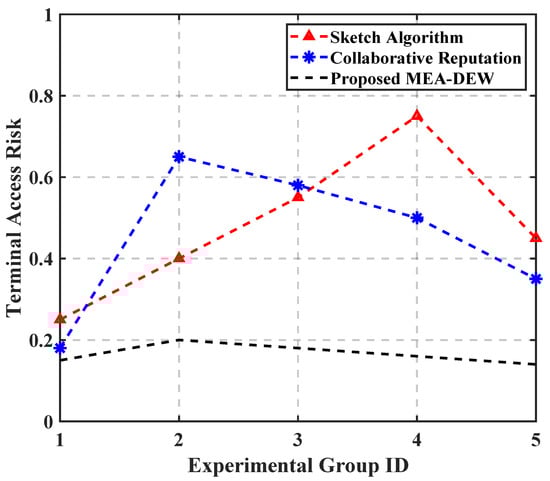
Figure 8.
Comparison results of terminal access risk test.
As shown in Table 2, simultaneously perturbing the manually set parameters (, , , etc.) within their recommended ranges of ±20% keeps the trust-score variance below ±0.06%, produces zero rank reversals, and maintains convergence time and attack-detection accuracy within narrow bands of ±2 cycles and ±0.4%, respectively. These results confirm that MEA-DEW is highly robust to parameter tuning and that the stability and reliability of its final trust scores are not compromised by reasonable manual adjustments.
Table 2.
Extended sensitivity analysis: some manually set factors vs. trust-score stability.
5. Conclusions
This paper proposes a multi-modal data-driven dynamic weighting authentication trust evaluation method under the zero trust architecture. By coupling with multimodal evaluation values, the trust score of terminal access security authentication is dynamically updated. This method can reflect the security status of the terminal in real time to adapt to the changing security environment. The experimental data shows that compared with the traditional reputation appeasement and cooperative reputation methods, the algorithm in this paper is more sensitive to attacks, and the risk test results have always been below 0.2. Nevertheless, large-scale deployment entails unresolved challenges including high-rate telemetry ingestion, continual model drift mitigation, and regulation-compliant computation, which this paper explicitly recognizes to orient future scholarly and industrial efforts.
Author Contributions
Conceptualization, J.G. and Z.G.; Methodology, J.G. and Z.G.; Validation, J.G. and Z.G.; Formal analysis, J.F. and Z.G.; Investigation, J.G.; Writing—original draft, J.G.; Writing—review & editing, J.G., J.F. and Z.G.; Supervision, J.F. and Z.G.; Project administration, J.F. and Z.G.; Funding acquisition, J.F. All authors have read and agreed to the published version of the manuscript.
Funding
This work was supported by the National Natural Science Foundation of China (Grant No. 20201300985).
Data Availability Statement
The data presented in this study are available on request from the corresponding author due to privacy restrictions.
Conflicts of Interest
Author Zefang Gao was employed by the company China Mobile Communications Group Terminal Co., Ltd. The remaining authors declare that the research was conducted in the absence of any commercial or financial relationships that could be construed as a potential conflict of interest.
References
- Fan, X.; Wang, Y.; Huo, Y.; Tian, Z. 1-Bit Compressive Sensing for Efficient Federated Learning over the Air. IEEE Trans. Wirel. Commun. 2023, 22, 2139–2155. [Google Scholar] [CrossRef]
- Huang, F.; Chen, Z.; Xiao, J.; Jin, Z.; Chen, J.; Yang, H. Application of Smart Terminals in the Power Industrial Internet. In Hydropower and Renewable Energies; IHDC 2024. Lecture Notes in Civil Engineering; Zheng, S., Taylor, R.M., Wu, W., Nilsen, B., Zhao, G., Eds.; Springer: Singapore, 2025; Volume 487. [Google Scholar] [CrossRef]
- Fan, X.; Wang, Y.; Huo, Y.; Tian, Z. Joint Optimization of Communications and Federated Learning over the Air. IEEE Trans. Wirel. Commun. 2022, 21, 4434–4449. [Google Scholar] [CrossRef]
- Wang, H.; Cui, F.; Ni, M.; Zhou, T. Key technologies of end-side computing power network based on multi-granularity and multi-level end-side computing power scheduling. J. Comput. Methods Sci. Eng. 2024, 24, 1157–1171. [Google Scholar] [CrossRef]
- Wang, Y.; Tian, Z.; Fan, X.; Cai, Z.; Nowzari, C.; Zeng, K. Distributed Swarm Learning for Edge Internet of Things. IEEE Commun. Mag. 2024, 62, 160–166. [Google Scholar] [CrossRef]
- Hu, S.; Lin, J.; Lu, Z.; Du, X.; Duan, Q.; Huang, S.C. CoLLaRS: A cloud–edge–terminal collaborative lifelong learning framework for AIoT. Future Gener. Comput. Syst. 2024, 158, 447–456. [Google Scholar] [CrossRef]
- Fan, X.; Wang, Y.; Huo, Y.; Tian, Z. CB-DSL: Communication-Efficient and Byzantine-Robust Distributed Swarm Learning on Non-i.i.d. Data. IEEE Trans. Cogn. Commun. Netw. 2024, 10, 322–334. [Google Scholar] [CrossRef]
- Gupta, N.; Jati, A.; Chattopadhyay, A. Ai attacks ai: Recovering neural network architecture from nvdla using ai-assisted side channel attack. ACM Trans. Embed. Comput. Syst. 2025, 24, 1–29. [Google Scholar] [CrossRef]
- Fan, X.; Wang, Y.; Huo, Y.; Tian, Z. BEV-SGD: Best Effort Voting SGD Against Byzantine Attacks for Analog-Aggregation-Based Federated Learning over the Air. IEEE Internet Things J. 2022, 9, 18946–18959. [Google Scholar] [CrossRef]
- Guembe, B.; Azeta, A.; Misra, S.; Osamor, V.C.; Fernandez-Sanz, L.; Pospelova, V. The emerging threat of ai-driven cyber attacks: A review. Appl. Artif. Intell. 2022, 36, 2037254. [Google Scholar] [CrossRef]
- Fan, X.; Wang, Y.; Huo, Y.; Tian, Z. Best Effort Voting Power Control for Byzantine-resilient Federated Learning over the Air. In Proceedings of the 2022 IEEE International Conference on Communications Workshops (ICC Workshops), Seoul, Republic of Korea, 16–20 May 2022; pp. 806–811. [Google Scholar] [CrossRef]
- Barach, J. Towards Zero Trust Security in SDN: A Multi-Layered Defense Strategy. In Proceedings of the 26th International Conference on Distributed Computing and Networking, Telangana, India, 4–7 January 2025; pp. 331–339. [Google Scholar]
- Fan, X.; Huo, Y. Blockchain Based Dynamic Spectrum Access of Non-Real-Time Data in Cyber-Physical-Social Systems. IEEE Access 2020, 8, 64486–64498. [Google Scholar] [CrossRef]
- Stafford, V. Zero trust architecture. NIST Spec. Publ. 2020, 800, 800-207. [Google Scholar]
- Kang, H.; Liu, G.; Wang, Q.; Meng, L.; Liu, J. Theory and application of zero trust security: A brief survey. Entropy 2023, 25, 1595. [Google Scholar] [CrossRef]
- Shonubi, J.A. Multi-Layered Zero Trust Architectures for Cross-Domain Data Protection in Federated Enterprise Networks and High-Risk Operational Environments. Int. J. Res. Publ. Rev. 2025, 6, 146–169. [Google Scholar] [CrossRef]
- Zhao, J.; Huang, J.; Xiong, N. An effective exponential-based trust and reputation evaluation system in wireless sensor networks. IEEE Access 2019, 7, 33859–33869. [Google Scholar] [CrossRef]
- Zhang, L.; Wei, X.; Liu, X.; Huang, H.; Wang, R. IoT Edge Server Trust Evaluation Algorithm Based on Collaborative Reputation and Device Feedback. J. Commun. Xuebao 2022, 43, 118–130. [Google Scholar]
- Jing, X.; Yan, Z.; Han, H.; Pedrycz, W. ExtendedSketch: Fusing Network Traffic for Super Host Identification With a Memory Efficient Sketch. IEEE Trans. Dependable Secur. Comput. 2022, 19, 3913–3924. [Google Scholar] [CrossRef]
- Wang, D.; Yi, Y.; Yan, S.; Wan, N.; Zhao, J. A node trust evaluation method of vehicle-road-cloud collaborative system based on federated learning. Ad Hoc Netw. 2023, 138, 103013. [Google Scholar] [CrossRef]
- Yujian, L.; Bo, L. A normalized Levenshtein distance metric. IEEE Trans. Pattern Anal. Mach. Intell. 2007, 29, 1091–1095. [Google Scholar] [CrossRef]
- Hasnain, M.; Pasha, M.F.; Ghani, I.; Imran, M.; Alzahrani, M.Y.; Budiarto, R. Evaluating trust prediction and confusion matrix measures for web services ranking. IEEE Access 2020, 8, 90847–90861. [Google Scholar] [CrossRef]
- Lee, S.; Levanti, K.; Kim, H.S. Network monitoring: Present and future. Comput. Netw. 2014, 65, 84–98. [Google Scholar] [CrossRef]
- Abodayeh, A.; Hejazi, R.; Najjar, W.; Shihadeh, L.; Latif, R. Web Scraping for Data Analytics: A BeautifulSoup Implementation. In Proceedings of the 2023 Sixth International Conference of Women in Data Science at Prince Sultan University (WiDS PSU), Riyadh, Saudi Arabia, 14–15 March 2023; pp. 65–69. [Google Scholar] [CrossRef]
- Schubert, E.; Sander, J.; Ester, M.; Kriegel, H.P.; Xu, X. DBSCAN Revisited, Revisited: Why and How You Should (Still) Use DBSCAN. ACM Trans. Database Syst. 2017, 42, 1–21. [Google Scholar] [CrossRef]


Disclaimer/Publisher’s Note: The statements, opinions and data contained in all publications are solely those of the individual author(s) and contributor(s) and not of MDPI and/or the editor(s). MDPI and/or the editor(s) disclaim responsibility for any injury to people or property resulting from any ideas, methods, instructions or products referred to in the content. |
© 2026 by the authors. Licensee MDPI, Basel, Switzerland. This article is an open access article distributed under the terms and conditions of the Creative Commons Attribution (CC BY) license.