Abstract
With the rapid increase in renewable energy penetration and the expansion of multi-regional interconnected power systems, there is a growing need to forecast the power output of renewable energy power plant clusters within a region. Existing methods primarily utilize spatio-temporal correlations between stations to directly predict cluster output, but they still have the following shortcomings: (1) lack of analysis and utilization of the similar output characteristics between wind and solar power stations; and (2) inadequate integration of individual plant characteristics and adaptability across different prediction spatial scales. Therefore, this study proposes a method for forecasting and correcting daily power generation zones of wind–solar clusters based on output similarity clustering. First, the output similarity characteristics of wind and solar plants within the cluster are evaluated, and a similarity matrix is constructed to cluster the plants into sub-clusters. Second, a single-site power prediction model based on the BiLSTM model and multi-task learning is constructed to aggregate preliminary power prediction results from individual sites within sub-clusters. Finally, a cluster power prediction correction model based on the GCN-Transformer model is developed to refine preliminary predictions using spatio-temporal correlations between sub-clusters. Simulation results demonstrate that the proposed method, through its integrated approach combining clustering partitioning, multi-task learning, and spatio-temporal correlation correction within a comprehensive forecasting workflow, achieves improvements of 15.2323%, 19.0581%, and 0.0283% over the baseline GCN model in terms of MAE, RMSE, and R-score, respectively. This effectively enhances the accuracy of power forecasting for wind-solar power plant clusters.
1. Introduction
Renewable energy generation, represented by wind and solar power, is key to achieving green transition in the power system [1]. Renewable energy generation is significantly constrained by environmental factors. The operation of wind farms and photovoltaic power stations heavily relies on meteorological conditions, with power output fluctuating in real-time according to climate patterns. The inherent intermittency and variability of wind speeds and solar irradiance contribute to the uncertainty of wind and solar power generation [2]. Power forecasting provides an economically viable solution for power dispatchers to address the unpredictability of renewable energy generation [3].
Research on power forecasting for renewable energy generation initially began with methods targeting single stations and single energy sources. Single-station power forecasting methods can be categorized into physical modeling and data-driven approaches based on their underlying principles. Physical modeling methods focus on the physical laws governing renewable energy generation processes, constructing mathematical models to quantify how meteorological factors and equipment characteristics influence power output. Although physically based modeling offers strong interpretability, challenges in model construction and parameterization have limited its current research [4]. Data-driven approaches leverage machine learning and deep learning algorithms to learn implicit high-dimensional nonlinear mapping relationships from historical power output data and weather forecast data, thereby enabling power generation forecasting [5].
With the rapid increase in the penetration rate of new energy power generation and the expansion of multi-regional interconnected power systems, the number and scale of new energy power stations have further expanded. Single-station power forecasting has become insufficient to meet the power system’s demand for large-scale new energy integration. Therefore, forecasting the aggregate power generation of new energy power station clusters within a region has emerged as a new research direction [6]. The cumulative method and statistical upscaling method are two early approaches proposed for regional wind and solar power forecasting. The summation method constructs separate prediction models for each power plant, forecasting the predicted power output of individual plants within the cluster. The predicted results from each plant are then summed to obtain the cluster’s power prediction [7]. The upscaling method first divides the cluster into several sub-regions, selects representative plants within each sub-region, and then uses upscaling techniques to extrapolate the prediction results from these representative plants to the cluster’s overall power prediction [8].
The cumulative method incurs high training costs and exhibits significant prediction accuracy fluctuations influenced by individual station forecasts, leading to potential error accumulation issues. The upscaling method’s performance heavily relies on representative power plant selection and struggles to apply when meteorological conditions vary substantially within subregions. Consequently, existing research predominantly leverages spatio-temporal correlations between stations to directly predict cluster output. Chen et al. [9] proposed a regional wind-solar co-prediction model based on a novel multi-task learning framework and TPA-LSTM. This approach employs MIC to identify key meteorological features while utilizing the multi-task learning framework to capture spatio-temporal correlations and complementarities between wind and solar power generation. This enables effective extraction of shared information and mitigation of task interference, with loss optimization strategies balancing multi-task training. Liang et al. [10] constructed an Attention Time Convolutional Network (ATCN), employing stacked dilated convolutional networks (DCN) to extract multi-site spatio-temporal features. By dynamically integrating base sequences through a dot-product attention mechanism, the model leverages spatial correlations and temporal patterns across geographically distributed sites without requiring domain knowledge, enhancing both ultra-short-term prediction accuracy and interpretability. Li et al. [6] developed the Heterogeneous Spatio-Temporal Graph Convolutional Network (HSTGCN). It employs a dynamic heterogeneous graph structure to distinguish nodes across different regions and energy types. By integrating a multi-scale CNN with a Graph Convolutional Attention Module (GCAM), it hierarchically captures multidimensional spatial correlations within clusters. Residual structures and dynamic graph updates enhance the model’s ability to model complex spatio-temporal dependencies. Ge et al. [11] proposed the Differentiated Spatio-Temporal Mixture Network (DSTMN) to address hydro-solar-wind heterogeneity. By quantifying spatiotemporal delays in meteorological and power data via Spatio-Temporal Lag Correlation (STLC), they established an optimal probabilistic transfer model for NWP scenarios using Rank Bayesian Ensemble (RBE). This enables spatiotemporal optimization of grid-based NWP inputs, revealing dynamic propagation patterns of meteorological processes across regional sites. Wang et al. [12] proposed a joint forecasting method for wind/solar generation and load based on variable attention mechanisms and multi-task learning. Wang, Yang et al. [13] proposed a spatial correlation assessment metric accounting for wind speed and direction. Building upon this, they evaluated the spatial correlation between wind speeds using graph-based representations, constructing a GAT network incorporating bidirectional recurrent residual networks to enable effective transmission of spatial correlations within the network. They further employed a Multi-Task Learning (MTL) algorithm to optimise network outputs. Qiu et al. [14] combined enhanced K-means clustering with temporal convolutional networks, bidirectional gated recurrent units, and attention mechanisms to enhance the forecasting accuracy of aggregated wind and photovoltaic power generation in VPPs. Variable attention extracts key interdependent features, while multi-task learning automatically optimizes wind/solar forecasting loss weights. Integrating wind/solar forecasts into load prediction leverages spatio-temporal coupling between wind/solar generation and load to enhance overall forecasting performance. These studies achieve improved cluster prediction accuracy by either uncovering spatio-temporal correlations such as meteorological element propagation and power output complementarity between stations, or explicitly modeling spatial and time-series dependencies using techniques like graph convolutional networks and attention mechanisms.
In summary, existing power forecasting methods for photovoltaic-wind clusters have made some progress in improving prediction accuracy. However, the following areas remain open for improvement:
- (1)
- Existing methods for forecasting power output from clusters lack analysis and utilization of the similar output characteristics between wind and solar power stations. Current direct forecasting approaches predominantly focus on optimizing the overall cluster output prediction model through spatio-temporal correlation, an approach whose effectiveness has been demonstrated by numerous studies. However, power stations within a cluster exhibiting strong spatio-temporal correlation may possess distinct output characteristics. Relying solely on spatio-temporal correlation without quantifying output similarity to refine cluster segmentation prevents models from accurately capturing common patterns among stations with similar output traits. This approach also fails to fully leverage complementary output information between similar stations to optimize the forecasting process, thereby limiting further improvements in prediction accuracy. Furthermore, existing methods’ neglect of similar output characteristics hinders models from being tailored to the prediction needs of distinct subgroups sharing similar traits, often amplifying localized prediction biases.
- (2)
- All three mainstream methods for forecasting power output within clusters exhibit certain limitations in adaptability, rendering them unsuitable for complex scenarios where power plants within a cluster possess differing output characteristics. Direct prediction methods prioritize the cluster scale while neglecting individual power plant output characteristics, resulting in limited adaptability for plants exhibiting output heterogeneity within the cluster. Although the aggregation method effectively captures individual plant power characteristics, its site-level prediction not only incurs high training costs but also risks cumulative errors stemming from individual plant prediction inaccuracies. The accuracy of the upscaling statistical method relies heavily on the rationality of representative plant selection, particularly exhibiting low adaptability when plants with distinct output characteristics exist within the cluster.
To this end, this paper proposes a method for forecasting and correcting the daily power output of wind–solar clusters based on output similarity clustering. The partitioned forecasting approach involves dividing the entire cluster into multiple sub-clusters according to one or more significant characteristics. Each sub-cluster is then modelled and forecasted independently. Finally, the individual station forecasts within each sub-cluster are aggregated, and the power forecasting errors of the sub-clusters are corrected to obtain the final overall output forecast for the cluster. The main contributions of this paper are summarized as follows:
- (1)
- Integrating the strengths of three mainstream cluster output forecasting methods: partitioned single-site forecasting enables precise extraction of individual plant output characteristics, circumventing the shortcomings of direct forecasting methods that overlook site-specific traits. Simultaneously, sub-cluster aggregation forecasting mitigates the risk of cumulative error inherent in additive methods. Furthermore, it eliminates reliance on representative plant selection, addressing the scalability limitations of upscaling approaches. This achieves synergistic enhancement of both single-site characteristic extraction and cluster-level forecasting accuracy.
- (2)
- The similarity characteristics of power output among wind and solar power stations within clusters were evaluated. A similarity matrix was constructed to cluster these stations into sub-groups within the region. For each sub-cluster, a single-site power generation forecasting model was developed using a BiLSTM model combined with multi-task learning. This approach effectively leveraged the similarity in output characteristics across different stations to enhance prediction accuracy.
- (3)
- Integrating existing research findings that spatio-temporal correlations significantly enhance prediction accuracy, a cluster power output prediction correction model based on the GCN-Transformer architecture was developed. This model utilizes the spatio-temporal correlations between outputs across sub-clusters to refine the predicted outputs of individual sub-clusters, thereby further improving the accuracy of cluster power output forecasting.
The remainder of this paper is organized as follows. Section 2 primarily introduces the research methodology employed in this study. Section 3 applies this methodology to real-world cases and compares it with alternative approaches to validate the proposed method’s effectiveness. Section 4 provides a summary of the research and outlines future directions.
2. Materials and Methods
This paper proposes a method for forecasting and correcting daily power generation of wind-solar clusters based on output similarity clustering, which is divided into three main stages. The overall framework is shown in Figure 1: clustering of wind-solar power plant sub-clusters based on output similarity characteristics; single-site power generation forecasting within sub-clusters using the BiLSTM model and multi-task learning methods; and a correction model for cluster power generation forecasting results based on the GCN-Transformer model. These three stages comprise the following five steps.
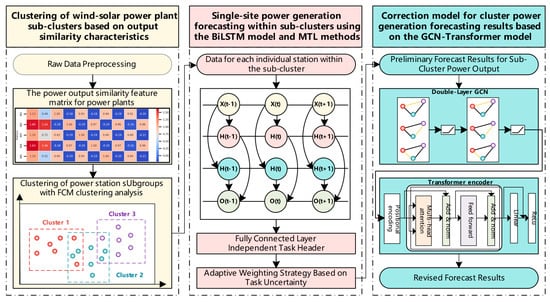
Figure 1.
Flowchart of the Method Proposed in This Paper.
Step 1: Raw Data Preprocessing. Perform missing value imputation, outlier removal, and normalization on raw power generation and meteorological data to ensure data quality and temporal consistency.
Step 2: Generate the power output similarity feature matrix for power plants. Calculate the coefficient of variation for each power plant’s electricity generation output and the measured values of key meteorological elements (wind speed for wind power plants, irradiance for photovoltaic plants) during the selected historical period. This quantifies the inherent fluctuation level (stability) of each plant’s electricity generation output relative to meteorological variables. Compute the Spearman rank correlation coefficient between each plant’s electricity generation output and the measured values of key meteorological elements to characterize the interdependencies among electricity generation outputs across plants. Generate a high-dimensional feature matrix representing power output similarity among power plants by using the coefficient of variation and Spearman’s rank correlation coefficient as plant features.
Step 3: Clustering of Power Station Subgroups. For the generated high-dimensional feature matrix, unsupervised learning is performed using fuzzy C-means clustering analysis. A model for grouping wind and solar power stations into subgroups is established based on the fuzzy C-means clustering algorithm and multidimensional clustering evaluation metrics.
Step 4: Single-Station Power Prediction within Subclusters Using BiLSTM Models and Multi-Task Learning. For each wind and solar power station within the subclusters, train single-station power prediction models based on BiLSTM using multi-task learning methods to obtain preliminary power prediction values for each power station.
Step 5: Correction of Clustered Power Generation Forecast Results Based on the GCN-Transformer Model. Treat each subcluster as a node in a graph, aggregating the power generation of all power plants within the subcluster as the node’s total output. Calculate the Pearson correlation coefficient between the outputs of each node to determine the relationship between connected nodes. Subsequently, compute the adjacency matrix to construct a correction model for the cluster power generation prediction results based on the GCN-Transformer model. Apply corrections to the output of each sub-cluster, then sum the corrected predicted outputs of all sub-clusters to obtain the final total power generation prediction result.
2.1. Construction of Power Plant Output Similarity Feature Matrix
Wind farms and photovoltaic power plants exhibit distinct output characteristics across different geographical locations and meteorological environments. Applying a unified model for holistic forecasting across all plants struggles to capture the unique spatio-temporal correlations and meteorological response patterns specific to local regions, often resulting in reduced prediction accuracy. Furthermore, wind-solar clusters typically encompass numerous power plants. Constructing separate prediction models for each plant not only incurs high computational costs and low training efficiency but also risks compromising generalization capabilities due to data sparsity or overfitting. Therefore, by analyzing power plant output characteristics and grouping plants with similar output patterns into sub-clusters, we can reduce model complexity while balancing prediction performance and accuracy requirements.
By grouping power plants within wind-solar clusters based on output similarity, plants exhibiting similar fluctuation patterns and meteorological dependencies can be assigned to the same sub-cluster. This enables the construction of more targeted prediction models within each sub-cluster, effectively enhancing forecasting performance. Simultaneously, partitioned forecasting reduces model complexity, improves generalization capabilities, and provides a structured foundation for subsequent cluster-level power correction.
The coefficient of variation characterizes the relative fluctuation of power output or key meteorological variables (such as wind speed and irradiance) at individual power stations over historical periods, reflecting their operational stability. Meanwhile, Spearman’s rank correlation coefficient measures monotonic dependencies between power output sequences or meteorological sequences across different power stations, demonstrating robustness to nonlinear yet monotonic trends. Together, they comprehensively characterize power generation behavior from two dimensions: single-site output stability and inter-site output coordination. This forms an effective basis for measuring output similarity within a high-dimensional feature space, making it suitable for unsupervised clustering tasks. It also demonstrates strong adaptability to the non-Gaussian distributions and outliers commonly found in wind and solar data.
The coefficient of variation (CV) is the ratio of the standard deviation to the mean, used to measure the relative dispersion of a data series. Its formula is
where σ denotes the standard deviation and μ represents the mean. Compared to absolute volatility metrics (such as variance), the coefficient of variation eliminates the influence of units and mean levels, making it more suitable for comparing the output stability of power plants of different scales or mean levels, as well as the volatility stability of meteorological variables directly related to preprocessing. In this paper, the coefficient of variation is calculated for the historical power generation of each power plant and its corresponding measured meteorological elements (measured wind speed for wind power plants and measured irradiance for photovoltaic power plants) to quantify the stability and sensitivity of their own output.
The Spearman correlation coefficient (SRCC) is a nonparametric statistic used to measure the strength and direction of a monotonic relationship between two variables [15]. It is calculated based on the ranking of variables rather than their raw values, making it insensitive to outliers and independent of data normality. This renders it particularly suitable for nonlinear and ordinal data. The SRCC is calculated as follows: Let two data sets be denoted as X and Y. First, rank them separately by magnitude to obtain the rank sequences R(X) and R(Y). Next, compute the Pearson correlation coefficient between these rank sequences, which measures the linear relationship between the two sets of ranks. The formula for the Spearman rank correlation coefficient is
The SRCC value ranges from [−1, 1]. Values closer to ±1 indicate stronger monotonic correlation between the two sequences, while 0 indicates no correlation. The proposed method calculates the Spearman correlation coefficient between the historical power generation sequences of any two power plants, along with the correlations between their respective key meteorological element sequences. These values serve as elements for constructing the inter-plant coordinated output relationship matrix, thereby characterizing their nonlinear similarity patterns in temporal variations and providing key feature support for subsequent clustering.
2.2. Subcluster Partitioning Based on Fuzzy C-Means Clustering
After constructing a high-dimensional output similarity feature matrix integrating the coefficient of variation and Spearman’s rank correlation coefficient, an appropriate method must be employed to reasonably partition power stations within wind-solar clusters. Clustering algorithms represent an unsupervised machine learning technique used to classify unlabeled data based on intrinsic or manually selected features, grouping data with similar characteristics into the same category [16]. Common clustering algorithms include density-based clustering [17], hierarchical clustering [18], K-means clustering [19], and Fuzzy C-means (FCM) clustering [20,21]. Hard clustering methods (e.g., K-means) require each power plant to belong strictly to a single subcluster, overlooking the transitional or overlapping characteristics that may exist in actual power plant output patterns. In contrast, fuzzy C-means clustering incorporates the concept of membership degrees, allowing each power plant to belong to multiple subclusters to varying extents. This approach better aligns with the fuzzy boundary characteristics exhibited by wind and solar power generation under the coupled influence of multiple meteorological factors, making it more suitable for the task of subcluster partitioning in wind and solar power plants.
Fuzzy C-Means (FCM) clustering is a soft clustering algorithm based on objective function optimization. Its core principle involves transforming the clustering problem into a constrained nonlinear optimization problem: finding C fuzzy centroids in the feature space that minimize the sum of weighted squared distances from all data points to each centroid. These weights are termed membership degrees. Specifically, for a set of N power plants, the FCM clustering algorithm assigns each plant i a membership degree u to the j-th subcluster, satisfying (where C is the preset number of subclusters). The algorithm iteratively updates the membership matrix and cluster centers until convergence. Its objective function is defined as follows [16]:
here, enotes the vector representation of the i-th power plant in the feature space, represents the center of the j-th subcluster, and m∈(1,∞) serves as the fuzzy weighting exponent to control the degree of fuzziness in membership degrees. Larger values of m result in a more uniform distribution of membership degrees, while smaller values tend toward hard partitioning. The FCM clustering algorithm typically involves the following steps:
Step 1: Initialize the number of clusters and the initial membership degree of each sample point for each cluster;
Step 2: Calculate the cluster centers based on the current membership degrees.
Step 3: Update the membership degree by calculating the Euclidean distance between each sample point and each cluster center.
Step 4: Iterate updates until the stopping criteria are met. Common stopping criteria include reaching the maximum number of iterations, the change in cluster centers falling below a threshold, or the change in membership degrees falling below a certain threshold.
The advantage of FCM lies in its ability to assign each power plant varying degrees of membership across multiple subclusters, rather than forcibly categorizing it into a single group. Compared to rigid classification methods that arbitrarily assign power plants near cluster boundaries to fixed sub-clusters, FCM uses membership degrees to characterize the transitional and uncertain nature of these edge samples across multiple output patterns. This approach more accurately reflects their complex behavioral characteristics influenced by multiple meteorological factors or regional coupling effects. This soft-partitioning mechanism enables FCM to demonstrate greater flexibility and adaptability when confronting the inherent nonlinearity, volatility, and fuzzy boundaries of wind and solar power generation. Furthermore, FCM exhibits low sensitivity to initial cluster centers. Combined with the feature matrix constructed in this paper based on coefficient of variation and Spearman’s correlation coefficient, it further enhances the stability and physical interpretability of clustering results. By calculating clustering evaluation metrics (such as contour coefficient and partition entropy), fuzzy partitioning results can be converted into explicit sub-cluster affiliations, providing support for subsequent construction of single-site output prediction models oriented toward sub-clusters.
2.3. A Multi-Task Learning Approach Based on the BiLSTM Model
As mentioned earlier, training independent weather-to-power mapping prediction models for each power plant within a cluster leads to inefficient training and fails to fully leverage parameters across similar tasks. In the context of power forecasting for renewable energy clusters, multi-task learning offers a modeling paradigm that balances efficiency and performance.
Multi-Task Learning (MTL) is a machine learning paradigm centered on simultaneously learning multiple related tasks. By sharing certain model parameters or representations, it enhances the generalization performance of each task. Unlike traditional single-task learning, MTL leverages commonalities and complementary information across tasks to achieve knowledge transfer during training. This approach effectively mitigates overfitting, improves data efficiency, and enhances model robustness.
The key to achieving multi-task learning lies in designing a reasonable shared architecture and balancing the optimization objectives across different tasks. Common MTL architectures include hard parameter sharing and soft parameter sharing. Hard parameter sharing typically consists of a shared encoder that branches into task-specific heads, while soft parameter sharing assigns each task its own set of parameters. Cross-task parameters are handled through feature sharing mechanisms, with parameter similarity constrained by regularization [22].
For similar tasks, such as predicting renewable energy output across different regions or types, hard parameter sharing is generally more suitable in multi-task learning. This is because similar tasks often share highly overlapping underlying features (e.g., weather patterns, temporal periodicity, seasonality). By sharing underlying network parameters, the model can efficiently extract these common features, reduce redundant computations, enhance data utilization efficiency, and improve generalization capabilities. Hard parameter sharing features a simple structure with fewer parameters, effectively promoting knowledge transfer when tasks are highly correlated. While soft parameter sharing offers greater flexibility, its independent model structure may waste modeling resources when tasks are highly similar and struggles to fully leverage synergies between tasks. Therefore, in scenarios like renewable energy output forecasting where tasks exhibit high semantic and input feature consistency, hard parameter sharing is typically the superior choice.
Beyond the model architecture, a major challenge in MTL stems from the loss function optimization process itself. Careful balancing of joint learning across all tasks is required to prevent one or more tasks from exerting a dominant influence on network weights. Loss functions for different tasks often exhibit differences in magnitude, convergence speed, and gradient scale. If task losses are simply summed indiscriminately, tasks with larger losses or stronger gradients may dominate the training process. This can cause the model to overemphasize these tasks while neglecting others, potentially leading to “negative transfer.” Furthermore, some tasks may converge faster. If their weights remain fixed, they can continuously interfere with tasks that have not yet converged during later training stages. Strategies such as uncertainty weighting [12,23], gradient normalization [24], dynamic weight averaging [25], and incorporating multi-objective optimization [26] can coordinate the contribution of each task to parameter updates. This enables the model to achieve better overall performance and generalization capabilities across multiple objectives.
This paper employs a dual-layer bidirectional long short-term memory network architecture, as illustrated in Figure 2, which supports multi-task learning and incorporates an adaptive weighting strategy based on task uncertainty. This approach enables the prediction of single-station output for multiple power plants within sub-clusters following clustering. This approach enables the prediction of single-station power output across multiple power plants within sub-clusters following clustering. Specifically, the model’s base layer consists of a shared two-layer BiLSTM encoder that extracts general temporal features with time dependency and context awareness from input meteorological sequences (e.g., wind speed, irradiance, temperature, humidity). This shared encoder fully captures common patterns in the meteorology-to-power mapping relationships across different power plants, such as diurnal periodicity and responses to sudden weather changes. Building upon this foundation, each power plant corresponds to an independent task head, typically composed of a fully connected layer, which maps the shared features to their respective specific power prediction outputs. To address loss scale inconsistency and gradient competition during multi-task optimization, the model further incorporates an adaptive weighting strategy based on task uncertainty. This involves assigning a learnable noise parameter (log-variance) to each task’s loss term within the loss function, implicitly adjusting task weights by maximizing the Gaussian likelihood. The loss function for this task-uncertainty-based adaptive weighting strategy is expressed as follows [23]:
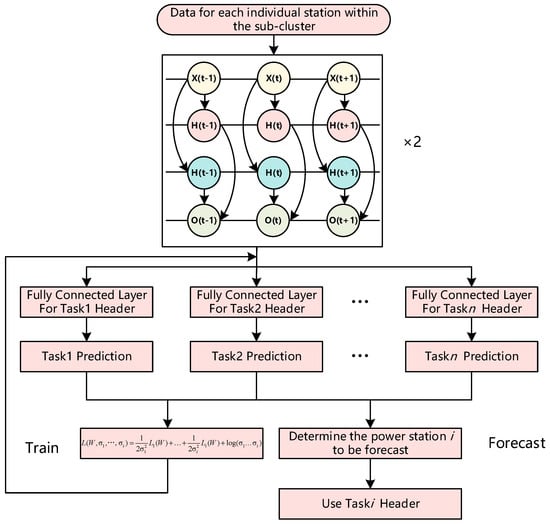
Figure 2.
The Multi-task Learning Framework Based on the BiLSTM Model Employed in This Paper.
The uncertainty weighting strategy enables the model to automatically focus on tasks with lower uncertainty while preventing dominant tasks from overshadowing weaker ones. This approach not only enhances the model’s overall convergence stability but also improves the prediction accuracy and generalization performance of each sub-task.
2.4. Correction of Clustered Power Generation Forecast Results Based on the GCN-Transformer Model
After completing preliminary output predictions for individual stations within each sub-cluster, the predicted power outputs of all power plants in the sub-cluster are typically summed to obtain the preliminary aggregated output prediction for that sub-cluster. However, this result often still exhibits systematic bias, primarily due to three factors: First, although the single-site prediction model is customized for the output characteristics of the sub-cluster, within the multi-task learning framework, simplifications or sharing of certain fine-grained output features are unavoidable to balance computational efficiency and model generalization capability, thereby limiting individual prediction accuracy; Second, significant spatiotemporal coupling exists among power plants within a sub-cluster—for instance, adjacent PV plants may simultaneously experience effects from the same cloud movement, while wind farms may exhibit physical interactions like wake interference. Independently modeled single-site prediction methods struggle to explicitly capture such collaborative dynamics. Finally, the aggregation process itself accumulates prediction errors from individual sites. In large-scale wind-solar clusters, this error accumulation effect may be amplified, compromising overall prediction reliability. Therefore, there is an urgent need to introduce a global collaborative modeling mechanism at the sub-cluster level that integrates spatial correlations and temporal evolution. This mechanism should refine preliminary prediction results to enhance the accuracy and robustness of cluster-level power forecasting.
Graph Convolutional Networks (GCNs) represent an effective deep learning approach for processing non-Euclidean structured data, particularly suited to modelling entity systems with topological relationships [27]. GCNs propagate node information through adjacency matrices defined on graph structures, utilizing spectral or spatial convolution operations to aggregate neighboring node features, thereby capturing spatial dependencies between nodes. Within wind-solar clusters, individual power stations may be regarded as graph nodes. Adjacency matrix edge weights are constructed based on Pearson correlation coefficients derived from station output data. This correlation is intrinsically linked to meteorological propagation characteristics of wind and solar resources, as well as the geographical proximity of stations: Power stations geographically proximate often share similar micro-meteorological environments. The spatiotemporal propagation of meteorological elements such as wind speed and solar irradiance exhibits continuity, leading to a pronounced positive correlation in output variations between neighboring stations. Conversely, stations geographically distant are influenced by divergent meteorological systems, resulting in relatively weaker output correlations. Constructing edge weights based on output correlation enables the GCN to effectively learn spatial coupling patterns both within and between sub-clusters, providing structural prior information for power correction.
Meanwhile, Transformer models demonstrate formidable capabilities in time series modeling through their self-attention mechanism. Unlike traditional recurrent neural networks constrained by sequence length and gradient propagation issues, Transformers flexibly capture both short-term and long-term temporal dependencies by computing attention weights between arbitrary time points, while assigning greater emphasis to critical periods [28]. In power forecasting correction tasks, Transformers efficiently model the temporal evolution patterns between historical prediction errors and actual output, identifying periodic, trend-based, or sudden error characteristics to dynamically refine initial forecast results.
This study organically integrates GCN with Transformer to construct a GCN-Transformer hybrid architecture that balances spatial correlation modelling with temporal dynamic perception capabilities, as illustrated in Figure 3. In the proposed model, two GCN layers first extract spatial features from the input historical power sequence: each power plant is treated as a node in a graph, with edges constructed based on predefined topological relationships reflecting output correlations. The GCN aggregates information from neighboring nodes through a message-passing mechanism, capturing collaborative output patterns within and across subclusters to generate node embeddings that embody spatial dependencies. Subsequently, these embeddings are linearly mapped to expand into the prediction time dimension, and learnable node position encodings are introduced as input to the Transformer encoder. Notably, by treating the prediction stride as the Transformer’s feature dimension, the multi-head self-attention mechanism models long- and short-term dependencies across time, effectively capturing the temporal evolution patterns and error propagation characteristics within the prediction sequence. To further enhance the model’s nonlinear fitting capability, a residual-connected feedforward correction module is introduced on top of the Transformer encoder output: the encoder output undergoes two layers of linear transformations and activation functions before being added to the original input, forming a residual structure that stabilizes the training process and improves prediction accuracy. The entire architecture omits a decoder structure, instead achieving end-to-end sequence-to-sequence correction through a pure encoder approach. This design not only overcomes the fragmentation issues in spatio-temporal coupling modeling found in traditional methods but also synchronously integrates two critical types of information during the correction phase: the spatial output correlations within sub-clusters and the temporal autocorrelations. This significantly improves the accuracy and robustness of cluster-level power forecasting.
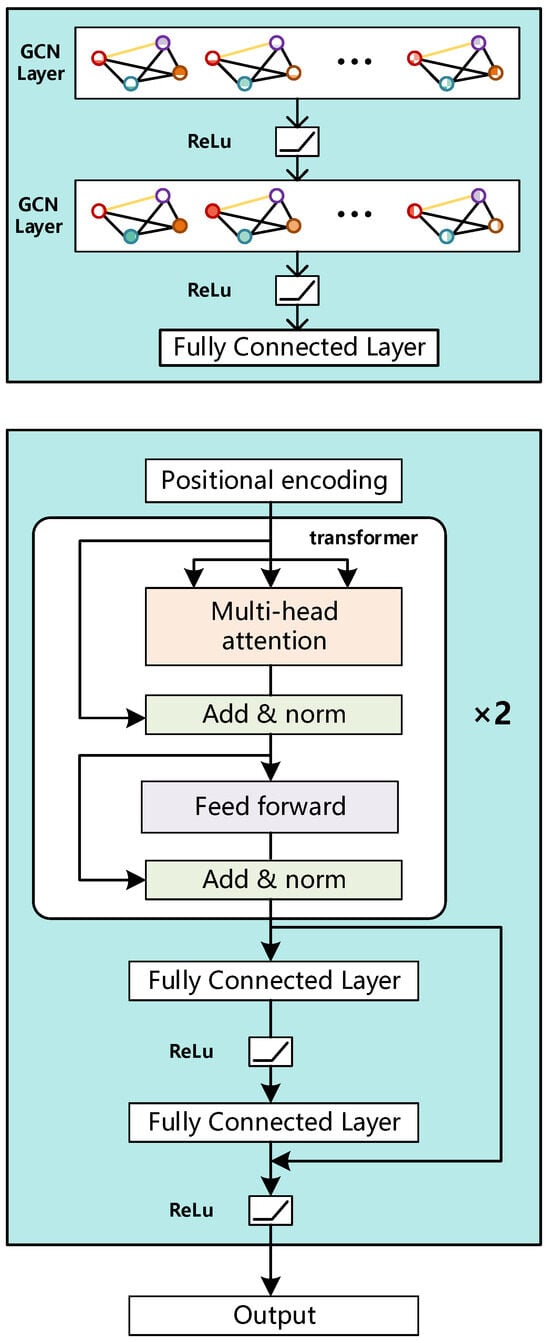
Figure 3.
The GCN-Transformer Hybrid Architecture.
3. Results
3.1. Data Description and Implementation Details
This paper utilizes data from a wind and solar power plant cluster in a region of China. The cluster comprises seven photovoltaic (PV) power plants and seven wind power plants. The PV plants are sequentially named PV1, PV2,…, PV7, while the wind plants are named W1, W2,…, W7. The data covers the period from 1 January 2023, to 31 December 2024, with a time resolution of 15 min. The dataset includes actual power generation output and measured meteorological parameters alongside Numerical Weather Prediction (NWP) values for each power plant at every timestamp. Meteorological parameters for wind power plants comprise temperature, humidity, wind speed, wind direction, and atmospheric pressure. For photovoltaic power plants, these parameters include irradiance, temperature, humidity, wind speed, wind direction, and atmospheric pressure.
Considering the three-stage photovoltaic-wind cluster daily power generation forecasting and correction method proposed herein, the corresponding dataset has been divided into three parts. Three-fold time series cross-validation is introduced to enhance model generalization capability: the dataset spanning 1 January 2023 to 31 December 2023 is first utilized for power station sub-cluster partitioning; Following segmentation, three-fold cross-validation is applied to each sub-cluster to train single-site multi-task learning prediction models. The 2023 data is sequentially divided into three mutually exclusive subsets (Subset 1: January–April; Subset 2: May–August; Subset 3: September–December). Two subsets are successively employed as the training set, with one subset serving as the validation set. After three iterative training cycles, the validation error was selected. Subsequently, the multi-task learning single-site model was employed to generate daily output forecasts for all power stations from 1 January 2024 to 31 December 2024. Subsequently, employing a dataset spanning 1 January 2024 to 31 December 2024 for training the cluster correction model, the same 3-fold time series cross-validation was applied to this phase’s dataset: the January-December 2024 data was sequentially divided into three blocks (Block 1: January–March, Block 2: April–June, Block 3: July–September). Two blocks were successively employed for training, with one block reserved for validation. The model demonstrating optimal performance on the validation set was ultimately selected as the final cluster correction model. Finally, the dataset covering the period from 1 October 2024 to 31 December 2024 was employed to test the performance of the cluster correction model. The input comprised single-station forecasts for this timeframe, while the output represented the corrected cluster daily output forecasts. Model performance was evaluated by calculating three metrics—MAE, RMSE, and R—through comparison with actual values.
This case study is based on Python 3.11 and implemented using the deep learning library PyTorch 2.6.0 + CUDA 11.8. All simulation experiments were conducted on a laptop equipped with an Intel Core i9-13980HX (2.50 GHz) CPU, NVIDIA RTX 4060 GPU, and 32 GB RAM.
3.2. Evaluation Indicators
The proposed method for forecasting and correcting daily power generation of photovoltaic-wind hybrid clusters involves evaluating both the effectiveness of subcluster clustering and the accuracy of power prediction results. Therefore, the Contour Coefficient and Within-Cluster Sum of Squares (WCSS) are employed to assess the clustering performance of the FCM algorithm. The shape coefficient (SC) is a metric for assessing clustering quality, measuring the separation of data points within the same cluster from other clusters. Its value ranges between −1 and 1, with values closer to 1 indicating better clustering performance. The shape coefficient is calculated as follows:
Here, n represents the total number of data points. denotes the average distance from sample i to other samples within the same cluster, reflecting intra-cluster compactness. denotes the average distance from sample i to the nearest sample in any other cluster, reflecting inter-cluster separation. The within-cluster sum of squares (WCSS) is another commonly used evaluation metric in cluster analysis. It is the sum of the squares of the Euclidean distances from each data point in all clusters to its respective cluster center (centroid). This metric measures the compactness of data points within each cluster in a clustering result. A smaller value indicates greater similarity among samples within each cluster, signifying better clustering performance. The WCSS formula is as follows:
Here, k denotes the number of clusters, represents all data points within the i-th cluster, and is the centroid of the i-th cluster.
The power prediction results were evaluated using the Mean Absolute Error (MAE), Root Mean Square Error (RMSE), and Pearson correlation coefficient (R), with the calculation formulas as follows:
Here, p denotes the predicted power, denotes the actual power, denotes the predicted power mean value, denotes the average value of the actual power and T represents the computational time period.
3.3. Formatting of Mathematical Components
Based on the framework proposed in this paper, we first construct the output similarity matrix for the target wind-solar cluster. The row vector of F represents the eigenvector of power plant i. Each element of the eigenvector includes the coefficient of variation in power output , the coefficient of variation of key meteorological elements , the Spearman rank correlation coefficient between power outputs of all power stations , and the Spearman rank correlation coefficient between key meteorological elements of all power stations . To account for the inherent output pattern differences between wind and solar power, an additional label is assigned to each power plant: wind plants are marked as 1, and solar plants as 0. The final output similarity characteristic matrix F for all power plants is 14 × 31 in shape, as shown in Figure 4.
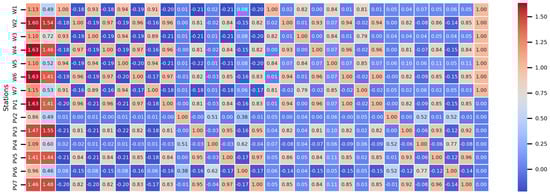
Figure 4.
Similarity Matrix of Power Plant Output Characteristics F.
After calculating the similarity characteristic matrix F for each power plant’s output, the FCM clustering algorithm was applied to the 14 power plants based on matrix F to perform sub-cluster partitioning. The initial parameters for FCM were set as follows: the number of clusters K was iterated from 2 to 10 to identify the optimal clustering number; the fuzzy index m used the standard common value of 2; the convergence threshold e = 1 × 10⁻⁵; and the maximum iteration count T = 100. Given that SC primarily assesses the degree of separation between a given cluster and others, while WCSS principally reflects the compactness of data within clusters, we normalize both metrics before applying equal weighting (0.5 each) to produce a composite score. This balanced approach considers both inter-cluster separation and intra-cluster compactness, enabling the selection of the optimal number of clusters K. The evaluation metrics and corresponding scores for different numbers of clusters are presented in Figure 5 and Table 1.
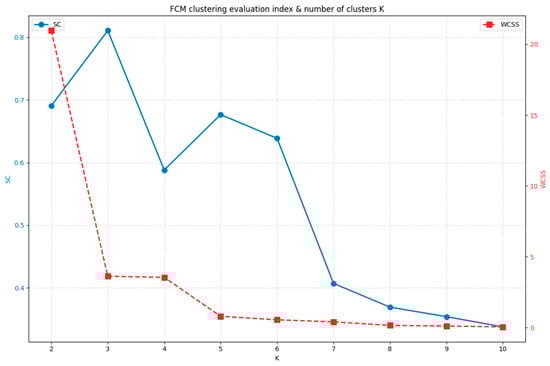
Figure 5.
Evaluation Metrics Chart for Different Cluster Numbers.

Table 1.
Evaluation Metrics and Score Results for Different Cluster Numbers.
Based on the comprehensive evaluation, the optimal number of clusters is determined to be 3. Power plants are thus categorized into three sub-clusters according to their output characteristics: PV2, PV4, and PV6 belong to the first sub-cluster (cluster 0); W1, W3, W5, and W7 belong to the second sub-cluster (cluster 1); while W2, W4, W6, PV1, PV3, PV5, and PV7 belong to the third sub-cluster (cluster 2). The validity of the subcluster classification results must be verified not only through clustering metrics but also during subsequent power forecasting and prediction refinement steps.
3.4. Single-Site Power Output Forecasting Within Sub-Clusters Based on BiLSTM Model and Multi-Task Learning Approach
After obtaining the subcluster divisions, a single-site power forecasting model based on the BiLSTM model and multi-task learning methods is constructed for all power stations within each subcluster. Specifically, for the first sub-cluster containing three PV power stations, three task heads are set with input features including forecasted irradiance, forecasted temperature, forecasted humidity, forecasted wind speed, forecasted wind direction, and forecasted air pressure. The second sub-cluster comprises four wind power stations. Similarly to the first sub-cluster, the input features exclude forecasted irradiance. For the third sub-cluster, comprising seven power plants (both PV and wind), separate single-site power prediction models were trained for wind and PV due to differing input features. Task heads were configured based on the respective numbers of each plant type. Thus, training only four single-site power prediction models across the three sub-clusters significantly reduced the computational load compared to training 14 separate models for each plant.
To validate the effectiveness of multi-task learning, while keeping all other conditions identical except for the multi-task learning approach, one power plant was randomly selected from each of the first and second sub-clusters. Additionally, one PV and one wind power plant were randomly selected from the third sub-cluster to train conventional single-site power prediction models based on the BiLSTM model for comparative verification. The results are shown in Figure 6, Figure 7, Figure 8 and Figure 9 and Table 2.
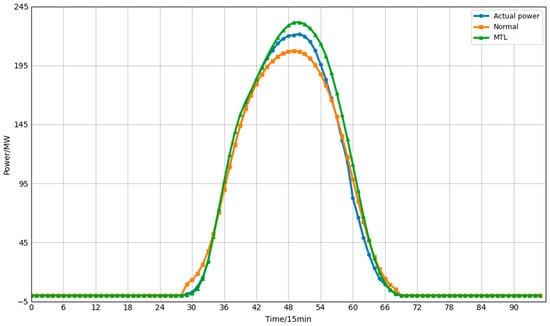
Figure 6.
Forecast results under the PV6 multi-task learning framework.
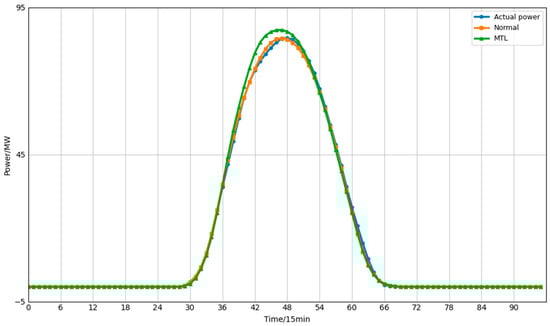
Figure 7.
Forecast results under the PV7 multi-task learning framework.
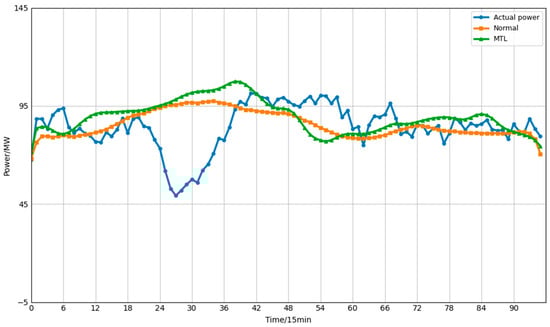
Figure 8.
Forecast results under the W5 multi-task learning framework.
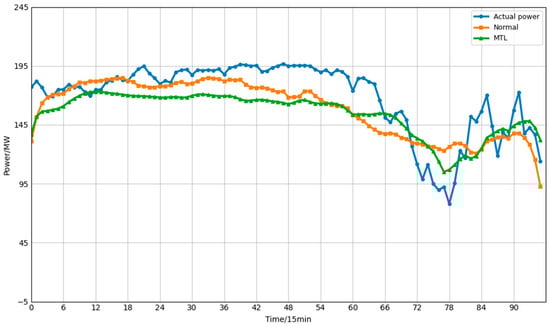
Figure 9.
Forecast results under the W6 multi-task learning framework.
Table 2.
Accuracy Results for Single-Site Power Forecasting.
Cross-validation results indicate that, across all folds, the MTL approach demonstrates superior overall performance compared to conventional single-site forecasting models for the selected power plant metrics. This effectively enhances prediction accuracy, validating the efficiency and versatility of the multi-task learning paradigm in power forecasting. Concurrently, we observed marginal performance declines in certain validation sets (e.g., specific folds). For instance, in Fold 1 of W5, the MTL model’s Mean Absolute Error (MAE) of 14.5436 slightly exceeded that of the conventional method (13.382). This phenomenon may stem from negative transfer issues inherent in multi-task learning: variations in data distributions across different power plants may cause the model to incorporate irrelevant or conflicting information when sharing features, temporarily degrading performance for certain tasks (power plants). Despite this marginal accuracy loss in specific validation sets, MTL’s comprehensive advantages in enhancing predictive performance and scalability confer significant practical value in engineering applications. Regarding performance enhancement, the overall reduction in mean error and improvement in goodness-of-fit demonstrated by the experimental results prove that MTL can effectively utilize shared information across multiple tasks to enhance the model’s generalization capability. Regarding scalability, MTL achieves shared underlying feature representations, enabling a single unified model to perform forecasting tasks across multiple power stations simultaneously. This substantially reduces the number of models, training overhead, and maintenance costs. In contrast, conventional single-site methods require separate model training for each station, imposing greater computational and management burdens in large-scale applications. In summary, multi-task learning strikes a favourable balance between predictive performance and engineering efficiency, offering a more practical solution for large-scale photovoltaic and wind power forecasting.
3.5. Correction Result of Clustered Power Generation Forecast Results Based on the GCN-Transformer Model
After obtaining the preliminary power prediction results for each power plant, aggregate the preliminary power prediction results within each sub-cluster to derive the preliminary power prediction results for each sub-cluster. Construct a cluster power generation prediction correction model based on the GCN-Transformer architecture, utilizing the spatio-temporal correlation between outputs across sub-clusters to refine the preliminary power prediction results for each sub-cluster. The correction model takes the preliminary power forecasts of each sub-cluster as input and outputs the corrected power forecasts for each sub-cluster. The parameters of the adopted GCN-Transformer model are shown in Table 3.
Table 3.
Parameters of the GCN-Transformer model employed.
To validate the effectiveness of the GCN-Transformer model employed herein in refining prediction outcomes by leveraging spatio-temporal correlations between sub-cluster outputs, ablation studies and comparative experiments were conducted. The comparative model directly predicts total sub-cluster output using GCN architectures [29,30]. The GCN model, widely applied and demonstrated to yield favourable outcomes in numerous studies, serves as the state-of-the-art benchmark for evaluating the efficacy of our proposed prediction architecture. The experimental setup is detailed as follows:
Benchmark 1: Remove the transformer layer and employ a correction model based on GCN-based cluster power generation prediction results;
Benchmark Method 2: Remove the GCN layer and employ a correction model based on transformer-based cluster power generation prediction results;
Benchmark Method 3: Do not correct the preliminary power prediction results of each sub-cluster.
Benchmark Method 4: Directly predicting the total output of sub-clusters using the GCN-LSTM model.
All experiments calculated the prediction accuracy for each sub-cluster and the total cluster output prediction accuracy, with results shown in Figure 10, Figure 11, Figure 12 and Figure 13 and Table 4, Table 5, Table 6 and Table 7.
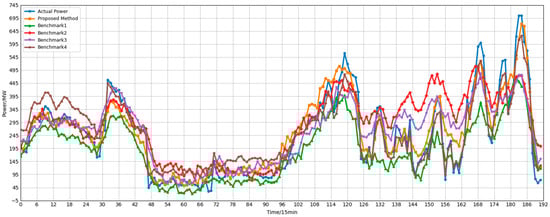
Figure 10.
Power forecast results after correction for the first-category sub-cluster (cluster 0).
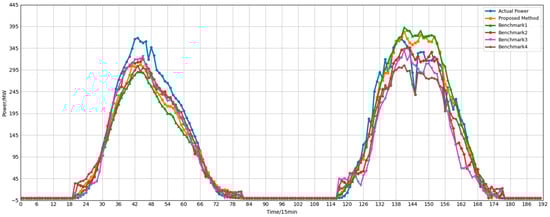
Figure 11.
Power forecast results after correction for the second-category sub-cluster (cluster 1).
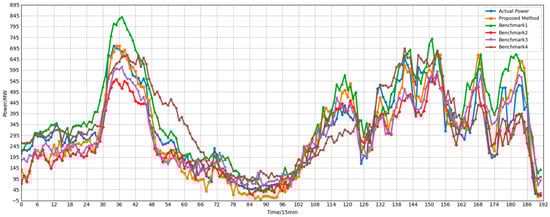
Figure 12.
Power forecast results after correction for the third-category sub-cluster (cluster 2).
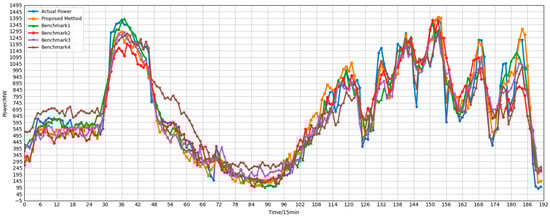
Figure 13.
Overall cluster-wide corrected power forecast results.
Table 4.
Accuracy results for cluster 0 output forecasting.
Table 5.
Accuracy results for cluster 1 output forecasting.
Table 6.
Accuracy results for cluster 2 output forecasting.
Table 7.
Accuracy results for all output forecasting.
Experimental results demonstrate that the proposed method achieves optimal performance across all subclusters. Taking Cluster0 as an example, the proposed model achieves RMSE and MAE of 66.98 and 50.80, respectively, representing reductions of 23.29 and 18.3 compared to Benchmark 3. The R-squared value reaches 0.9376, significantly outperforming approaches using only GCN (R = 0.9408 but RMSE = 87.34) or only Transformer (R = 0.8910). Notably, although Benchmark 1 achieved a slightly higher R, its RMSE and MAE were significantly worse than the proposed method, indicating that relying solely on spatial modeling is insufficient to fully capture complex temporal dynamics. In Cluster 1, characterized by strong periodicity, the proposed method achieved an R-squared value of 0.9835 with an RMSE of only 24.3095—a reduction of 9.3712 compared to Benchmark 3—further validating the model’s precise fitting capability in highly predictable scenarios. For the highly volatile Cluster 2, the proposed method still maintains the lowest RMSE (89.8911), approximately 17.73 lower than the uncorrected approach, demonstrating excellent robustness.
Overall, both Benchmark 1 and Benchmark 2 underperform compared to the proposed method in this paper, indicating that modeling either spatial or temporal dependencies alone results in information loss. The poor performance of Benchmark 3 further highlights the necessity of the prediction correction step. These results conclusively demonstrate that GCNs effectively capture spatial correlations among sub-clusters, while Transformers excel at modeling long-term temporal dependencies. Their synergistic integration significantly enhances the accuracy and stability of cluster power generation forecasting. Consequently, the proposed GCN-Transformer correction model exhibits distinct advantages in fusing spatiotemporal features, providing an effective technical pathway for large-scale renewable energy cluster power forecasting.
4. Discussion
To address the shortcomings of existing wind–solar cluster power forecasting methods—namely, their failure to analyze and utilize the output similarity characteristics between wind and solar power stations and their inadequate adaptability to complex scenarios involving stations with differing output profiles within the cluster—this paper proposes a day-ahead power forecasting and correction method for wind-solar clusters based on output similarity clustering. The proposed method integrates the strengths of three mainstream cluster output forecasting approaches. Building upon the spatio-temporal correlation established by existing methodologies, it further leverages the output similarity characteristics across different power stations to enhance forecasting accuracy. This method constructs a feature matrix of output similarity characteristics within the cluster to perform sub-cluster clustering of regional power plants. Based on this, a dual-layer BiLSTM architecture is developed to support multi-task learning and incorporates an adaptive weighting strategy based on task uncertainty, enabling the prediction of single-site output for multiple power plants within the clustered sub-clusters. Furthermore, the GCN-Transformer model is utilized to fully leverage the spatiotemporal correlation characteristics between sub-clusters, thereby refining the prediction results and enhancing accuracy. Case studies demonstrate that ablation experiments show the proposed method achieves significant improvements in key metrics including MAE, RMSE, and R, validating its effectiveness in enhancing the overall output prediction accuracy of wind-solar clusters.
The wind-solar cluster power forecasting method proposed in this study still has room for improvement. Future research directions include the following:
- (1)
- Existing cluster partitioning methods primarily rely on static similarity analysis of historical data, making it difficult to capture the dynamic evolution of wind-solar power plant output characteristics. Future work could explore theories and methods for dynamic, adaptive sub-cluster partitioning under specific scenarios.
- (2)
- While current purely data-driven models can fit complex output patterns using massive datasets, they inadequately characterize the underlying physical mechanisms. Future efforts should explore deep integration between physical mechanisms and data-driven approaches.
- (3)
- This study primarily focuses on analyzing the data from the single regional wind-solar power station cluster employed herein. The generalizability of the proposed technique to larger-scale clusters or regions with differing climatic characteristics remains to be experimentally verified.
Author Contributions
Conceptualization, J.J. and Y.H.; methodology, J.J.; software, Y.Z.; validation, J.Y., Z.L. (Zhiwei Lv) and H.D.; formal analysis, Z.L. (Zifan·Liu); investigation, J.Y. and Z.L. (Zifan·Liu); resources, J.J.; data curation, Y.H.; writing—original draft preparation, Y.Z.; writing—review and editing, H.D. and Y.H.; visualization, Z.L. (Zhiwei Lv); supervision, J.J., Y.H. and Z.Z.; project administration, J.J.; funding acquisition, J.J. All authors have read and agreed to the published version of the manuscript.
Funding
This research received no external funding.
Data Availability Statement
The data presented in this study are available on request from the corresponding author due to privacy restriction.
Conflicts of Interest
Authors Jianhong Jiang, Yi He, Jian Yan, Zhiwei Lv and Zifan Liu were employed by the company POWERCHINA Chengdu Engineering Corporation Limited. The remaining authors declare that the research was conducted in the absence of any commercial or financial relationships that could be construed as a potential conflict of interest.
References
- Zhang, Y.; Pan, Z.; Wang, H.; Wang, J.; Zhao, Z.; Wang, F. Achieving wind power and photovoltaic power prediction: An intelligent prediction system based on a deep learning approach. Energy 2023, 283, 129005. [Google Scholar] [CrossRef]
- Hou, Q.; Du, E.; Zhang, N.; Kang, C. Impact of high renewable penetration on the power system operation mode: A data-driven approach. IEEE Trans. Power Syst. 2020, 35, 731–741. [Google Scholar] [CrossRef]
- Wang, F.; Xuan, Z.; Zhen, Z.; Li, K.; Wang, T.; Shi, M. A day-ahead PV power forecasting method based on LSTM-RNN model and time correlation modification under partial daily pattern prediction framework. Energy Convers. Manag. 2020, 212, 112766. [Google Scholar] [CrossRef]
- Dai, H.; Zhen, Z.; Wang, F.; Lin, Y.; Xu, F.; Duić, N. A short-term PV power forecasting method based on weather type credibility prediction and multi-model dynamic combination. Energy Convers. Manag. 2025, 326, 119501. [Google Scholar] [CrossRef]
- Xu, H.; Zhang, Y.; Zhen, Z.; Xu, F.; Wang, F. Adaptive Feature Selection and GCN With Optimal Graph Structure-Based Ultra-Short-Term Wind Farm Cluster Power Forecasting Method. IEEE Trans. Ind. Appl. 2023, 60, 1804–1813. [Google Scholar] [CrossRef]
- Li, Z.; Ye, L.; Song, X.; Luo, Y.; Pei, M.; Wang, K.; Yu, Y.; Tang, Y. Heterogeneous Spatiotemporal Graph Convolution Network for Multi-Modal Wind-PV Power Collaborative Prediction. IEEE Trans. Power Syst. 2024, 39, 5591–5608. [Google Scholar] [CrossRef]
- Qiu, L.; Ma, W.; Feng, X.; Dai, J.; Dong, Y.; Duan, J.; Chen, B. A hybrid PV cluster power prediction model using BLS with GMCC and error correction via RVM considering an improved statistical upscaling technique. Appl. Energy 2024, 359, 122719. [Google Scholar] [CrossRef]
- Hodge, B.-M.; Martinez-Anido, C.B.; Wang, Q.; Chartan, E.; Florita, A.; Kiviluoma, J. The combined value of wind and solar power forecasting improvements and electricity storage. Appl. Energy 2018, 214, 1–15. [Google Scholar] [CrossRef]
- Chen, Y.; Xiao, J.-W.; Wang, Y.-W.; Li, Y. Regional wind-photovoltaic combined power generation forecasting based on a novel multi-task learning framework and TPA-LSTM. Energy Convers. Manag. 2023, 297, 117715. [Google Scholar] [CrossRef]
- Liang, J.; Tang, W. Ultra-Short-Term Spatiotemporal Forecasting of Renewable Resources: An Attention Temporal Convolutional Network-Based Approach. IEEE Trans. Smart Grid 2022, 13, 3798–3812. [Google Scholar] [CrossRef]
- Ge, C.; Yan, J.; Zhang, H.; Li, Y.; Wang, H.; Liu, Y. Joint short-term power forecasting of hydro-wind-photovoltaic considering spatiotemporal delay of weather processes. Renew. Energy 2024, 237, 121679. [Google Scholar] [CrossRef]
- Wang, H.; Yan, J.; Zhang, J.; Liu, S.; Liu, Y.; Han, S.; Qu, T. Short-term integrated forecasting method for wind power, solar power, and system load based on variable attention mechanism and multi-task learning. Energy 2024, 304, 132188. [Google Scholar] [CrossRef]
- Wang, D.; Yang, M.; Zhang, W.; Ma, C.; Su, X. Short-term power prediction method of wind farm cluster based on deep spatiotemporal correlation mining. Appl. Energy 2025, 380, 125102. [Google Scholar] [CrossRef]
- Qiu, Z.; Tian, Y.; Luo, Y.; Gu, T.; Liu, H. Wind and Photovoltaic Power Generation Forecasting for Virtual Power Plants Based on the Fusion of Improved K-Means Cluster Analysis and Deep Learning. Sustainability 2024, 16, 10740. [Google Scholar] [CrossRef]
- Peng, S.; Liao, H.; Liu, Y.; Ouyang, W.; Li, C.; He, S. State Monitoring and Fault Detection of GIS Isolation Disconnector Based on Spearman Rank Correlation Coefficient. In Proceedings of the 2023 3rd International Conference on Electrical Engineering and Control Science (IC2ECS), Hangzhou, China, 29–31 December 2023; pp. 1270–1273. [Google Scholar]
- Qais, M.H.; Loo, K.H.; Liu, J.; Lai, C.-M. Least Mean Square-Based Fuzzy c-Means Clustering for Load Recognition of Induction Heating. IEEE Trans. Instrum. Meas. 2022, 71, 9005510. [Google Scholar] [CrossRef]
- Sander, J.; Ester, M.; Kriegel, H.-P.; Xu, X. Density-based clustering in spatial databases: The algorithm GDBSCAN and its applications. Data Min. Knowl. Discov. 1998, 2, 169–194. [Google Scholar] [CrossRef]
- Johnson, S.C. Hierarchical clustering schemes. Psychometrika 1967, 32, 241–254. [Google Scholar] [CrossRef]
- Hartigan, J.A.; Wong, M.A. Algorithm AS 136: A K-means clustering algorithm. Appl. Stat. 1979, 28, 100–108. [Google Scholar] [CrossRef]
- Dunn, J.C. A fuzzy relative of the ISODATA process and its use in detecting compact well-separated clusters. J. Cybern. 1973, 3, 32–57. [Google Scholar] [CrossRef]
- Bezdek, J.C.; Full, W.; Ehrlich, R. FCM: The fuzzy C-means clustering algorithm. Comput. Geosci. 1984, 10, 191–203. [Google Scholar] [CrossRef]
- Vandenhende, S.; Georgoulis, S.; Van Gansbeke, W.; Proesmans, M.; Dai, D.; Van Gool, L. Multi-Task Learning for Dense Prediction Tasks: A Survey. IEEE Trans. Pattern Anal. Mach. Intell. 2022, 44, 3614–3633. [Google Scholar] [CrossRef]
- Kendall, A.; Gal, Y.; Cipolla, R. Multi-task learning using uncertainty to weigh losses for scene geometry and semantics. In Proceedings of the IEEE Conference on Computer Vision and Pattern Recognition, Salt Lake City, UT, USA, 18–22 June 2018. [Google Scholar]
- Chen, Z.; Badrinarayanan, V.; Lee, C.-Y.; Rabinovich, A. Gradnorm: Gradient normalization for adaptive loss balancing in deep multitask networks. In Proceedings of the 35th International Conference on Machine Learning, Stockholm, Sweden, 10–15 July 2018. [Google Scholar]
- Liu, S.; Johns, E.; Davison, A.J. End-to-end multi-task learning with attention. In Proceedings of the IEEE/CVF Conference on Computer Vision and Pattern Recognition, Long Beach, CA, USA, 15–20 June 2019. [Google Scholar]
- Sener, O.; Koltun, V. Multi-task learning as multi-objective optimization. In Proceedings of the 32nd International Conference on Neural Information Processing Systems, Montréal, QC, Canada, 3–8 December 2018. [Google Scholar]
- Wang, F.; Chen, P.; Zhen, Z.; Yin, R.; Cao, C.; Zhang, Y.; Duić, N. Dynamic spatio-temporal correlation and hierarchical directed graph structure based ultra-short-term wind farm cluster power forecasting method. Appl. Energy 2022, 323, 119579. [Google Scholar] [CrossRef]
- Qu, K.; Si, G.; Shan, Z.; Wang, Q.; Liu, X.; Yang, C. Forwardformer: Efficient Transformer with Multi-Scale Forward Self-Attention for Day-Ahead Load Forecasting. IEEE Trans. Power Syst. 2024, 39, 1421–1433. [Google Scholar] [CrossRef]
- Yang, C.; Li, S.; Gou, Z. Spatiotemporal prediction of urban building rooftop photovoltaic potential based on GCN-LSTM. Energy Build. 2025, 334, 115522. [Google Scholar] [CrossRef]
- Yang, M.; Huang, Y.; Guo, Y.; Zhang, W.; Wang, B. Ultra-short-term wind farm cluster power prediction based on FC-GCN and trend-aware switching mechanism. Energy 2024, 290, 130238. [Google Scholar] [CrossRef]
Disclaimer/Publisher’s Note: The statements, opinions and data contained in all publications are solely those of the individual author(s) and contributor(s) and not of MDPI and/or the editor(s). MDPI and/or the editor(s) disclaim responsibility for any injury to people or property resulting from any ideas, methods, instructions or products referred to in the content. |
© 2026 by the authors. Licensee MDPI, Basel, Switzerland. This article is an open access article distributed under the terms and conditions of the Creative Commons Attribution (CC BY) license.