Abstract
This paper proposes a symmetrized extrinsic information transfer (S-EXIT) chart analysis for probabilistic shaped (PS) systems to optimize the joint decoding of low-density parity-check (LDPC) codes and constant composition distribution matchers (CCDMs). A major challenge in analyzing PS systems is the non-uniform channel input caused by shaping, which invalidates the all-zero assumption of traditional EXIT charts, coupled with the three-node structure of the joint decoder (variable nodes, check nodes, and shaping nodes) that exceeds the two-decoder framework of conventional EXIT analysis. To resolve these issues, we first prove the symmetry of the joint decoder and introduce a “symmetrized density” transformation to render the channel output symmetric, thereby enabling the extension of EXIT chart analysis to PS systems. We then approximate the EXIT function of the shaping node decoder via polynomial fitting and integrate it with the variable node decoder into a unified model (VSND) for threshold analysis. On one hand, the proposed S-EXIT chart provides a theoretical threshold for the joint decoder, which is crucial for guiding system design. On the other hand, it enables the joint optimization of LDPC code rates and CCDM rates, unlocking additional performance gains. Simulations over additive white Gaussian noise (AWGN) channels demonstrate that short-blocklength CCDMs (e.g., blocklength 20) achieve up to 1.2 dB gain over uniform systems via S-EXIT-based rate optimization. This work addresses the performance limitations of short-blocklength CCDMs in high-speed optical transmissions, offering a practical and efficient analytical tool for PS system design.
1. Introduction
Probabilistic shaping (PS) has been well-studied in optical communications due to its ability to close the 1.53 dB shaping gap [1] in the linear regime. Recently, one of the most popular PS techniques is probabilistic amplitude shaping (PAS) [2]. It realizes an adaptable rate without modifying the forward error correction (FEC) code.
The constant-composition distribution matcher (CCDM) has been widely employed as a shaper for PAS in optical transmission systems. As a fixed-length, invertible distribution matcher (DM), it has been demonstrated to be capacity-achieving. Nevertheless, in order to maximize its performance in the linear regime, the block length of the CCDM must be sufficiently long. This could potentially impede the parallelism of high-speed optical transmissions [3].
In fact, PAS can be considered serial-concatenated coding, where the CCDM and FEC codes serve as outer and inner codes, respectively. Ref. [4] proposes to introduce CCDMs into the bipartite graphs of low-density parity-check (LDPC) codes as shaping nodes. Through this process, LDPC codes with CCDMs can be jointly decoded using message-passing algorithms [5] in order to achieve higher performance. It shows that joint decoding can achieve up to 1 dB gain compared to one-pass decoding.
An analytical tool is important for decoders. It helps predict the threshold and optimize the coding rate. Built upon [4], we present an analytical tool for joint decoding in this paper. Usually, extrinsic information transfer (EXIT) chart analysis [6] is used to analyze LDPC codes. However, because the channel has non-uniform input due to shaping, the all-zero assumption cannot be applied directly. The joint decoder comprises three types of decoders, whereas the EXIT charts consider only two. This means the EXIT chart analysis cannot be directly applied to joint decoding.
In this paper, we propose the use of symmetrized extrinsic information transfer (S-EXIT) chart analysis [6] to analyze and optimize the rates of LDPC codes and CCDMs for joint decoding. Because the all-zero assumption can not be directly applied, after proving the symmetry of the joint decoder, we use the “symmetrized density” [7] to make the channel output-symmetric. Then, we approximate the EXIT function of the shaping node decoder via polynomial fitting and perform threshold analysis by combining it with the decoder for variable nodes into a single decoder. Simulation results over an additive white Gaussian noise (AWGN) channel verify our EXIT-chart analysis of the gain of joint decoding. In addition, after optimizing the parameters of CCDM and LDPC codes, short CCDMs with the proposed joint decoding provide up to 1.2 dB gain compared to uniform systems.
2. Background
2.1. Constant Composition Distribution Matcher
The Constant Composition Distribution Matcher (CCDM) is a type of distribution matcher that maps a fixed-length binary input sequence to a fixed-length magnitude output sequence. Notably, for -ary amplitude-shift keying (ASK) modulations, all CCDM outputs share the same composition , where , , denotes the number of occurrences of the i-th magnitude in the sequence [8].
The length of input bits depends on the number of output sequences with desired composition, which can be derived by using the multinomial coefficient
where is the length of the CCDM output.
Therefore, the input length is given as follows:
And the CCDM rate is as follows:
The rate loss is unavoidable in all finite-length CCDM [9,10], which is defined as follows:
where denotes the entropy of CCDM output and denotes the rate of CCDM. The rate loss asymptotically approaches 0 as the block length increases to infinity.
2.2. LDPC Codes and Bipartite Graphs
LDPC codes [11], first proposed by Gallager, are linear block codes described by an parity-check matrix H with entries , , , where . They are widely used in PAS systems.
The bipartite graph is a commonly employed visualization tool for LDPC codes. It is constructed from the parity-check matrix H of size , with variable nodes (VN) and check nodes (CN) represented as and , respectively. The connections between the variable nodes and check nodes are represented by a set of edges.
An example of a bipartite graph is shown in Figure 1. If the entry of the parity-check matrix H is one, then the check node should be connected to the variable node through the edge .
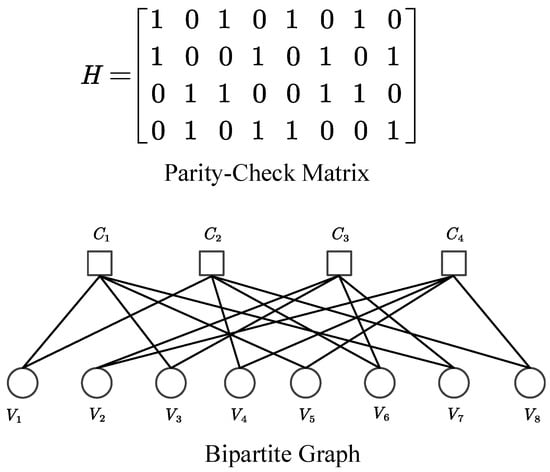
Figure 1.
A (8,4) LDPC code and its bipartite graph.
2.3. EXIT Chart of LDPC Codes
The EXIT chart is used to calculate the threshold of LDPC codes by tracking the Mutual Information (MI) exchanged between the VN decoder (VND) and the CN decoder (CND) [6]. Let be the MI passed from CND to VND, and be the MI emanating from VND. Assuming a channel with zero-mean Gaussian noise of variance , the EXIT function of a VN with degree can be expressed as follows:
where is the variance of the channel L-value, defined as in a binary channel. And functions and are given in the appendix of [6].
Similarly, let be the MI passed from VND to CND, and be the MI that came out of CND. Since the output MI of VND is the input MI of CND, it is rather convenient to plot the transfer curve of CND on the same axes as the VND transfer curve, with the abscissa and ordinate reversed. The inverse EXIT function of a CN with degree is then as follows:
2.4. Joint Message Passing Decoding for LDPC Codes with CCDMs
Joint decoding for LDPC codes with CCDMs uses a bipartite graph containing VNs , , CNs , , defined by LDPC codes, and shaping nodes (SNs) , defined by CCDM design. Assuming t CCDM codewords are encoded into a single LDPC codeword, each CCDM is viewed as an SN , . As illustrated in Figure 2, the SN is connected to the VN through edge if the code bit in the VN is the output of the k-th CCDM codeword. The update rule for SNs is weight decoding (WD), which has linear complexity and is obtained by exploiting the weight constraints of CCDM codewords. SNs update extrinsic information for VNs, thereby enabling joint decoding of LDPC codes and CCDMs via message-passing algorithms.

Figure 2.
Bipartite graph of an LDPC code with shaping nodes.
3. Symmetrized EXIT Chart Analysis for Joint Decoding
EXIT chart, as one of the performance analysis tools for LDPC iterative decoding, can be used to guide the parameter design and performance analysis of joint decoders. Compared with the traditional EXIT chart analysis of LDPC decoders, the joint decoding EXIT chart proposed in this paper is significantly different in two aspects. First, due to the shaping process, the channel input is non-uniformly distributed and does not satisfy input symmetry, which makes the all-zero assumption of the traditional EXIT chart inapplicable. Second, the extended bipartite graph of joint decoding has three nodes, whereas the EXIT chart supports iterative analysis of decoders only in a two-node structure. Therefore, this paper proposes using the symmetry of the joint decoder to transform the channel input into an all-zero equivalent using a symmetrized density and then performing EXIT-chart analysis. Subsequently, by equivalently combining the SN decoder (SND) and the VND into a single node, iterative analysis based on the extended bipartite graph is realized.
3.1. Symmetry Analysis for Joint Decoder
Because SND produces output for VND based on a message-passing algorithm, its symmetry can be proved following the symmetry of CND [12]. Recall that is the designed weight of the CCDM codeword. And w is the weight of the most likely codeword for , where represents the codeword bit after mapping. Under the assumption of CCDM containing all codewords that satisfy the weight constraint, the output LLR of SND for can be expressed as follows:
Because all codeword bits are independent, the output of SND for is as follows:
We can see from Equation (8) that SND satisfies the same symmetry condition as CND [12]. Note that the density of can be considered Gaussian, similar to the Gaussian assumption for CND [13].
3.2. EXIT Function for VND and CND
The output codewords of CCDMs are chosen with equal probability, allowing for the calculation of the prior possibility of each bit by enumerating all codewords. The 16-QAM BICM channel can be approximated to 4 equivalent binary Gaussian sub-channels, which can be used to construct bit-channels with input distribution , where and variance . Note that may vary due to the unequal error protection property of BICM. The mapping of to symbol is based on the standard mapping and . When or , the EXIT chart analysis is the same as that for uniform channels. Thus, we focus on cases where in the following analyses. Let be the channel output and be the L-value of , which can be calculated as follows:
which can be simplified to the following:
The variable is a random Gaussian distributed noise with mean zero and variance . Thus, is Gaussian distributed with for , where . The conditional probabilistic density function (PDF) of belonging to the L-value is denoted as follows:
For simplicity of notations, we write and as the PDF when and is transmitted, respectively. And the a priori knowledge of VN , can be written as follows:
And by replacing with , part (b) of Equation (12) becomes the following:
Substitute Equations (13) and (14) into Equation (15), we have the following:
where , defined as , is the PDF of the “symmetrized density”. The operational meaning behind is that, since the joint decoder is symmetric, we can match the channel input to all-zero by flipping the density associated with . In this way, the calculation of MI for any codeword is the same as that of the all-zero codeword.
The channel with PDF has a Gaussian-mixture distribution. It is approximated by an equivalent Gaussian distribution to facilitate the following analyses. Because is proven symmetric [7], the L-value of the equivalent Gaussian distribution satisfies the consistent-Gaussian assumption with distribution . Note that is computed numerically. To simplify our notations, from now on we use to represent the L-value of the “symmetrized density”. The a priori knowledge of VNs generalizes to the following:
Based on the independent message assumption, we can write the variance of the extrinsic output as . The extrinsic output of VNs can be written as follows:
Thus, we can write the variance of the extrinsic output as . The extrinsic output of VN can be written as follows:
Through the duality property [6], we can write the EXIT function of CND:
3.3. Symmetrized EXIT Chart Analysis
As shown in Figure 3, the SND is placed between VND and CND. A similar structure has been discussed in [6], where the authors conducted an EXIT chart analysis by combining the variable and detector nodes. In this paper, we perform an EXIT chart analysis of joint decoding by treating VND and SND as a single decoder, VSND. In this case, we view as the output of both SND and VSND.
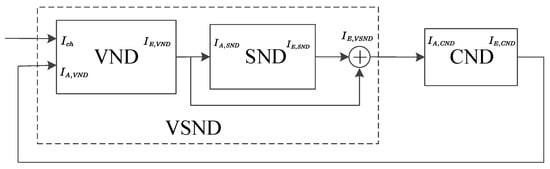
Figure 3.
EXIT chart analysis diagram of joint decoding.
To derive the EXIT function of VSND, first we need to write the output function of SND. Let be the MI passed from VND to SND. The output function of SND is defined as . Note that the function can be approximated by polynomial fitting. And the EXIT function of VSND can be written as follows:
The decoding trajectories of (dotted line) and (solid line) are shown in Figure 4, which represent the decoding process of LDPC codes with and without joint decoding, respectively. Because of the gain obtained from SND in each iteration, the EXIT function of VSND lies further above VND, which means the jointly decoded LDPC codes have a lower decoding threshold. By comparing the decoding thresholds of LDPC codes with and without joint decoding through the EXIT chart, the theoretical gain of joint decoding with a given CCDM can be obtained. The results will be presented in the next subsection.
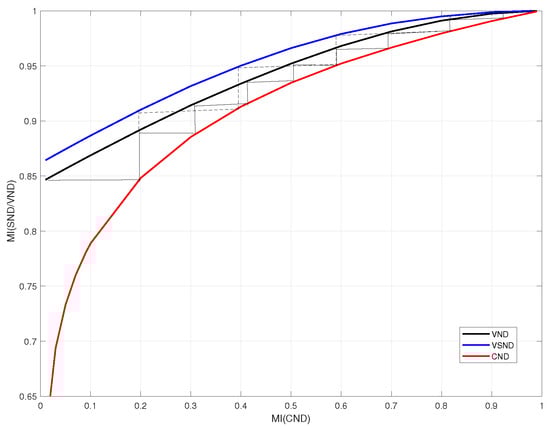
Figure 4.
Decoding trajectories of (dotted line) and (solid line).
3.4. Rate Optimization Based on S-EXIT Chart
The transmission rate of a shaped system depends on the shaping rate of CCDM and the coding rate of FEC. Thus, for a fixed transmission rate, the S-EXIT chart can be used to determine the optimal shaping and coding rates. This section introduces rate optimization of coding and shaping based on the S-EXIT chart.
The rate optimization of coding and shaping based on the S-EXIT chart is shown in Algorithm 1. It implements a rate-optimization framework that leverages S-EXIT (S-Exchange of Information) chart analysis for joint LDPC-CCDM system design. As illustrated in Algorithm 1, the input parameters include the total transmission rate , CCDM block length , and channel SNR. The initialization step creates an empty list to store candidate solutions comprising triplets . The core optimization loop iterates through values from 1 to , systematically exploring different rate configurations. In each iteration, the algorithm first calculates the CCDM rate using Equation (3) and updates the FEC rate based on the total rate constraint. The EXIT functions for both VND and SND are then computed, with the latter approximated via polynomial fitting. These decoder characteristics are combined into a unified VSND model. The CND EXIT function is subsequently derived, enabling comprehensive threshold analysis through EXIT chart traversal. All evaluated configurations are stored in , with incremented by 1 in each iteration. The final output provides the optimal LDPC code rate , corresponding CCDM rate , and minimal achievable SNR threshold that satisfies the convergence criterion. This method effectively balances the trade-off between coding gain and spectral efficiency through systematic EXIT-based analysis.
| Algorithm 1 Rate optimization based on S-EXIT chart |
| Require: Total transmission rate , CCDM length , channel SNR (dB) |
| Ensure: Optimal LDPC code rate , corresponding CCDM rate , lowest decoding threshold |
|
4. Numerical Simulations over AWGN Channel
Numerical simulations of PS-16-QAM transmission are conducted in this subsection. A family of progressive edge-growth (PEG) LDPC codes [14] with column weight three is used in simulations. The decoding algorithm employed is the Min-Sum algorithm [15] with a scaling factor of 0.65. The maximum iteration time is 500. The bit error rate (BER) is used as a performance metric.
4.1. Verification of S-EXIT Chart
The architecture of the PS scheme in simulations follows a cascaded and jointly optimized structure: the input information bits first enter the CCDM for shaping, where t CCDM codewords (each with fixed weight ) are combined to form the input sequence of a single LDPC codeword, with each CCDM corresponding to a shaping node (SN) in the joint decoding bipartite graph; the LDPC encoder then adds parity-check bits to the shaped sequence to form the final transmitted codeword, which is modulated into 16-QAM symbols and sent over the AWGN channel; at the receiver, after demodulation, the joint decoder operates based on an extended bipartite graph containing variable nodes (VNs) from LDPC codes, check nodes (CNs) from LDPC parity-check constraints, and shaping nodes (SNs) from CCDM weight constraints, where the SN decoder (SND) uses weight decoding (WD) with linear complexity to update extrinsic information for VNs, and the variable node decoder (VND) and SND are integrated into a unified VSND model via polynomial fitting to adapt to the two-decoder framework of EXIT chart analysis, enabling iterative message exchange between VSND and the CN decoder (CND) to achieve joint decoding of LDPC codes and CCDMs.
Table 1 shows the parameters of five transmission systems implemented in the following numerical simulations. CCDMs of various block lengths are employed to verify the gain of our proposed joint decoding. In this case, all systems have the same transmission rate 2 bits/symbol and we keep their source entropy fixed and adjust the FEC rate [16]. To compare their performance at the same capacity, note that the attenuation factor is chosen based on a series of simulations.

Table 1.
Parameters of four transmission systems implemented in the following numerical simulations.
To verify the accuracy of the EXIT chart, we set the maximum iteration time to 500 in the simulation and use PS1, PS2, PS3, and PS4 as examples. The thresholds obtained by EXIT chart and simulation are shown in Figure 5. The BMD rate with input entropy of 3.44, obtained at a spectrum efficiency of 2 bits/symbol, is added to the references as capacity.
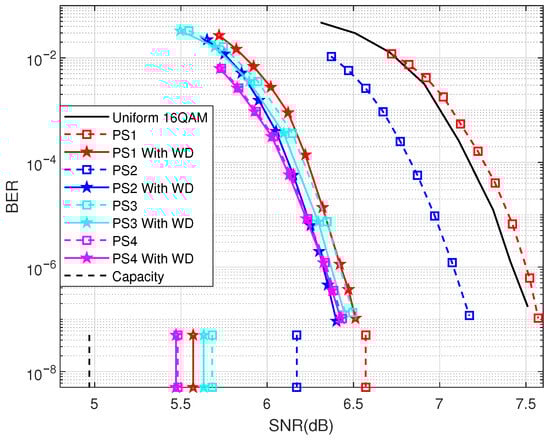
Figure 5.
Verification of the thresholds obtained from the EXIT chart.
It can be observed from Figure 5 that thresholds by the EXIT chart for PS2, PS2 with WD are 6.17 dB, 5.47 dB, respectively. Their thresholds, obtained from simulation at BER , are 7.17 dB and 6.4 dB, respectively. This means that by simulation and the EXIT chart with WD for PS2 are 0.77dB and 0.7dB, respectively. We summarize by simulation, and the EXIT chart for four PS systems in Table 2. We can see that by simulation coincides with by EXIT chart. This means that the proposed S-EXIT chart can help analyze the gain of joint decoding. Moreover, from the thresholds by the EXIT chart, it can be observed that the thresholds of PS2 with WD, PS5 with WD, and PS4 are approximately the same. This suggests that, for short CCDMs (block length of 20), the proposed joint decoding with WD can compensate for the performance degradation caused by rate loss, thus enabling the capacity to be approached without increasing the block length.
Table 2.
Comparison between the theoretical gain obtained from the EXIT chart and numerical simulations.
4.2. Verification of Code Optimization
In this section, we verify the code optimization in Algorithm 1. The CCDM length is set to 20. As shown in Figure 6, by performing a loop that iterates over the CCDM weight from 1 to 10 with 1 increments, the lowest decoding threshold is 5.4 dB. And the corresponding and are and, respectively.
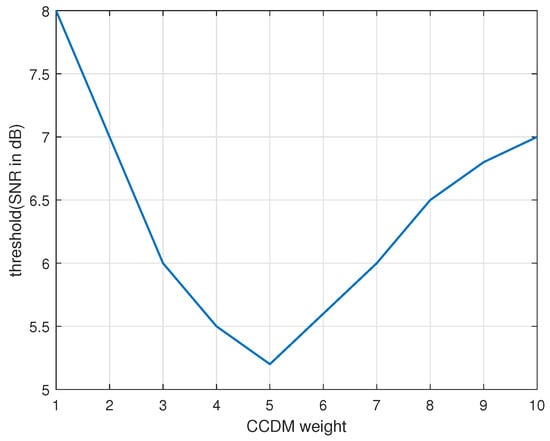
Figure 6.
Thresholds obtained from the S-EXIT chart.
In order to verify the optimization results, numerical simulations are performed. The detailed parameters are listed in Table 3.
Table 3.
Parameters of four transmission systems in the following code optimization simulation.
Figure 7 shows the results of 5 PS systems. It shows that PS6 with optimized and has the best performance, yielding gains of 0.2 dB, 0.8 dB, 0.5 dB, and 1.3 dB compared to PS2, PS5, PS7, and PS8, respectively, which coincides with the results of the S-EXIT chart.
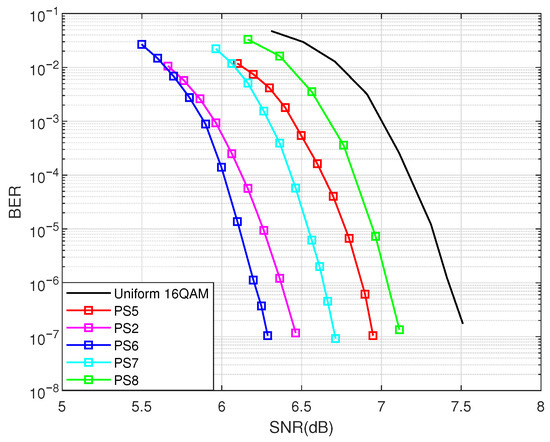
Figure 7.
Performance of various PS systems with different weight.
5. Conclusions
This paper proposes a symmetrized extrinsic information transfer (S-EXIT) chart framework. It targets the joint decoding of low-density parity-check (LDPC) codes and constant-composition distribution matchers (CCDMs) in probabilistic-shaped (PS) systems. The work addresses two key challenges of traditional EXIT charts in PS systems. First, shaping leads to a non-uniform channel input, invalidating the all-zero assumption. Second, the joint decoder has three node types (variable, check, shaping), whereas traditional EXIT charts support only two decoders.
Core innovations of the S-EXIT framework include three aspects. We prove the symmetry of the joint decoder. We introduce a “symmetrized density” transformation to make the channel output symmetric. We integrate the variable-node decoder (VND) and the shaping-node decoder (SND) into a unified model (VSND) using polynomial fitting.
The S-EXIT chart serves two practical purposes. It accurately predicts the decoding threshold of the joint LDPC-CCDM decoder, guiding system design. It enables joint optimization of LDPC code rates and CCDM rates. Numerical simulations over AWGN channels validate the framework. Short-blocklength CCDMs (e.g., block length of 20) achieve up to 1.2 dB gain compared to uniform systems. S-EXIT-predicted thresholds closely match simulation results, confirming reliability. Future work involves implementing the proposed joint decoding in non-binary codes and newer decoding strategies [17,18].
Author Contributions
Conceptualization, G.Y.; methodology, G.Y.; software, G.Y.; validation, F.Y.; formal analysis, G.Y.; investigation, F.Y.; resources, Y.L.; data curation, Y.L.; writing—original draft preparation, G.Y.; writing—review and editing, F.Y.; visualization, G.Y.; supervision, Y.L.; project administration, Y.L.; funding acquisition, Y.L. All authors have read and agreed to the published version of the manuscript.
Funding
This research was funded in part by the Fundamental Research Funds for the Central Universities under Grant CUC25BH14 and in part by the Beijing Natural Science Foundation under grant L259011.
Data Availability Statement
Data will be made available on request.
Conflicts of Interest
The authors declare no conflicts of interest.
References
- Böcherer, G.; Steiner, F.; Schulte, P. Bandwidth Efficient and Rate-Matched Low-Density Parity-Check Coded Modulation. IEEE Trans. Commun. 2015, 63, 4651–4665. [Google Scholar] [CrossRef]
- Wang, J.; Ren, J.; Liu, B.; Mao, Y.; Song, X.; Chen, S.; Tang, X.; Zhao, L.; Ullah, R. Rotated 8QAM probabilistic shaping scheme based on DM-OFDM-IM over an underwater magnetic induction communication system. Opt. Express 2025, 33, 23342–23357. [Google Scholar] [CrossRef] [PubMed]
- Liang, E.M.; Kahn, J.M. Probabilistic Shaping Distributions for Optical Communications. J. Lightw. Technol. 2025, 43, 1501–1524. [Google Scholar] [CrossRef]
- Luo, Y.; Huang, Q. Joint message passing decoding for LDPC codes with CCDMs. Opt. Lett. 2023, 48, 4933–4936. [Google Scholar] [CrossRef] [PubMed]
- Ryan, W.; Lin, S. Channel Codes: Classical and Modern; Cambridge University Press: Cambridge, UK, 2009. [Google Scholar]
- ten Brink, S.; Kramer, G.; Ashikhmin, A. Design of low-density parity-check codes for modulation and detection. IEEE Trans. Commun. 2004, 52, 670–678. [Google Scholar] [CrossRef]
- Mondelli, M.; Hassani, S.H.; Urbanke, R.L. How to Achieve the Capacity of Asymmetric Channels. IEEE Trans. Inf. Theory 2018, 64, 3371–3393. [Google Scholar] [CrossRef]
- Chen, B.; Liang, Z.; Lei, Y.; Deng, J.X.; Li, S.; Liga, G. On Shaping Gain of Multidimensional Constellation in Linear and Nonlinear Optical Fiber Channel. IEEE J. Sel. Areas Commun. 2025, 43, 1455–1468. [Google Scholar] [CrossRef]
- Schulte, P.; Böcherer, G. Constant Composition Distribution Matching. IEEE Trans. Inf. Theory 2016, 62, 430–434. [Google Scholar] [CrossRef]
- Hu, S.; Wang, H.; Semenov, S. Supporting Probabilistic Constellation Shaping in 5G-NR Evolution. IEEE Trans. Wirel. Commun. 2023, 23, 3586–3599. [Google Scholar] [CrossRef]
- Gallager, R. Low-density parity-check codes. IRE Trans. Inf. Theory 1962, 8, 21–28. [Google Scholar] [CrossRef]
- Richardson, T.J.; Urbanke, R.L. The capacity of low-density parity-check codes under message-passing decoding. IEEE Trans. Inf. Theory 2001, 47, 599–618. [Google Scholar] [CrossRef]
- Chung, S.-Y.; Richardson, T.J.; Urbanke, R.L. Analysis of sum-product decoding of low-density parity-check codes using a Gaussian approximation. IEEE Trans. Inf. Theory 2001, 47, 657–670. [Google Scholar] [CrossRef]
- Hu, X.-Y.; Eleftheriou, E.; Arnold, D.-M. Progressive edge-growth Tanner graphs. In Proceedings of the GLOBECOM’01. IEEE Global Telecommunications Conference (Cat. No.01CH37270), San Antonio, TX, USA, 25–29 November 2001; Volume 2, pp. 995–1001. [Google Scholar] [CrossRef]
- Chen, J.; Fossorier, M.P.C. Density evolution for two improved BP-Based decoding algorithms of LDPC codes. IEEE Commun. Lett. 2002, 6, 208–210. [Google Scholar] [CrossRef]
- Vassilieva, O.; Kim, I.; Ikeuchi, T. On the Fairness of the Performance Evaluation of Probabilistically Shaped QAM Signals. J. Lightw. Technol. 2020, 38, 3067–3073. [Google Scholar] [CrossRef]
- Touati, H.; de Lamare, R.C. Adaptive Reliability-Driven Conditional Innovation Decoding for LDPC Codes. IEEE Access 2025, 13, 203378–203390. [Google Scholar] [CrossRef]
- Kruglik, S.; Potapova, V.; Frolov, A. On Performance of Multilevel Coding Schemes Based on Non-Binary LDPC Codes. In Proceedings of the European Wireless 2018, 24th European Wireless Conference, Catania, Italy, 2–4 May 2018; pp. 1–4. [Google Scholar]
Disclaimer/Publisher’s Note: The statements, opinions and data contained in all publications are solely those of the individual author(s) and contributor(s) and not of MDPI and/or the editor(s). MDPI and/or the editor(s) disclaim responsibility for any injury to people or property resulting from any ideas, methods, instructions or products referred to in the content. |
© 2026 by the authors. Licensee MDPI, Basel, Switzerland. This article is an open access article distributed under the terms and conditions of the Creative Commons Attribution (CC BY) license.