Abstract
Multi-Object Tracking (MOT) remains a fundamental challenge in computer vision, with significant applications in autonomous systems, surveillance, and intelligent transportation. The Tracking-By-Detection (TBD) paradigm has achieved notable tracking accuracy; however, its performance is highly sensitive to low-confidence detections (e.g., partial occlusions or blurred objects). Existing methods, such as ByteTrack, utilize a dual-threshold strategy for the filtering of detections, but determining the optimal high-confidence threshold is computationally expensive and lacks robustness across different scenarios. In this study, we analyze the sensitivity of state-of-the-art (SOTA) TBD-based trackers to variations in the high-confidence threshold and introduce SolidTrack, an enhanced tracking algorithm integrating SOLIDER-ReID, a transformer-based re-identification model. Our approach mitigates the impact of threshold variations by improving feature extraction, particularly under challenging conditions such as low-confidence detections and occlusions. Experimental evaluations demonstrate that SolidTrack exhibits superior robustness across varying threshold settings. Additionally, SolidTrack achieves SOTA performance on the test sets of the MOT17 and MOT20 benchmarks, achieving an MOTA of 80.6, IDF1 of 80.0, and HOTA of 65.0 on MOT17 and an MOTA of 77.9, IDF1 of 77.5, and HOTA of 63.4 on MOT20.
1. Introduction
Multiple Object Tracking (MOT) is a well-established task in the field of computer vision, involving the identification and continuous tracking of the locations of multiple objects over time in a sequence of frames [1]. MOT has been used across various domains, including autonomous vehicles [2,3], surveillance and security [4], traffic management [5], and robotics [6]. In terms of the way of integrating detection and extracting features, there are two mainstream frameworks for MOT: Joint Detection and Embedding (JDE) [7,8] and Separate Detection and Embedding (SDE), which is a Tracking-By-Detection (TBD) model [9,10,11,12,13]. In JDE, detection and feature extraction for tracking are tightly integrated into a single process, allowing for faster processing by avoiding the need to run separate models for detection and appearance feature extraction. This approach reduces computational overhead but often compromises effectiveness to enhance efficiency (i.e., superior processing speed). SDE, on the other hand, is a methodology where detection and feature extraction for tracking occur sequentially, prioritizing effectiveness in complex situations (e.g., low-visibility and noisy environments) rather than processing speed. Specifically, the SDE approach breaks down the MOT task into two subtasks: (1) a Detection Task, which focuses on identifying and locating objects of interest within individual video frames, and (2) an Association Task, which involves assigning the detected objects to existing tracklets or starting/ending trajectories. In the Association Task, algorithms first calculate the similarity between detected bounding boxes and tracklets using either the motion model (which focuses on the similarity of positions and motion), the appearance model (which concentrates on the similarity of object appearance features), or a combination of the two. Based on this similarity matrix, the algorithms then assign detections to the corresponding tracklets. Considering the robust performance of the SDE algorithm and its widespread adoption in MOT applications, our research is dedicated to enhancing the tracking capabilities of the SDE method.
Despite the considerable progress made in the TBD domain, the tracking performance of current methods continues to be hindered by the impact of low-confidence detection boxes. If more low-confidence boxes are used in the downstream association task, tracking performance suffers due to incorrectly detected objects. Conversely, using fewer low-confidence boxes also diminishes performance due to missed detected objects. Consequently, managing the trade-off between true-positive (TP) and false-positive (FP) rates is critical in mitigating the impact of low-confidence detection boxes on tracking performance. Previous algorithms commonly set a single threshold to discard all low-confidence detection boxes [14,15,16]. However, this approach could result in irreversible errors, causing notable missed detections and tracking fragments. In response to this challenge, Zhang et al. [13] introduced ByteTrack, a framework that uses two thresholds to categorize detection boxes, denoted as and . For detections with confidence scores higher than , both the motion model and appearance model are used to compute the similarity matrix. For detections with confidence scores between and , only the motion model is used to compute the similarity matrix. Detections with confidence scores lower than are eliminated. This framework significantly enhances tracking performance by incorporating some low-confidence detections (e.g., occluded objects) that would otherwise be discarded in a single-threshold setting into the association process. However, we argue that , a sensitive hyperparameter requiring careful tuning in multi-object tracking tasks, is difficult to set in real-world scenarios. Firstly, finding the optimal value of is computationally expensive, necessitating extensive experimentation. Secondly, the optimal may not be applicable to real-world data samples due to differences in data distributions compared to the training data. Therefore, a method that is more robust to variations in is needed. Additionally, understanding the robustness of existing SOTA methods with respect to is crucial to better guide their application in real-world settings. Formally, this study was guided by the following two Research Questions:
- RQ1: How robust are the existing SOTA TBD methods to variations in threshold values?
- RQ2: To what extent do our proposed methods demonstrate greater robustness to variations in threshold values compared to existing SOTA TBD methods?
To answer the RQs, we initially replicated some SOTA TBD methods and conducted experiments on two widely used datasets (MOTChallenge [17,18]) in the MOT domain. We also reported the robustness to variations in . Additionally, we introduced a novel approach that integrates the SOLIDER-ReID model [19] into the MOT task to enhance robustness against changes in . Details are outlined in Section 3. Overall, this study provides the following key contributions and insights to the field of MOT:
- Robustness Analysis: We conducted extensive experiments on SOTA TBD methods, revealing how their performance varies with changes in , providing valuable insights into their robustness in dynamic environments.
- SolidTrack: We introduced SolidTrack, a novel approach, by integrating the SOLIDER-ReID model into the MOT task, which significantly enhances robustness against variations in , as demonstrated by improved experimental results.
- Performance on Benchmark Datasets: We achieved SOTA performance on the MOT17 and MOT20 test sets, showcasing the reliability and effectiveness of the proposed method in real-world tracking scenarios.
The remainder of this paper is organized as follows: In Section 2, we review related work on multi-object tracking and discuss previous approaches. Section 3 presents the methodology of SolidTrack, including its design and the integration of the SOLIDER-ReID model. In Section 4, we describe the experimental setup and provide a detailed analysis of the results, comparing SolidTrack with existing methods. Finally, Section 5 concludes the paper and outlines future directions for research.
2. Related Work
With the rapid advancements in MOT, the TBD paradigm has shown remarkable advantages in tracking performance and has become the dominant approach in the field. TBD divides the MOT task into two primary components: (1) object detection and (2) data association.
2.1. Object Detection
Object detection [20,21] is a highly popular topic in computer vision and forms the foundation of the MOT task. Progress in MOT is contingent upon significant advancements in object detection technology. Currently, mainstream object detection algorithms can be broadly divided into two categories:
2.1.1. Two-Stage Algorithms
A two-stage detection algorithm primarily involves two steps: (1) utilization of a regional proposal network (RPN) to extract candidate regions of the target and (2) application of a neural network to these candidate regions for target classification and bounding-box regression [22]. Some of the more representative two-stage detection algorithms are outlined as follows: Girshick et al. [23] addressed the issue of object localization using convolutional neural networks (CNNs) by proposing the R-CNN algorithm, which combines region proposals with CNNs, pioneering neural network-based object detection. He et al. [20] improved upon R-CNN’s limitations by developing SPP-Net (Spatial Pyramid Pooling Network). SPP-Net processes the entire image through convolutional layers to extract features, avoiding the redundant computation caused by processing each candidate region individually. Inspired by the concept of spatial pyramid pooling, Girshick et al. [24] introduced Fast R-CNN, which replaced the Spatial Pyramid Pooling (SPP) layer with a Region of Interest (RoI) pooling layer. Fast R-CNN eliminates SPP’s multi-scale pooling by directly dividing each candidate region into a uniform grid of blocks. Max pooling is then applied to each block, transforming candidate regions of varying sizes on the feature map into fixed-size feature vectors. Building on Fast R-CNN, Ren et al. [25] developed Faster R-CNN, adding a Region Proposal Network (RPN) after the convolutional layers to replace the selective search algorithm. He et al. [26] further enhanced Faster R-CNN by introducing Mask R-CNN, which includes a mask branch, enabling simultaneous object detection and semantic segmentation.To address the IoU threshold selection issue present in the R-CNN series, Cai et al. [27] proposed Cascade R-CNN. This approach uses the output of one detector as the input for the next, progressively increasing the IoU threshold during training. This method ensures that the IoU threshold is more closely aligned with the pre-selected box’s IoU value. As a result, the final output from the three trained detectors achieves higher accuracy, and the IoU threshold for the detector is optimally increased during the inference stage.
2.1.2. One-Stage Algorithms
Unlike two-stage algorithms, one-stage algorithms directly generate probability and positional coordinates for object classes without the need for a region proposal phase. Classic one-stage detection algorithms include the following: SSD [28] uses multi-scale feature blocks to generate anchor boxes of various sizes and detect objects of different scales by predicting the class and offsets of the bounding boxes. YOLO [29] utilizes predefined anchor boxes and employs a feature pyramid network (FPN [30]) to address the challenge of multi-scale object detection. Both SSD and YOLO are anchor-based detection algorithms. These algorithms face several challenges: (1) The first is an imbalance between positive and negative samples: the number of anchor boxes is often in the thousands, while the number of objects is much smaller, leading to a significant imbalance. (2) The second challenge is the introduction of numerous hyperparameters, including the number, size, and aspect ratios of the anchors.
To address these challenges, various anchor-free detection algorithms have been developed. RetinaNet [31] tackles class imbalance by replacing the cross-entropy loss with the Focal Loss function. CornerNet [32] detects object bounding boxes by using heat maps and corner pooling to identify keypoint pairs, specifically the top-left and bottom-right corners. CenterNet [33] improves the accuracy of bounding-box generation through cascade corner pooling and center pooling. Additionally, YOLOX [34] advances the YOLO series by shifting to an anchor-free detection approach and incorporating a decoupled head for enhanced detection performance.
However, despite significant advancements in object detection, confidence scores decrease when occlusion, motion blur, or other factors occur. Handling low-confidence detection frames remains a challenging problem in MOT. MOT algorithms need to address the assignment of detections to pre-existing tracklets, as well as the updating of new and terminated tracklets during the data association phase.
2.2. Data Association
Data association constitutes the core component of the MOT algorithm, primarily comprising two steps: (1) similarity computation and (2) matching of detections with tracklets.
2.2.1. Similarity Metrics
Motion Model
In MOT, the position and motion information of the target are simple yet effective cues. SORT first introduced the Kalman Filter (KF) [35] to MOT, using it to predict the position of the current frame based on the tracklets’ positions in previous frames. The algorithm then calculates the Intersection over Union (IoU) between the detection boxes of the current frame and the predicted boxes of the tracklets, using this IoU as the measure of similarity between detection boxes and tracklets. However, due to factors such as large camera motion or low video frame rates, the prediction accuracy of the KF is often inadequate, making it relatively vulnerable in many scenarios. To improve this, some studies [36] have employed improved versions of the KF to replace the original.
Appearance Model
The motion model is simple and effective for short-term matching tasks. However, in long-term matching, such as during prolonged occlusion, relying solely on the motion model results in high ID switches. To address this issue, DeepSORT [10] was the first to propose incorporating a Re-Identification (ReID) model into the MOT algorithm. It used a pre-trained CNN to extract appearance features from the detection frames, then measured similarity using the cosine distance between the appearance features of detection frames and tracklets. With advancements in ReID technology [37], the tracking performance of the TBD paradigm has improved, making it a mainstream algorithm for MOT tasks.
2.2.2. Matching Method
After computing similarity, the most widely used matching method is the Hungarian algorithm. This algorithm abstracts the matching problem into a maximum bipartite matching problem, using the similarity results to match detections with tracklets. SORT [9] matches detections to tracklets in one go based on motion similarity. DeepSORT, on the other hand, introduced a cascaded matching framework, which first matches detections with the nearest tracklets, then matches the remaining detections with lost and unmatched tracklets. This framework also incorporates deep appearance features, significantly reducing ID switches. DeconfuseTrack [38] proposes Decomposed Data Association (DDA) and Occlusion-aware Non-Maximum Suppression (ONMS), significantly improving tracking accuracy and robustness by refining the data association process and reducing confusion. However, the separate processes for detection and appearance feature extraction in TBD significantly reduce its speed, preventing it from achieving real-time tracking. Consequently, advanced Joint Detection and Embedding (JDE) algorithms have emerged. These algorithms utilize a single network to perform both object detection and embedding, significantly enhancing tracking efficiency. However, this comes at the cost of some tracking performance. Subsequently, several algorithms have been designed with different association methods. To address the trade-off between true positives and false positives and to mitigate the impact of low-confidence detection boxes on tracking performance, these algorithms typically set a single threshold to filter out targets below it, preventing them from entering the data association stage. However, the creators of ByteTrack argued that many true targets are present among low-confidence detections. Hence, they designed a dual-threshold algorithm framework that employs different matching strategies for low-confidence and high-confidence targets. This framework created a significant gap relative to other algorithms at the time and profoundly influenced the design of subsequent association methods. Many algorithms, such as BoT-SORT, have since been been developed based on the ByteTrack framework.
Even though, as mentioned in the Introduction, we argue that in such algorithm frameworks, the setting of the high threshold () has a significant impact on tracking results, these algorithms often have different set values for different video sequences within datasets after extensive computation to achieve optimal tracking performance. However, this approach is computationally intensive and impractical for real-world applications, where the data distribution differs from the training dataset. Therefore, we focus on studying the robustness of current ByteTrack-like algorithms to variations in and propose a tracking algorithm that is more robust than the current SOTA algorithms.
3. SolidTrack
One major reason for the unreliable appearance features in low-score detections is partial occlusion or blurring. This issue has long been a challenge in the field of ReID. However, it is undeniable that partially occluded targets still contain some appearance information useful for recognition. While the human eye can still focus on visible information, even when a target is partially occluded, traditional CNN-based ReID models can have their extracted appearance features contaminated by non-target information within the low-score detection box. This contamination leads to misleading or poor-quality embeddings, ultimately degrading tracking performance. To solve this problem, we improved ByteTrack by integrating SOLIDER-ReID for feature extraction; we called it SolidTrack. The pipeline of our method is shown in Figure 1, and the pseudo-code of SolidTrack is shown in Appendix A.
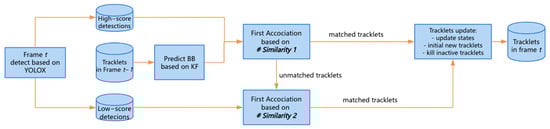
Figure 1.
The pipeline of SolidTrack.
- SOLIDER-ReID: With advancements in Transformer [39] and self-supervised training, Chen et al. [19] proposed a semantic-controllable self-supervised learning framework called SOLIDER. This framework leverages prior knowledge from human images to train representations enriched with semantic information. Additionally, the pre-trained model from SOLIDER can be fine-tuned via a semantic controller input, allowing for the generation of representations with varying degrees of semantic information to meet the specific needs of downstream tasks, such as person re-identification, pedestrian detection, pose estimation, etc. The reason why we choose SOLIDER-ReID to extract appearance feature is that SOLIDER-ReID significantly outperforms other ReID methods and has made substantial progress in addressing the occlusion issue in person-ReID compared to traditional CNN methods. For more details, please refer to [19].
SolidTrack Framework
First, we apply the object detector (Det) to the current frame to obtain all detection boxes, denoted as . These detection boxes are then categorized into two sets, i.e., and , based on the threshold (). Detection boxes with scores exceeding are assigned to , while those with scores between and 0.1 are assigned to . After separating the low-score detection boxes and the high-score detection boxes from , we use a Kalman filter to predict the new locations of each track in for the current frame. The association between and is carried out in two stages as follows.
(Stage I) The first association stage executes matching between all tracks in (including the lost tracks ()) and using # Similarity 1. # Similarity 1 is calculated based on the motion matrix () and the appearance similarity matrix (). The motion matrix () is computed from the IoU distance between and , while the appearance similarity matrix () is calculated using the Euclidean distance between and .
To better utilize the appearance feature, we adopt the exponential moving average (EMA) mechanism to update the matched tracklets’ appearance states, as in [7], Equation (1):
In this equation, represents the appearance state of the i-th tracklet at frame k, while denotes the appearance feature of the current matched detection, which is extracted using SILIDER-ReID. The momentum term is set to 0.9.
Then, we fuse matrices and as the cost matrix () using a new fusing method, which can be formulated as follows:
where and represent the IoU distance and euclidean distance between the i-th tracklet’s predicted box and the j-th detection box, representing the motion and appearance similarity, respectively. is the cost element of cost matrix . and are thresholds used to filter out detection–trajectory pairs with low motion similarity and low appearance similarity. is set to 0.5, and is set to 0.25.
Finally, we apply the Hungarian algorithm with cost matrix to complete the linear assignment in the first stage matching. The unmatched detection of and the unmatched tracks of are put in and .
(Stage II) The second matching stage pairs with using # Similarity 2. Unlike # Similarity 1, # Similarity 2 considers only the motion distance. Thus, the cost matrix () is computed based on the IoU distance between and . The next step is linear assignment by the Hungarian algorithm with cost matrix as in Stage I. The unmatched detection of and the unmatched tracks of are put in and .
After the two-stage association, the tracks are managed, including the creation of new tracks and the removal of inactive tracks. The unmatched tracks () are placed in , and tracks in are deleted if they have remained in for more than 30 frames. Finally, new tracks are initialized from the unmatched high-score detection boxes () after the first association.
4. Experiment and Results
4.1. Settings
4.1.1. Datasets
We used a total of three datasets: MOT17 [18], MOT20 [17], and Market-1501 [40]. MOT17 and MOT20 were utilized for testing and fine tuning of the ReID model, while Market-1501 was only used for the pre-training of the ReID model.
We conducted experiments on the MOT17 and MOT20 datasets using the “private detection” protocol. Both MOT17 and MOT20 are widely used benchmarks in the field of multi-object tracking (MOT). The MOT17 dataset comprises 7 sequences with 5316 frames for training and 7 sequences with 5919 frames for testing. In contrast, MOT20 focuses on highly crowded and challenging scenes, featuring 4 sequences with 8931 frames for training and 4 sequences with 4479 frames for testing. We take the first half of each sequence in the MOT17 and MOT20 training sets for training and the last half for validation following [13]. We used the validation sets of MOT17 and MOT20 to compare the robustness of different algorithms with variations in .
Additionally, we used the Market-1501 dataset to pre-train the ReID feature extractor. Market-1501 is a large-scale public benchmark for person re-identification, consisting of 1501 identities captured by six different cameras and 32,668 pedestrian image bounding boxes obtained using the Deformable Part Models pedestrian detector. On average, each person has 3.6 images from each viewpoint. The dataset is divided into two parts: 750 identities are used for training, while the remaining 751 identities are reserved for testing. According to the official testing protocol, 3368 query images are selected as the probe set to find the correct match across 19,732 reference gallery images.
4.1.2. Metrics
We evaluate our results using the widely accepted CLEAR metrics [41], including Multiple Object Tracking Accuracy (MOTA), False Positive (FP), False Negative (FN), and ID switches (IDs). Additionally, we use the Identity F1 Score (IDF1) [42] and Higher Order Tracking Accuracy (HOTA) [43]. IDF1 assesses the ability to preserve identity, with a focus on association performance, while HOTA explicitly balances the accuracy of detection, association, and localization.
We also use mean and variance as key metrics to evaluate the robustness of the algorithms with respect to variations in the detection confidence threshold (). The rationale for using these metrics is as follows: The mean score (e.g., MOTA, HOTA, and IDF1) provides an overall measure of tracking performance across different values of . It gives an indication of the algorithm’s typical behavior, allowing us to assess its average performance under varying threshold conditions/ The variance quantifies the stability of tracking performance as changes. A lower variance indicates that the algorithm is more robust and consistent, while a higher variance suggests sensitivity to , implying less reliability in real-world scenarios with varying thresholds. These metrics, together, allow for a comprehensive evaluation of both the overall tracking accuracy and stability, ensuring the robustness of the algorithm across different settings.
We use the following formula for variance. Let represent the HOTA, MOTA, or IDF1 values at different values for a given method and n be the number of observations (in this case, ). The formula for variance is expressed as follows:
where is the mean of the observations, calculated as follows:
These variance and mean values quantify the robustness of each method. A smaller variance indicates a greater robustness of the method’s performance as changes, reflecting better robustness.
4.1.3. Implementation Details
To ensure a fair comparison, we utilized the publicly available YOLOX detector [34], as trained in [13] for the MOT17 and MOT20 datasets, which was also used for other methods in the experiment.
To train the ReID feature extractor, we first utilized the pre-trained representation provided by SOLIDER and added a ReID head (modified from TransReID). We then pre-trained this model using the Market-1501 dataset before fine tuning it on the MOT17 and MOT20 datasets. For fine tuning, we prepared the MOT17 and MOT20 detection patches by processing them as follows: following the design of Market-1501, we divided the patches based on their IDs into two equal parts for training and testing. The test set was further split into query and gallery sets in a 1:6 ratio.
All experiments were implemented using PyTorch 1.13 and were conducted on a desktop equipped with a 13th Gen Intel® Core™ i7-13700K processor (Intel Corporation, Santa Clara, CA, USA) and an NVIDIA GeForce RTX 4090 GPU (NVIDIA Corporation, Santa Clara, CA, USA).
4.1.4. Comparison Methods
We employed two comparison methods for the experiment: ByteTrack and BoT-SORT. ByteTrack serves as the baseline, as both SolidTrack and BoT-SORT are advancements built on its association framework. BoT-SORT enhances ByteTrack by integrating a ReID model for appearance feature extraction, though the ReID model is based on a CNN.
4.2. Results
4.2.1. Robustness Evaluation Against Detection Score Thresholds
To evaluate robustness against varying detection score thresholds, we adjusted the detection score threshold () from 0.2 to 0.8 and compared the HOTA, MOTA, and IDF1 of SolidTrack with those of two SOTA methods. The results on the MOT17 validation set are provided in Table 1 and Figure 2, Figure 3 and Figure 4, while those on the MOT20 validation set are presented in Table 2 and Figure 5, Figure 6 and Figure 7.

Table 1.
Comparison of SolidTrack, BoT-SORT, and ByteTrack across different values on the MOT17 validation set.
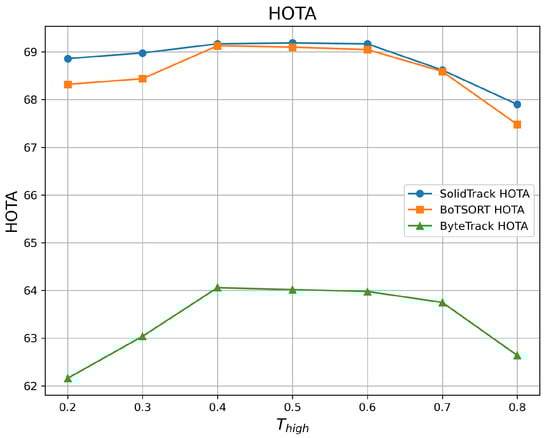
Figure 2.
HOTA vs. on the MOT17 validation set.
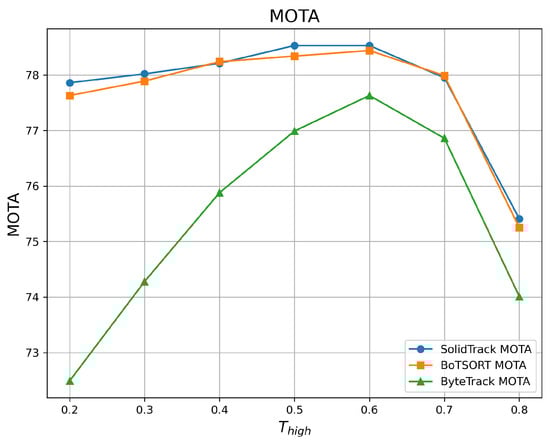
Figure 3.
MOTA vs. on the MOT17 validation set.
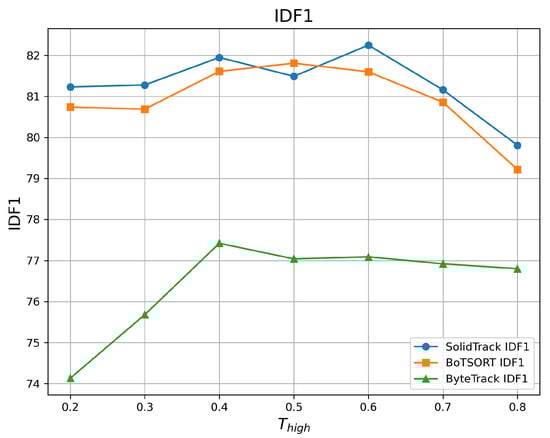
Figure 4.
IDF1 vs. on the MOT17 validation set.
Table 2.
Comparison of SolidTrack, BoT-SORT, and ByteTrack across different values on the MOT20 validation set.
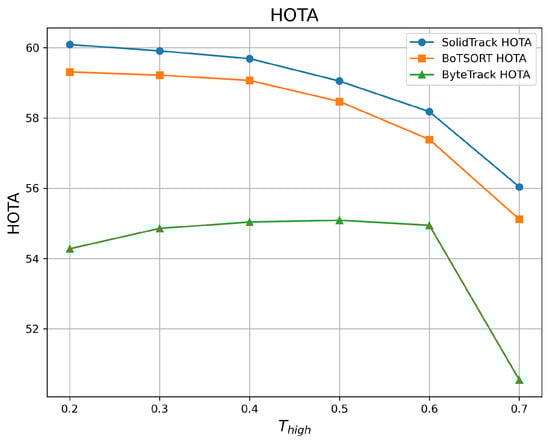
Figure 5.
HOTA vs. on the MOT20 validation set.
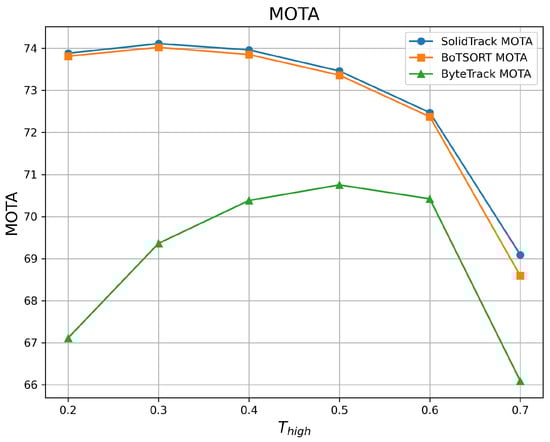
Figure 6.
MOTA vs. on the MOT20 validation set.
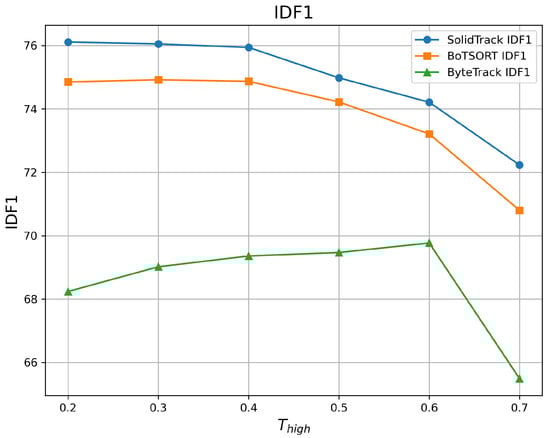
Figure 7.
IDF1 vs. on the MOT20 validation set.
As shown in the tables and figures, SolidTrack outperforms the other two methods across all three metrics on the validation set. Additionally, the overall mean performance of SolidTrack is the highest, with the smallest variance, indicating that SolidTrack is the most robust method.
When compared to ByteTrack, SolidTrack consistently performs better across all settings. On the MOT17 validation set, SolidTrack achieves a mean HOTA of 68.84, which is 5.46 points higher than ByteTrack’s 63.38. It also outperforms ByteTrack by 2.33 points in MOTA (77.78 vs. 75.45) and 4.87 points in IDF1 (81.31 vs. 76.44). This pattern is consistent across all settings, showing SolidTrack’s clear advantage in tracking performance.
In comparison to BoT-SORT, SolidTrack shows overall superior performance, though BoT-SORT does outperform it in certain settings. For example, at and , BoT-SORT achieves a better MOTA, and at , BoT-SORT performs slightly better in terms of IDF1(in MOT17). However, SolidTrack consistently outperforms BoT-SORT in mean scores across all metrics. Specifically, on the MOT17 dataset, SolidTrack’s mean HOTA is 0.25 points higher (68.84 vs. 68.59), its MOTA is 0.09 points better (77.78 vs. 77.69), and its IDF1 is 0.38 points higher (81.31 vs. 80.93). Furthermore, SolidTrack exhibits smaller variance in all metrics, demonstrating its robustness and stability compared to BoT-SORT.
The increased complexity of the MOT20 dataset, characterized by denser scenes, higher pedestrian counts, and more occlusions, highlights the advantages of SolidTrack. Under these more demanding conditions, SolidTrack continues to outperform BoT-SORT across all metrics. Specifically, SolidTrack consistently achieves higher mean scores than BoT-SORT, with HOTA improved by 0.73 points (58.83 vs. 58.10), MOTA by 0.16 points (72.83 vs. 72.67), and IDF1 by 1.11 points (74.92 vs. 73.81) on the MOT17 dataset. These results underscore SolidTrack’s superior performance in handling the challenges posed by crowded and occluded environments, where other methods struggle more.
In conclusion, SolidTrack outperforms both ByteTrack and BoT-SORT, offering superior mean performance, greater robustness, and smaller variance across various tracking settings. Its ability to handle more complex scenarios in datasets like the MOT20 dataset further solidifies it as the most reliable and effective method in this comparison.
4.2.2. Benchmark Evaluation
To further demonstrate that SolidTrack is not only robust on the validation set but also reliable on the test set, we compare its performance against SOTA trackers on the MOT17 and MOT20 test sets using the private detection protocol. The results are shown in Table 3 and Table 4, respectively. All data were directly obtained from the official MOTChallenge evaluation server.
Table 3.
Comparison of the SOTA methods under the “private detector” protocol on the MOT17 test set. The best results are shown in bold. SolidTrack ranks 1st among all the MOT17 leaderboard trackers.
Table 4.
Comparison of the SOTA methods under the “private detector” protocol on the MOT20 test set. The best results are shown in bold. SolidTrack ranks 1st among all the MOT20 leaderboard trackers.
MOT17
As shown in Table 3, SolidTrack achieves the highest MOTA (80.6) among all the SOTA trackers on the MOT17 test set, outperforming ByteTrack by 0.3 points and BoT-SORT by 0.1 points. While BoT-SORT leads in IDF1, with a score of 80.2, SolidTrack maintains a competitive IDF1 of 80.0.
MOT20
On the MOT20 test set, as shown in Table 4, SolidTrack continues to lead the competition, with the highest MOTA (77.9), HOTA (63.4), and IDF1 (77.5) scores. It surpasses BoT-SORT in MOTA and HOTA by 0.1 points, while the two trackers share the same IDF1 score. The improved MOTA score under SolidTrack indicates its strong performance in handling crowded and occluded scenes, which are characteristic of the more complex MOT20 dataset. These results demonstrate SolidTrack’s ability to maintain high tracking performance, even in more challenging and dynamic environments.
5. Conclusions and Discussion
This study examined the sensitivity of SOTA TBD-based tracking methods to variations in the detection confidence threshold and introduced SolidTrack, an improved MOT algorithm that incorporates SOLIDER-ReID for enhanced robustness. Experimental results demonstrate that SolidTrack achieves superior performance and robustness against varying values and achieves high MOTA, IDF1, and HOTA scores on both the MOT17 and MOT20 benchmarks.
Building on the promising results of SolidTrack, future research can explore adaptive mechanisms that dynamically adjust based on scene complexity to further enhance tracking robustness. Additionally, expanding evaluations to other methods and more benchmark datasets or real-world tracking applications beyond MOTChallenge will help validate its generalizability and practical impact.
Author Contributions
Conceptualization, D.W.; methodology, D.W.; software, D.W.; validation, D.W. and Z.H.; formal analysis, D.W.; investigation, D.W.; resources, D.W.; data curation, D.W.; writing—original draft preparation, D.W.; writing—review and editing, D.W. and Z.H; visualization, D.W.; supervision, Y.Z.; funding acquisition, Y.Z. All authors have read and agreed to the published version of the manuscript.
Funding
This research received no external funding.
Data Availability Statement
Data are contained within the article.
Conflicts of Interest
The authors declare no conflicts of interest.
Appendix A
| Algorithm A1 Pseudo-code of SolidTrack |
| Require: A video sequence V; object detector Det; detection score threshold Ensure: Tracks of the video
|
References
- Luo, W.; Xing, J.; Milan, A.; Zhang, X.; Liu, W.; Kim, T.K. Multiple object tracking: A literature review. Artif. Intell. 2021, 293, 103448. [Google Scholar]
- Gao, M.; Jin, L.; Jiang, Y.; Bie, J. Multiple object tracking using a dual-attention network for autonomous driving. IET Intell. Transp. Syst. 2020, 14, 842–848. [Google Scholar]
- Wang, H.; Jin, L.; He, Y.; Huo, Z.; Wang, G.; Sun, X. Detector–tracker integration framework for autonomous vehicles pedestrian tracking. Remote Sens. 2023, 15, 2088. [Google Scholar] [CrossRef]
- Gautam, A.; Singh, S. Trends in video object tracking in surveillance: A survey. In Proceedings of the 2019 Third International Conference on I-SMAC (IoT in Social, Mobile, Analytics and Cloud) (I-SMAC), Palladam, India, 12–14 December 2019; pp. 729–733. [Google Scholar]
- Jiménez-Bravo, D.M.; Murciego, Á.L.; Mendes, A.S.; San Blás, H.S.; Bajo, J. Multi-object tracking in traffic environments: A systematic literature review. Neurocomputing 2022, 494, 43–55. [Google Scholar]
- Wilson, J.; Lin, M.C. Avot: Audio-visual object tracking of multiple objects for robotics. In Proceedings of the 2020 IEEE International Conference on Robotics and Automation (ICRA), Paris, France, 31 May–31 August 2020; pp. 10045–10051. [Google Scholar]
- Wang, Z.; Zheng, L.; Liu, Y.; Li, Y.; Wang, S. Towards real-time multi-object tracking. In Proceedings of the European Conference on Computer Vision, Glasgow, UK, 23–28 August 2020; Springer: Berlin/Heidelberg, Germany, 2020; pp. 107–122. [Google Scholar]
- Luo, C.; Ma, C.; Wang, C.; Wang, Y. Learning discriminative activated simplices for action recognition. In Proceedings of the AAAI Conference on Artificial Intelligence, San Francisco, CA, USA, 4–9 February 2017; Volume 31. [Google Scholar]
- Bewley, A.; Ge, Z.; Ott, L.; Ramos, F.; Upcroft, B. Simple online and realtime tracking. In Proceedings of the 2016 IEEE International Conference on Image Processing (ICIP), Phoenix, AZ, USA, 25–28 September 2016; pp. 3464–3468. [Google Scholar]
- Wojke, N.; Bewley, A.; Paulus, D. Simple online and realtime tracking with a deep association metric. In Proceedings of the 2017 IEEE International Conference on Image Processing (ICIP), Beijing, China, 17–20 September 2017; pp. 3645–3649. [Google Scholar]
- Yu, F.; Li, W.; Li, Q.; Liu, Y.; Shi, X.; Yan, J. Poi: Multiple object tracking with high performance detection and appearance feature. In Proceedings of the Computer Vision–ECCV 2016 Workshops, Amsterdam, The Netherlands, 8–10 and 15–16 October 2016; Proceedings, Part II 14. Springer: Berlin/Heidelberg, Germany, 2016; pp. 36–42. [Google Scholar]
- Aharon, N.; Orfaig, R.; Bobrovsky, B.Z. BoT-SORT: Robust associations multi-pedestrian tracking. arXiv 2022, arXiv:2206.14651. [Google Scholar]
- Zhang, Y.; Sun, P.; Jiang, Y.; Yu, D.; Weng, F.; Yuan, Z.; Luo, P.; Liu, W.; Wang, X. Bytetrack: Multi-object tracking by associating every detection box. In Proceedings of the European Conference on Computer Vision, Tel Aviv, Israel, 23–27 October 2022; Springer: Berlin/Heidelberg, Germany, 2022; pp. 1–21. [Google Scholar]
- Bae, S.H.; Yoon, K.J. Robust online multi-object tracking based on tracklet confidence and online discriminative appearance learning. In Proceedings of the IEEE Conference on Computer Vision and Pattern Recognition, Columbus, OH, USA, 23–28 June 2014; pp. 1218–1225. [Google Scholar]
- Berclaz, J.; Fleuret, F.; Turetken, E.; Fua, P. Multiple object tracking using k-shortest paths optimization. IEEE Trans. Pattern Anal. Mach. Intell. 2011, 33, 1806–1819. [Google Scholar] [CrossRef] [PubMed]
- Bergmann, P.; Meinhardt, T.; Leal-Taixe, L. Tracking without bells and whistles. In Proceedings of the IEEE/CVF International Conference on Computer Vision, Seoul, Republic of Korea, 27 October–2 November 2019; pp. 941–951. [Google Scholar]
- Dendorfer, P.; Rezatofighi, H.; Milan, A.; Shi, J.; Cremers, D.; Reid, I.; Roth, S.; Schindler, K.; Leal-Taixé, L. Mot20: A benchmark for multi object tracking in crowded scenes. arXiv 2020, arXiv:2003.09003. [Google Scholar]
- Milan, A.; Leal-Taixé, L.; Reid, I.; Roth, S.; Schindler, K. MOT16: A benchmark for multi-object tracking. arXiv 2016, arXiv:1603.00831. [Google Scholar]
- Chen, W.; Xu, X.; Jia, J.; Luo, H.; Wang, Y.; Wang, F.; Jin, R.; Sun, X. Beyond appearance: A semantic controllable self-supervised learning framework for human-centric visual tasks. In Proceedings of the IEEE/CVF Conference on Computer Vision and Pattern Recognition, Vancouver, BC, Canada, 18–22 June 2023; pp. 15050–15061. [Google Scholar]
- He, K.; Zhang, X.; Ren, S.; Sun, J. Spatial pyramid pooling in deep convolutional networks for visual recognition. IEEE Trans. Pattern Anal. Mach. Intell. 2015, 37, 1904–1916. [Google Scholar] [PubMed]
- Zhang, R.; Cao, Z.; Huang, Y.; Yang, S.; Xu, L.; Xu, M. Visible-Infrared Person Re-identification with Real-world Label Noise. IEEE Trans. Circuits Syst. Video Technol. 2025. [Google Scholar] [CrossRef]
- Dai, Y.; Hu, Z.; Zhang, S.; Liu, L. A survey of detection-based video multi-object tracking. Displays 2022, 75, 102317. [Google Scholar] [CrossRef]
- Girshick, R.; Donahue, J.; Darrell, T.; Malik, J. Rich feature hierarchies for accurate object detection and semantic segmentation. In Proceedings of the IEEE Conference on Computer Vision and Pattern Recognition, Columbus, OH, USA, 23–28 June 2014; pp. 580–587. [Google Scholar]
- Girshick, R. Fast r-cnn. In Proceedings of the IEEE international Conference on Computer Vision, Santiago, Chile, 7–13 December 2015; pp. 1440–1448. [Google Scholar]
- Ren, S.; He, K.; Girshick, R.; Sun, J. Faster r-cnn: Towards real-time object detection with region proposal networks. Adv. Neural Inf. Process. Syst. 2015, 39, 1137–1149. [Google Scholar] [CrossRef] [PubMed]
- He, K.; Gkioxari, G.; Dollár, P.; Girshick, R. Mask r-cnn. In Proceedings of the IEEE International Conference on Computer Vision, Venice, Italy, 22–29 October 2017; pp. 2961–2969. [Google Scholar]
- Cai, Z.; Vasconcelos, N. Cascade r-cnn: Delving into high quality object detection. In Proceedings of the IEEE Conference on Computer Vision and Pattern Recognition, Salt Lake City, UT, USA, 18–23 June 2018; pp. 6154–6162. [Google Scholar]
- Liu, W.; Anguelov, D.; Erhan, D.; Szegedy, C.; Reed, S.; Fu, C.Y.; Berg, A.C. Ssd: Single shot multibox detector. In Proceedings of the Computer Vision–ECCV 2016: 14th European Conference, Amsterdam, The Netherlands, 11–14 October 2016; Proceedings, Part I 14. Springer: Berlin/Heidelberg, Germany, 2016; pp. 21–37. [Google Scholar]
- Redmon, J.; Divvala, S.; Girshick, R.; Farhadi, A. You only look once: Unified, real-time object detection. In Proceedings of the IEEE Conference on Computer Vision and Pattern Recognition, Las Vegas, NV, USA, 27–30 June 2016; pp. 779–788. [Google Scholar]
- Lin, T.Y.; Dollár, P.; Girshick, R.; He, K.; Hariharan, B.; Belongie, S. Feature pyramid networks for object detection. In Proceedings of the IEEE Conference on Computer Vision and Pattern Recognition, Honolulu, HI, USA, 21–26 July 2017; pp. 2117–2125. [Google Scholar]
- Lin, T.Y.; Goyal, P.; Girshick, R.; He, K.; Dollár, P. Focal Loss for Dense Object Detection. arXiv 2018, arXiv:1708.02002. [Google Scholar]
- Law, H.; Deng, J. Cornernet: Detecting objects as paired keypoints. In Proceedings of the European Conference on Computer Vision (ECCV), Munich, Germany, 8–14 September 2018; pp. 734–750. [Google Scholar]
- Duan, K.; Bai, S.; Xie, L.; Qi, H.; Huang, Q.; Tian, Q. Centernet: Keypoint triplets for object detection. In Proceedings of the IEEE/CVF International Conference on Computer Vision, Seoul, Republic of Korea, 27 October–2 November 2019; pp. 6569–6578. [Google Scholar]
- Ge, Z.; Liu, S.; Wang, F.; Li, Z.; Sun, J. Yolox: Exceeding yolo series in 2021. arXiv 2021, arXiv:2107.08430. [Google Scholar]
- Brown, R.G.; Hwang, P.Y. Introduction to random signals and applied Kalman filtering: With MATLAB exercises and solutions. In Introduction to Random Signals and Applied Kalman Filtering: With MATLAB Exercises and Solutions; Wiley: Hoboken, NJ, USA, 1997. [Google Scholar]
- Du, Y.; Zhao, Z.; Song, Y.; Zhao, Y.; Su, F.; Gong, T.; Meng, H. Strongsort: Make deepsort great again. IEEE Trans. Multimed. 2023, 25, 8725–8737. [Google Scholar] [CrossRef]
- Zhang, R.; Xu, L.; Yu, Z.; Shi, Y.; Mu, C.; Xu, M. Deep-IRTarget: An automatic target detector in infrared imagery using dual-domain feature extraction and allocation. IEEE Trans. Multimed. 2021, 24, 1735–1749. [Google Scholar] [CrossRef]
- Yang, F.; Odashima, S.; Masui, S.; Jiang, S. Hard to track objects with irregular motions and similar appearances? make it easier by buffering the matching space. In Proceedings of the IEEE/CVF Winter Conference on Applications of Computer Vision, Waikoloa, HI, USA, 2–7 January 2023; pp. 4799–4808. [Google Scholar]
- Vaswani, A. Attention is all you need. Adv. Neural Inf. Process. Syst. 2017. Available online: https://proceedings.neurips.cc/paper_files/paper/2017/file/3f5ee243547dee91fbd053c1c4a845aa-Paper.pdf (accessed on 15 February 2025).
- Zheng, L.; Shen, L.; Tian, L.; Wang, S.; Wang, J.; Tian, Q. Scalable person re-identification: A benchmark. In Proceedings of the IEEE International Conference on Computer Vision, Santiago, Chile, 7–13 December 2015; pp. 1116–1124. [Google Scholar]
- Bernardin, K.; Stiefelhagen, R. Evaluating multiple object tracking performance: The clear mot metrics. EURASIP J. Image Video Process. 2008, 2008, 1–10. [Google Scholar]
- Ristani, E.; Solera, F.; Zou, R.; Cucchiara, R.; Tomasi, C. Performance measures and a data set for multi-target, multi-camera tracking. In Proceedings of the European Conference on Computer Vision, Amsterdam, The Netherlands, 11–14 October 2016; Springer: Berlin/Heidelberg, Germany; pp. 17–35. [Google Scholar]
- Luiten, J.; Osep, A.; Dendorfer, P.; Torr, P.; Geiger, A.; Leal-Taixé, L.; Hota, B.L. A higher order metric for evaluating multi-object tracking. Int. J. Comput. Vis. 2021, 129, 548–578. [Google Scholar] [CrossRef] [PubMed]
Disclaimer/Publisher’s Note: The statements, opinions and data contained in all publications are solely those of the individual author(s) and contributor(s) and not of MDPI and/or the editor(s). MDPI and/or the editor(s) disclaim responsibility for any injury to people or property resulting from any ideas, methods, instructions or products referred to in the content. |
© 2025 by the authors. Licensee MDPI, Basel, Switzerland. This article is an open access article distributed under the terms and conditions of the Creative Commons Attribution (CC BY) license (https://creativecommons.org/licenses/by/4.0/).