Abstract
The aquaculture industry is growing strongly, especially in facilities and technical infrastructure. Aquaculture real estate serves as an important component for these developments. Although the aquaculture real estate sector represents a dynamic market with substantial transaction volumes and high economic value, this sector has received less attention. This paper proposes an aquaculture real estate price prediction system that utilizes a machine learning approach. First, this paper focuses on collecting and analyzing data from aquaculture real estate trading websites and platforms. The dataset encompasses prices and features of aquaculture real estate from 2021 to the beginning of 2025, specifically in Southern Vietnam, obtained from various Vietnam real estate websites. We conduct experiments and assess six different models, including Random Forest, CatBoost, Hybrid, XGBoost, LightGBM and Linear Regression, to predict aquaculture real estate prices. Results from testing revealed that the Random Forest is the best model, due to the nature of aquaculture real estate data, which includes many categories associated with the location of land, the type of land, and the legal status, and has many complicated nonlinear relationships among its attributes. Following this, hyperparameter tuning using Optuna (50 trials, 5-fold cross-validation) can further enhance the model’s performance. The experimental results demonstrate that the Stacking Ensemble model achieved the best performance after hyperparameter tuning, with RMSE of 4394.77 million, MAE of 2114.19 million, and R2 of 0.5738, representing improvements of 3.3%, 6.0%, and 5.4%. The paper will provide a more comprehensive view of the aquaculture real estate market and support sustainable development for this industry.
1. Introduction
Aquaculture is one of the key economic sectors for creating jobs, contributing to the food security and economic development of many countries worldwide [1]. The application of advanced technology in aquaculture has created new development opportunities, enabling farmers to reduce labor, enhance productivity and improve economic efficiency [2]. However, due to the nature of the aquaculture industry, it heavily relies on real estate and infrastructure [3], depending on the size of the aquaculture farm. The increase in domestic seafood consumption and exports drives the demand for land and facilities for aquaculture [4]. In Myanmar, land prices for fish farming [4] increased faster than those for paddy fields, indicating a substantial shift from agriculture to aquaculture. Aquaculture real estate includes aquaculture areas, extending to processing facilities, warehouses, and other supporting infrastructure. This sector has dynamic markets with big transaction volumes and high economic value. Globally increasing demand for aquaculture products leads to expanding operations facilities. Governments also play important roles by making policies that help innovative farming easier and open aquaculture real estate trading. Additionally, modern farming models require scaling up real estate areas to meet new technical standards. Therefore, the prices of aquaculture real estate have shown strong volatility in the last few years. Most studies of real estate still focus on urban residents and commercial markets, resulting in knowledge gaps regarding the valuation and trading of aquaculture properties.
There are still gaps in our understanding of aquaculture real estate. First, most of the current research focuses on urban real estate, even though aquaculture real estate transactions have increased. This results in a lack of knowledge and comprehension regarding the trends and values of aquaculture real estate. Market analysis is challenging in this industry since transaction data is frequently not publicly available and aggregated. Furthermore, the aquaculture sector lacks specialized real estate previous work, making it more difficult to monitor and assess market demand and price trends. There are also limitations of research on the use of emerging technologies in aquaculture real estate management, such as artificial intelligence and data mining.
Information technology breakthroughs have revolutionized the real estate industry by allowing companies [5] and individual purchasers to access market data from almost anywhere. Finding appropriate listings, market trends and comparing real estate prices have all been made easier by online resources. However, there are difficulties because of the sheer amount and complexity of data these platforms produce [6]. Effective data processing, analysis, and storage are essential because they improve the precision and transparency of real estate data in real time. To improve forecasting models and derive valuable insights from market data, models such as Neural Networks [7], Decision Trees [8,9], and Linear Regression [10,11] are frequently used. To determine the most effective method for analyzing aquaculture real estate data, this paper evaluates machine learning models with varying degrees of complexity. We use various evaluation metrics to assess the accuracy and predictive performance of these models.
Our paper hopes to fill these gaps and provide a more informative analysis of the aquaculture real estate market, supporting sustainable development. This paper proposes an aquaculture real estate price prediction system that utilizes a machine learning approach. The experimental results demonstrate that the Stacking Ensemble model achieved the best performance after hyperparameter tuning, with RMSE of 4394.77 million VND, MAE of 2114.19 million VND, and R2 of 0.5738, representing improvements of 3.3%, 6.0%, and 5.4%, respectively, compared to the baseline Random Forest model. The key contributions of our paper can be delineated as follows:
- -
- Developing an aquaculture real estate price prediction system, which can collect and analyze transaction data from Vietnam real estate websites.
- -
- Creating the dataset, including prices and features of aquaculture real estate from 2021 to the beginning of 2025, specifically in Southern Vietnam, obtained from various Vietnam real estate websites.
- -
- Applying different machine learning algorithms, such as linear regression, random forest, gradient boosting or decision tree, to predict aquaculture real estate prices.
2. Background of Research
2.1. Aquaculture Real Estate Data Collection
Real estate refers to non-removable assets, such as land, houses, buildings, facilities, etc., that are attached to the ground [12]. In the context of our research, aquaculture real estate includes aquaculture areas (ponds, water areas, etc.), processing facilities, warehouses, and other supporting infrastructure that serve in aquaculture product. The characteristic of fixedness distinguishes real estate from other assets. This property gives real estate products’ place and local character. However, the value of real estate not only depends on the type but is also greatly affected by the location [13]. The same type of real estate but located in different locations will have different values. The fixed nature of real estate also makes this market have its own characteristics, different from ordinary goods. This feature requires a different trading method and management of trading activities than other commodity markets. With other goods, the seller and buyer can quickly bring the goods to any place they want, but with real estate, its owner must move to where the real estate is located. Therefore, collecting and managing real-time real estate information is extremely necessary to provide timely, transparent, and accurate data. This helps stabilize the market, prevent speculation and real estate bubbles, and support policymakers and investors in making reasonable decisions. When information is strictly managed and continuously updated, the real estate market will develop sustainably, promoting healthy and effective economic growth.
The real estate market includes buying and selling property, brokerage services, property management, consulting and property valuation [14]. Transactions occur when real estate properties and money are traded within a predetermined time window. The transaction price, the real cost paid for a property, is one of the most important indicators. These prices are very important for analysts, buyers, investors, and policymakers because they show the market value at any given time [15]. Transaction data can help stakeholders determine fair prices, see market trends, and make smart investment decisions. Another important factor in valuing real estate is its location. The value of a property is greatly affected by its location, including nearby development [16], infrastructure, amenities, and the potential for future growth.
Nowadays, real estate information is often posted on websites [17] and online platforms on the internet. These platforms provide detailed information on transaction prices, location, property features, surrounding amenities, and market trends. In addition, multimedia data about these properties, such as images, videos, etc., is also available. Real estate data sources are increasingly abundant and constantly updated because the increasing demand for transactions has created big data. Mining and analyzing this data are valuable in market research and open many opportunities to apply artificial intelligence (AI) and machine learning to forecast trends and optimize investment strategies. Advanced data processing technologies, such as big data storage and intelligent image and video analysis, have improved the ability to collect, manage, and analyze real-time real estate information [18]. Many online platforms and real estate websites have used big data to share and provide market information more efficiently. In the practical application of big data, forecasting real estate sales for the next quarter depends on big data much more accurately than economists’ forecasts [19]. Historically, prior studies in the real estate domain have concentrated on forecasting the value and trends of urban properties. One of the research trends in real estate value forecasting analysis is using big data to build models to forecast future property values based on factors such as location, area, infrastructure, and market fluctuations [20,21,22,23]. Real estate big data is analyzed to manage assets accurately, monitor real estate status, and optimize maintenance costs [24,25]. Despite its increasing economic importance, the real estate market is still a little-researched area in big data studies [26,27].
Previous studies have been conducted to estimate and predict agricultural land values, as presented in Table 1 below.

Table 1.
Summary of Existing Studies on Agricultural Land Values Estimation.
A procedure for estimating the purchase cost of agricultural land using the hedonic price method at the land plot level was explored [28]. The authors utilize data from Côte-d’Or agricultural real estate transactions that occurred between 1992 and 2008 to establish explanatory variables for land value estimation. The study reveals that factors such as location, topographic characteristics, and soil type have a significant impact on prices. In particular, the study finds that the value factor for production characteristics is very important. The estimation results show that the model can explain 71.15% of the price variation, thereby predicting prices for land plots. The study [29] identifies and predicts agricultural land prices in Brazil, especially in the context of the lack of official information on transaction prices. Using a multivariate regression model, the study analyzed factors that affect land prices, including physical attributes, production systems, infrastructure, and market expectations. Applying a hedonic approach in a homogeneous area in the state of Maranhão, the results showed that five independent variables explained about 70% of the variation in land prices. The study confirms the importance of understanding land prices in the context of farming and rural development policy in Brazil.
Although there are studies on estimating and predicting agricultural land prices, this area remains limited, especially in the context of aquaculture land. Existing studies have primarily focused on factors such as location, topography and soil type in regions such as Côte-d’Or and Maranhão, where valorization methods have been applied to predict land prices based on historical data. However, there is a significant lack of information on aquaculture land prices and the specific factors that affect their value have not been fully studied. Therefore, expanding the research to include factors specific to aquaculture land and market demands in a real-world context would be important in improving land price prediction in this area. To address this research gap, our paper focuses on developing an aquaculture real estate price prediction system that can collect and analyze price data from real estate websites. We use data from Vietnam as research use case and prototype for our paper. We also plan to create a dataset including prices and features of aquaculture real estate from 2021 to the beginning of 2025, specifically in Southern Vietnam, obtained from various Vietnamese real estate websites.
2.2. Real Estate Price Prediction Algorithms Based on Machine Learning Approach
Machine learning provides many algorithms for analyzing real estate data and making accurate price predictions. Previous research has applied different machine learning algorithms to analyze and forecast real estate prices based on multiple factors such as location, area, infrastructure, and market trends. In this section, we conducted a survey and presented popular machine learning models used in real estate price prediction, as summarized in Table 2 below.
Table 2.
Summary of Existing Machine Learning Approaches for Real Estate Price Prediction and Research Gaps.
In the early stage, linear regression is commonly applied. For example, Ghosalkar and Dhage (2018) presented [10] linear regression methods to predict house prices in Mumbai, India. The result shows that house prices are influenced by physical condition, concept, and location. The paper develops a linear regression model, which yields the lowest prediction error of 0.3713. Liu (2022) presented [11] the use of a multivariate linear regression model to predict housing prices in China. The paper analyzed the factors affecting real estate prices, including residents’ income, housing expenditure, and completed real estate area. The prediction model showed high accuracy with a maximum error of no more than 8%. Linear regression is also applied to predict house prices in Zhaoqing City [30]. However, linear models still have many limitations in handling nonlinear relationships, while real estate data is complex and nonlinear. These models do not accurately reflect the factors affecting real estate values, thereby affecting the accuracy of price predictions. More complex models or non-linear analysis methods are used to enhance predictive capability in the real estate sector.
Next, decision tree models have been utilized to improve the accuracy of real estate price predictions in recent works. Yücebaş et al. (2022) developed [9] the C4.5–CART decision tree model to predict real estate prices and analyze the factors affecting prices. This model is not only capable of predicting numerical values but also classifying prices such as “Low”, “Medium”, and “High”. Using real estate web data collected in Cumhuriyet district, Canakkale, the results found that the most important factors in price prediction include “Number of Rooms”, “Current Floor” and “Facade”. The results showed that the C4.5 model outperformed the Direct Capitalization (DC) model with an accuracy of 88% and a Kappa of 81%. Roy et al. (2024) improved [8] real estate price prediction by combining decision trees with hyperparameter fine-tuning. The developed model achieved significant performance improvements through hyperparameter fine-tuning, such as adjusting tree depth and split point, with the accuracy increasing from 83.93% to 87.11%. In another work by Yucebas et al. (2024) [31], a hybrid model combining X-Means clustering and CART decision trees to predict real estate prices is developed. The model can improve prediction accuracy by reflecting geographical differences and socioeconomic factors. The results showed that the hybrid model outperformed the DC method, with metrics such as root mean square error (RMSE) reaching 72.87, compared to 374.5 for DC. The use of clustering improved the prediction performance by up to 36%.
Random forest models have been widely applied in real estate price prediction because they can provide higher accuracy and handle non-linear variables and interactions between factors. Abigail et al. (2018) focused [32] on predicting real estate prices using Random Forest machine learning. The study used the Boston housing dataset from UCI Machine Learning with 506 samples and 14 features to evaluate the prediction model’s performance. The Random Forest model showed accurate prediction with an error of ±5 when comparing the predicted and actual prices. Sawant et al. (2018) predicted [33] house prices in Pune, India, using a Random Forest model combined with multiple features. The authors analyzed 29,680 samples from 503 different areas in Pune using data collected from real estate companies and online portals. The prediction model was built based on 55 features, including area, location, and other factors that affect house prices. The results showed that the Random Forest model outperformed the decision tree model with a significantly lower average error. Hu et al. (2022) [34] integrated proxy variables that reflect spatial correlation into the Random Forest model to improve the accuracy of house price prediction. The results show that house prices tend to be influenced by spatial factors due to shared characteristics and amenities in the neighborhood. The experiment using data from Fairfax County, Virginia, proved that the proposed model can reduce prediction errors and improve the model’s explanatory power compared to traditional methods. Mohit and Priya (2024) proposed [35] a real estate price prediction system adopting a random forest model. The authors used historical data from Bengaluru to analyze and identify factors affecting house prices, such as location, number of bedrooms, taxes and distance to commercial areas. They also developed a user interface that allows users to input information and obtain house price predictions. The results showed that the random forest model performed better than other regression models, helping both buyers and sellers assess the fair value of a property. Tanamal et al. (2023) developed [36] a house price prediction model in Surabaya using a random forest algorithm. Data were collected from interviews with six real estate agents, with 17 important features identified that affect house prices. The model achieved an accuracy of up to 88%.
In recent research trends, Gradient Boosting algorithm and its improved version XGBoost are also methods to predict real estate prices in different regions and show higher accuracy than traditional methods. Almaslukh (2020) proposed [37] an optimization model based on the Gradient Boosting (GB) method to predict real estate prices. The Optimized Gradient Boosting (OGB) model achieved the lowest root mean square error (RMSE) of 0.01167 through public real estate data experiments, showing superior performance compared to other baseline machine learning models. Fedorov and Yulia (2020) used [38] gradient-boosting-based machine learning methods to predict real estate prices. The authors collected data from multiple real estate websites and applied models, including CatBoostRegressor and XGBRegressor, to predict prices. The results showed that the CatBoostRegressor model achieved the best performance with high accuracy. Sibindi et al. (2023) proposed [39] a hybrid model combining Light Gradient Boosting Machine (LGBM) and Extreme Gradient Boosting (XGBoost) to improve the accuracy of real estate price prediction. By applying Bayesian hyperparameter optimization, this hybrid model exhibited a mean absolute error (MAE) of 0.193 achieved mean absolute error (MAE), a mean square error (MSE) of 0.156 and a mean absolute percentage error (MAPE) of 0.193, showing superior performance compared to other models such as Adaboost and GBM. Monika et al. (2021) predicted [40] real estate prices using machine learning methods, including Extreme Gradient Boosting, Gradient Boosting Regression, Random Forest Regression, Light Gradient Boosting Machine Regression, and Support Vector Regression. The study used a dataset from Kaggle with 79 explanatory variables and 1460 observations to build predictive models. The results showed that the LightGBM model achieved the highest accuracy with the lowest MSE index of 0.198, while other models also gave satisfactory results.
Also, Long Short-Term Memory (LSTM) networks and Recurrent Neural Networks (RNNs) have demonstrated promise in examining temporal data patterns, providing improved tools for monitoring and predicting price trends [41,42,43,44]. Using sophisticated methods like Grid Search or Bayesian Optimization, recent research has mostly concentrated on optimizing SVM performance through careful parameter selection, specifically tuning the regularization constant C and kernel functions [45,46].
To determine the best method for analyzing aquaculture real estate data, this paper evaluates machine learning models with different degrees of complexity. Predicting transaction prices is the specific focus of our comparative analysis. We use various evaluation metrics to assess the accuracy and predictive performance of these models. To methodically evaluate each model’s advantages and disadvantages in this field, they are composed of predictive accuracy, generalization ability, and computational efficiency.
3. Research Design and Setup
3.1. Proposed Research Model
This paper aims to develop a price prediction system to analyze and predict aquaculture real estate prices. The paper collects aquaculture real estate records from real estate platforms to create a detailed dataset of aquaculture property features from 2021 to 2025, focusing on Southern Vietnam. Next, we conduct experiments on different machine learning algorithms evaluated, including Linear Regression, Decision Tree, Random Forest, Gradient Boosting, XGBoost, LightGBM and Stacking Ensemble, to ensure a comprehensive comparison. Next, a hyperparameter optimization to enhance model performance is presented. This research is expected to provide clearer insights into Vietnam’s booming aquaculture property market, helping investors and policymakers spot trends and support decision-making.
The proposed general architecture of our aquaculture real estate price prediction system is presented in Figure 1. The proposed architecture consists of three main phases: Real estate data collection, Data Processing, and Data Consumption.
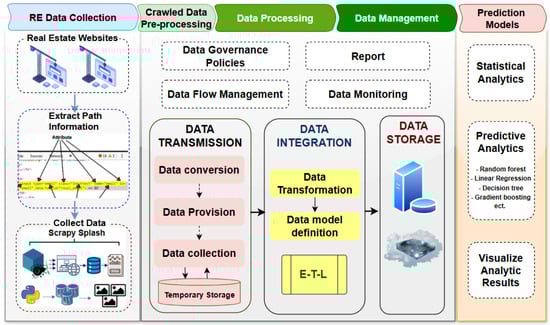
Figure 1.
Proposed General Architecture of Aquaculture Real Estate Price Prediction System.
In the first phase, the system will extract information from real estate websites. The main goal is to collect data on prices and aquaculture properties, including information on location, area, property type, accompanying facilities, images, videos or extended descriptions. The system will use web scraping techniques and robotic automation processes to automate the process of accessing and collecting information from websites. The system will analyze the websites’ content and identify the elements needed to extract information by sending HTTP requests to websites and receiving HTML data. Collecting complete and accurate data is very important because it will directly affect the reliability of aquaculture real estate price prediction models, helping to improve the ability to make decisions in investment and development.
The second phase involves redistributing the data and performing data pre-processing, data storage and management. First, the data is cleaned by removing missing values, incorrect data and outliers. The data is also transformed, where categorical variables are encoded into numeric form, and the data is normalized to a standard scale. The data will be converted into a suitable format and temporarily stored before being integrated from various sources. Next, data collected from multiple sources is integrated into a single dataset, ensuring that all relevant information is covered. The data will be stored on an internal server and backed up on an AWS cloud server for safety. Data governance policies will be established in this phase, along with data flow management, reporting and data monitoring to detect errors or anomalies.
The final phase is data consumption, in which predictive modeling will perform statistical analysis to gain a deeper understanding of the data. Machine learning algorithms will be applied to predict aquaculture real estate prices. The analysis results will be visualized to support decision-making and improve market understanding.
3.2. Aquaculture Real Estate Price Prediction Based on Machine Learning
The process of building prediction models for aquaculture real estate prices is performed in Figure 2. Real estate data is collected from market datasets and other information sources datasets. The data is extracted into key elements and undergoes processing, including data cleaning, applying feature engineering to create new variables and data normalization/standardization. The data is then divided into training and testing datasets for machine learning models. We apply multiple machine learning algorithms, including Linear Regression, Decision Tree, Random Forest, and Gradient Boosting, as well as Stacking Ensemble, to ensure comprehensive comparison. Finally, the model is evaluated through performance metrics. The analysis results will be visualized to support decision-making and improve market understanding.
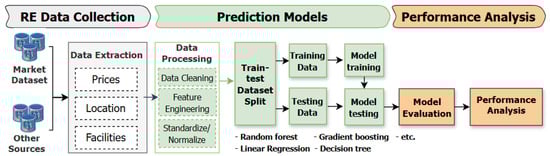
Figure 2.
Aquaculture Real Estate Price Prediction Based on Machine Learning Models.
To address the research gap of the lack of comparative studies between different machine learning methods in the context of aquaculture real estate, we examine the performance of machine learning models to evaluate which model works best with our aquaculture real estate dataset.
- Linear Regression: The main idea of linear regression is to model the relationship between a dependent variable and independent variables using a linear function to predict the dependent variable’s value [10].
- Random Forest: The main idea of a decision tree is to divide data into branches based on attributes, with each node representing an attribute, a branch representing a decision, and a leaf representing a prediction [47]. Finally, at the leaves of the tree, the predicted value for will be given, which can be the average of the values in that branch or according to a specific rule. Random Forest is a method that uses multiple decision trees, each built from a random sample of data, to increase diversity and predict outcomes [48]. Since each decision tree does not use all the training data, nor does it use all the data attributes to build the tree, each tree may not predict well. However, the final result of the Random Forest algorithm is a synthesis of many decision trees, so the information from the trees will complement each other, leading to a model with low bias and low variance or a model with good prediction results.
- Gradient Boosting: Gradient Boosting employs an iterative, sequential approach to construct powerful predictive models by strategically combining numerous weaker models [49]. The algorithm begins with a simple baseline prediction, such as the average aquaculture property price, then progressively refines its accuracy through a carefully designed three-step cycle: (1) calculates the residuals (the difference between the prediction and the actual value), (2) trains a new model on these residuals, and (3) updates the overall prediction by adding a small fraction of the predictions from the new model, which controlled by a learning rate parameter. This model captures the complex, nonlinear relationships between critical real estate variables. By systematically reducing residuals through this adaptive process, Gradient Boosting achieves superior predictive performance in dynamic real estate markets where multiple interdependent factors influence pricing patterns, ultimately providing more accurate and reliable property value forecasts. In this research, two modern variants, XGBoost and CatBoost, are employed. XGBoost enhances traditional Gradient Boosting by incorporating a regularization mechanism, handling internal missing values and optimizing computation in parallel, thereby increasing accuracy and reducing overfitting [50]. CatBoost is designed to handle categorical features efficiently, thanks to its ordered boosting mechanism and advanced target encoding techniques [51]. This makes it very suitable for real estate data, which often contains many categorical variables, such as location, land type, and legal status.
Finally, we use a hyperparameter tuning procedure and combine our models into an ensemble model to improve the overall efficiency of the aquaculture real estate price prediction model. We apply the Optuna method to perform hyperparameter optimization [52]. This is a Bayesian search-based method that explores the parameter space much faster than the traditional grid search. Specifically, we have optimized several hyperparameters for the CatBoost regressor, including the number of trees (100–500), the maximum depth (4–12), the learning rate (0.01–0.3), the L2 regularization factor (1–10), and both subsampling rates and level-specific feature ratios. Likewise, we have optimized hyperparameters such as the number of trees, the maximum depth, the learning rate, the maximum number of leaves, the subsampling ratio, the tree-specific feature ratios, as well as the L1 and L2 regularization factors for the LightGBM regressor in their optimal range. Both models were evaluated by performing 50 trials using 5-fold cross-validation and selecting the model with the highest R2.
Secondly, we develop two ensemble methods to improve the accuracy of the predictions made by our models. First, we have used the Stacking Ensemble method, combining the predictions of four models (CatBoost, LightGBM, XGBoost and Random Forest) with Ridge regression as a meta-modeler to optimize the combination of predictions produced by each of the base models through 5-fold cross-validation. We also implemented the Weighted Voting Ensemble method, using weights determined based on the results of the cross-validation experiments (CatBoost = 0.4, LightGBM = 0.35, XGBoost = 0.25), which enables us to obtain the final prediction as a weighted average.
Performance Analysis
We compare these machine learning model results to find the most effective approach for predicting aquaculture real estate transactions. Three main measures used to evaluate model performance are Root Mean Square Error (RMSE), Mean Absolute Error (MAE). MAE provides information about the degree of deviation without being affected by larger values. Finally, R-Square indicates the proportion of the variation in the dependent variable explained by the independent variables in the model, with a value ranging from 0 to 1. These three measures give us an overview of the model’s performance and its ability to predict accurately.
After tuning the models, we evaluated their performance using the RMSE, MAE and R2 on the test data and the cross-validation, and the Standard Deviation of R2 to evaluate the stability of the results. Furthermore, the target variable has been logarithmically scaled during training and back-scaled during evaluation to accurately determine the accuracy of the error metrics. Finally, we have analyzed the prediction errors using the mean absolute error, median absolute error, percent error and the percentage of predictions within the intervals of ±10%, ±20%, ±30% and ±50%.
3.3. Experiment Environment
To support our analytical work, we implemented a robust computing system centered around an Intel® Xeon® E5-2687W v4 processor (3.00 GHz) with 128 GB RAM, capable of efficiently processing large-scale datasets. The Windows 10-based system provided both the computational power needed for our analytical workflows and secure storage for research data. During development, we iteratively refined our framework using prototype tools and specialized programming environments tailored to our analytical needs.
We employed Visual Studio, an integrated development environment (IDE) developed by Microsoft. The database management system employed is PostgreSQL. The machine learning prediction model was developed using the Python integrated development environment (IDE) and the relevant libraries, such as Pandas for importing data, NumPy for performing computations, Matplotlib version 3.8 for generating visuals, Scikit-learn, and Seaborn for visualizing statistical data.
4. Implementation Results and Performance Evaluation
4.1. Dataset Collection
We collected raw data from the three main real Vietnam estate websites, including: Batdongsan.com.vn (leading sites providing rich information on real estate types [53]), CafeLand.vn https://batdongsan.com.vn/ (accessed on 10 February 2025) (providing in-depth analysis of the market and investment trends [54]) and Dothi.net (providing information on real estate from cities such Hanoi City, Ho Chi Minh City, etc. [55]).
The data collected from these real estate websites provides information about the Vietnam real estate market. Generally, information about the type of real estate, area, size of the property, selling price and rental price is included. In addition, legal information is also collected, including the legal status of the real estate, whether it has a red book, a common name for the certificate of land use rights, or not. Real photos and videos of real estate are also collected. Location information, including specific addresses and surrounding amenities such as schools, hospitals and shopping centers, is also essential. The crawled data are described in Table 3.
Table 3.
Summary Crawled Data Description.
The collected real estate dataset encompasses a range of property features that can be exploited to build a price prediction model. First, the location-related fields such as city_id, district_id, Location and locations_display can help models learn the difference in price levels between cities, districts or suburbs. In addition, the classification fields such as category_id, subcategory_id, property_type and property_subtype help the model recognize the type of real estate.
The collected real estate dataset encompasses a range of property features that can be exploited to build a price prediction model. First, the location-related fields such as city_id, district_id, Location and locations_display can help models learn the difference in price levels between cities, districts or suburbs.
Next, the classification fields such as category_id, subcategory_id, property_type and property_subtype help the model recognize the type of real estate. However, within the scope of this study, we only focus on analyzing real estate related to aquaculture. To ensure accuracy and suitability for the research objectives, the data was purposefully selected based on the classification fields. These fields help to accurately identify the types of land or farms that serve aquaculture, while eliminating irrelevant real estate. Filtering data based on this classification structure helps optimize the quality of the input dataset and ensures that the analysis results accurately reflect the characteristics of the aquaculture sector.
The attributes field in JSON format is useful because it contains detailed information. In addition to structured data, text fields such as Title and Summary can be mined using rule-based methods to extract important features. The number of images (total_images) is an indirect signal of the completeness of the listing, which can also affect the estimated value. Finally, the price field provides the target value to train the model.
Time information, such as publish_at, helps to analyze market trends over time. However, in this study, url, publish_at, and other fields will be removed.
4.2. Data Preparation
The data processing process includes seven consecutive steps to clean, extract information and build a feature set for the real estate price prediction model, as shown in Figure 3.
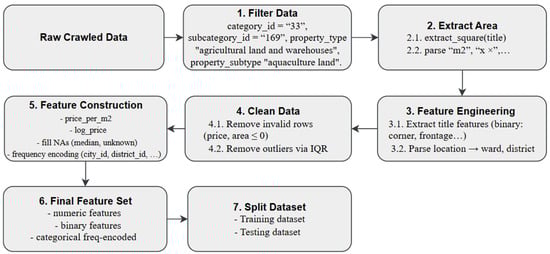
Figure 3.
Data Preparation Process.
First, the raw data is filtered based on classification parameters such as category_id, subcategory_id, property_type, and property_subtype to retain only listings related to aquaculture land. Specifically, the filtering criteria include category_id = “33”, subcategory_id = “169”, property_type = “agricultural land and warehouses”, and property_subtype = “aquaculture land.”
The area is a fundamental factor that directly affects the value of real estate. In aquaculture, properties with large areas often have higher prices due to providing more space for aquaculture activities. Then, area information is extracted and normalized by analyzing the listing title, identifying data patterns such as “m2”, “m2” or “x ×” size forms. Next, the data is expanded through feature extraction techniques, including binary features representing location (frontage, corner, alley, etc.), legality (red book, owner) or accessibility, and analyzing the location field to separate ward, commune, district, province.
After filtering, the real estate area is normalized from two sources: the area field available in the data and the area inferred from the listing title. The extract_square function recognizes common patterns such as “100 m2”, “120 m2” or the size form “5 × 20” to infer the area. These values are then merged using the merge_area function to create a more reliable and consistent area_final variable.
Next, the data is expanded through the feature extraction process from the title using the extract_features function, in which many important signals are identified. After the features are added, the data is further cleaned by removing invalid records (price or area equal to 0) and applying the IQR method to remove outliers, reduce noise and increase stability for the machine learning process.
In the next stage, new features are built, including price per square meter (price_per_m2) and logarithm of price (log_price), to improve data distribution. Price per square meter provides a clearer view of the actual value of real estate. Numerical variables such as area_final or total_images are treated with median missing values, while categorical variables such as city_id, district_id and district are encoded with frequency encoding, which helps the model exploit distribution relationships better. Finally, all the encoded numerical, binary and categorical features are synthesized into a completed and optimized dataset, ready for training the real estate price prediction model.
4.3. Correlation Analysis
The feature set of the constructed dataset is organized into three main groups to optimize the ability to predict the price of aquaculture real estate. The numerical feature group includes quantitative variables such as final area (area_final), the number of images in the listing (total_images), price, log-price, and price per square meter. These are variables that directly reflect the scale and real value of real estate. In addition, the binary feature group is extracted from the content of the listing title, representing important factors such as location (corner land, frontage, in alley), accessibility (car road), urgency of the listing, ownership and legal status, along with the nature of the land type (residential land, agricultural land, warehouse). These features enable the model to leverage semantic information that raw data does not directly convey.
In addition, categorical features such as city_id, district_id, and district are converted into frequency encoding, which preserves the distribution information and reduces the dimensionality compared to the one-hot encoding method. This approach enables the model to comprehend the popularity of each area, which can significantly impact land prices. This set of features is then used for correlation analysis and as input to the real estate price prediction model.
The correlation matrix (see Figure 4) indicates that area (area_final) is the factor with the strongest influence on real estate prices, with a correlation coefficient of approximately 0.43, which is significantly higher than that of the remaining characteristics. This reflects the characteristics of the market, where large areas are often associated with higher values.
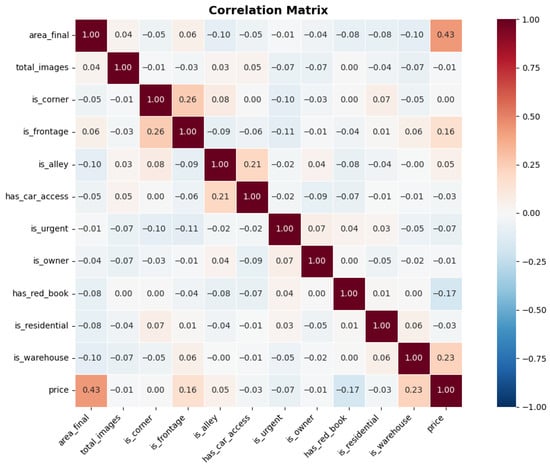
Figure 4.
Correlation Matrix Analysis Results.
Some factors related to location, such as frontage (is_frontage) or warehouse characteristics (is_warehouse), also have positive correlations, but the level is only weak to medium. In contrast, many other characteristics, such as the number of photos in the listing, whether the owner posts the listing (is_owner), urgency (is_urgent) or has_car_access, have very low correlations. Notably, the variable related to the red book (has_red_book) has a slightly negative correlation, which may reflect the characteristics of this segment, when many plots of land have high value but are not legally complete. Results in Figure 5 show that area remains the most important explanatory variable, while most of the remaining binary variables play a complementary role and are more suitable when exploited by machine learning models in a non-linear manner.
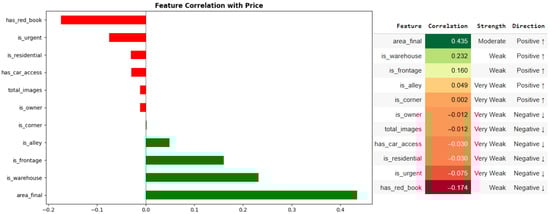
Figure 5.
Feature Correlation with Price.
4.4. Machine Learning Predicting Results
There is a total of 1420 usable data points in this dataset, which covers almost 4 years from January 2021 until March 2025. We split the dataset into 3 parts, including 80% for training, 15% for validation, and 5% for testing. The validation set plays an important role in the entire model-building process. Specifically, this set is used to fine-tune the hyperparameters of each model, adjusting the learning parameters to optimize accuracy. For boosting models such as CatBoost, XGBoost and LightGBM, the validation set is also used for early stopping to prevent overfitting and improve generalization ability. At the same time, the validation set also supports the selection of the optimal model configuration before the final evaluation. We do not apply cross-validation due to the limited dataset size and high computational cost of boosting models. Instead, we use a fixed validation set to help ensure consistency when comparing models. The test set is kept completely intact and is only used in the final step to objectively evaluate the predictive performance of each model.
We have built different models to predict the price of aquaculture real estate, including Random Forest, CatBoost, Hybrid, XGBoost, LightGBM and Linear Regression. Linear Regression helps to determine the linear relationship between input factors and prices. Tree-based models (Random Forest, XGBoost, LightGBM and CatBoost) were configured with n_estimators set to 100, while other hyperparameters remained at their default values. Linear Regression was implemented using default parameters. A random seed of 42 was set for reproducibility across all applicable models. The performance of various models was evaluated using MAE, RMSE and R2 metrics as presented in Table 4. The results show a difference in performance between the methods.
Table 4.
Comparative Evaluation of Machine Learning Models for Aquaculture Real Estate Price Prediction.
Random Forest performs the most successful model, yielding an R2 of 0.5445. This indicates that the model was able to explain approximately 54.45% of the variation in real estate prices. With an RMSE of 4.418 million, the model exhibited small errors for predictions. The Random Forest model was expected to perform well given its capabilities to handle multiple categories as well as complex or nonlinear relationships within the data. CatBoost was the next strong model with very close performance (R2 = 0.5427) to Random Forest. CatBoost also demonstrated the smallest MAE (2.138 million) among the models, indicating the least variability in the model’s predictions and fewer outlier values. While the Hybrid Model utilized the results of Random Forest, XGBoost, LightGBM and CatBoost combined, it did not demonstrate improved performance compared to the Random Forest Model alone. This suggests that the models are detecting distinct patterns in the data that the hybrid model cannot identify. Therefore, the models do not provide additive value. XGBoost and LightGBM demonstrated average performance (R2 ≈ 0.47–0.48). Both were much less effective than Random Forest and CatBoost. Linear Regression had the worst performance (R2 = 0.3087), indicating that the relationship between features and real estate price is clearly nonlinear.
Analysis of the top important features, as determined by the LightGBM model (See Figure 6), reveals that the impact structure is relatively consistent with other decision tree models. At the same time, it provides a clearer view of the level of influence each factor has on the price of aquaculture real estate.
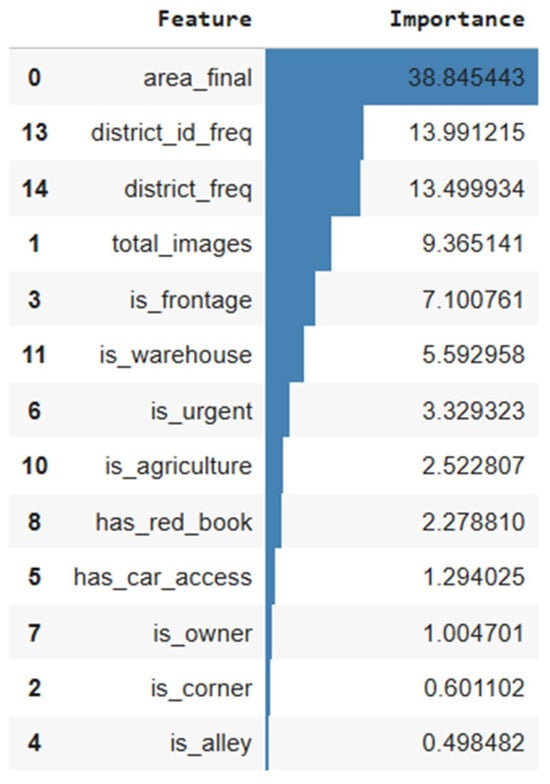
Figure 6.
Top important features. Note. The background color gradient reflects feature importance scores, with darker blue indicating greater contribution to the model.
The actual area (area_final) remains the feature of outstanding importance, reaffirming the traditional role of area in real estate valuation. Location-related factors, including district_id_freq, district_freq, and city_id_freq, are also among the top features, highlighting the close relationship between geographic location and the market value of aquaculture land. At the same time, it provides a clearer view of the level of influence each factor has on the price of aquaculture real estate. The actual area (area_final) remains the feature of outstanding importance, reaffirming the traditional role of area in real estate valuation. Location-related factors, including district_id_freq, district_freq and city_id_freq, are also among the top features, highlighting the close relationship between geographic location and the market value of aquaculture land. Additionally, the number of images (total_images) suggests a lower level of importance. Several binary features, such as is_frontage, has_car_access, is_agriculture, is_warehouse and has_red_book, are also in the less important group, reflecting the roles of infrastructure, legality and accessibility in price formation. Headline features such as is_urgent, is_owner and is_corner have a lower influence but still contribute to the ability to differentiate different types of real estate.
4.5. Prediction Model Refinement
During the input variable selection phase, we considered all extracted data fields, including area, location, number of images, legal features, sale status, transport accessibility, and signals from the listing title. After conducting correlation analysis, feature importance assessment using CatBoost and Random Forest and ablation testing, we retained variables that contributed significantly to the model, particularly area, geographic location, and amenities or features related to the property’s profitability. Variables with low contribution or high noise were excluded from the final model to prevent overfitting and maintain interpretability. We have optimized several hyperparameters for the CatBoost regressor, including the number of trees (100–500), the maximum depth (4–12), the learning rate (0.01–0.3), the L2 regularization factor (1–10), and both subsampling rates and level-specific feature ratios. Likewise, we have optimized hyperparameters such as the number of trees, the maximum depth, the learning rate, the maximum number of leaves, the subsampling ratio, the tree-specific feature ratios, as well as the L1 and L2 regularization factors for the LightGBM regressor in their optimal range. Both models were evaluated by performing 50 trials using 5-fold cross-validation and selecting the model with the highest R2. Secondly, we develop two ensemble methods. The Stacking Ensemble method combines the predictions of four models (CatBoost, LightGBM, XGBoost, and Random Forest) with Ridge regression as a meta-modeler to optimize the combination of predictions produced by each of the base models through 5-fold cross-validation. We also implemented the Weighted Voting Ensemble method, using weights determined based on the results of the cross-validation experiments (CatBoost = 0.4, LightGBM = 0.35, XGBoost = 0.25).
Model refinement and evaluation results are summarized in Table 5. The Hyperparameter Tuning using Optuna for the Baseline Models improved all models, compared to the previous versions. The combination of the 4 baseline models into a Stacked Ensemble Model provided the best Results: R2 (Test) = 0.5738; RMSE = 4.273 million; MAE = 2.022 million. CatBoost (Tuned) provided the second-best results with R2 (Test) = 0.5493. The performance increased by approximately 1.2%. Weighted voting had R2 (Test) = 0.5387 and R2 (CV) = 0.4247. Weighted voting performed well in terms of stability across multiple datasets and test set performance. Random Forest (Tuned) exhibited the worst results among the group with an R2 (Test) = 0.5013, down from the original version (R2 = 0.5445).
Table 5.
Model Refinement and Evaluation Results.
4.6. Results Discussion
Model performance before and after hyperparameter tuning is presented in Table 6. In the first phase, all models were initially built using a default setting and contained 100 estimators. Results from testing revealed that the Random Forest is the best model, due to the nature of aquaculture real estate data, which includes many categories associated with the location of land, the type of land, and the legal status, and has many complicated nonlinear relationships among its attributes.
Table 6.
Model Performance Before and After Hyperparameter Tuning.
After hyperparameter tuning using Optuna (50 trials, 5-fold cross-validation), the model performance improved. Stacking Ensemble is the best-performing model. The R2 value of 0.5738 indicates that the model explains approximately 57% of the price variation, consistent with the fact that aquaculture land prices depend on many factors that are difficult to measure, such as water quality, salinity, surrounding ecosystems, specific farming potential and local market conditions. The prediction error at MAE ≈ 2.022 million is equivalent to an error of approximately 10–20%. The feature importance analysis also reveals that factors such as title length, number of images, and geographic location significantly contribute to the model, reflecting the characteristics of the Vietnamese market, where the quality of online posting information is often correlated with property value.
However, the research still has some limitations, including the fact that approximately 43% of the variance is unexplained due to the lack of in-depth features on farming conditions. Also, the number of samples available is low at 1420 records, specifically in relation to the sample size required for high-variance ensemble models (Random Forest or Gradient Boosting). Furthermore, the geographic location of the samples was limited to only the Southern region of Vietnam. The results may not accurately represent the full range of diversity in the aquaculture real estate markets of other regions in Vietnam.
The primary goal of this research project is to examine and compare the performance of various machine learning models in a specific industry, namely the aquaculture real estate market of the southern region of Vietnam. Our research project is a case study with a clear definition of geography and time frame. Although our data only represents Southern Vietnam and is therefore not representative of the rest of the country, we must note that the South of Vietnam produces over 70% of Vietnam’s aquaculture products and is home to the majority of the real estate used to support aquaculture. Hence, even though we have focused on Southern Vietnam, this geographic focus provides substantial practical relevance. Lastly, this research project provides a comprehensive process, methodically, from data collection through to model development and refinement for a specific type of real estate. The coordinate data in the current study have many limitations. Data collected from these websites only provides location information at the district or ward/commune level, whereas precise geographic coordinates (latitude and longitude) are not available. Therefore, variables related to location are coded by frequency and classified at the district level. The methodology is too simplistic and does not account for the spatial dependency that exists in the real estate market. Spatial econometric methodologies, such as Geographically Weighted Regression (GWR), Spatial Random Forest, or methodologies based on Kriging, have not been utilized due to the lack of exact geographic coordinates. These limitations make it challenging to model provinces with high spatial heterogeneity, such as Ho Chi Minh City and Ca Mau, which exhibit significant variations in real estate prices within the same administrative area. It would be beneficial for future research to include accurate geographic coordinates, run spatial diagnostics (Moran’s I, Lagrange Multiplier), and utilize spatial cognitive models to enhance the power of inference and predictive capacity of the models. Also, variables essential to aquaculture valuation (coastal geomorphology, production intensity, climate risk exposure, and regulatory zoning) were not provided in the source data and could not be reliably inferred from listing descriptions. To address this issue, future work should be integrated with high-quality environmental and regulatory datasets. The potential improvements include (i) linking listings to remote-sensing or hydrological databases to extract water-quality and land-use indicators; (ii) incorporating coastal morphology and climate-risk indexes derived from satellite imagery; and (iii) merging governmental zoning maps to capture constraints and opportunities related to aquaculture policy. Finally, analyzing overtime to assess the impact of seasonality and market cycles through longer time series data can be developed.
5. Conclusions
The sustainable growth of the aquaculture industry depends on the development of facilities and technical infrastructure in close connection to the increased demands of aquaculture real estate. An efficient information management system is becoming increasingly necessary in this industry due to the rise in transactions and price fluctuations. This research provides a comprehensive process, methodically, from data collection to model development and refinement for aquaculture real estate. Three significant Vietnamese real estate platforms, including Batdongsan.com.vn, CafeLand.vn, and Dothi.net, were the sources of the data we collected and examined for our study. We conducted experiments and assessed six different models, including Random Forest, CatBoost, Hybrid, XGBoost, LightGBM and Linear Regression, to predict aquaculture real estate price. Results from testing revealed that the Random Forest is the best model, due to the nature of aquaculture real estate data, which includes many categories associated with the location of land, the type of land, and the legal status, and has many complicated nonlinear relationships among its attributes. After hyperparameter tuning using Optuna (50 trials, 5-fold cross-validation), the model performance improved. Stacking Ensemble is the best-performing model. The experimental results demonstrate that the Stacking Ensemble model achieved the best performance after hyperparameter tuning, with RMSE of 4394.77 million, MAE of 2114.19 million, and R2 of 0.5738, representing improvements of 3.3%, 6.0%, and 5.4%.
This paper contributes to the aquaculture industry by exploring real estate areas, expanding the scope of real estate research, and focusing on the aquaculture sector. This field of research has been relatively underexplored in previous studies. Applying machine learning algorithms to predict aquaculture real estate prices provides a more scientific and accurate method for evaluating real estate values in the industry.
However, there are limitations that should be acknowledged. First, the coordinated data in the current study has many limitations. Data collected from these websites only provides location information at the district or ward/commune level, whereas precise geographic coordinates (latitude and longitude) are not available. Therefore, variables related to location are coded by frequency and classified at the district level. This methodology is simplistic and does not account for the spatial dependency that exists in real estate markets. Second, variables essential to aquaculture valuation (coastal geomorphology, production intensity, climate risk exposure, and regulatory zoning) were not provided in the source data and could not be reliably inferred from listing descriptions. To improve the limitations and enhance the generalizability of the results, future research directions can be taken. For future research, the following improvements will be included: (i) including accurate geographic coordinates for spatial diagnostics; (ii) linking listings to remote-sensing or hydrological databases to extract water-quality and land-use indicators; (iii) incorporating coastal morphology and climate-risk indexes derived from satellite imagery; (iv) merging governmental zoning maps to capture constraints and opportunities related to aquaculture policy; and (v) analyzing overtime trends to assess the impact of seasonality and market cycles through longer time series data.
Author Contributions
Conceptualization, N.-B.-V.L. and Y.L.; data curation, N.-B.-V.L., H.-J.K. and Y.L.; formal analysis, Y.L.; funding acquisition, H.-J.K. and Y.L.; investigation, N.-B.-V.L. and H.-J.K.; methodology, N.-B.-V.L. and J.-H.H.; project administration, H.-J.K.; resources, N.-B.-V.L.; software, N.-B.-V.L., J.-H.H. and Y.L.; supervision, J.-H.H., H.-J.K. and Y.L.; validation, N.-B.-V.L., J.-H.H. and H.-J.K.; visualization, J.-H.H. and H.-J.K.; writing—original draft, N.-B.-V.L., J.-H.H., H.-J.K. and Y.L.; writing—review and editing, J.-H.H., H.-J.K. and Y.L. All authors will be updated at each stage of manuscript processing, including submission, revision, and revision reminder, via emails from our system or the assigned Assistant Editor. All authors have read and agreed to the published version of the manuscript.
Funding
This work was supported by the Korea Institute of Planning and Evaluation for Technology in Food, Agriculture and Forestry (IPET) and the Korea Smart Farm R&D Foundation (KosFarm) through the Smart Farm Innovation Technology Development Program, funded by the Ministry of Agriculture, Food and Rural Affair (MAFRA) and the Ministry of Science and ICT (MSIT), Rural Development Administration (RDA) (grant number: RS-2025-02305747).
Institutional Review Board Statement
Not applicable.
Informed Consent Statement
Not applicable.
Data Availability Statement
Please contact the corresponding author for data requests. The coding environment employed is Visual Studio, encompassing Python programming capabilities alongside Node.js and React Native. The database management system in use is PostgreSQL. We have published the resources of the article on GitHub version 3.12.5 [56]. Ref. [56] Ngoc-Bao-Van Le et al. Aquaculture-Real-Estate-Price-Prediction-System. Accessed: 11 June 2025 [Online]. Available: https://github.com/baovanle/Aquaculture-Real-Estate-Price-Prediction-System.
Conflicts of Interest
The authors declare no conflict of interest.
References
- Subasinghe, R.; Soto, D.; Jia, J. Global aquaculture and its role in sustainable development. Rev. Aquac. 2009, 1, 2–9. [Google Scholar] [CrossRef]
- Le, N.-B.-V.; Woo, H.; Lee, D.; Huh, J.-H. AgTech: A Survey on Digital Twins Based Aquaculture Systems. IEEE Access 2024, 12, 125751–125767. [Google Scholar] [CrossRef]
- Zhang, L.; Hou, Y.; Ye, W.; Yuan, Y.; Li, Q.; Jiang, S.; Li, H.; Qiang, J.; Lu, S.; Li, B.; et al. The Establishment and Operation of Aquaparks—Experiences from China; Food and Agriculture Organization of the United Nations (FAO): Rome, Italy, 2024. [Google Scholar] [CrossRef]
- Hein, A.; Naing, Z.M. Aquaculture, Land Ownership, Land Markets and Tenure Security in MYANMA. Livelihoods and Food Security Fund (LIFT). 2017. Available online: https://www.lift-fund.org/en (accessed on 4 September 2025).
- Ullah, F.; Sepasgozar, S.M.E.; Wang, C. A systematic review of smart real estate technology: Drivers of, and barriers to, the use of digital disruptive technologies and online platforms. Sustainability 2018, 10, 3142. [Google Scholar] [CrossRef]
- Li, J. The Real Estate Big Data Analysis System Based on Cloud Computing. In Proceedings of the 2021 13th International Conference on Measuring Technology and Mechatronics Automation (ICMTMA), Beihai, China, 16–17 January 2021; pp. 729–732. [Google Scholar] [CrossRef]
- Xu, H.; Gade, A. Smart real estate assessments using structured deep neural networks. In Proceedings of the 2017 IEEE SmartWorld, Ubiquitous Intelligence & Computing, Advanced & Trusted Computed, Scalable Computing & Communications, Cloud & Big Data Computing, Internet of People and Smart City Innovation (SmartWorld/SCALCOM/UIC/ATC/CBDCom/IOP/SCI), San Francisco, CA, USA, 4–8 August 2017; pp. 1–7. [Google Scholar] [CrossRef]
- Roy, S.; Gupta, S.; Mukherjee, P. Enhanced Real Estate Forecasting using Decision Tree with Hyperparameters Tuning. In Proceedings of the 2024 3rd International Conference on Applied Artificial Intelligence and Computing (ICAAIC), Salem, India, 5–7 June 2024; pp. 1023–1027. [Google Scholar] [CrossRef]
- Yücebaş, S.; Doğan, M.; Genç, L. A C4. 5–Cart decision tree model for real estate price prediction and the analysis of the underlying features. Konya J. Eng. Sci. 2022, 10, 147–161. [Google Scholar] [CrossRef]
- Ghosalkar, N.N.; Dhage, S.N. Real Estate Value Prediction Using Linear Regression. In Proceedings of the 2018 Fourth International Conference on Computing Communication Control and Automation (ICCUBEA), Pune, India, 18 August 2018; pp. 1–5. [Google Scholar] [CrossRef]
- Liu, G. Research on prediction and analysis of real estate market based on the multiple linear regression model. Sci. Program. 2022, 2022, 750354. [Google Scholar] [CrossRef]
- Floyd, C.F.; Allen, M.T. Real Estate Principles; Dearborn Real Estate: Dearborn, MI, USA, 2002. [Google Scholar]
- Rymarzak, M.; Siemińska, E. Factors affecting the location of real estate. J. Corp. Real Estate 2012, 14, 214–225. [Google Scholar] [CrossRef]
- Joshua, K.; Thomsett, M.C. Real Estate Market Valuation and Analysis; John Wiley & Sons: Hoboken, NJ, USA, 2006. [Google Scholar]
- Das, P.; Smith, P.; Gallimore, P. Pricing Extreme Attributes in Commercial Real Estate: The Case of Hotel Transactions. J. Real Estate Financ. Econ. 2017, 57, 264–296. [Google Scholar] [CrossRef]
- Bourassa, S.C.; Haurin, D.R.; Haurin, J.L.; Hoesli, M.; Sun, J. House price changes and idiosyncratic risk: The impact of property characteristics. Real Estate Econ. 2009, 37, 259–278. [Google Scholar] [CrossRef]
- Morshuis, F.G.F. The Development of a Digital Multi-Sided Commercial Real Estate Platform: Research to the Relevant Features That are to be Fulfilled. Bachelor’s Thesis, University of Twente, Enschede, The Netherlands, 2022. [Google Scholar]
- Oluwunmi, A.O.; Role, B.A.; Akinwale, O.M.; Oladayo, O.P.; Afolabi, T.O. Big data and real estate: A review of literature. In Journal of Physics Conference Series; IOP Publishing: Bristol, UK, 2019; Volume 1378, p. 032015. [Google Scholar]
- Augustyniak, H.; Łaszek, J.; Olszewski, K.; O’Brien, D.; Westermann, T.; Krysiak, Z.; Kirejczyk, K.; Lea, M.; Karl, G.; Tumanov, A.; et al. Papers presented during the Narodowy Bank Polski Workshop: Recent trends in the real estate market and its analysis, 2013. In NBP Conference Publications; Narodowy Bank Polski, Economic Research Department: Warsaw, Poland, 2013. [Google Scholar]
- Archana, S.; Sharma, A.; Dubey, G. Big data analytics predicting real estate prices. Int. J. Syst. Assur. Eng. Manag. 2020, 11, 208–219. [Google Scholar] [CrossRef]
- Pérez-Rave, J.I.; Correa-Morales, J.C.; González-Echavarría, F. A machine learning approach to big data regression analysis of real estate prices for inferential and predictive purposes. J. Prop. Res. 2019, 36, 59–96. [Google Scholar] [CrossRef]
- Lee, S.-H.; Kim, J.-H.; Huh, J.-H. Land price forecasting research by macro and micro factors and real estate market utilization plan research by landscape factors: Big data analysis approach. Symmetry 2021, 13, 616. [Google Scholar] [CrossRef]
- Coleman, W.; Johann, B.; Pasternak, N.; Vellayan, J.; Foutz, N.; Shakeri, H. Using Machine Learning to Evaluate Real Estate Prices Using Location Big Data. In Proceedings of the 2022 Systems and Information Engineering Design Symposium (SIEDS), Charlottesville, VA, USA, 28–29 April 2022; pp. 168–172. [Google Scholar] [CrossRef]
- Sisman, S.; Aydinoglu, A.C. Improving performance of mass real estate valuation through application of the dataset optimization and Spatially Constrained Multivariate Clustering Analysis. Land Use Policy 2022, 119, 106167. [Google Scholar] [CrossRef]
- Eltweri, A.; Faccia, A.; Khassawneh, O. Applications of big data within finance: Fraud detection and risk management within the real estate industry. In Proceedings of the 2021 3rd International Conference on E-Business and E-commerce Engineering, Sanya, China, 17–19 December 2021; pp. 67–73. [Google Scholar]
- Cheng, X.; Yuan, M.; Xu, L.; Zhang, T.; Jia, Y.; Cheng, C.; Chen, W. Big data assisted customer analysis and advertising architecture for real estate. In Proceedings of the 2016 16th International Symposium on Communications and Information Technologies (ISCIT), Qingdao, China, 26–28 September 2016; pp. 312–317. [Google Scholar] [CrossRef]
- Rachman, A.; Diandra, N.; Hapsari, A.A. Smart Construction Management: Applying AI for Enhanced Real Estate Marketing and Consumer Insights. In Proceedings of the International Conference on Digital, Social, and Science, Online, 1 August 2024; Volume 1, pp. 411–422. [Google Scholar]
- Mohamed, H.; Martin, E.; Piguet, V. Prediction of the purchase cost of agricultural land: The example of Côte-d’Or, France. Land Use Policy 2016, 52, 464–476. [Google Scholar]
- Reydon, B.P.; Plata, L.E.A.; Sparovek, G.; Goldszmidt, R.G.B.; Telles, T.S. Determination and forecast of agricultural land prices. Nova Economia 2014, 24, 389–408. [Google Scholar] [CrossRef]
- Chen, N. House price prediction model of Zhaoqing city based on correlation analysis and multiple linear regression analysis. Wirel. Commun. Mob. Comput. 2022, 2022, 9590704. [Google Scholar] [CrossRef]
- Yucebas, S.C.; Yalpir, S.; Genc, L.; Dogan, M. Price Prediction and Determination of the Affecting Variables of the Real Estate by Using X-Means Clustering and CART Decision Trees. J. Univers. Comput. Sci. 2024, 30, 531. [Google Scholar] [CrossRef]
- Adetunji, A.B.; Akande, O.N.; Ajala, F.A.; Oyewo, O.; Akande, Y.F.; Oluwadara, G. House price prediction using random forest machine learning technique. Procedia Comput. Sci. 2022, 199, 806–813. [Google Scholar] [CrossRef]
- Sawant, R.; Jangid, Y.; Tiwari, T.; Jain, S.; Gupta, A. Comprehensive Analysis of Housing Price Prediction in Pune Using Multi-Featured Random Forest Approach. In Proceedings of the 2018 Fourth International Conference on Computing Communication Control and Automation (ICCUBEA), Pune, India, 16–18 August 2018; pp. 1–5. [Google Scholar] [CrossRef]
- Hu, L.; Chun, Y.; Griffith, D.A. Incorporating spatial autocorrelation into house sale price prediction using random forest model. Trans. GIS 2022, 26, 2123–2144. [Google Scholar] [CrossRef]
- Kumar, M.A.; Kumar, P.A. Real Estate Cost Prediction Through Web Application Using Random Forest Machine Learning Algorithm and Python Flask. In Proceedings of the 2024 2nd International Conference on Computer, Communication and Control (IC4), Indore, India, 8–10 February 2024; pp. 1–4. [Google Scholar] [CrossRef]
- Tanamal, R.; Minoque, N.; Wiradinata, T.; Soekamto, Y.; Ratih, T. House price prediction model using random forest in surabaya city. TEM J. 2023, 12, 126–132. [Google Scholar] [CrossRef]
- Almaslukh, B. A Gradient Boosting Method for Effective Prediction of Housing Prices in Complex Real Estate Systems. In Proceedings of the 2020 International Conference on Technologies and Applications of Artificial Intelligence (TAAI), Taipei, Taiwan, 3–5 December 2020; pp. 217–222. [Google Scholar] [CrossRef]
- Fedorov, N.; Petrichenko, Y. Gradient boosting–based machine learning methods in real estate market forecasting. In Proceedings of the 8th Scientific Conference on Information Technologies for Intelligent Decision Making Support (ITIDS 2020), Ufa, Russia, 6–9 October 2020; Atlantis Press: Dordrecht, The Netherlands, 2020; pp. 203–208. [Google Scholar]
- Sibindi, R.; Mwangi, R.W.; Waititu, A.G. A boosting ensemble learning based hybrid light gradient boosting machine and extreme gradient boosting model for predicting house prices. Eng. Rep. 2023, 5, e12599. [Google Scholar]
- Monika, R.; Nithyasree, J.; Valarmathi, V.; Hemalakshmi, G.R.; Prakash, N.B. House price forecasting using machine learning methods. Turk. J. Comput. Math. Educ. 2021, 12, 3624–3632. [Google Scholar]
- Kalinga, E.; Nyamle, E.; Abdalla, A. Modelling Prediction of Cities Real Estate Price Trend Using Recurrent Neural Network: A Case of Dar es Salaam City. Tanzan. J. Eng. Technol. 2023, 42, 64–77. [Google Scholar] [CrossRef]
- Lee, J.-H.; Kim, H.-B.; Shim, G.-E. Prediction Model of Real Estate Transaction Price with the LSTM Model based on AI and Bigdata. Int. J. Adv. Cult. Technol. 2022, 10, 274–283. [Google Scholar]
- Tin, T.T.; Wei, C.J.; Min, O.T.; Feng, B.Z.; Xian, T.C. Real estate price forecasting utilizing recurrent neural networks incorporating genetic algorithms. Int. J. Innov. Res. Sci. Stud. 2024, 7, 1216–1226. [Google Scholar] [CrossRef]
- Hussin, R.; Muntaser, A.; Jera, E.; Saide, A.; Elwarfalli, I. Hybrid GRU-LSTM Recurrent Neural Network-Based Model for Real Estate Price Prediction. TechRxiv 2023. [Google Scholar] [CrossRef]
- Li, D.-Y.; Xu, W.; Zhao, H.; Chen, R.-Q. A SVR based forecasting approach for real estate price prediction. In Proceedings of the 2009 International Conference on Machine Learning and Cybernetics, Baoding, China, 12–15 July 2009; pp. 970–974. [Google Scholar] [CrossRef]
- Praba, M.S.B.; Duddukunta, K.R.; Bezawada, V.S.; Addanki, S.V. Predicting Real Estate Price: A Comparative Analysis of Linear Regression and Support Vector Machine. In Congress on Control, Robotics, and Mechatronics; Springer: Berlin/Heidelberg, Germany, 2024; pp. 123–134. [Google Scholar]
- Song, Y.Y.; Lu, Y. Decision tree methods: Applications for classification and prediction. Shanghai Arch. Psychiatry 2015, 27, 130–136. [Google Scholar]
- Les, E.; Faturahman, M.S. Evaluating the Performance of Random Forest Algorithm in Classifying Property Sale Amount Categories in Real Estate Data. Int. J. Appl. Inf. Manag. 2025, 5, 192–202. [Google Scholar] [CrossRef]
- Bentéjac, C.; Csörgő, A.; Martínez-Muñoz, G. A comparative analysis of gradient boosting algorithms. Artif. Intell. Review 2021, 54, 1937–1967. [Google Scholar] [CrossRef]
- Chen, T.; He, T.; Benesty, M.; Khotilovich, V.; Tang, Y.; Cho, H.; Chen, K.; Mitchell, R.; Cano, I.; Zhou, T.; et al. Xgboost: Extreme Gradient Boosting, R Package Version 0.4-21. 2015, pp. 1–4. Available online: https://cran.ms.unimelb.edu.au/ (accessed on 17 October 2025).
- Liudmila, P.; Gusev, G.; Vorobev, A.; Dorogush, A.V.; Gulin, A. CatBoost: Unbiased boosting with categorical features. Adv. Neural Inf. Process. Syst. 2018, 31, 1–11. [Google Scholar]
- Takuya, A.; Sano, S.; Yanase, T.; Ohta, T.; Koyama, M. Optuna: A next-generation hyperparameter optimization framework. In Proceedings of the 25th ACM SIGKDD International Conference on Knowledge Discovery & Data Mining, Anchorage, AK, USA, 4–8 August 2019; pp. 2623–2631. [Google Scholar]
- About us. Batdongsan.com.vn. Available online: https://batdongsan.com.vn/ (accessed on 10 February 2025).
- Cafeland.vn. CafeLand: Trang TTĐT Đầu tư Bất Động sản CafeLand. Tin Nhanh Bất Động Sản Cafeland. 2024. Available online: https://cafeland.vn/ (accessed on 10 February 2025).
- Đô Thị. Dothi.net. 2023. Available online: https://dothi.net (accessed on 10 February 2025).
- Van Le, N.B.; Huh, J.-H. Aquaculture-Real-Estate-Price-Prediction-System. Available online: https://github.com/baovanle/Aquaculture-Real-Estate-Price-Prediction-System (accessed on 11 June 2025).
Disclaimer/Publisher’s Note: The statements, opinions and data contained in all publications are solely those of the individual author(s) and contributor(s) and not of MDPI and/or the editor(s). MDPI and/or the editor(s) disclaim responsibility for any injury to people or property resulting from any ideas, methods, instructions or products referred to in the content. |
© 2025 by the authors. Licensee MDPI, Basel, Switzerland. This article is an open access article distributed under the terms and conditions of the Creative Commons Attribution (CC BY) license (https://creativecommons.org/licenses/by/4.0/).