Abstract
As a critical energy component in electric vehicles, energy storage systems, and other applications, the accurate estimation of the State of Health (SOH) of lithium-ion batteries is crucial for performance optimization and safety assurance. To this end, this paper proposes a hybrid model named Transformer–KAN, which integrates Transformer architecture with Kolmogorov–Arnold Networks (KANs) for precise SOH estimation of lithium-ion batteries. Initially, five health features (HF1–HF5) strongly correlated with SOH degradation are extracted from the historical charge–discharge data, including constant-voltage charging duration, constant-voltage charging area, constant-current discharging area, temperature peak time, and incremental capacity curve peak. The effectiveness of these features is systematically validated through Pearson correlation analysis. The proposed Transformer–KAN model employs a Transformer encoder to capture long-term dependencies within temporal sequences, while the incorporated KAN enhances the model’s nonlinear mapping capability and intrinsic interpretability. Experimental validation conducted on the NASA lithium-ion battery dataset demonstrates that the proposed model outperforms comparative baseline models, including CNN–LSTM, Transformer, and KAN, in terms of both RMSE and MAE metrics. The results indicate that the Transformer–KAN model achieves superior estimation accuracy while exhibiting enhanced generalization capabilities across different battery instances, indicating its strong potential for practical battery management applications.
1. Introduction
Lithium-ion batteries (LIBs) have become the core energy storage components in electric vehicles, smart grid energy storage systems, and portable electronic devices due to their high specific capacity, excellent cycle performance, and environmental friendliness [1]. However, during repeated charge–discharge cycles, LIBs inevitably experience aging phenomena such as capacity fading, performance degradation, and increased internal resistance. These degradation processes not only shorten the effective service life and reduce the performance of batteries but also pose potential safety issues, including thermal runaway and swelling. Therefore, accurate monitoring and assessment of the State of Health (SOH) of lithium-ion batteries is crucial. It plays a key role in optimizing Battery Management System (BMS) performance, extending battery service life, and ensuring the safe and reliable operation of electric vehicles and energy storage systems [2]. In recent years, researchers have proposed various methods for lithium-ion batteries’ SOH prediction, most of which can be categorized into data-driven approaches or model-based methods.
Model-based approaches are traditional methods for SOH estimation, primarily relying on two types of mechanistic models: Equivalent Circuit Models (ECMs) and Electrochemical Models (EMs). ECMs simulate the external characteristics of batteries using a network of electronic components such as resistors and capacitors. These models enable online parameter identification and describe dynamic behaviors, thereby facilitating SOH prediction through simplified circuit representations. Bi Jun et al. [3] employed a least squares method with genetic factors to identify unknown parameters in a second-order equivalent circuit model and used a genetic resampling particle filter to reduce system noise introduced during model processing, achieving precise SOH prediction for lithium-ion power battery packs. Similarly, Chen Meng et al. [4] proposed a multi-factor SOH estimation model constructed using multiple model parameters including ohmic internal resistance, polarization internal resistance, and polarization capacitance. This approach mitigates errors inherent in traditional ECMs that rely solely on ohmic internal resistance. By applying the Kalman filter algorithm and constrained least squares algorithm to determine model parameters and their weights, they enabled real-time SOH estimation for lithium-ion batteries. Although ECM supports online SOH estimation, they are prone to cumulative errors in parameter identification, and their predictive accuracy is highly dependent on the chosen model topology.
The core principle of EM involves establishing partial differential equations (PDEs) that describe ion transport, electrochemical reaction kinetics, and mass conservation inside the battery. By matching experimental observation data through model parameter identification, EMs quantitatively assess the extent of battery SOH degradation. Xiong Rui et al. [5] simplified the pseudo-two-dimensional electrochemical model of lithium-ion batteries using finite analysis and numerical calculations. They identified five model characteristic parameters indicative of battery aging via a genetic algorithm, ultimately deriving a degradation model for lithium-ion batteries. Despite their clear physical interpretability, EMs are hampered by complex PDEs and high-dimensional parameter identification, making it difficult to integrate them into real-time Battery Management Systems (BMSs).
Although theoretical validity in lithium-ion battery SOH estimation, traditional model-based approaches face limitations in practical BMS applications due to high computational complexity, strong parameter dependence, and sensitivity to model structure.
It is worth noting that, to more directly capture the mechanical degradation mechanisms induced by aging, researchers have begun to explore the application of novel sensing technologies in battery health monitoring. Among them, Acoustic Emission (AE) technology has gained attention due to its non-invasive nature, high sensitivity, and real-time monitoring. He et al. [6] innovatively constructed an AE signal monitoring platform for the full lifecycle of lithium-ion batteries. Their research demonstrated a strong correlation between the stress wave signals generated during the charging and discharging of batteries and SOH. By extracting health features such as peak values and energy of AE signals and combining models like random forests, high-precision SOH estimation was achieved. Such work introduces a new sensing dimension beyond conventional electrical and thermal signals, revealing the potential of mechanical behavior analysis for characterizing battery health.
In recent years, advances in machine learning and deep learning have spurred growing interest in data-driven SOH estimation methods for lithium-ion batteries. Unlike model-based approaches that require sophisticated physicochemical models or intricate parameter identification, data-driven techniques circumvent the need for in-depth mechanistic understanding, thus offering a more straightforward path to implementation in BMS. The typical workflow of data-driven approaches comprises three key stages: data acquisition, health feature extraction, and model development. During feature extraction, emphasis is placed on deriving health indicators strongly correlated with battery aging from externally measurable parameters, such as charge–discharge voltage/current profiles. These discriminative features are crucial for enhancing the model’s capability to accurately map relationships with the SOH. The construction of deep learning models is particularly critical: a well-designed model can not only efficiently and accurately learn complex nonlinear relationships between features and SOH but also exhibit strong generalization performance. Currently, popular data-driven models mainly include Convolutional Neural Networks (CNNs) [7,8,9], Gaussian Process Regression (GPR) [10,11,12], Support Vector Machines (SVMs) [13,14], Long Short-Term Memory (LSTM) [15,16,17], and Gated Recurrent Units (GRUs) [18,19,20]. Building on these foundations, many researchers have proposed innovative methods integrating traditional models with novel techniques, including creative feature extraction and optimization strategies for machine learning models. Zhang et al. [21] proposed a CNN–LSTM hybrid model that extracts multiple key indicators from charging voltage, current, and temperature data, effectively addressing limitations in estimation accuracy and the inadequacy of single indicators in capturing degradation characteristics. Saleem U et al. [22] innovatively combined CNN, Bidirectional LSTM (BiLSTM), and attention mechanisms, incorporating dilated convolution to capture long-term dependencies, and used sliding window technology to process lithium-ion battery charge/discharge data (voltage, current, temperature, and capacity), thereby significantly improving lithium-ion battery SOH estimation accuracy. Since LSTM does not fundamentally resolve long-term dependency issues, Gu et al. [23] adopted a Transformer model based on an attention mechanism to capture global dependencies in input sequences, offering greater parallelism, efficiency, and representational capacity for SOH estimation.
In terms of model architecture, the evolution from traditional CNN and LSTM to Transformer reflects a continuous pursuit of stronger feature extraction and temporal dependency modeling. In recent years, “hybrid architectures” that integrate the strengths of different models have emerged as an important trend for improving performance and robustness. This trend encompasses not only combinations of purely data-driven models but also deep integration of data-driven and model-based approaches. To address the challenge of data scarcity in battery fault diagnosis, Zhang et al. [24] proposed a framework coupling Temporal Convolutional Network (TCN), BiLSTM, and ECM. By combining the physical constraints of ECM with the powerful nonlinear fitting capability of data-driven models, this framework significantly enhanced the reliability of early fault diagnosis, demonstrating the considerable potential of hybrid modeling in addressing complex battery state estimation challenges.
Data-driven methods generally exhibit low computational complexity and greater flexibility compared to model-based approaches. They are capable of characterizing local energy regeneration phenomena during battery aging and possess powerful nonlinear mapping capabilities [25]. However, their performance is highly dependent on the scale and quality of training data; high-quality feature data is a prerequisite for building high-precision prediction models. Moreover, the design of the model structure has a decisive impact on the final estimation outcome. An effective model must be capable of learning and capturing complex, nonlinear patterns from large amounts of data.
To address the limitations of current data-driven methods in feature extraction and temporal dependency modeling, this study proposes a novel approach that integrates Kolmogorov–Arnold Networks (KANs) with Transformer architecture. By leveraging the Transformer’s capability of Transformer modeling long-range temporal patterns and KAN’s expressive power in function approximation, the proposed method enhances both feature representation and sequential pattern recognition, leading to improved accuracy in estimating the State of Health (SOH) of lithium-ion batteries. The main contributions of this work are summarized as follows:
- Systematic selection and validation of multi-health features: Moving beyond reliance on a single health indicator, this study systematically identifies and validates a set of five health features derived from voltage, current, and temperature data. This multi -dimensional approach more comprehensively captures the internal changes associated with battery aging, as evidenced by high Pearson correlation coefficients (>0.985) with SOH degradation trends.
- Development of a Transformer–KAN hybrid model: The proposed model capitalizes on the Transformer’s strength in encoding temporal dependencies, enabling it to effectively capture long-range evolving trends in battery aging sequences. By integrating these temporal dynamics with the distinctive function approximation capabilities of KAN, an end-to-end estimation framework is constructed. This hybrid architecture facilitates more discriminative health feature extraction, thereby improving SOH estimation accuracy.
- Comprehensive SOH estimation validation and comparative analysis: The proposed method is evaluated across multiple battery datasets and systematically compared against several established models, including CNN–LSTM, Transformer, and standalone KAN. Experimental results demonstrate that the hybrid model achieves superior SOH estimation performance, even under highly nonlinear battery degradation processes.
2. Extraction of Battery Health Features
2.1. Battery Dataset
The battery SOH is explicitly defined as the percentage ratio of the current maximum available capacity to the factory-rated capacity, mathematically expressed as:
where denotes the present maximum usable capacity, and is the nominal capacity specified by the manufacturer. With the accumulation of cycle aging and calendar aging effects, the SOH generally exhibits a decreasing trend. According to international standards such as IEEE 1188-1996, when SOH degrades to the 80% threshold, it indicates that the battery has reached the end-of-life state, at which point the capacity degradation significantly impacts both battery performance and safety margins.
This paper utilizes a publicly available lithium-ion battery dataset for experimentation: the NASA lithium-ion battery aging dataset [26]. The 18650-type batteries B0005, B0006, and B0007 underwent standard charge–discharge cycles until their rated capacity decreased from 2 Ah to 1.4 Ah. The charging process consists of two stages: constant-current (CC) charging followed by constant-voltage (CV) charging. Specifically, the batteries are first charged in CC mode at 1.5 A until the voltage reaches 4.2 V, then switched to CV mode until the current drops to 20 mA. The corresponding charging voltage and current profiles are illustrated in Figure 1.
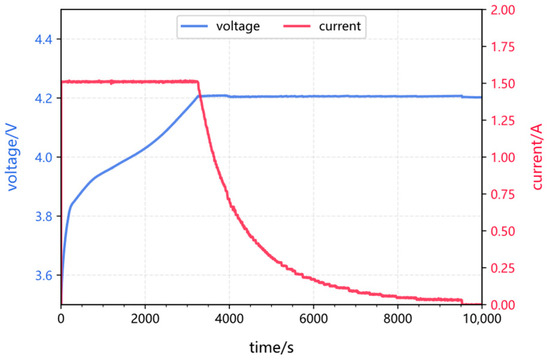
Figure 1.
Battery charging voltage and current curves.
Throughout the entire process, current, voltage, temperature, and EIS impedance were recorded. The NASA experimental data were collected through alternating separate charge and discharge cycles with resting periods in between. However, the sampling intervals between cycles were inconsistent. The extracted degradation state data extraction for the three batteries are shown in Figure 2. The capacity degradation curves exhibit non-monotonic fading characteristics accompanied by quasi-periodic fluctuations, indicative of capacity regeneration phenomena. This behavior stems from electrochemical relaxation effects during resting periods: unstable compounds accumulated at the electrode interface (such as SEI components or lithium metal dendrites) decompose, releasing lithium ions that re-embed into the active material, thereby enhancing the available capacity in subsequent cycles. Such nonlinear aging behavior introduces increases additional uncertainty into SOH estimation.
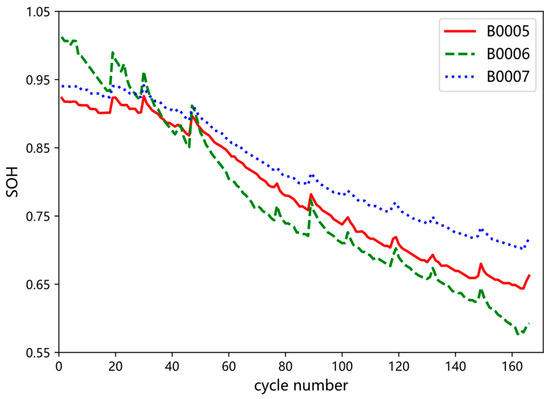
Figure 2.
Battery SOH degradation curves.
2.2. Extraction of Health Features
The extraction of Health Features (HFs) from operational data is a cornerstone of data-driven SOH estimation. Numerous studies have demonstrated the effectiveness of various features. For instance, the CC charging time and the characteristics of the IC curve have been widely adopted as health indicators [27]. Similarly, the area under the voltage/current curve during specific phases [28] and the temperature peak time [29] have also been established as reliable aging markers. Building upon this solid foundation, the novelty of this section lies not in inventing new features, but in the systematic selection and synergistic combination of a set of features that exhibit exceptionally high correlation with SOH in the targeted dataset, thereby providing a robust input vector for the novel Transformer–KAN model introduced later.
During battery usage, the State of Health (SOH) typically degrades as the internal active materials gradually deteriorate. However, capacity is difficult to measure online and requires stringent experimental conditions. Therefore, it is necessary to extract health features that are both robust and discriminative from externally measurable battery parameters to achieve effective quantification of SOH. Strong correlation between such features and capacity degradation can significantly enhance the accuracy of SOH estimation. By analyzing voltage, current, temperature, and time-series data during charge–discharge cycles, this study extracts key health features that characterize the battery degradation mechanism.
The following feature extraction is illustrated using Battery B0005 as an example. Figure 3 illustrates the variation in voltage during the charging process as a function of the battery’s cycle number. The results indicate that as the number of cycles increases, the voltage reaches the charging cutoff voltage more rapidly, with the voltage profile shifting consistently to the left and the constant-current (CC) charging duration continuously decreasing. The most pronounced changes in the voltage curve occur within the interval from 3.9V to 4.1V during the CC phase. Therefore, the equal voltage rise time interval between 3.9 V and 4.1 V are selected as one of the health features, denoted as HF1.
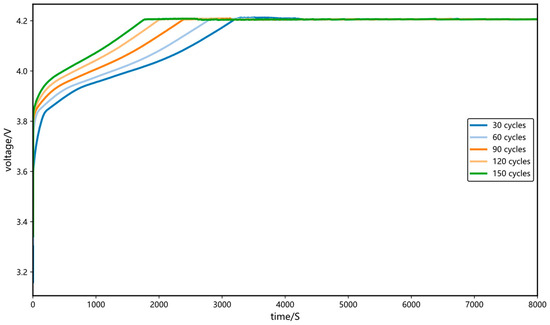
Figure 3.
Variation in voltage with cycle number during the charging stage.
As also observed in Figure 3, with increasing charge cycles, the area enclosed by the CC-phase voltage curve and the time axis shifts leftward and shows a monotonic decreasing trend, indicating a gradual reduction in the energy charged during the CC phase. Overall, the total energy delivered during the entire CC charging stage progressively decreases. Based on this observation, the area enclosed by the voltage curve (from 3.9 V to 4.2 V) and the time axis—specifically, the area under the constant-voltage charging segment—is extracted as the second health feature, denoted as HF2.
Figure 4 illustrates the variation trend of current during the charging process across different cycle numbers. The results demonstrate that the current drops to the cutoff value more rapidly. The current curve shifts leftward, reflecting a continuous reduction in the CC charging duration and a corresponding extension of the constant-voltage (CV) charging time. The most significant changes occur within the current range from 1.5 A down to 0.6 A during the CV phase. Therefore, the area enclosed by the current curve (from 1.5 A to 0.6 A) and the time axis—representing the area under the constant-current fading segment during CV charging—is selected as the third health feature, denoted as HF3.
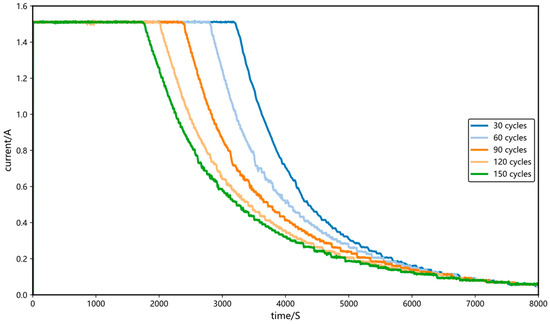
Figure 4.
Variation in current with cycle number during the charging stage.
Temperature is a critical environmental factor influencing the reliability and safety of lithium-ion batteries, with its variation significantly affecting the aging process. Battery temperature changes primarily stem from ohmic heating and heat generated by internal electrochemical reactions. Figure 5 illustrates the temperature profiles during the charging process under different cycle numbers. During the CC charging phase, the battery temperature initially decreases before rising continuously until the end of this phase. The initial temperature drop can be attributed to the reversible thermal associated with lithium-ion intercalation/deintercalation process; subsequently, the temperature steadily increases and peaks, primarily corresponding to the dominant role of irreversible heat generation process. In the CV phase, the battery temperature gradually decreases due to the continuous irreversible exothermic reaction, eventually approaching the ambient temperature.
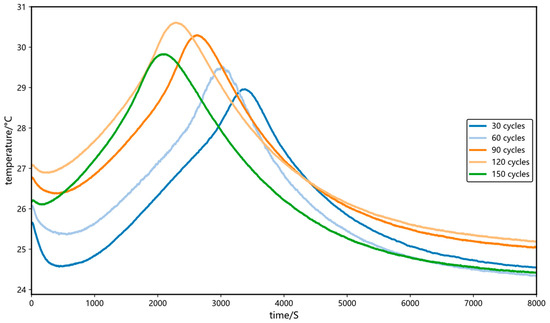
Figure 5.
Variation in temperature with cycle number during the charging stage.
With increasing charge–discharge cycles, the battery temperature profile exhibits a systematic leftward shift, and the timing of the peak temperature occurs earlier. This phenomenon is attributed to the continuous increase in internal resistance during battery performance degradation: the elevated internal resistance leads to accelerated Joule heat accumulation under identical charging conditions, resulting in a faster temperature rise rate and a shortened time to reach the peak temperature. This trend shows significant correlation with battery capacity fading. Therefore, the time at which the temperature reaches its peak during the charging is extracted as the fourth health feature, denoted as HF4, to quantify the dynamic thermal behavior changes during the aging process.
Furthermore, the Incremental Capacity (IC) curve serves as another crucial analytical indicator. The incremental capacity is calculated as the ratio of the capacity increment () to the voltage increment () during the CC charging stage, and its definition is shown in Equation (2):
The IC curve also demonstrates systematic evolution with battery aging, particularly in the variation in its peak amplitude. The strong sensitivity and pronounced trends of IC curve characteristics to aging states make it an effective indicator for characterizing battery degradation. However, due to issues in the original dataset such as non-uniform sampling intervals and discontinuous data within individual charge–discharge cycles, data preprocessing is required. This includes linear interpolation to standardize the time series and filtering/smoothing of the IC curve to suppress noise. Figure 6 displays the processed IC curves at different cycle numbers. The results indicate that as the number of cycles increases, both the peak amplitude of the IC curve and the voltage corresponding to the peak gradually decrease. The peak value of the IC curve is extracted as the fifth health feature, denoted as HF5.
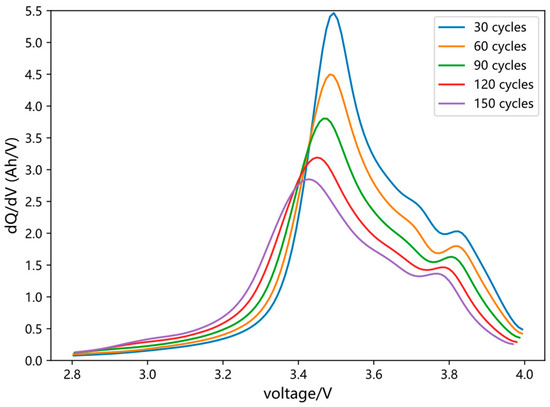
Figure 6.
Variation in IC curves with cycle number.
2.3. Correlation Analysis of Health Features
To quantitatively evaluate the relationship between the five extracted health features and the SOH of lithium-ion batteries, Pearson correlation analysis was conducted. The Pearson correlation coefficient, which measures the strength and direction of the linear relationship between two continuous variables, was employed. This coefficient ranges from −1 to +1 and is calculated as follows:
Equation (3) defines the Pearson correlation coefficient, , which quantifies the linear association between two variables. The strength of the relationship is indicated by the absolute value of , with values approaching 1.0 denoting a stronger linear dependency. Here, and represent individual observed data points, while and denote their respective arithmetic means.
Using Equation (3), the correlations between the extracted health features and SOH were quantified; the resulting values are presented in Table 1.

Table 1.
Correlation coefficients between health features and SOH.
The analysis reveals strong relevance of all five health features to SOH. Specifically, the absolute correlation coefficients of HF1, HF2, HF4, and HF5 with battery SOH consistently exceed 0.98 across all three batteries, indicating an exceptionally strong linear relationship. Although HF3 exhibits a moderately strong negative correlation, its inclusion captures complementary information from the constant-voltage (CV) charging phase.
This systematic correlation analysis confirms the validity and representativeness of the selected feature set. By incorporating these highly relevant and complementary features into the deep learning model, we mitigate the risk of learning spurious correlations and establish a robust foundation for accurate SOH estimation. The high correlations enable the model to focus on salient signals reflective of battery aging, thereby enhancing both the reliability and generalizability of the proposed approach.
3. Battery SOH Estimation Model
3.1. Transformer
Originally developed as a sequence-to-sequence model, the Transformer’s encoder–decoder architecture has found widespread application across various domains. For the specific task of the SOH estimation—which focuses on extracting meaningful patterns from input sequences rather than generating new ones—this study employs only the encoder component of the Transformer [30]. As illustrated in Figure 7, the encoder consists of two core sub-layers: a Multi-Head Self-Attention (MHA) mechanism and a Position-wise Feed-Forward Network (FFN). The MHA enables each element in the sequence to interact with all other elements, effectively capturing global contextual information and long-range dependencies within the battery operational data. This capability is crucial for identifying underlying capacity degradation mechanisms. The FFN, implemented as a position-wise fully connected network, subsequently applies nonlinear transformations to the attention-weighted representations. To facilitate stable training of this deep architecture, each sub-layer (MHA and FFN) incorporates residual connections and is followed by Layer Normalization (LN), which helps stabilize activation distributions throughout the network.
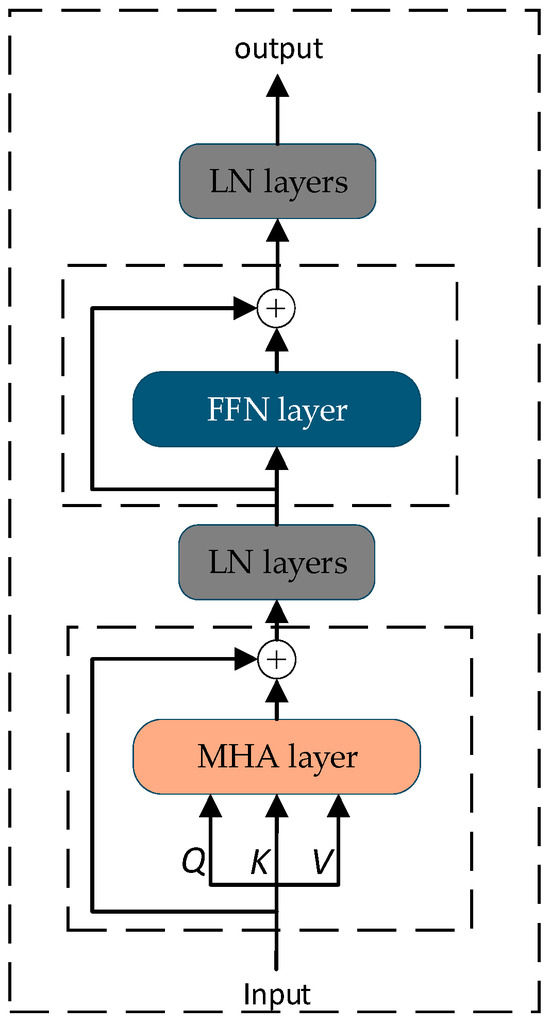
Figure 7.
Structure diagram of the Transformer encoder.
The MHA mechanism captures complex, long-range dependencies within the battery data sequences by projecting input features into multiple subspaces. This is achieved using learnable weight matrices , , and to create distinct sets of Queries (), Keys (), and Values (). As per Equations (4)–(6):
Each attention head computes a distinct output by focusing on different aspects of the input sequence. The and matrices determine inter-element affinities across the sequence, while the matrix contains substantive SOH-related information to be aggregated according to the derived attention weights. Through the integration of outputs from all attention heads, the mechanism learns heterogeneous representation patterns—a capability particularly crucial for capturing the nuanced correlational characteristics inherent in battery capacity degradation.
Residual connections employ identity mappings to preserve the original input information, effectively reformulating the network’s learning objective as the estimation of a residual function. This design facilitates gradient propagation throughout the network and mitigates the vanishing gradient problem in deep architectures. Following each sub-layer, layer normalization is applied to normalize the activations across all neurons within the layer. This ensures uniform scaling of features, stabilizes the input distribution to subsequent layers, suppresses gradient instability, and enhances the model’s generalization capability.
The FFN generally comprises two fully connected layers with a nonlinear activation function in between. Its computation can be expressed as:
where the ReLU activation function is commonly employed to introduce nonlinearity, enabling the model to capture complex patterns beyond the representational capacity of linear transformations. The process first projects the input into a higher-dimensional feature space via a linear transformation, followed by the ReLU nonlinear mapping. This mechanism is essential for extracting discriminative, high-level features from the input sequence.
3.2. KAN Neural Network
A fundamental departure of the KAN from the standard Multilayer Perceptron (MLP) framework lies in its use of learnable spline functions as fundamental computational units. Unlike MLPs that employ fixed activation functions on weighted sums, KAN implements parameterizable spline transformations at the edges of the computational graph, replacing the traditional structure of static weights and nonlinearities. This architectural innovation enables KAN to adaptively model complex nonlinear relationships in data, significantly enhancing its capacity for feature representation. Through dynamic adjustment of spline coefficients during training, KAN effectively optimizes its approximation of intricate data patterns [31]. These characteristics make KAN particularly suitable for characterizing the nonlinear dynamic behaviors inherent in battery degradation data. The overall architecture of KAN is illustrated in Figure 8.
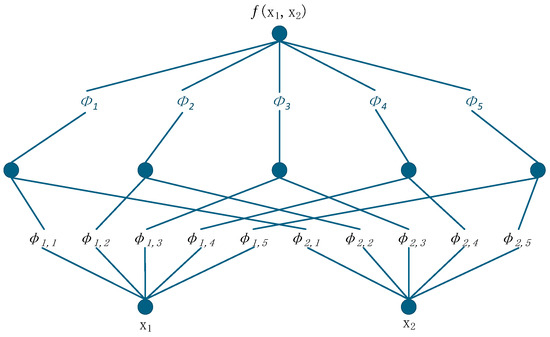
Figure 8.
Structure diagram of the KAN mode.
The theoretical foundation of KAN is the Kolmogorov–Arnold Representation Theorem which establishes that any multivariate continuous function defined on a bounded domain can be expressed as a finite composition of univariate continuous functions and addition operations. Formally, for a given continuous function , there exist univariate functions and satisfying the representation:
In the KAN architecture, the fundamental computational units are the univariate functions and , which are implemented using B-spline representations. B-splines are adopted due to their ability to accurately approximate low-dimensional functions, thereby enhancing the overall accuracy of the network. A key advantage of this design is its intrinsic interpretability. Unlike MLP, which applies fixed nonlinear activation functions (e.g., ReLU) to linear combinations of inputs, KAN places learnable activation functions directly on the edges of the network, i.e., acting on the input features themselves. As a result, after training, the shape of each can be examined to interpret how a specific input feature xⱼ (e.g., the temperature peak time HF4) is nonlinearly transformed before aggregation. This offers direct, function-level insight into the model’s decision-making process, a feature absent in conventional MLPs.
B-Splines are defined as linear combinations of piecewise polynomial functions. A univariate function based on B-Splines can be expressed as:
where represents the control point coefficients; denotes the B-Splines basis function. By optimizing these coefficients of these control points, KAN dynamically adapts the shape of each activation function.
The B-Splines basis functions are constructed recursively via the Cox-de Boor recursive formula:
where denotes a knot within the node sequence, determining the parametric range and segment position for the curve.
In a KAN layer, the input X is transformed via a set of learnable B-Splines activation functions and , followed by summation at the nodes. The output of the KAN layer is given by:
3.3. Transformer–KAN Model
The Transformer–KAN model proposed in this study integrates the Transformer architecture with KAN, effectively leveraging the distinct advantages of each component. The self-attention mechanism in the Transformer captures global dependencies within sequences in a single forward pass, significantly mitigating information loss in long-range temporal modeling. In our design, the standard decoder of Transformer is replaced with a KAN layer, enhancing the model’s nonlinear approximation capacity and interpretability through its learnable activation functions.
The key innovation of this study lies in the hybrid integration of the Transformer encoder and a KAN network. While the Transformer encoder excels at extracting global contextual relationships from the sequence of health features via self-attention mechanism, its native FFN relies on fixed activation functions, which may be suboptimal for capturing the complex, highly nonlinear electrochemical degradation behavior of lithium-ion batteries. To address this limitation, we introduce a novel modification: replacing the standard FFN with a KAN layer. Grounded in the Kolmogorov–Arnold representation theorem, KAN employs learnable activation functions parameterized by B-splines on the edges (weights) of the network. This enables KAN to adaptively adjust its functional form to fit the underlying data distribution, providing a more expressive and interpretable solution for the final regression stage. Consequently, this hybrid architecture enables the model to first understand capture the temporal dynamics of battery aging through the Transformer’s attention mechanism, and then accurately map these representations to quantitative SOH values—yielding superior accuracy and robustness compared to models using standard components.
The algorithmic workflow for SOH estimating using the proposed Transformer–KAN hybrid model is illustrated in Figure 9, and the pseudocode of the model is provided in Algorithm 1.
| Algorithm 1: Training Procedure for the Transformer–KAN Model |
| Input: , where is a health feature sequence and 5 is the number of features Output: Estimated SOH value 1: // Initialize model parameters and optimizer 2: InitializeParameters() 3: 4: // Forward Pass 5: extract temporal patterns 6: aggregate sequence information 7: SOH estimation 8: // Training loop 9: for epoch = 1 to Epochs do 10: Forward pass for a batch 11: Compute loss 12: Update parameters via backpropagation 13: end for 14: return // Return the trained model parameters 15: return // Return the estimated SOH value |
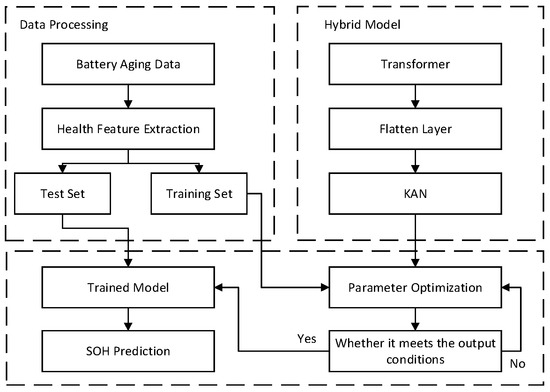
Figure 9.
Algorithm flow chart of the SOH estimation model.
3.4. Model Implementation and Hyperparameter Settings
The proposed Transformer–KAN model was implemented using the PyTorch 2.1 framework trained on a single NVIDIA RTX 3060 GPU. The input sequences, comprising health features extracted from the battery data, were normalized using the min–max technique to scale values within the [0, 1] range, ensuring stable and efficient convergence during training. Model parameters were optimized with the Adam optimizer employing a dynamic learning rate scheduling strategy: the initial learning rate was set to 1 × 10⁻³ and reduced by a factor of 0.5 if the validation loss showed no improvement over 20 consecutive epochs. This approach facilitated precise parameter fine-tuning and helped mitigate overfitting. The complete hyperparameter configuration, including detailed architectural specifications of the Transformer encoder and KAN layer, is comprehensively detailed in Table 2.
Table 2.
Hyperparameter settings of model.
4. Experimental Validation and Discussions
4.1. Evaluation Metrics
To comprehensively evaluate the predictive performance of the model, this study employs Mean Absolute Error (MAE) and Root Mean Square Error (RMSE) as core evaluation metrics. By analyzing these two metrics collectively, the model’s overall performance can be quantified from two critical perspectives: the magnitude of prediction errors and the sensitivity to their distribution. This approach provides an objective basis for model optimization and comparative analysis.
MAE represents the average of the absolute errors between each predicted value and corresponding true value. Its primary advantage lies in providing an intuitive measure of the average error magnitude. Being robust to outliers, it effectively characterizes the overall deviation level of model predictions.
RMSE is derived by taking the square root of the mean squared error. This metric not only preserves the dimensional consistency of the original data but also amplifies the impact of large errors due to the squaring operation, making it particularly suitable for assessing prediction accuracy on extreme values.
The formulas for calculating these metrics are as follows:
where denote the actual SOH value of the battery; represent the SOH value predicted by the model.
4.2. Experimental Results
To rigorously evaluate the generalization ability of the proposed model—a critical aspect for practical BMS applications—we implemented a cross-battery validation strategy following a leave-one-group-out paradigm. Specifically, the model was trained on the data from two batteries and subsequently tested on the remaining third battery that was completely unseen during training. For instance, when evaluating performance on battery B0005, the model was exclusively trained on data from B0006 and B0007. This methodology provides a stringent test of the model’s ability to generalize across different battery units with inherent manufacturing variations and divergent aging patterns, representing a more realistic and challenging scenario than conventional train-test splits from the same battery dataset.
The proposed Transformer–KAN model was systematically compared against three established architectures: CNN–LSTM, standalone Transformer, and standalone KAN models. Figure 10 presents the SOH estimation results for the B0005 test set, where the model was trained on B0006 and B0007 data. The results demonstrate that the prediction curve of the Transformer–KAN model most accurately follows the actual SOH degradation trajectory throughout the entire cycling lifespan. In comparison, the other three benchmark models show significantly larger deviations, particularly during non-monotonic capacity regeneration phases. This evidence indicates that the Transformer–KAN architecture possesses superior robustness in capturing these complex nonlinear dynamics compared to the alternative approaches. The complete experimental results across all test configurations are provided in Figure 10, Figure 11 and Figure 12.
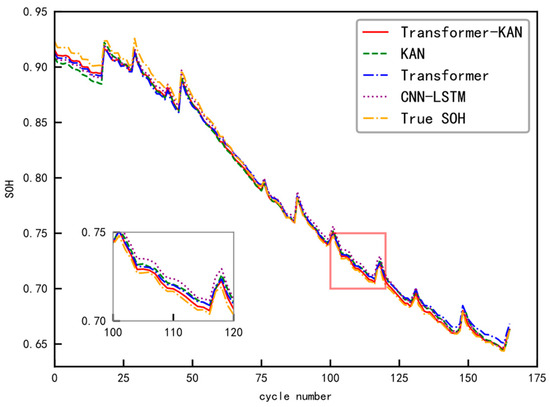
Figure 10.
SOH estimation results for the B0005 battery test set.
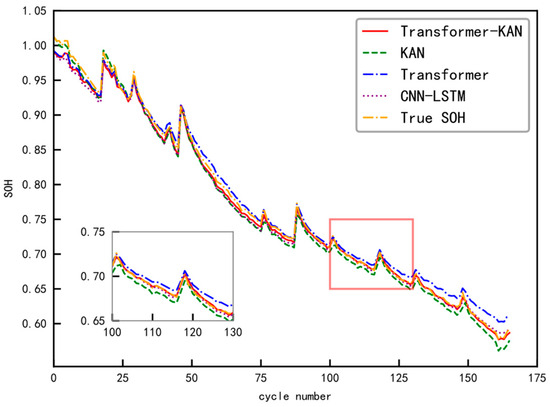
Figure 11.
SOH estimation results for the B0006 battery test set.
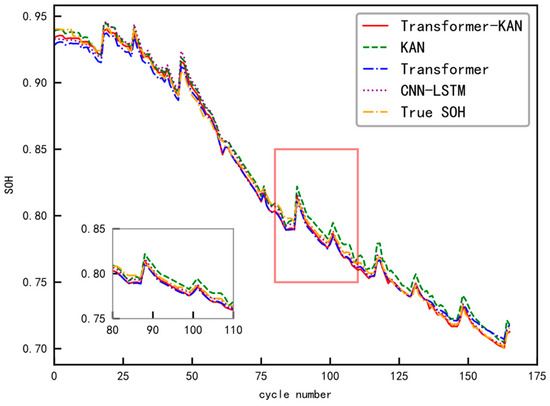
Figure 12.
SOH estimation results for the B0007 battery test set.
Figure 11 presents the estimation performance on the B0006 battery test set, where the model was trained exclusively on data from B0005 and B0007. The results further substantiate the advantage of the hybrid Transformer–KAN architecture. Although all compared models broadly capture the overall degradation trend, the Transformer–KAN model consistently achieves predictions with the narrowest error intervals, reflecting superior estimation stability and precision throughout the battery’s aging process. This outcome confirms the model’s robust generalization capability when applied to a battery unit that was entirely absent from the training phase.
Figure 12 presents the estimation results for the B0007 battery test set, where the model was trained on data from B0005 and B0006. This final cross-validation scenario validates the consistent performance advantage of the proposed Transformer–KAN approach. A key observation is the model’s accurate capture of the accelerated capacity fade occurring in the later service life (after cycle 140), demonstrating its particular sensitivity to critical nonlinear aging dynamics. This capability is essential for reliable end-of-life prediction in practical battery management applications.
The quantitative evaluation metrics (RMSE and MAE) for all three cross-validation tests are systematically summarized in Table 3. This consolidated presentation provides a clear and objective numerical comparison of the four models’ estimation performance across the different battery configurations. The results demonstrate that the proposed Transformer–KAN model consistently achieves the lowest values in both RMSE and MAE metrics, offering statistical evidence of its superior estimation accuracy and robustness.
Table 3.
Evaluation metric results of the four models.
As evidenced by the evaluation metric of the four models across three battery test sets in Table 2, the proposed Transformer–KAN model demonstrates superior performance in most evaluation items. For the B0005 test set, the Transformer model achieves an RMSE of 2.37% and MAE of 2.11%, while the KAN model records 2.45% RMSE and 2.02% MAE; the CNN–LSTM model shows 2.10% RMSE and 1.77% MAE. In contrast, the Transformer–KAN model achieves significantly lower error metrics with only 1.68% RMSE and 1.34% MAE, indicating its capability for more accurate predictions with reduced estimation errors under this specific training–test configuration.
In the B0006 test set, evaluation yields 2.22% RMSE and 1.81% MAE, the KAN model shows 2.06% RMSE and 1.87% MAE, and the CNN–LSTM model achieves 2.03% RMSE and 1.51% MAE. The Transformer–KAN model again demonstrates the best performance with 1.56% RMSE and 1.49% MAE, confirming its predictive advantages and enhanced capability in capturing relevant data patterns for improved accuracy.
For the B0007 test set, while the Transformer model attains 1.93% RMSE and 1.63% MAE, the KAN model shows 2.18% RMSE and 1.88% MAE, and the CNN–LSTM model achieves 1.76% RMSE and 1.27% MAE, the Transformer–KAN model maintains the lowest error metrics with 1.49% RMSE and 1.16% MAE. This consistent performance across different data splits reaffirms the model’s stability and superiority in delivering accurate SOH estimations.
Across all three training-test configurations, the Transformer–KAN model consistently outperforms the standalone Transformer, KAN, and CNN–LSTM models in both RMSE and MAE metrics. These results substantiate that by effectively integrating the Transformer’s strengths in long-sequence modeling with KAN’s enhanced representational capabilities, the hybrid architecture can better process battery degradation characteristics, minimize prediction errors, and deliver significant performance advantages compared to individual models or conventional hybrid approaches.
5. Conclusions
To address the issue of lithium-ion battery SOH estimation, this study proposes a data-driven method based on a novel Transformer–KAN hybrid architecture, with its effectiveness thoroughly validated through experimental studies. The principal conclusions are summarized as follows:
- Five health features (HF1–HF5) were systematically selected and extracted from battery charging and discharging data. All features demonstrated strong correlation with SOH degradation, with Pearson correlation coefficients exceeding 0.8 across all battery instances;
- The proposed Transformer–KAN model achieved superior estimation accuracy on the NASA dataset. Experimental results indicated that our model attained average RMSE and MAE value of 1.58% and 1.33%, respectively, across the three test batteries (B0005, B0006, B0007). This represents approximately 20% improvement in RMSE and 15% in MAE compared to the best-performing baseline model (CNN–LSTM). The hybrid architecture effectively integrates the complementary strengths of its components: the Transformer encoder excels at capturing long-range temporal dependencies in battery aging sequences, while the KAN layer provides enhanced nonlinear representation capability through its learnable activation functions, contributing to both accuracy and interpretability. Comprehensive cross-validation tests demonstrate the model’s robust generalization capability across different battery units, maintaining consistent performance advantage even when applied to completely unseen battery data, which underscores its potential for practical BMS applications;
- Future work could further explore the model’s adaptability to more diverse battery dataset and incorporate online learning mechanisms to address dynamically changing environmental and load conditions in practical applications.
Author Contributions
Conceptualization, Z.C. and Q.W.; methodology, Z.C.; validation, J.L. and J.W.; formal analysis, Z.C. and J.L.; resources, J.L., Y.W. and Q.W.; writing—original draft preparation, Z.C. and A.X.; writing—review and editing J.L. and K.L.; funding acquisition, J.L., J.W., Q.W., Y.W. and K.L. All authors have read and agreed to the published version of the manuscript.
Funding
This research was funded by the Doctoral Fund Project of Guangxi University of Science and Technology under Grant no. 22Z23, and the Guangxi Science and Technology Base and Talent Special Project under Grant no. AD22080004.
Data Availability Statement
The original contributions presented in this study are included in the article. Further inquiries can be directed to the corresponding author.
Conflicts of Interest
The authors declare no conflicts of interest.
References
- Yu, Q.; Huang, Y.; Tang, A.; Wang, C.; Shen, W. OCV-SOC-temperature relationship construction and state of charge estimation for a series–parallel lithium-ion battery pack. IEEE Trans. Intell. Transp. Syst. 2023, 24, 6362–6371. [Google Scholar] [CrossRef]
- Zeng, J.; Liu, S. Research on aging mechanism and state of health prediction in lithium batteries. J. Energy Storage 2023, 72, 108274. [Google Scholar] [CrossRef]
- Bi, J.; Zhang, T.; Yu, H.Y.; Kang, Y. State-of-health estimation of lithium-ion battery packs in electric vehicles based on genetic resampling particle filter. Appl. Energy 2016, 182, 558–568. [Google Scholar] [CrossRef]
- Chen, M.; Wu, J.; Jiao, C.Y.; Chen, J.; Zhang, Z. Multi-factor online estimation method for state of health of lithium-ion batteries. J. Xi’an Jiaotong Univ. 2020, 54, 169–175. [Google Scholar] [CrossRef]
- Xiong, R.; Li, L.L.; Li, Z.R.; Yu, Q.; Mu, H. An electrochemical model based degradation state identification method of lithium-ion battery for all-climate electric vehicles application. Appl. Energy 2018, 228, 264–275. [Google Scholar] [CrossRef]
- He, Y.; Zeng, Q.; Tang, L.; Liu, F.; Li, Q.; Yin, Y.; Xu, S.; Deng, B. State of health estimation of lithium-ion battery based on full life cycle acoustic emission signals. J. Energy Storage 2025, 139, 118725. [Google Scholar] [CrossRef]
- Guo, P.X.; Zhao, L.; Ma, Z.C.; Wang, Z.; Li, Y. Lithium-ion battery state of health estimation method under the GWO-CNN framework. J. Chongqing Univ. Technol. (Nat. Sci.) 2025, 39, 9–16. [Google Scholar]
- Liao, Y.; Ma, X.; Guo, L.; Feng, X.; Hu, Y.; Li, R. State of health estimation for the lithium-ion batteries based on CNN-MLP network. Trans. Inst. Meas. Control 2025, 47, 1615–1623. [Google Scholar] [CrossRef]
- Chen, J.; Kollmeyer, P.; Ahmed, R.; Emadi, A. Battery state-of-health estimation using CNNs with transfer learning and multi-modal fusion of partial voltage profiles and histogram data. Appl. Energy 2025, 391, 125923. [Google Scholar] [CrossRef]
- Mao, L.; Wen, J.; Zhao, J.; Qu, K. Online state-of-health estimation of lithium-ion batteries based on a novel equal voltage range sampling count number health indicator. IEEE Trans. Transp. Electrif. 2023, 10, 2277–2292. [Google Scholar] [CrossRef]
- Liu, J.; Liu, X. An improved method of state of health prediction for lithium batteries considering different temperature. J. Energy Storage 2023, 63, 107028. [Google Scholar] [CrossRef]
- Cai, L. A unified GPR model based on transfer learning for SOH prediction of lithium-ion batteries. J. Process Control 2024, 144, 103337. [Google Scholar] [CrossRef]
- Li, R.; Li, W.; Zhang, H. State of Health and Charge Estimation Based on Adaptive Boosting integrated with particle swarm optimization/support vector machine (AdaBoost-PSO-SVM) Model for Lithium-ion Batteries. Int. J. Electrochem. Sci. 2022, 17, 220212. [Google Scholar] [CrossRef]
- Zhang, X.; Feng, J.; Cai, F.; Huang, K.; Wang, S. A novel state of health estimation model for lithium-ion batteries incorporating signal processing and optimized machine learning methods. Front. Energy 2025, 19, 348–364. [Google Scholar] [CrossRef]
- Zhang, Z.; Min, H.; Guo, H.; Yu, Y.; Sun, W.; Jiang, J.; Zhao, H. State of health estimation method for lithium-ion batteries using incremental capacity and long short-term memory network. J. Energy Storage 2023, 64, 107063. [Google Scholar] [CrossRef]
- Zhang, L.J.; Jiao, T.; Yao, S.H.; Liu, G. Accurate Prediction Approach of SOH for Lithium-Ion Batteries Based on LSTM Method. Batteries 2023, 9, 177. [Google Scholar] [CrossRef]
- Yang, J.; Zou, L.; Wei, Y.; Yuan, P.; Zhou, C. Health status prediction of lithium battery based on lstm model with optimization algorithms. J. Phys. Conf. Ser. 2023, 2473, 012020. [Google Scholar] [CrossRef]
- Zhang, C.; Luo, L.; Yang, Z.; Zhao, S.; He, Y.; Wang, X.; Wang, H. Battery SOH estimation method based on gradual decreasing current, double correlation analysis and GRU. Green Energy Intell. Transp. 2023, 2, 100108. [Google Scholar] [CrossRef]
- Hou, Z.; Xu, W.; Jia, G.; Wang, J.; Cai, M. Estimation of SOH of Lithium-Ion Batteries Based on PSO-BiGRU-Attention Network. J. Electrochem. Soc. 2024, 171, 020541. [Google Scholar] [CrossRef]
- Zhang, L.; Yang, K.; Zhang, X. Particle swarm optimization-gated recurrent unit neural network lithium battery state of health estimation based on feature optimization selection strategy. J. Power Sources 2025, 654, 237798. [Google Scholar] [CrossRef]
- Zhang, H.Y.; Wang, J.H.; Ding, T.; Zhu, Y. CNN-LSTM lithium-ion battery SOH estimation model based on multi-indicators. Chin. J. Power Sources 2023, 47, 1303–1307. [Google Scholar] [CrossRef]
- Saleem, U.; Liu, W.; Riaz, S.; Aslam, M.M.; Li, W.; Wang, K. EnerNet: Attention-based dilated CNN-BILSTM for state of health prediction of CS2 prismatic cells in energy systems. Electrochim. Acta 2025, 512, 145454. [Google Scholar] [CrossRef]
- Gu, X.; See, K.W.; Li, P.; Shan, K.; Wang, Y.; Zhao, L.; Lim, K.C.; Zhang, N. A novel state-of-health estimation for the lithium-ion battery using a convolutional neural network and transformer model. Energy 2023, 262, 125501. [Google Scholar] [CrossRef]
- Zhang, L.; Wang, L.; Zhang, J.; Wu, Q.; Jiang, L.; Shi, Y.; Lyu, L.; Cai, G. Fault diagnosis of energy storage batteries based on dual driving of data and models. J. Energy Storage 2025, 112, 115485. [Google Scholar] [CrossRef]
- Wu, Z.Y.; Jiang, Q.H.; Zhu, M.H.; Cheng, C.; Wang, D.; Shi, X. Research status of state of health prediction for lithium-ion batteries. Adv. New Renew. Energy 2020, 8, 486–492. [Google Scholar]
- NASA. Li-Ion Battery Aging Datasets. [Dataset]. 2015. Available online: https://c3.nasa.gov/dashlink/resources/133/ (accessed on 20 May 2024).
- Wu, Y.; Xue, Q.; Shen, J.; Lei, Z.; Chen, Z.; Liu, Y. State of health estimation for lithium-ion batteries based on healthy features and long short-term memory. IEEE Access 2020, 8, 28533–28547. [Google Scholar] [CrossRef]
- Gong, D.; Gao, Y.; Kou, Y.; Wang, Y. State of health estimation for lithium-ion battery based on energy features. Energy 2022, 257, 124812. [Google Scholar] [CrossRef]
- Driscoll, L.; de la Torre, S.; Gomez-Ruiz, J.A. Feature-based lithium-ion battery state of health estimation with artificial neural networks. J. Energy Storage 2022, 50, 104584. [Google Scholar] [CrossRef]
- Zhao, J.; Han, X.; Wu, Y.; Wang, Z.; Burke, A.F. Opportunities and challenges in transformer neural networks for battery state estimation: Charge, health, lifetime, and safety. J. Energy Chem. 2025, 102, 463–496. [Google Scholar] [CrossRef]
- Jiang, J.; Fu, T.; Liu, J.; Fan, J.; Song, H.; Ai, D.; Xiao, D.; Wang, Y.; Yang, J. Incremental energy-based recurrent transformer-KAN for time series deformation simulation of soft tissue. Expert Syst. Appl. 2025, 271, 126619. [Google Scholar] [CrossRef]
Disclaimer/Publisher’s Note: The statements, opinions and data contained in all publications are solely those of the individual author(s) and contributor(s) and not of MDPI and/or the editor(s). MDPI and/or the editor(s) disclaim responsibility for any injury to people or property resulting from any ideas, methods, instructions or products referred to in the content. |
© 2025 by the authors. Licensee MDPI, Basel, Switzerland. This article is an open access article distributed under the terms and conditions of the Creative Commons Attribution (CC BY) license (https://creativecommons.org/licenses/by/4.0/).