1. Introduction
Ground Penetrating Radar (GPR) is a non-destructive testing (NDT) technology widely used for subsurface exploration and target detection [
1,
2,
3]. Due to its ability to provide high-resolution images of subsurface objects, GPR has found extensive applications in a wide array of fields, including but not limited to geological surveys [
4], civil infrastructure assessment [
5], and military target detection [
6]. As the range of GPR applications expands, there is increasing demand for more accurate, intelligent, and automated target detection algorithms [
7].
Conventional subsurface target detection in GPR data generally follows a three-stage pipeline: region-of-interest (ROI) selection, feature extraction, and target recognition [
8]. Among these stages, feature extraction is pivotal as it determines the quality of representations used for classification or localization. In B-scan radargrams, buried objects—such as landmines, metallic pipelines, cables, rebars, or tree roots—typically manifest as hyperbolic reflections due to the propagation geometry of electromagnetic waves and the movement of the antenna [
9].
To identify these hyperbolic signatures, numerous image-processing techniques have been proposed, including Hough transforms, Canny edge detection, template matching, and statistical filtering [
10]. While these methods offer moderate performance, their effectiveness is often limited by low signal-to-noise ratios, overlapping hyperbolae, and variations in soil properties [
11]. These challenges become particularly pronounced in complex environments with high heterogeneity, where factors such as varying soil moisture, stratigraphy, and object material inconsistency lead to significant signal distortion [
12].
Additionally, the amplitude of reflected signals diminishes with increasing burial depth, further exacerbating detection difficulty. This issue is compounded when unshielded antennas are used, as unwanted reflections from surface objects (e.g., fences, vehicles, or walls) are also captured, increasing background interference [
13].
To overcome these limitations, machine learning (ML) algorithms have been increasingly applied to GPR signal analysis. However, shallow architectures often lack the capacity to capture the complex and multi-scale features inherent in GPR images [
9]. More recently, deep learning (DL) methods have shown superior performance due to their hierarchical feature learning capabilities, allowing the extraction of low-, mid-, and high-level representations in an end-to-end manner [
14,
15,
16].
Despite their potential, DL models face practical challenges in the GPR domain—most notably the scarcity of labeled training data. Acquiring large, diverse, and annotated GPR datasets is time-consuming and expensive, hindering the training of supervised models [
17,
18,
19]. Furthermore, many commercial GPR systems only provide processed B-scan images, without access to raw signal data, limiting the applicability of traditional signal-based analysis techniques [
20].
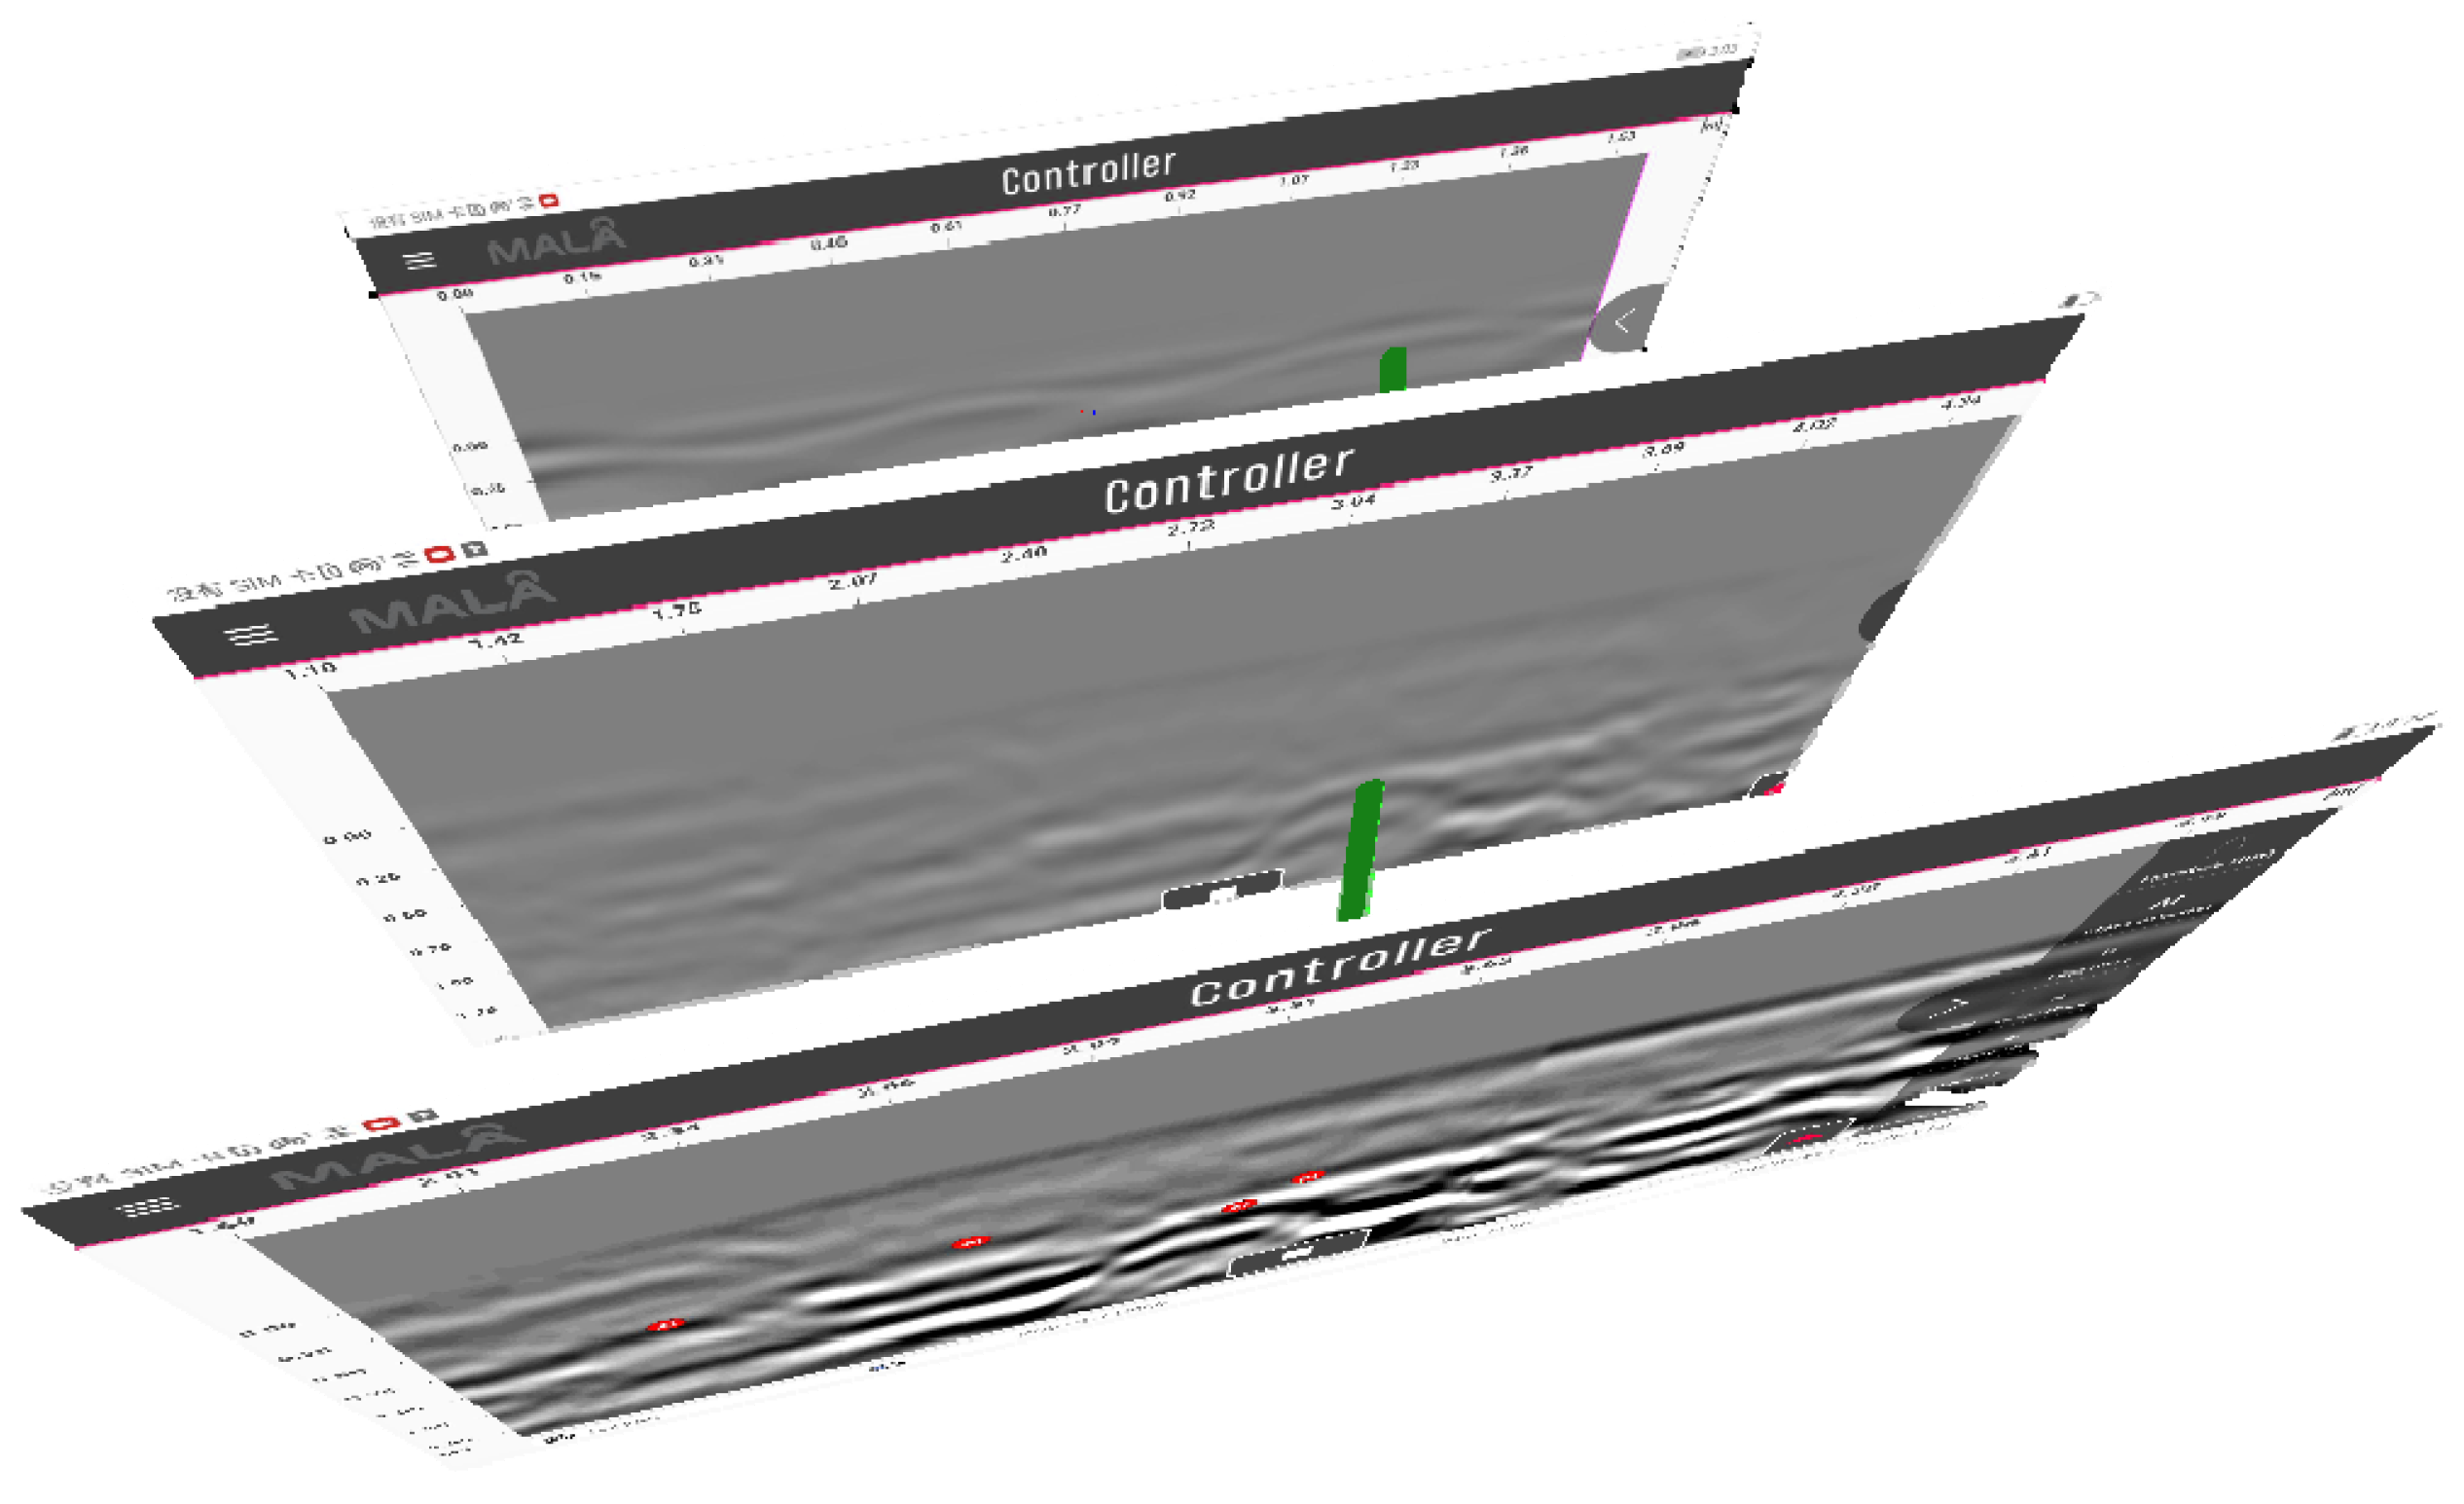
To address these challenges, this paper proposes an image-based framework named DeepMask-GPR, built upon the Mask R-CNN instance segmentation model [
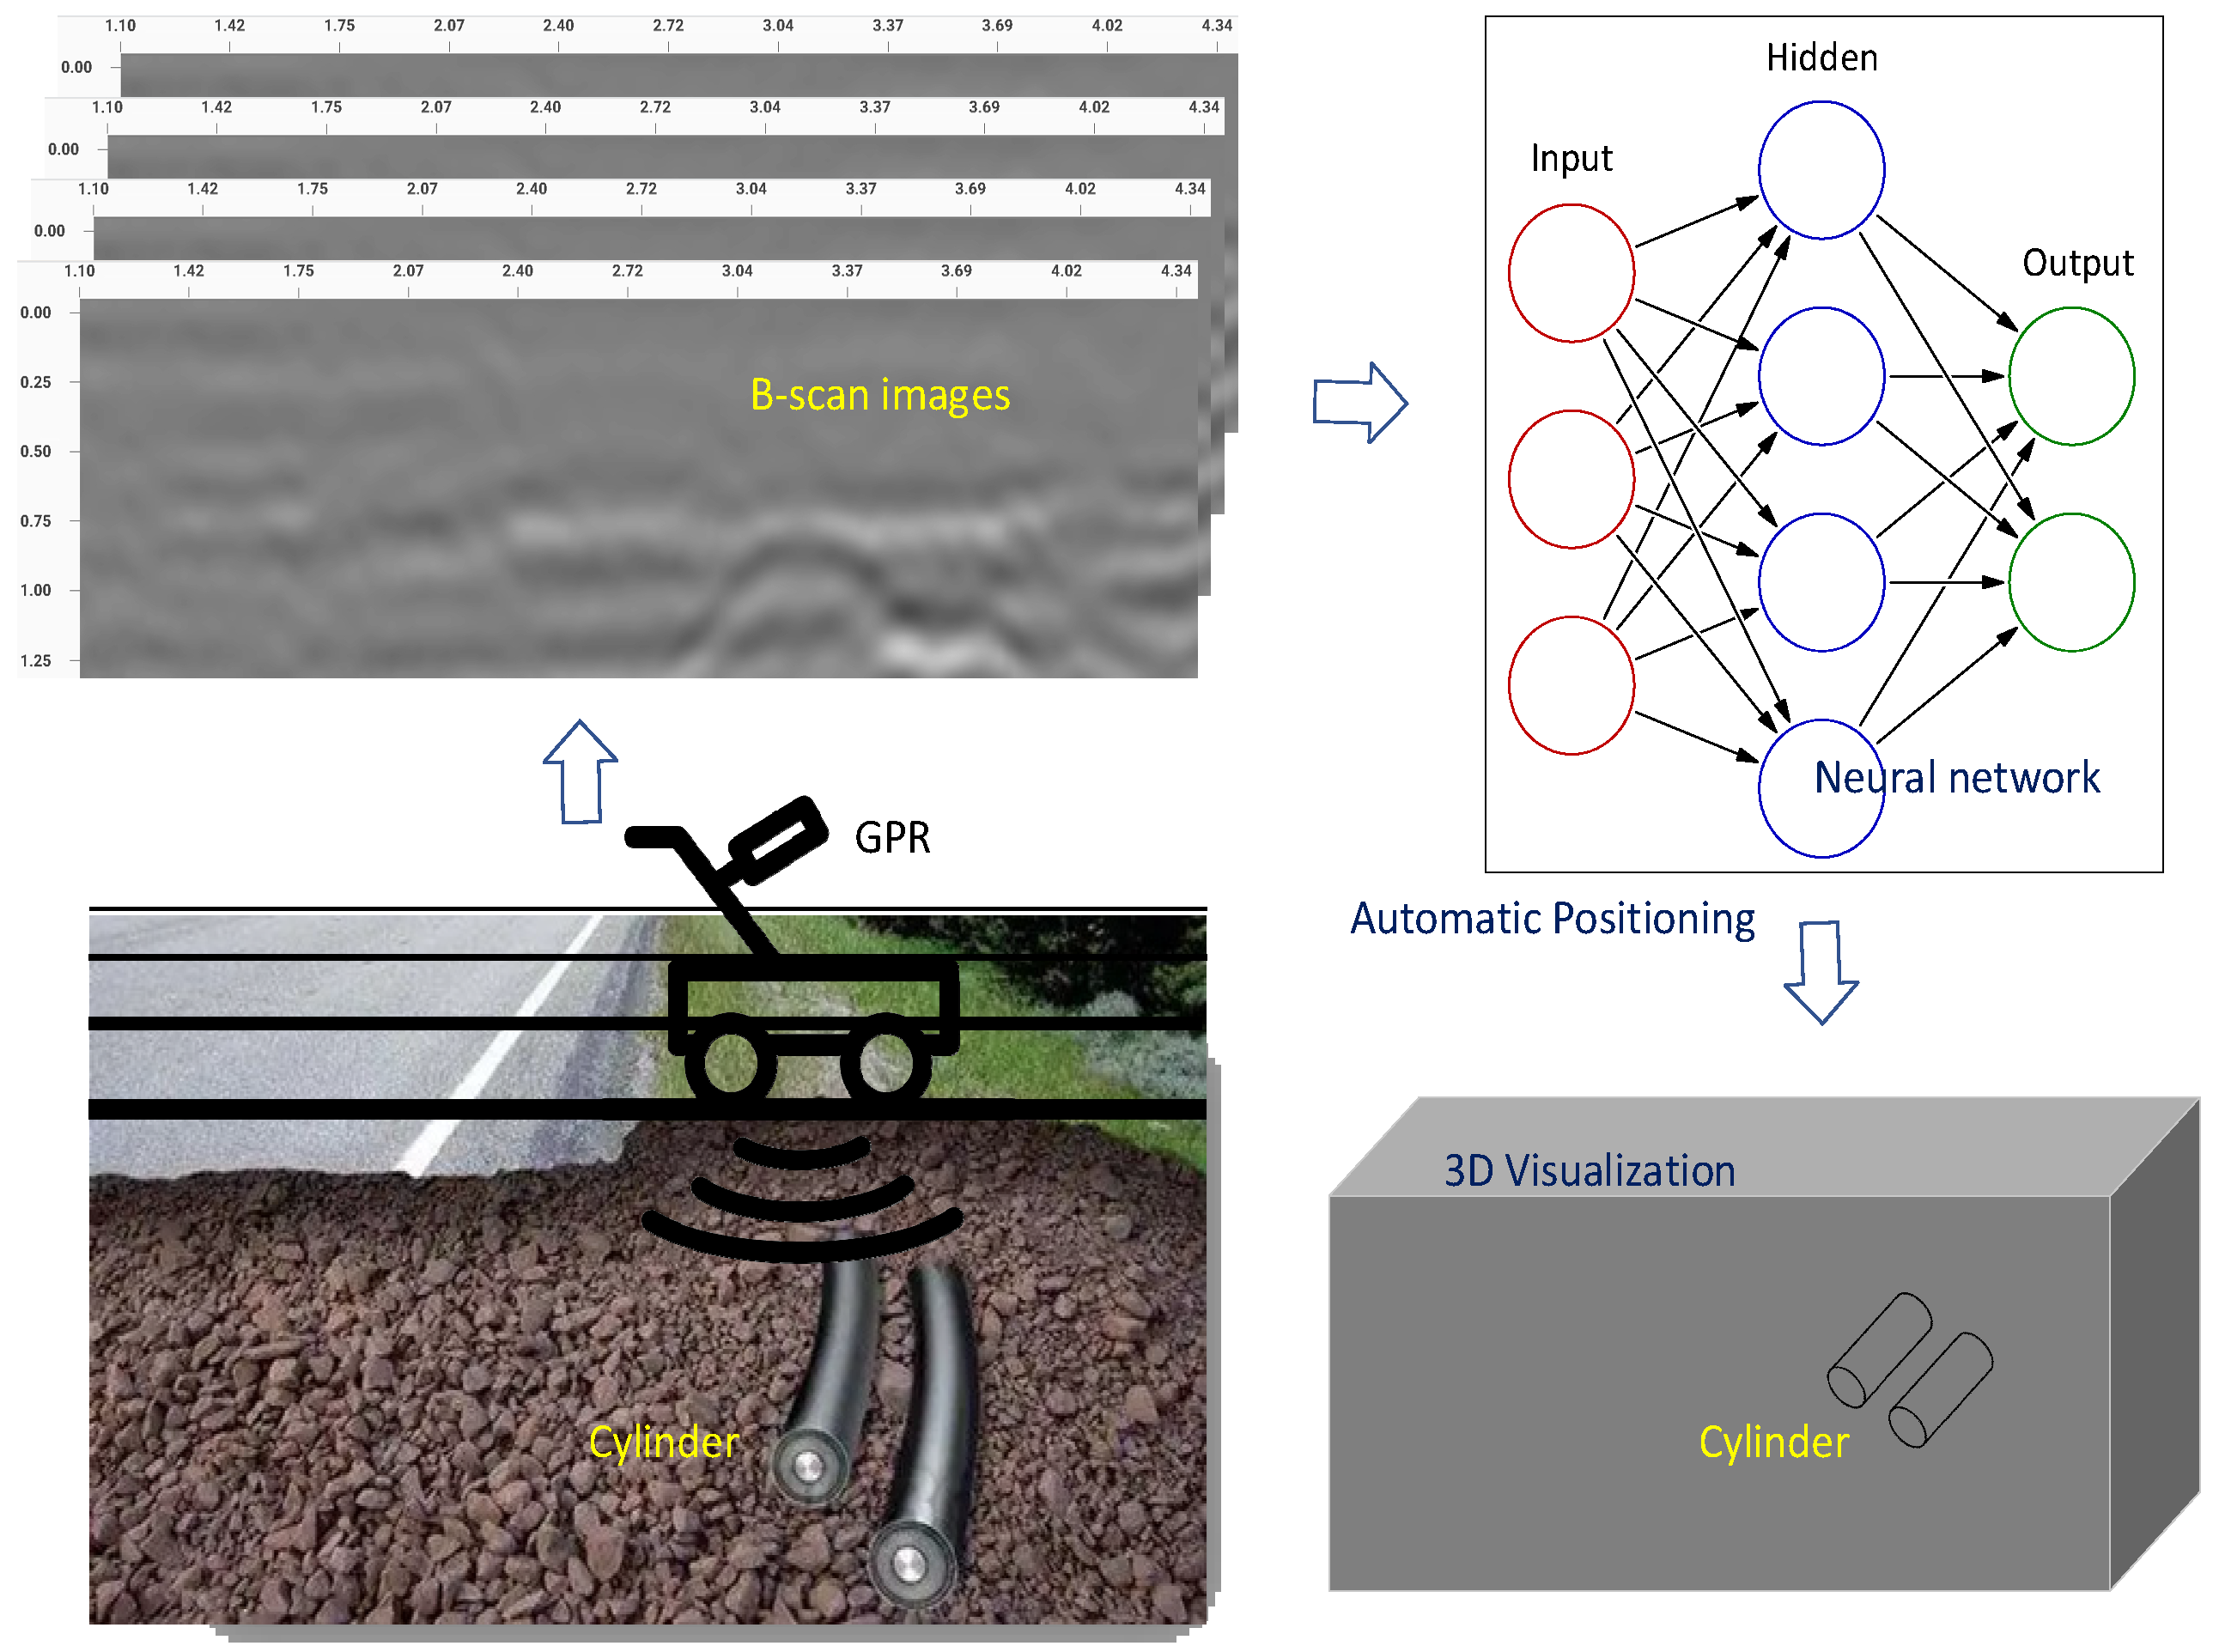
21]. The proposed method directly operates on B-scan images, enabling automatic detection, localization, and shape estimation of hyperbolic signatures corresponding to buried cylindrical objects. As illustrated in
Figure 1, the workflow integrates B-scan data acquisition, neural network-based target identification, and 3D geometric visualization, thereby facilitating fully automated positional and morphological inference of subsurface targets.
Compared to traditional methods, the proposed approach eliminates the dependency on raw waveform data and significantly reduces the need for manual intervention or post-processing. It improves the robustness and scalability of GPR-based detection systems, particularly in real-world scenarios involving large-scale surveys.
The primary contributions of this paper are summarized as follows:
(1) A novel image-based framework is proposed for estimating the positional and geometric properties of buried cylindrical objects using B-scan images.
(2) A curvature-enhanced dual-channel input representation is introduced to improve the detection accuracy of weak and incomplete hyperbolic patterns.
(3) A quadratic parameter regression loss is designed to enable more precise shape fitting compared to conventional binary mask-based loss functions.
This study focuses on cylindrical utilities buried in soil and processed from B-scan radargrams. The remainder of the paper is structured as follows.
Section 2 reviews related work.
Section 3 introduces the method proposed here.
Section 4 shows the experimental results. Finally,
Section 5 concludes the paper and outlines future directions.
3. Proposed Method
This section presents the proposed DeepMask-GPR framework for detecting subsurface cylindrical objects and estimating their spatial location and radius based on B-scan GPR images. The task is formulated as a hyperbola detection and interpretation problem, since the radar reflection from a cylindrical object buried perpendicular to the scan plane typically manifests as a hyperbolic curve in the image. We decompose the problem into two core objectives: spatial localization of the target apex and geometric size estimation.
3.1. Task Description
3.1.1. Spatial Localization
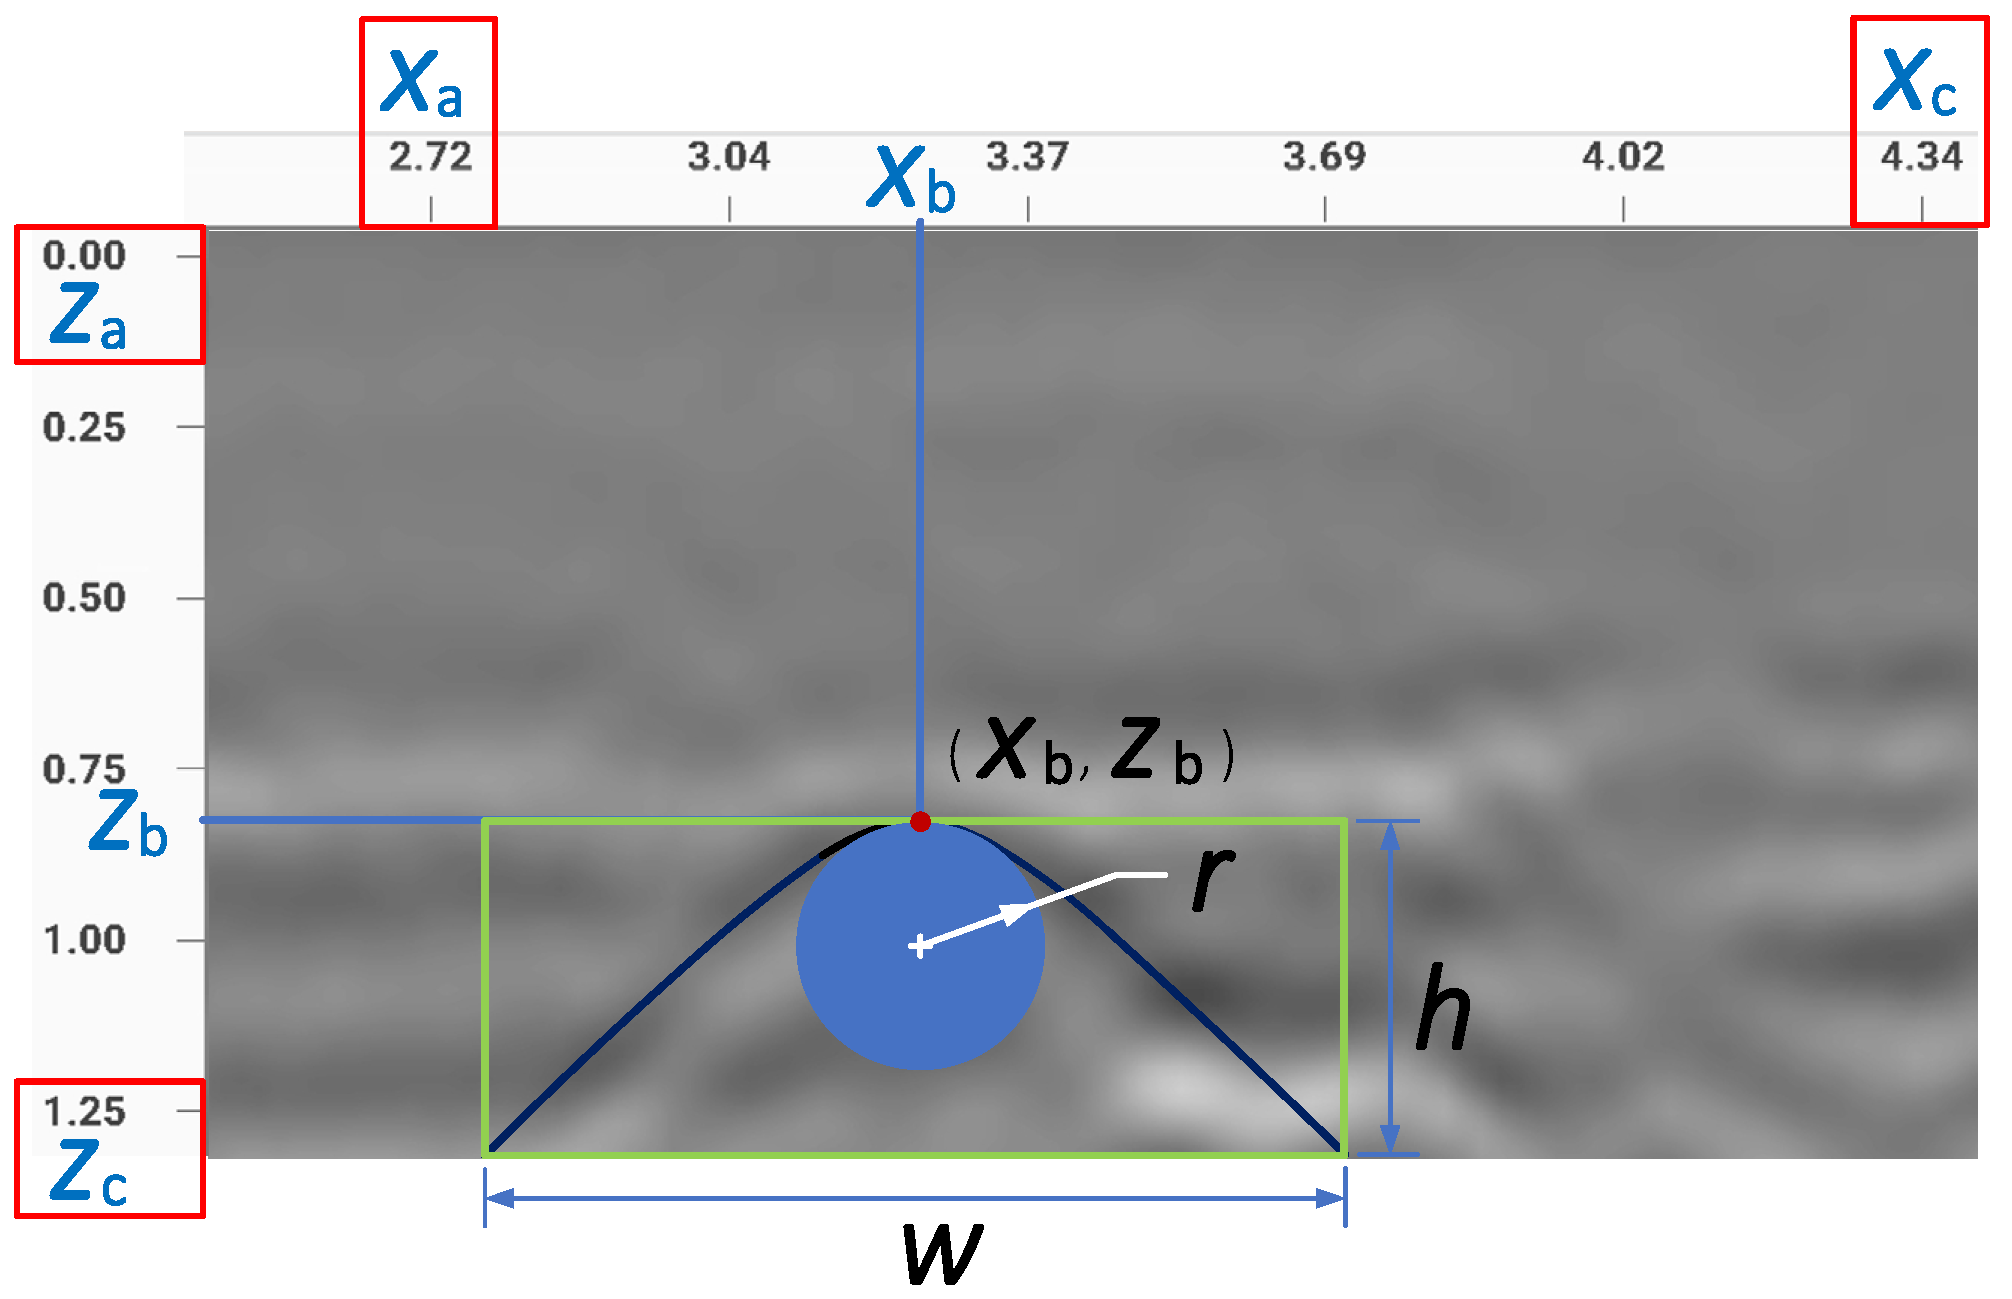
The goal of spatial localization is to determine the precise position of the apex of a buried cylindrical target, as illustrated by the red dot in
Figure 2. Theoretically, this point corresponds to the upper central point along the upper boundary of the hyperbolic reflection band, which is often enclosed by a green bounding box during detection.
When the receiving antenna captures the reflected signal from the subsurface target with sufficient intensity, the resulting hyperbolic pattern remains consistent [
38]. This hyperbolic morphology serves as a common structural feature of buried objects in GPR B-scan images. The reflection from the subsurface object can be modeled as a parametric hyperbola in the form:
Here, x and y denote the pixel coordinates in the B-scan image, and the coefficients (a, b, c) define the curvature, tilt, and vertical shift of the hyperbola.
The apex
of the hyperbola can be analytically derived as the point where the first derivative of the curve equals zero, i.e., where
dy/
dx = 0. Solving this yields:
This apex corresponds to the shortest two-way travel time and hence the shallowest point of the target.
In practice, GPR hyperbolas are not ideal, sharply defined curves; instead, they typically manifest as broadband reflection bands due to the finite bandwidth and beamwidth of the radar system. These hyperbolic reflections comprise alternating dark and bright fringes, forming a diffuse region rather than a well-defined curve. To approximate the hyperbolic shape, some studies [
39] utilize the central pixels within the reflection band segment as representative curve points. However, empirical evidence suggests that the upper boundary of the hyperbolic band more consistently corresponds to the upper surface of the buried object. This boundary is less susceptible to the effects of internal scattering, dispersion, and multi-path interference [
40]. In contrast, the lower boundary is often more ambiguous and unstable, as it is influenced by accumulated wave interactions and variations in subsurface material properties.
Nonetheless, in low-contrast environments, the boundaries of reflection bands may become indistinct due to insufficient dielectric contrast between the target and host medium. This leads to edge localization errors. To mitigate this, prior studies have suggested computing the gradient map of the reflection regions and applying peak-tracing algorithms to extract the envelope of wavelet maxima [
32]. Such techniques enhance boundary detection by emphasizing the intensity transitions associated with the object surface.
Moreover, traditional analytical models often assume an ideal hyperbolic shape and a homogeneous propagation medium. In real-world scenarios, GPR data are corrupted by clutter, noise, hyperbolic deformation, target overlap, and dielectric inhomogeneity, all of which can degrade the accuracy of model-based detection. To overcome these challenges, the proposed method adopts a data-driven approach based on deep neural networks, which learns complex patterns and spatial contexts from labeled data and thus generalizes better across varying geologies, target materials, and burial depths.
3.1.2. Geometric Size Estimation
Once the hyperbola has been localized, the next objective is to estimate the radius of the cylindrical object, based on the geometry of wave propagation. In an ideal case, if the coordinates of any point (
x,
z) on the hyperbola and the apex
are known, the following geometric relation holds:
from which the radius
R can be solved as:
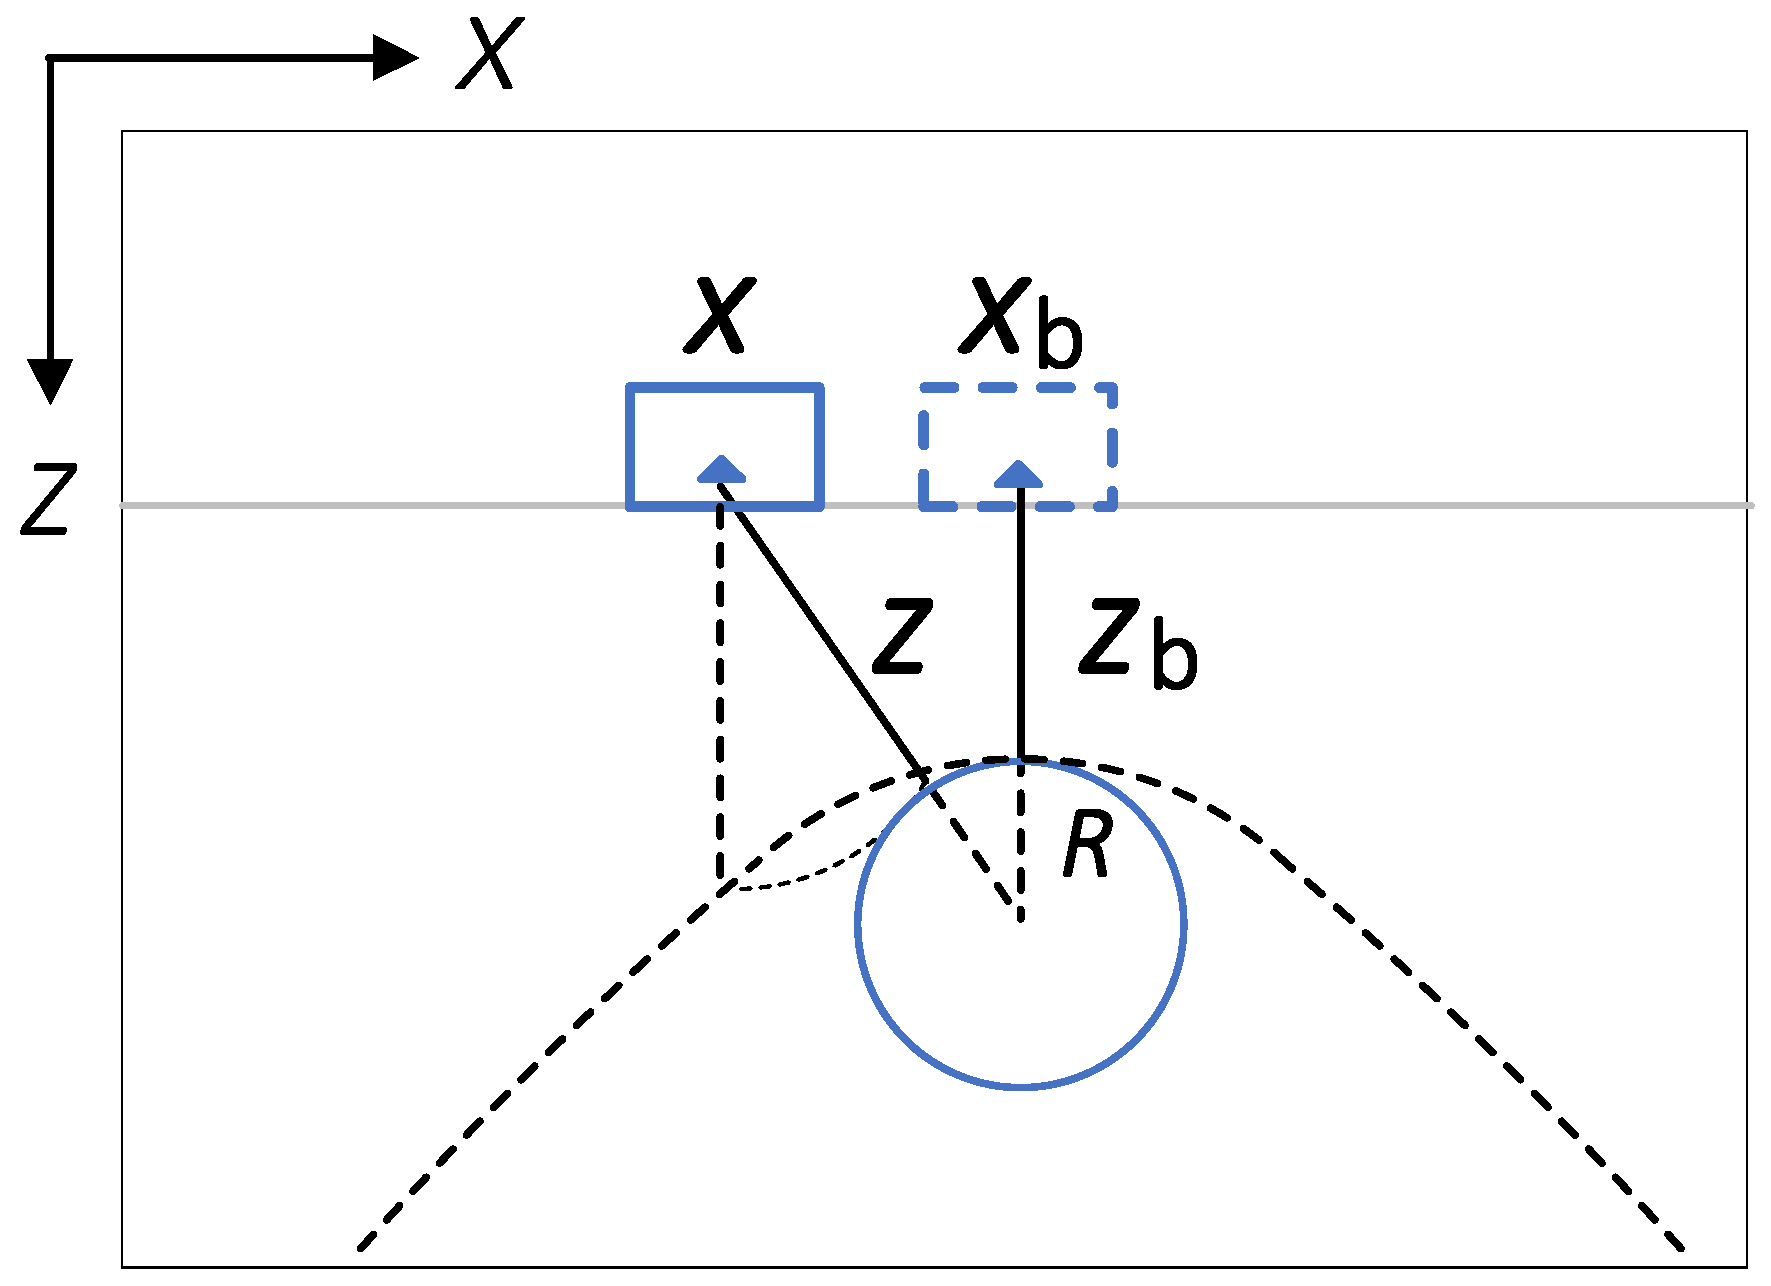
The geometric configuration of this relationship is illustrated in
Figure 3, where the buried cylindrical target, its apex, and a general reflection point (
x,
z) are marked in the B-scan imaging context [
1].
While theoretically sound, this equation presents several practical limitations. First, it is highly sensitive to coordinate inaccuracies, especially when , where the denominator becomes small and numerical instability occurs. Second, the selection of the point (x, z) on the hyperbola is ambiguous due to reflection bandwidth, rendering the computed radius unreliable. Third, the model assumes perfect cylindrical symmetry and homogeneous soil, which seldom hold in practice. Deviations in object shape, dielectric variation, or shallow burial can distort the reflection and violate model assumptions.
Furthermore, since the hyperbolic band in the B-scan image spans multiple pixels, using only one point to estimate radius introduces significant uncertainty. A more robust approach is to fit the entire skeleton of the hyperbola using regression, as adopted later in the proposed DeepMask-GPR framework. In this context, learning-based detection methods can leverage both geometric priors and contextual information to improve the accuracy of radius estimation, even in the presence of noise or partial occlusion.
3.2. Architecture of DeepMask-GPR
The proposed DeepMask-GPR is a data-driven, multi-task architecture designed for robust detection and precise geometric estimation of subsurface cylindrical targets in GPR B-scan images. It extends the classic Mask R-CNN framework with several tailored adaptations to handle the unique challenges of radar imagery, including diffuse hyperbolic reflections, scale calibration, and low-contrast environments.
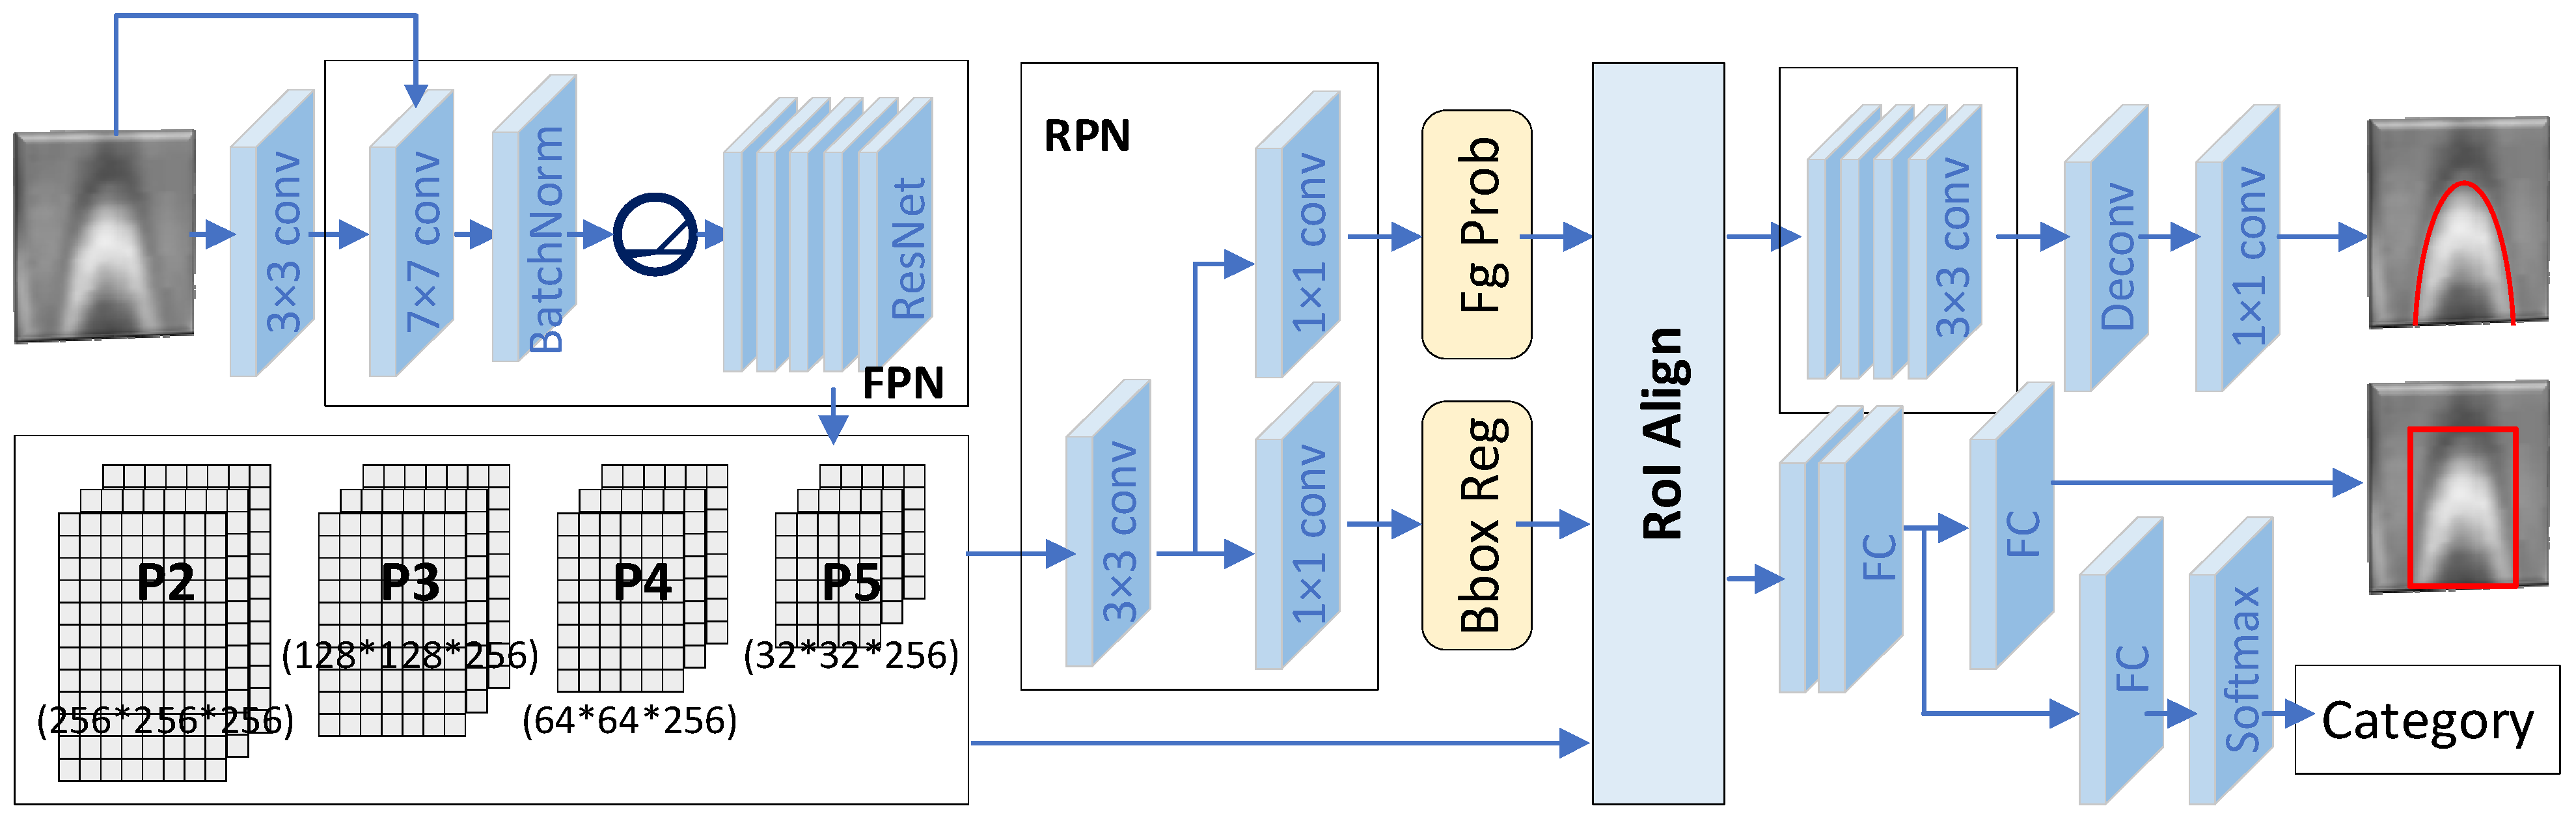
Unlike standard object detection systems that focus solely on bounding box prediction or segmentation, DeepMask-GPR integrates three tightly coupled tasks: (1) Hyperbola detection and segmentation, (2) Apex localization and coordinate mapping, and (3) Scale tick recognition for real-world calibration. The overall architecture is illustrated in
Figure 4, and each key module is detailed below.
3.2.1. Input Layer
The input to DeepMask-GPR consists of a two-channel tensor: the original grayscale B-scan image and a curvature-enhanced map, as described in
Section 4.3. These two channels are first processed by a 3 × 3 convolutional layer designed to enhance low-level edge features while jointly learning meaningful representations from both the raw image and its structural cues. This preliminary convolutional block acts as a preprocessing stage that guides the feature pyramid network (FPN) to focus on gradient-rich regions, which are indicative of hyperbolic targets.
3.2.2. Feature Pyramid Network
Following the edge enhancement module, the two-channel feature map is fed into a ResNet-based Feature Pyramid Network (FPN). The FPN combines multi-scale feature maps across different resolution levels (e.g., 64 × 64 × 256, 32 × 32 × 256), enabling robust representation of hyperbolas of varying sizes. Its lateral connections fuse semantic and spatial features from coarse and fine levels, while top-down pathways preserve shape and localization information critical for small or subtle hyperbolas.
3.2.3. Region Proposal Network
Following this, a Region Proposal Network (RPN) predicts candidate regions potentially containing hyperbolic structures. The RPN consists of a 3 × 3 convolutional layer followed by two 1 × 1 sibling convolutions for classification (foreground/background probability) and bounding box regression. The RPN anchors are adapted to account for the elongated and narrow aspect ratios, allowing for better alignment and proposal quality.
3.2.4. Region of Interest Alignment
Once candidate RoIs are generated by the RPN, they are passed to the Region of Interest Alignment (RoI Align) module. Unlike traditional RoI pooling, which introduces misalignments due to quantization, RoI Align uses bilinear interpolation to compute exact floating-point feature values at sampled grid locations, thus preserving spatial precision—an essential requirement for radar images, where object boundaries are often subtle and compact.
Each aligned RoI is converted into a fixed-size feature map (e.g., 14 × 14 or 28 × 28), regardless of the original region’s scale. This normalized representation allows subsequent processing to remain consistent across different object sizes.
3.2.5. Multi-Task Heads
Each aligned RoI is processed in parallel by three task-specific branches: classification head, bounding box head, mask head.
Classification head assigns a categorical label to each RoI, determining whether the detected region corresponds to an objective or background. It is composed of two fully connected (FC) layers, followed by a softmax classifier.
Bounding box head refines the coordinates of the predicted bounding box for better spatial localization. It consists of two FC layers and a regression module.
Mask head predicts a binary segmentation mask for each RoI using deconvolution and convolutional layers, enabling the extraction of detailed numerals or edge points of the hyperbola. The method to determine the ground truth of edge points and the parameters of the hyperbola is described in
Section 3.4.
Together, these multi-task heads enable DeepMask-GPR to perform not just object classification and detection, but also fine-grained shape reconstruction. This is particularly important for interpreting weak or cluttered GPR images.
3.3. Edge Feature Enhancement
The proposed DeepMask-GPR framework is fundamentally a data-driven approach, and hence understanding the intrinsic characteristics of the input data is critical to optimizing its performance. Among these characteristics, the hyperbola is the most salient and informative feature in GPR B-scan images. However, traditional edge detection or curve fitting techniques often fail to accurately extract hyperbolic patterns in this context. This is primarily because the grayscale intensity values in B-scan images tend to vary gradually rather than sharply, resulting in poorly defined edges and a limited number of extractable edge points.
Despite the difficulty in isolating explicit edges, it is evident that regions with higher grayscale gradients are more informative for identifying hyperbolic structures. To capture this implicit edge information more effectively, an Edge Feature Enhancement (EFE) is introduced into the DeepMask-GPR framework. Specifically, the local curvature of the grayscale image is taken as a supplementary feature map, which is then integrated with the original B-scan image to form a two-channel input representation.
The curvature at each pixel location is calculated using a fixed convolutional kernel, defined as follows [
41]:
This kernel enhances the localized curvature information by highlighting regions of high second-order variation in intensity. Unlike trainable convolutional layers, this curvature operator is predefined and does not require learning from data, which ensures stability and robustness in curvature estimation regardless of the dataset size or distribution. A detailed derivation and discussion of this operator can be found in [
41].
To incorporate the curvature-enhanced features into the detection pipeline, we construct a two-channel input for the Mask R-CNN framework, consisting of the original grayscale B-scan image and its corresponding curvature map. This departs from the standard configuration of Mask R-CNN, which typically processes either single-channel grayscale images or three-channel RGB images. As a result, the network architecture, particularly the first-stage convolutional filters, must be redesigned to accommodate the two-channel input. This modification allows the network to simultaneously leverage both raw intensity and structural curvature information, thereby improving its sensitivity to subtle hyperbolic patterns and enhancing detection accuracy in low-contrast or noisy environments.
3.4. Curve Fitting Procedure
To obtain the quadratic parameters (a, b, c) for both the predicted and ground truth masks, we apply a curve fitting procedure to the extracted edge points, denoted as .
The fitting is performed using least squares regression, minimizing the total squared error between the observed
yi and the predicted
:
This optimization problem can be solved analytically by constructing a design matrix X and solving the normal equation:
where
represents the fitted parameters. This procedure is applied independently to both the predicted mask and the ground truth mask to obtain (
a,
b,
c) and
, respectively, for use in the parameter regression loss.
By incorporating explicit curve fitting into the loss function, the model is encouraged not only to segment the hyperbola but also to learn its precise geometric shape, which is critical for accurate subsurface object modelling and interpretation in GPR data analysis.
To obtain the ground truth of edge points, Canny algorithm [
42] is used for the candidate regions. The lower boundary points are removed and only the upper ones are reserved.
3.5. Model Training
3.5.1. Loss Function
The overall loss function of DeepMask-GPR follows the multi-task design of the original Mask R-CNN framework, combining classification, bounding box regression, and mask prediction objectives. Formally, the total loss is expressed as:
where
is the cross-entropy loss for classifying each proposed region as either a hyperbola or background.
is a smooth L1 loss that refines the predicted bounding box coordinates with respect to the ground truth.
typically represents the pixel-wise binary cross-entropy loss between the predicted mask and the ground truth segmentation mask.
To address the specific geometric nature of hyperbolas in GPR imagery, DeepMask-GPR introduces a tailored mask loss formulation for regions classified as hyperbolic structures. Rather than comparing binary masks directly, the model extracts the skeleton of both the predicted and ground truth masks and fits them to a quadratic function (1).
The resulting coefficients (
a,
b,
c) from the predicted mask and the coefficients
from ground truth mask are then used to compute a parameter regression loss:
where
are weighting coefficients to balance the contribution of each parameter. They satisfy the normalization constraint:
This formulation is motivated by the observation that a high overlap between predicted and ground-truth masks does not always guarantee an accurate match in curve shape or apex location. They may appear spatially close but represent significantly different curves in terms of shape or apex position. By regressing directly on the curve parameters, the model is guided to capture the geometric essence of the hyperbolic shape rather than simply optimizing for pixel-level similarity, which is essential for reliable spatial estimation in GPR data analysis.
For non-hyperbolic objects (e.g., tick mark digits), the standard binary mask loss is retained, ensuring that DeepMask-GPR remains compatible with conventional segmentation tasks while being specifically optimized for hyperbola modeling in GPR imagery.
3.5.2. Transfer Learning Strategy
Given the substantial cost and effort involved in manually collecting and annotating large volumes of GPR data, DeepMask-GPR adopts a transfer learning strategy to achieve high accuracy with limited supervision. Specifically, the backbone network (i.e., ResNet-FPN) is initialized using weights pre-trained on the MS COCO dataset, a large-scale collection of natural images. During training, the later layers of the network are fine-tuned on domain-specific B-scan images, allowing the model to adapt its learned features to the unique characteristics of GPR imagery (e.g., hyperbolic patterns, low contrast, noise).
This strategy enables the model to leverage general visual features learned from natural scenes while refining its capacity to interpret radar-specific structural cues, thus improving generalization and reducing overfitting in data-scarce scenarios.
3.6. Coordinate Mapping
To convert the image-space apex coordinates obtained from the B-scan image into real-world spatial coordinates , a linear coordinate mapping strategy is employed based on the detected scale tick marks along the horizontal and vertical axes.
Let and denote the pixel coordinates of the leftmost and rightmost horizontal tick marks in the image, corresponding to physical positions and , respectively. Similarly, let and represent the pixel coordinates of the shallowest and deepest tick marks along the vertical axis, associated with depth values and . These physical values are directly extracted by DeepMask-GPR’s tick recognition module.
Then, the real-world horizontal and vertical coordinates
corresponding to the apex point
are computed by linear interpolation as follows:
The same interpolation procedure can be applied to any other point (
x,
z) along the hyperbola in the image, allowing its conversion into real-world coordinates. Once both (
x,
z) and the apex point
are transformed into spatial coordinates
and
, respectively, they can be substituted into the geometric radius estimation formula:
This enables the estimation of the true radius RRR of the buried cylindrical object in physical units. The accuracy of this transformation is critical for ensuring reliable object size recovery and downstream analysis in subsurface modeling.
Given a B-scan image as input, the model is trained to output a comprehensive set of variables: ; ; .
This formulation transforms the hyperbola detection problem into an end-to-end prediction task that integrates geometric reasoning with deep feature learning. It allows the proposed framework not only to identify subsurface targets but also to derive their quantitative spatial characteristics in real-world coordinates.
4. Experiments
We evaluate the proposed DeepMask-GPR framework from four perspectives: (1) spatial localization, (2) geometric size estimation, (3) computational complexity, and (4) 3D reconstruction visualization. All experiments were implemented in Python 3.11 and trained from scratch for 100 epochs using the Adam optimizer (batch size of 4, initial learning rate 1 × 10⁻⁴ decayed by a factor of 0.1 every 20 epochs). Experiments are conducted on a workstation equipped with an NVIDIA GeForce RTX 4070 (Laptop, sourced from Santa Clara, CA, USA), an Intel i9-14900HX CPU (sourced from Santa Clara, CA, USA), and 64 GB of RAM (sourced from Seoul, Republic of Korea).
4.1. Evaluation of Spatial Localization
Because the central objective of this work is underground cable localization, spatial localization accuracy is the primary metric guiding both model design and evaluation. To ensure reliability and external validity, we assess performance on two public GPR datasets. Dataset I [
43] includes 2239 images, which is publicly accessible at
https://github.com/LCSkhalid/GPR_Data (accessed on 5 March 2025). Dataset II contains 171 labelled images, which is available at
https://github.com/irenexychen/gpr-data-classifier (accessed on 5 March 2025).
4.1.1. Evaluation Metrics
To evaluate the estimating accuracy of apex, two evaluation metrics were chosen in this experiment: Intersection over Union and True Positive Rate.
Intersection over Union (IoU) measures the overlap between the predicted region and the ground-truth region. Assuming
G and
P represent the ground truth and predicted bounding regions respectively, the IoU is defined as
where |G∩P| denotes the area of overlap between the ground truth region
G and the predicted region
P, |G∪P| denotes the area of their union. Larger IoU reflects more accurate spatial localization.
True Positive Rate (TRP) quantifies the fraction of annotated targets that are correctly detected under the matching rule. Let
TP and
FN represent true positives and false negatives, TRP can be calculated by
Higher TPR indicates more comprehensive detection coverage. In our experiments, a detection matches the ground truth when IoU ≥ 0.5.
4.1.2. Experimental Results
The DeepMask-GPR framework was benchmarked against several representative deep learning architectures, including Faster R-CNN [
44], Mask R-CNN [
21], and the YOLOv10/11/12 families (nano and small variants) [
45,
46,
47]. For a fair comparison, Mask R-CNN employed a ResNet-50–FPN backbone, and all models were trained and evaluated under an identical protocol encompassing preprocessing, data augmentation (mild translation/scale jitter, brightness/contrast, Gaussian noise; no vertical flip to preserve physical polarity).
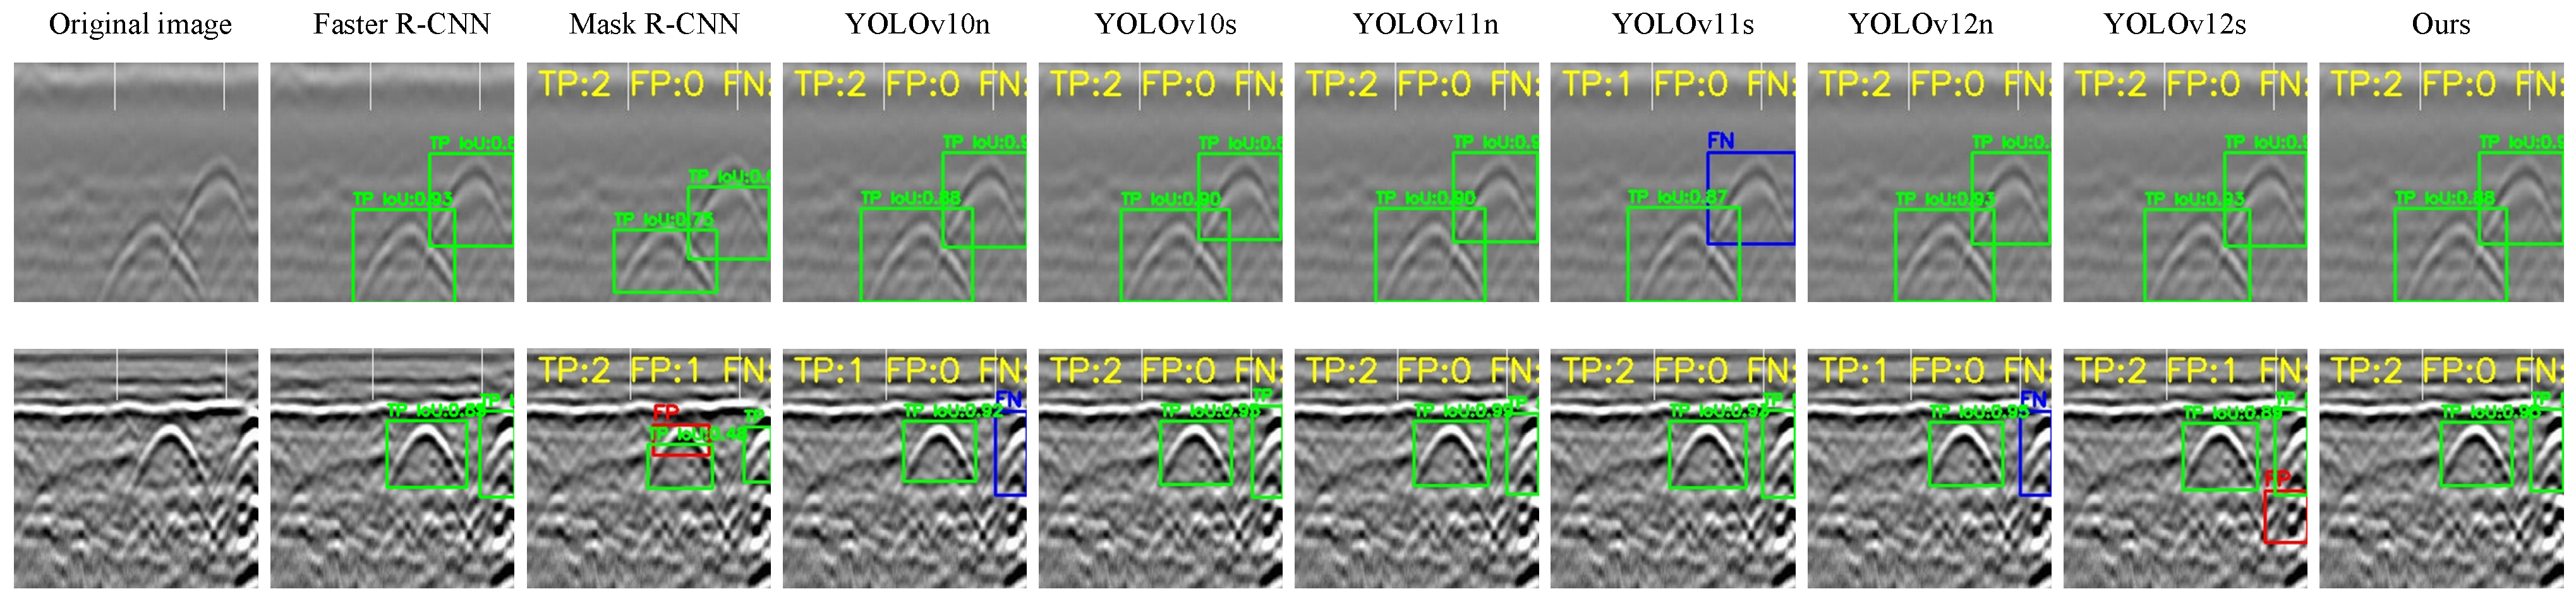
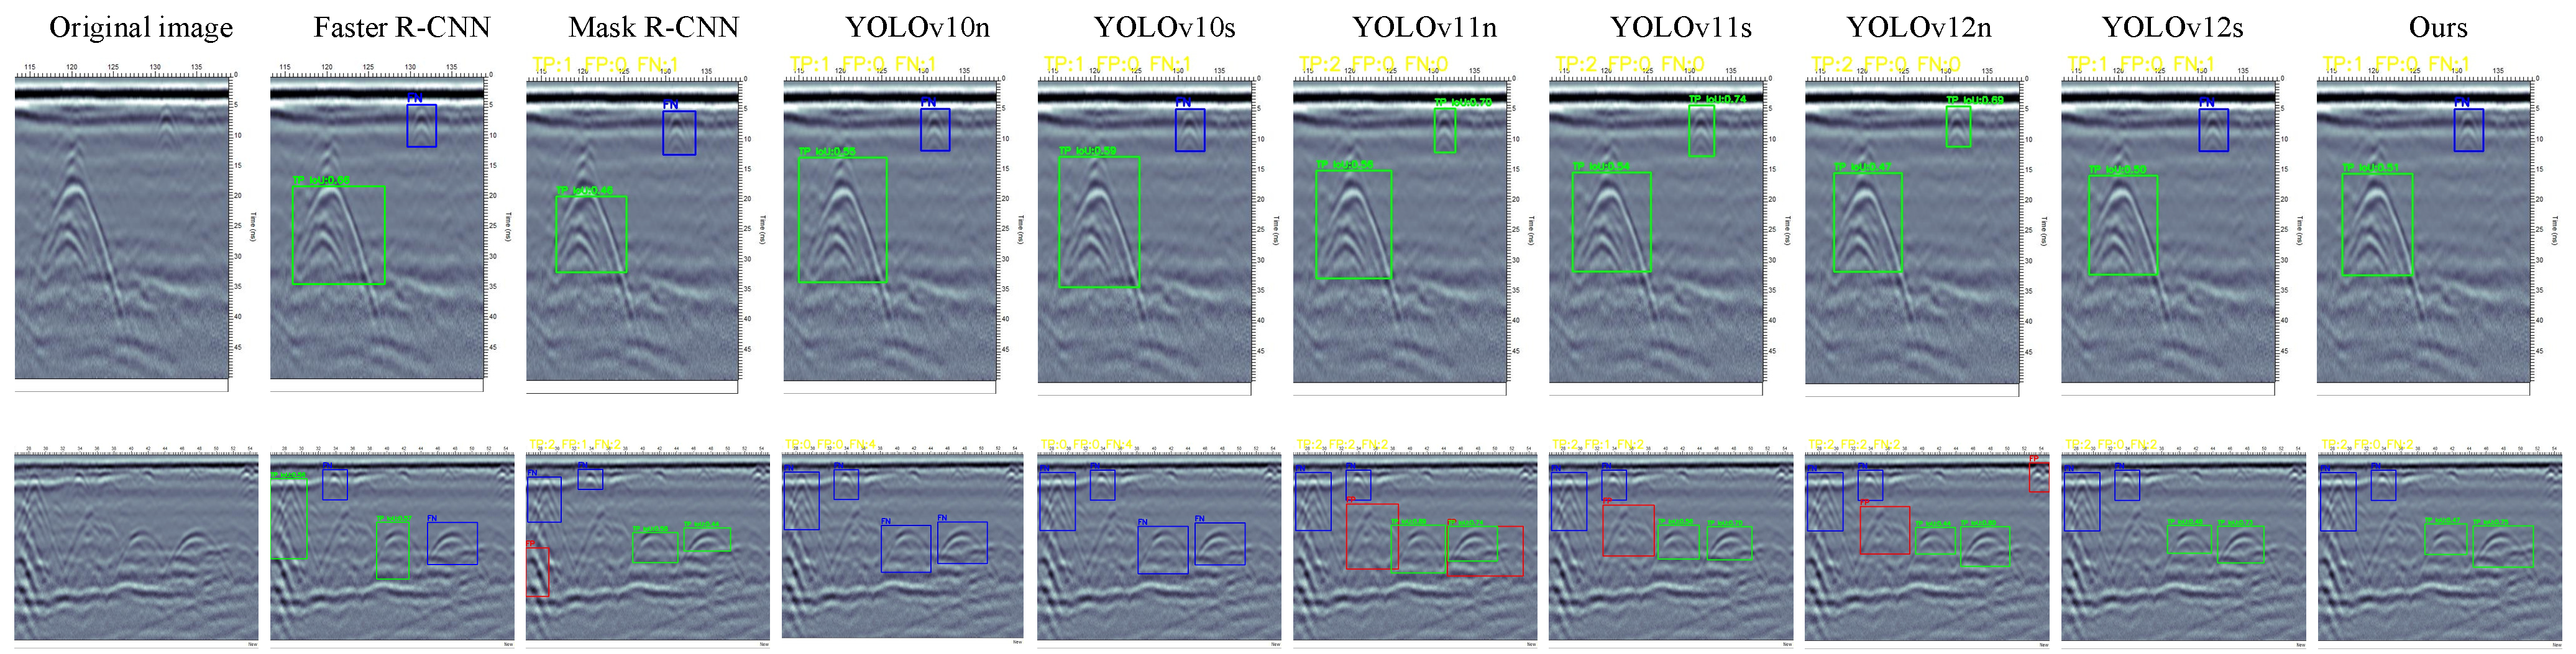
Table 1 and
Table 2 report quantitative spatial localization results on Dataset I and Dataset II, respectively.
Across both datasets, DeepMask-GPR consistently attains higher TRP and IoU than the baselines, indicating more reliable apex detection under weak edges and clutter and, by extension, more accurate geometric characterization of buried cylindrical objects from hyperbolic B-scan signatures. Qualitative examples in
Figure 5 and
Figure 6 further illustrate the improved localization precision and robustness of the proposed framework relative to competing methods.
4.1.3. Computational Complexity and Edge Deployment
The computational cost was evaluated in terms of parameter count (Params, M), floating-point operations (FLOPs, G), and inference latency on the stated hardware using batch size = 1 with FP32 precision. Unless otherwise specified, latency denotes the average per-image time from model input to detection output, excluding pre-/post-processing. To account for dataset-dependent input characteristics, Latency-I (measured on Dataset I) and Latency-II (measured on Dataset II) were additionally reported. The results in
Table 3 summarize Faster/Mask R-CNN, YOLOv10/11/12 (n/s), and DeepMask-GPR under this unified protocol.
Although DeepMask-GPR leverages a dual-channel input, it does not incur a substantial increase in parameters or runtime relative to its two-stage counterparts. As expected, R-CNN–style detectors exhibit higher computational complexity than YOLO-style one-stage models; however, in non-real-time settings where localization accuracy is prioritized (our primary objective), the complexity of the R-CNN family remains well within practical bounds.
To assess field feasibility on non-GPU hardware, the inference pipeline was deployed on a CPU-only industrial PC (Intel Core i7-12700, 12 cores/20 threads, 64 GB RAM, no discrete GPU) running a Linux operating system. The model was trained on a desktop machine and exported from PyTorch to ONNX in Python (v3.11); on the device, a C++ application using the OpenCV library executed the forward pass. The codebase was built with Visual Studio 2019 (v16.8) using the/O2 optimization flag, and the resulting executable was used for prediction only (no on-device training). With batch = 1 and input 480 × 450, the end-to-end latency was ~0.60 s/image, including reading the image and producing detections and radius estimates.
4.1.4. Ablation Study on Spatial Localization
To quantify the contributions of the curvature-enhanced feature (abbreviated EFE) and the quadratic radius loss
(abbreviated Q), the evaluation was conducted on two public benchmarks under an identical training and evaluation protocol, encompassing same preprocessing, augmentation, thresholds, and hardware. Six variants of DeepMask-GPR were systematically evaluated by crossing the second-channel type (EFE, Canny, Gray) with the loss design (Q vs. Std, where Std denotes standard Smooth-L1). Canny uses an edge map as the second channel, while Gray denotes gray-scale only (no second channel).
Table 4 summarizes the spatial localization results.
The results reveal three consistent trends. First, adding EFE markedly improves localization on both datasets: relative to Gray or Canny inputs, EFE yields the highest TPR and IoU. This supports that dense, signed curvature responses provide more learnable geometric cues than sparse binary edges, especially under weak boundaries and low SNR. Second, replacing EFE with Canny narrows, but does not close, the gap. Canny improves upon Gray but consistently underperforms EFE, reflecting edge fragmentation and the loss of curvature magnitude after binarization. Third, introducing the quadratic radius loss typically yields small changes relative to standard Smooth-L1. An apparent exception appears in DM-GPR (Gray, Q) on Dataset II, where TPR decreases while IoU increases. This pattern likely reflects a shift from Q via shared features: slightly fewer predictions pass the fixed confidence filters (lowering TPR), while the remaining detections are tighter and better aligned (raising IoU).
4.2. Evaluation of Geometric Size Estimation
Radius estimation relies on accurate apex depth and spatial calibration. Dataset I does not provide depth or radius ground truth, and Dataset II lacks radius annotations; consequently, radius experiments are conducted only on our in-house B-scan dataset, for which the geometry is known by design. Because reliable radius recovery requires instance-level band delineation for boundary extraction and hyperbola fitting, one-stage detectors from the YOLO family are excluded from this task. For a comparative analysis, DeepMask-GPR was benchmarked against Mask R-CNN (ResNet-50–FPN) and Faster R-CNN (ResNet-50–FPN) under an identical training and evaluation protocol.
4.2.1. B-Scan Data Acquisition Procedure
The radius dataset was acquired with a MALA GX750 HDR ground-penetrating radar configured for high-dynamic-range recording and high-resolution subsurface imaging. The antenna center frequency was 750 MHz and the acquisition time window 75 ns. The radar was mounted on a four-wheel cart to ensure stable, repeatable motion over a leveled survey area. To control confounders while providing ground truth, cylindrical cables with diameters 9.5 cm, 12 cm, and 15 cm were buried at a uniform depth of 1 m. This design isolates the effect of target diameter on the hyperbolic reflection band while keeping depth fixed for calibration.
For each diameter, ten B-scans were collected at distinct lateral offsets and scan angles to induce natural variation in hyperbola orientation and signal-to-noise ratio (SNR). During acquisition, the cart was driven along a single traverse per B-scan, maintaining a constant speed and antenna height; the ground surface was pre-leveled and marked to guide trajectory and orientation. Apex-depth calibration followed the survey layout and the system’s timing parameters, while radius ground truth was known a priori from the physical cable diameters. All B-scans were normalized and recorded with consistent instrument settings to ensure comparability across traverses and diameters, yielding a balanced dataset that is suitable for evaluating radius estimation under controlled yet realistic variability.
4.2.2. Evaluation Metrics
The performance of radius estimation is quantified using two standard metrics: Mean Absolute Error (MAE) and Root Mean Squared Error (RMSE), with results reported in centimeters.
Mean Absolute Error (MAE) measures the average absolute deviation between the predicted radius and the ground-truth radius. Let
and
denote the ground-truth and predicted radii for the
i-th instance, and
N is the number of matched detections. Then, MAE can be calculated by
Lower MAE value indicates smaller typical radius deviations.
Root Mean Squared Error (RMSE) quantifies the square-root of the mean squared radius error, placing greater penalty on large deviations:
Lower RMSE reflects improved accuracy, especially in the presence of occasional large errors.
4.2.3. Experimental Results
Table 5 reports radius errors for three cable sizes computed from detected hyperbolas via Equation (5). DeepMask-GPR achieves the lowest error in all cases. At the mid-size radius
R = 6.0 cm, where the hyperbola exhibits moderate curvature and the estimator is best conditioned, the model attains obvious reductions of MAE and RMSE relative to Mask R-CNN and Faster R-CNN. Similar gains are observed at
R = 7.5 cm and
R = 4.75 cm, indicating consistent improvements across target sizes.
It is interesting that the smallest errors occur at the mid-size radius yielding a favorable balance between apex-depth sensitivity and lateral sampling.
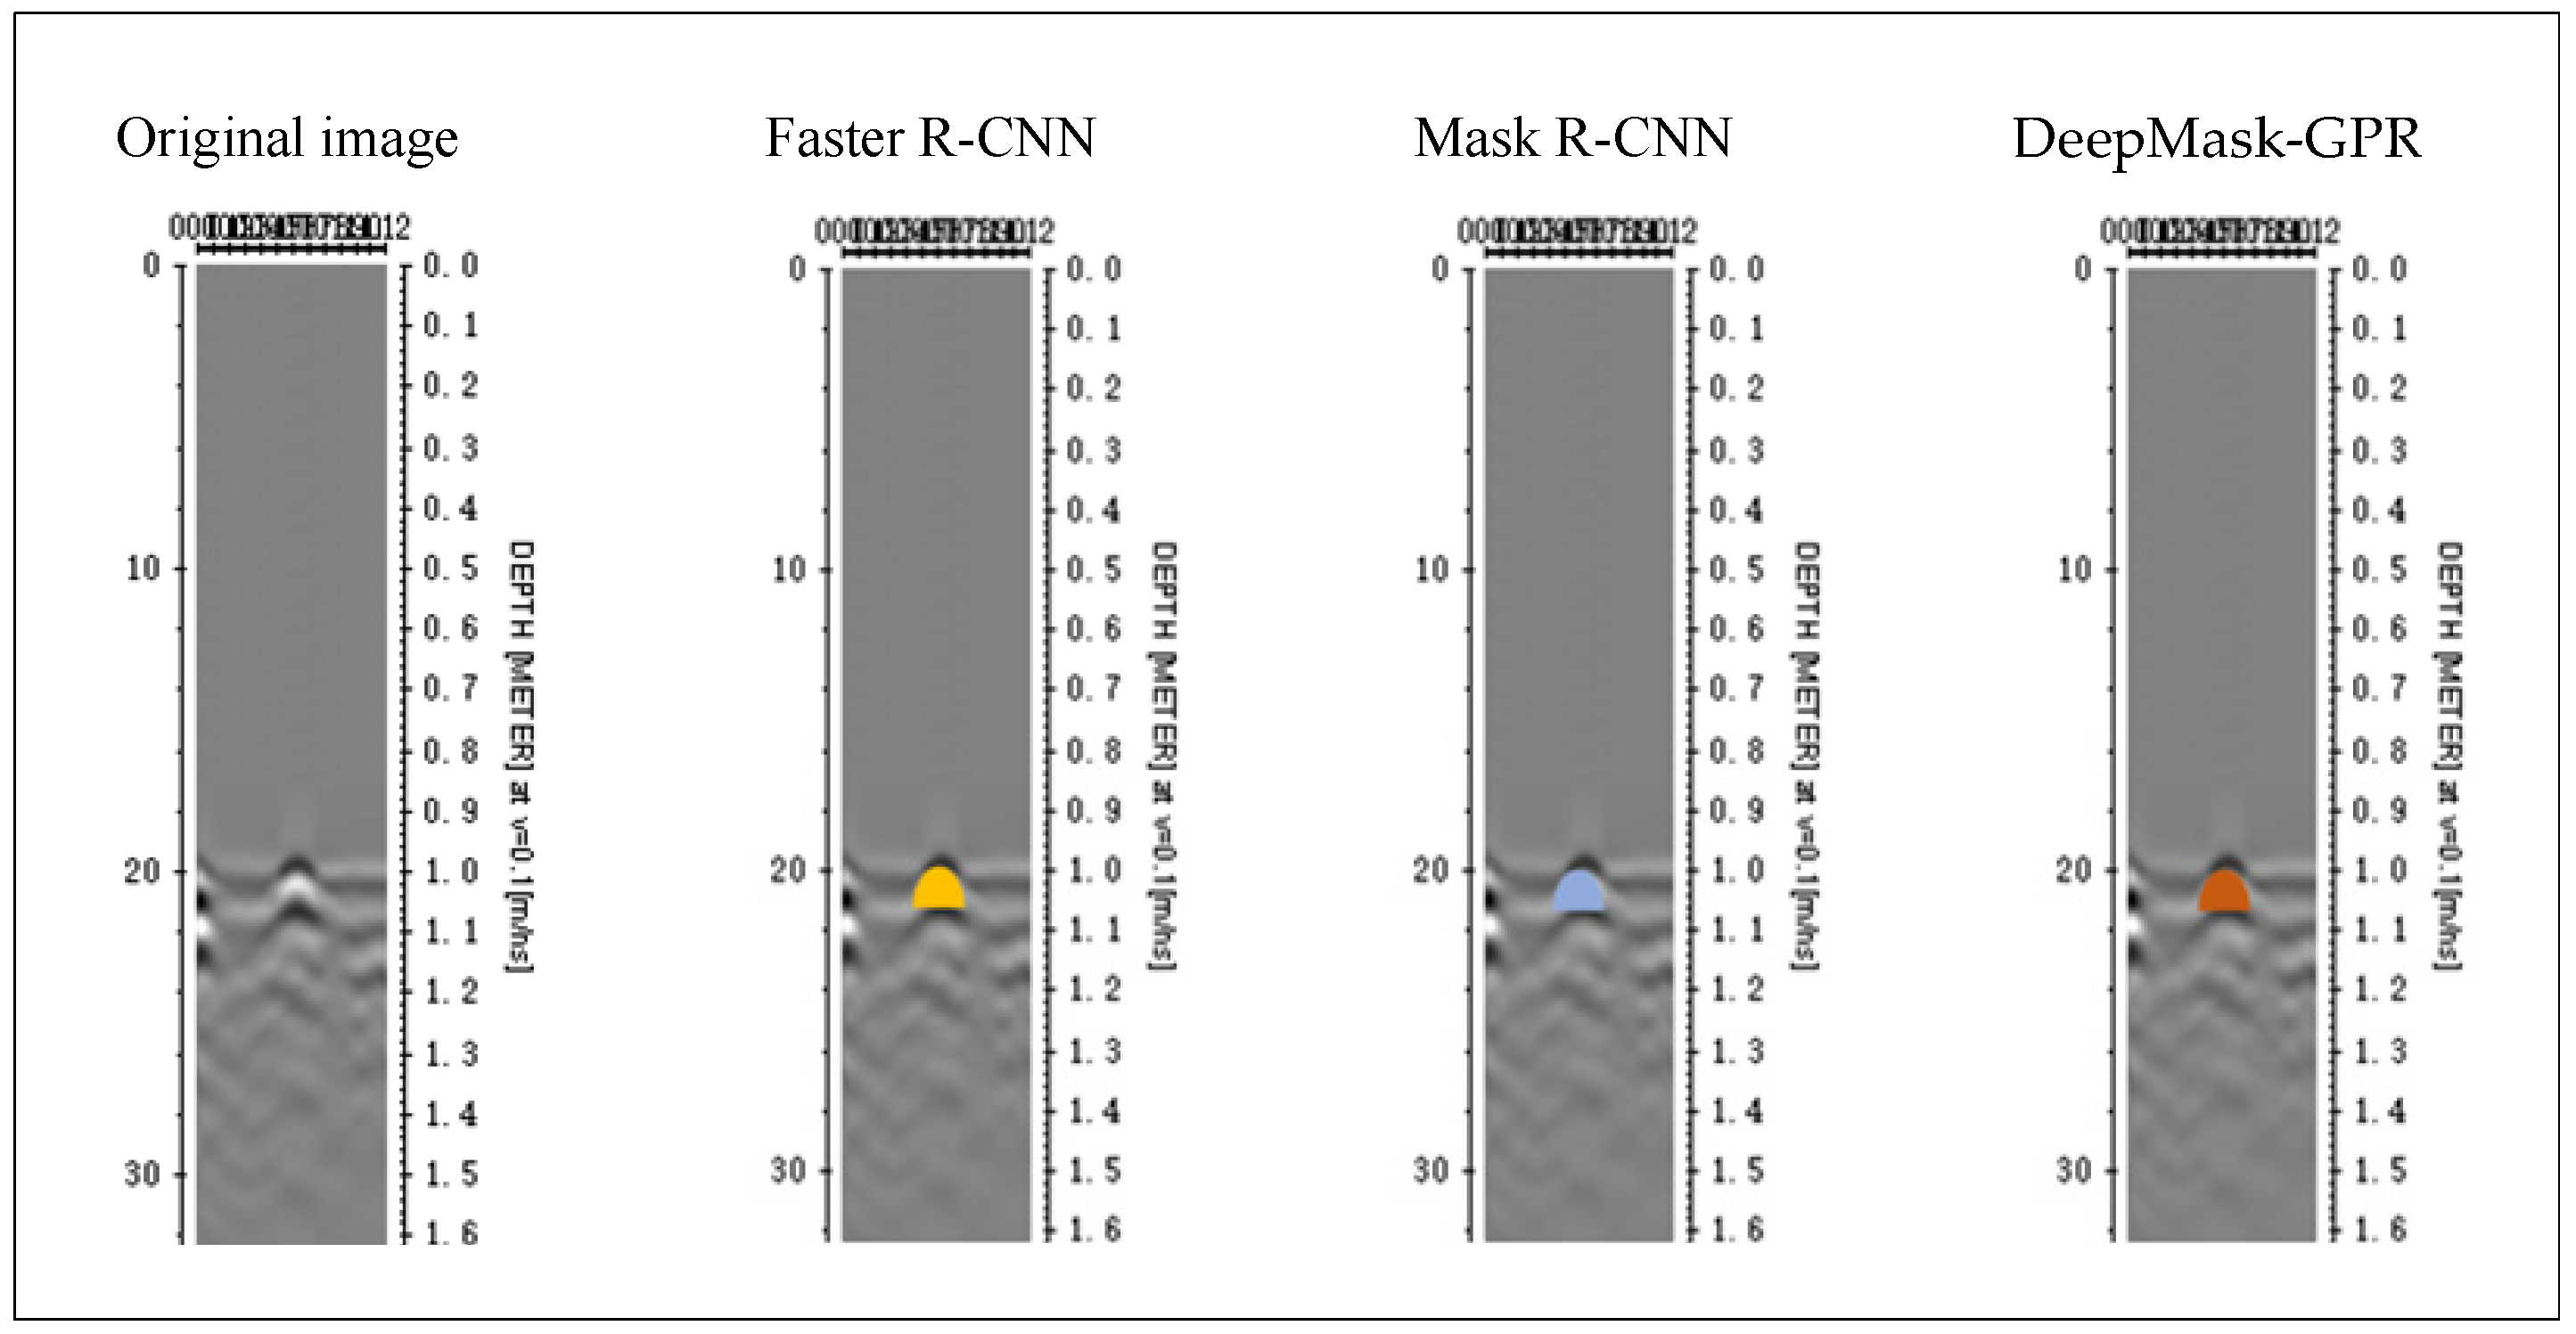
Figure 7 provides a qualitative comparison. All three methods detect the hyperbola, and the visual differences are subtle; however, the quantitative metrics reveal systematic advantages for DeepMask-GPR. This is consistent with pixel-level improvements in apex localization and band alignment that are not easily perceived by eye but materially reduce the propagated error in radius estimation.
4.2.4. Ablation Study on Geometric Size Estimation
To confirm the effects of the second-channel design and the radius-loss formulation on geometric sizing, six DM-GPR variants that cross the second-channel type (Gray, Canny, EFE) with the loss design (Std vs. Q) were evaluated. Subsequently, Radii were derived from the detected hyperbolas via Equation (5).
The results in
Table 6 reveal two clear and consistent patterns across all radii. First, for a fixed loss function, upgrading the second channel from Gray to Canny and then to EFE steadily reduces error. Second, for a fixed second channel, introducing the quadratic radius loss further improves accuracy relative to standard Smooth-L1. These geometric-error findings align with the localization advantages observed in
Table 4, indicating that stronger boundary evidence and a geometry-aware loss translate into more reliable radius estimation.
4.3. 3D Visualization
To further demonstrate the effectiveness of the proposed DeepMask-GPR framework, we conducted a qualitative visualization experiment based on multi-slice reconstruction. Specifically, a series of adjacent B-scan images—each representing a vertical slice of the subsurface—were collected and processed using the DeepMask-GPR model. For each slice, the model automatically detected hyperbolic signatures and estimated the corresponding geometric parameters, including the radius and location of the buried cylindrical target.
4.3.1. C-Scan Data Acquisition
For 3D visualization, which is widely applied [
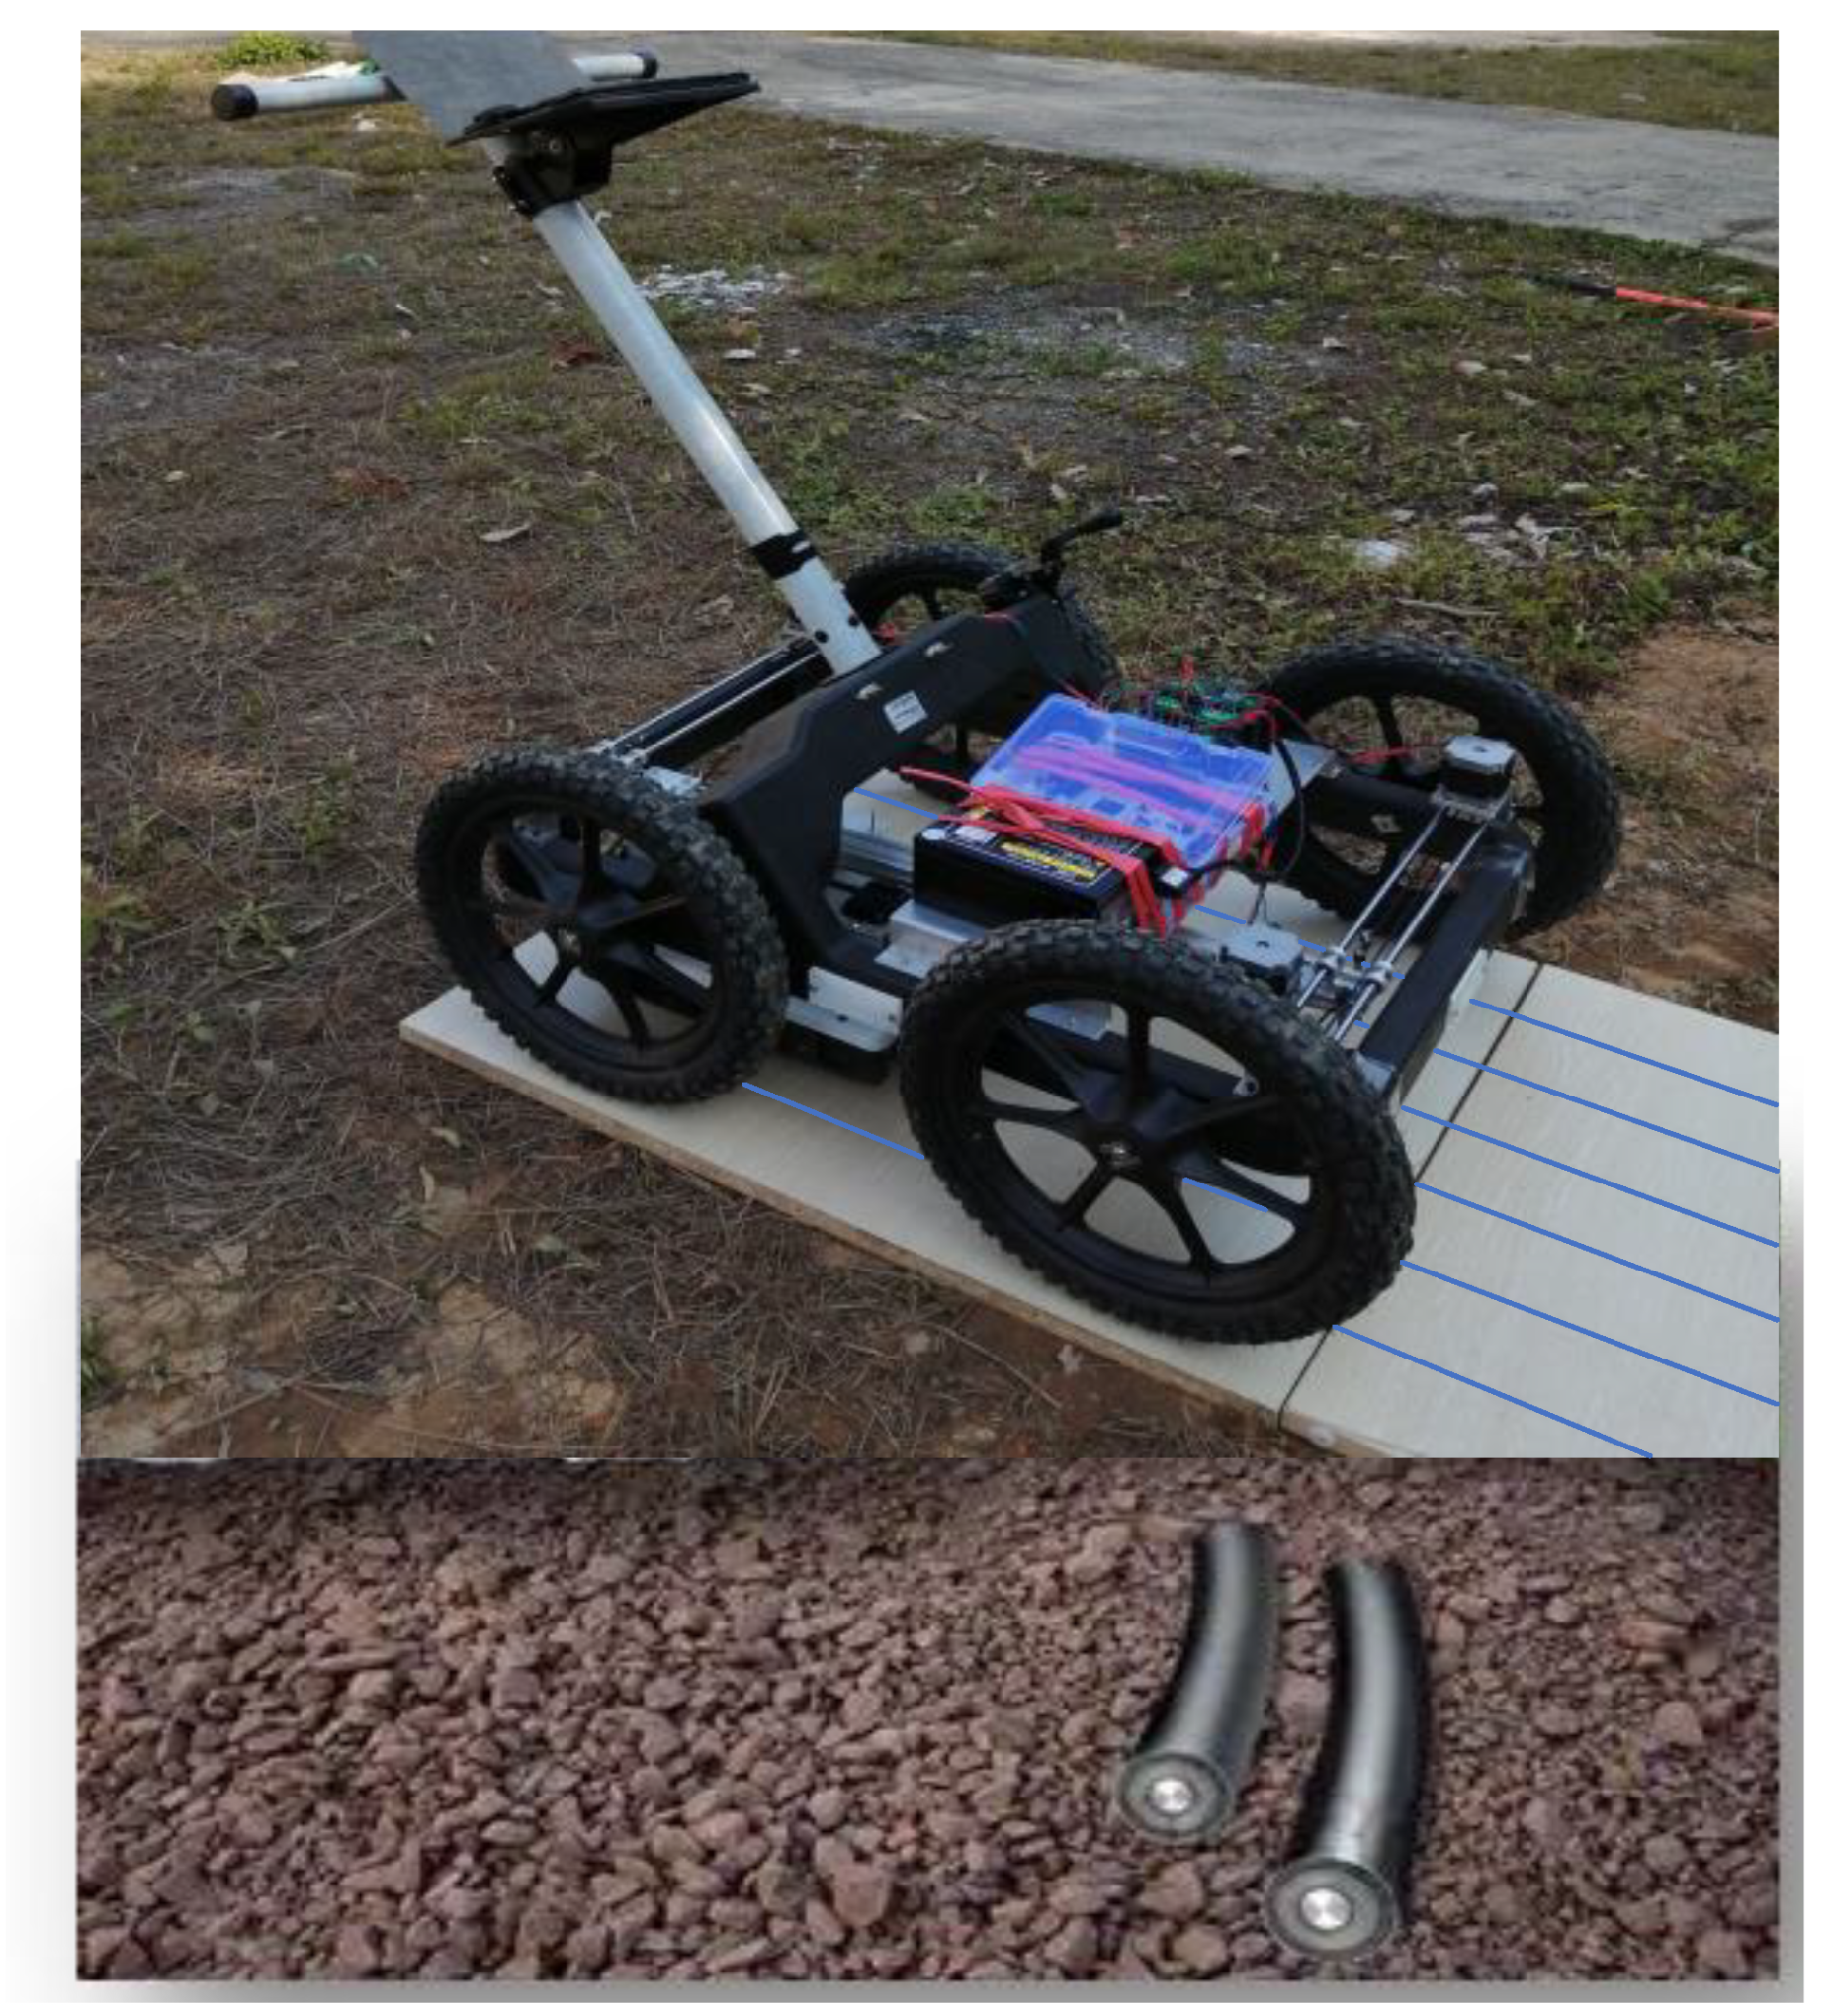
48], data were collected using a parallel-line raster, as illustrated in
Figure 8. The survey surface was leveled and marked with a set of equally spaced, straight guide lines. The cart-mounted MALA GX750 HDR was driven along one guide line at a time; upon completing a line, the system was laterally displaced by 10 cm to the next parallel line and the traverse was repeated. This line-by-line procedure continued until the required cross-track extent was covered, yielding a stack of B-scan slices at regular 10 cm spacing in the cross-track direction.
Along each traverse (down-track, X), the radar recorded one A-scan every 0.2 cm of linear motion to capture fine-scale subsurface reflections within each B-scan (X–Z plane). Constant antenna height and steady cart speed were maintained to ensure inter-line consistency; start–end headings were checked to keep lines parallel and co-oriented. The entire measurement grid covered approximately 3 m2. The resulting volume adopts the conventional GPR coordinates with X as down-track distance, Y as the discrete line index multiplied by 0.10 m (cross-track offset), and Z as two-way travel time.
4.3.2. Multi-View Reconstruction
By aggregating the detection results across multiple B-scans acquired along parallel scanning lines, we reconstructed the 3D spatial geometry of the subsurface target.
Figure 9 illustrates the reconstructed volume, where each detection corresponds to a cross-sectional point on the cylindrical structure, and their combination forms a continuous 3D trajectory of the object.
This multi-view reconstruction not only confirms the consistency and robustness of the model’s predictions across different scanning angles, but also enables volumetric estimation of the target’s shape and size—demonstrating the potential of DeepMask-GPR for full 3D subsurface profiling using only 2D GPR images. The resulting 3D geometry aligns well with the known ground truth, further validating the accuracy of the proposed approach.
5. Conclusions
This paper presented DeepMask-GPR, a B-scan–based framework for the automatic detection and positioning of buried cylindrical objects in ground-penetrating radar images. Unlike approaches that require raw waveforms, our method operates directly on rendered radargrams, facilitating deployment on commercial systems. The design is supported by two key components: (i) a curvature-enhanced second channel (EFE) that provides dense, signed second-order cues for hyperbola evidence, and (ii) a quadratic radius loss that stabilizes geometric regression.
Empirically, DeepMask-GPR achieves state-of-the-art spatial localization on two public datasets, while maintaining practical computational cost on commodity hardware. On an in-house B-scan set with ground-truth geometry, it delivers lower MAE/RMSE in radius estimation across multiple cable sizes. Ablation analyses further demonstrate the contribution of both EFE and the quadratic radius loss, confirming their innovative value.
As for limitations, geometric size estimation was evaluated only in specific scenarios with a limited sample size; its applicability to more complex environments remains to be verified. In future work, we will extend evaluation to heterogeneous soils, overlapping/adjacent targets, and surface interference; incorporate domain adaptation across soil and antenna settings; and integrate a full C-scan workflow for non-cylindrical objects where volumetric meshing and cross-slice registration dominate error.