Abstract
To address the “metering blind zone” problem in distribution networks caused by flood disasters, this paper proposes an optimal deployment strategy for low-voltage instrument transformers (LVITs) based on time-varying risk assessment. A comprehensive model quantifying real-time node importance during disaster progression is established, considering cascading faults and dynamic load fluctuations. A multi-objective optimization model minimizes deployment costs while maximizing fault coverage, incorporating dynamic response constraints. A Genetic-Greedy Hybrid Algorithm (GGHA) with intelligent initialization and elite retention mechanisms is proposed to solve the complex spatiotemporal coupling problem. Simulation results demonstrate that GGHA achieves solution quality of 0.847, outperforming PSO, GA, and GD by 7.5%, 11.7%, and 8.7%, respectively, with convergence stability within ±2.5%. The strategy maintains 100% normal coverage and 73.3–95.5% disaster coverage across flood severity levels, exhibiting strong feasibility and generalizability on IEEE 123-node and 33-node test systems.
1. Introduction
In recent years, China has frequently encountered severe flood disasters in multiple regions. Under such natural disasters, the observability and measurability of the power system are significantly compromised. In power systems, the loss of measurement capabilities in certain areas due to impaired observation and measurement functions is termed a metering blind zone. The term “metering blind zone” refers to geographical areas within distribution networks where measurement and monitoring capabilities are temporarily lost due to equipment damage or operational failure during natural disasters. During the “7.20” catastrophic flooding event in Henan Province (2021), extensive metering blind zones resulted in over RMB 10 million in unaccounted energy losses and prolonged restoration times due to inadequate situational awareness [1].
Instrument transformers, as the core equipment for real-time monitoring of power grid operating conditions, play a critical role in disaster response scenarios. Their optimal placement directly determines fault response efficiency and power supply restoration reliability. Therefore, there is an urgent need to investigate optimal deployment strategies for disaster-resilient instrument transformers under flood and other natural disasters, addressing their failure risks under extreme environmental conditions.
Currently, research on optimal sensor placement in distribution networks provides valuable methodological foundations, particularly the extensive literature on synchronized phasor measurement unit (PMU) deployment. While PMUs serve distinct operational purposes—primarily transmission-level dynamic state estimation and wide-area monitoring—their optimal placement methodologies share mathematical structures with instrument transformer (IT) deployment problems: both involve multi-objective optimization under observability constraints with budget limitations. However, critical distinctions exist: (1) PMUs focus on high-frequency dynamic measurements (30–60 Hz sampling) for transient stability analysis, whereas ITs provide revenue-grade metering and steady-state monitoring; (2) PMU deployment prioritizes transmission network observability, while IT placement addresses distribution-level fault localization and load profiling; (3) disaster resilience considerations—central to IT deployment—receive limited attention in PMU literature.
This methodological parallel motivates our review of PMU optimization techniques while clearly distinguishing the unique requirements of disaster-resilient IT deployment. For instance, Reference [2] accounts for spatiotemporal correlations and proposes a node importance metric, constructing an optimal deployment objective function based on this metric and PMU quantity constraints to achieve optimal PMU placement. Reference [3] considers the integration of renewable energy sources into distribution networks and introduces a PMU optimization method incorporating grid-connection monitoring. This work establishes a PMU optimal configuration model with constraints on maximum allowable state estimation error and the number of devices, solving it using a particle swarm optimization (PSO) algorithm. Simulation results demonstrate that the proposed method reduces the required PMU deployment to less than 7% of the total nodes. References [4,5,6] investigate cybersecurity challenges, particularly denial-of-service (DoS) attacks that cause missing measurement data, and explore PMU-based state estimation under DoS attacks. The proposed PMU optimization methods overcome economic and technical constraints while ensuring system observability. However, these studies primarily focus on idealized test systems, neglecting the complexity of real-world PMU deployment. To address this, References [7,8] propose a hybrid measurement approach, combining PMUs with conventional measurement devices to achieve full system observability. Experimental results validate the effectiveness of the proposed PMU deployment algorithm.
In summary, the aforementioned literature has investigated optimal PMU deployment from various perspectives. However, research on optimal instrument transformer deployment remains limited, with only a few studies focusing on distribution network metering device planning based on static load distributions [9]. Notably, existing studies often fail to consider optimal instrument transformer deployment under disaster scenarios, neglecting the real-time impact of dynamic disaster propagation processes on node importance. Consequently, these approaches cannot accurately reflect the shifting of critical nodes during catastrophic events. The current research on optimal instrument transformer deployment is therefore both scarce and incomplete, particularly regarding disaster-resilient deployment strategies. This underscores the critical need for in-depth investigation into optimal instrument transformer deployment methodologies under disaster conditions.
The necessity of disaster-scenario-specific deployment strategies is justified by four critical factors absent in conventional static approaches:
- (1)
- Dynamic Criticality Shifts: Node importance undergoes significant temporal variation during disaster propagation. A node operating 50 kVA under normal conditions may become critical when redistributed loads from 3 to 5 failed neighbors, elevating its monitoring priority from medium to essential within hours.
- (2)
- Budget-Constrained Optimization: While ideal scenarios permit comprehensive monitoring deployment, realistic capital expenditure limitations necessitate intelligent prioritization. Static deployment is optimized for normal operations; disaster-aware strategies preemptively allocate monitoring resources to survivable critical nodes.
- (3)
- Cascading Failure Dynamics: The “7.20” Henan flooding demonstrated cascading effects where initial equipment failures triggered secondary overload failures, ultimately affecting 30% of the network. Monitoring strategies must anticipate these cascades rather than merely react to initial failures.
In terms of model solving, both PMU and instrument transformer optimal deployment belong to multi-objective mixed-integer nonlinear programming problems. Evolutionary algorithms have demonstrated excellent performance in solving such problems and have gained considerable attention from researchers. Reference [10] developed a multi-strategy enhanced multi-objective dung beetle optimizer (MSMDBO) for microgrid optimization, aiming to minimize three critical operational cost indices. However, this approach still faces challenges including the curse of dimensionality and high computational complexity when handling multiple conflicting objectives, while struggling to maintain the balance between convergence and diversity. Focusing on dynamic multi-objective optimization problems, Reference [11] proposed a hybrid response dynamic multi-objective optimization algorithm (HRDMOA) that dynamically adjusts the weights of different response strategies based on a multi-armed bandit model. Nevertheless, its real-time response capability remains insufficient when dealing with dynamic environmental changes. To address the complex multi-objective optimal scheduling in microgrids, Reference [12] introduced a novel metaheuristic multi-objective optimization algorithm, employing a multi-objective war strategy optimization (MOWSO) approach to avoid solution concentration and expand the selection range of final solutions. However, complex constraints and highly nonlinear objective spaces significantly increase the solving difficulty. Reference [13] presented a multi-objective crested porcupine optimizer (MOCPO), which effectively manages conflicting objective functions in multi-objective optimization problems. By incorporating non-dominated sorting and crowding distance mechanisms, it enhances solution diversity and convergence toward the Pareto front. Yet, when dealing with irregular or deceptive objective spaces, maintaining a balance among diversity, convergence, and computational efficiency remains challenging.
In summary, to address the aforementioned critical challenges while building upon previous research achievements [14,15,16], this paper proposes a disaster-resilient metering device deployment strategy integrating time-varying risk assessment and multi-objective optimization. The main research contributions are summarized as follows:
- (1)
- Time-Varying Risk Assessment Model: A comprehensive model is established to evaluate the synergistic effects of cascading failures during disaster propagation and dynamic load fluctuations. By integrating topological betweenness centrality with dynamic load weighting, the model quantifies the real-time node importance throughout disaster evolution processes.
- (2)
- Multi-Objective Optimization Framework for Disaster-Resilient Deployment: An optimization model is formulated with dual core objectives: minimizing metering device deployment costs while maximizing network topology observability. The model dynamically incorporates communication latency, inspection path efficiency, and data processing capability through a quantifiable response-time model, while strictly adhering to budget constraints, critical node coverage requirements, and full network observability conditions.
- (3)
- Genetic-Greedy Hybrid Algorithm (GGHA): A novel hybrid optimization algorithm is proposed, effectively combining the global search capability of Genetic Algorithms (GA) with the local optimization efficiency of Greedy Algorithms (GD). Enhanced by an elite retention strategy, the GGHA significantly improves solution efficiency and convergence performance for large-scale distribution network deployment problems, overcoming the computational bottlenecks inherent in traditional single-algorithm approaches.
2. Construction of Time-Varying Risk Assessment Model for Power Nodes
The low-voltage instrument transformers (LVITs) investigated in this study are specifically designed for 4.16 kV distribution network applications, targeting secondary distribution systems where both operational monitoring and revenue metering accuracy are critical.
It is necessary to clarify the distinction between the LVITs examined in this work and the instrument transformers associated with Phasor Measurement Units (PMUs) reviewed in Section 1, as these serve fundamentally different functions within power systems. PMU-associated instrument transformers are voltage and current sensors deployed at transmission substations (typically 110 kV and above) to provide high-precision analog signals for synchrophasor measurements. These devices are integral components of the PMU measurement chain and focus on capturing system dynamics for wide-area stability monitoring.
In contrast, the LVITs studied here operate at the 4.16 kV distribution level as standalone revenue-grade metering devices. Their primary functions are billing accuracy, steady-state load monitoring, and fault detection in secondary distribution networks. Critically, distribution network topology allows a single LVIT to provide monitoring coverage for multiple adjacent nodes through power flow inference—a property formalized later in the full node coverage constraint (Equation (14)). This characteristic creates the optimization problem addressed in this paper: under post-disaster budget constraints, which nodes should receive direct instrumentation to maximize network observability when complete coverage is economically infeasible? The time-varying risk assessment framework developed in the following subsections quantifies node criticality dynamics during disaster propagation to inform this deployment strategy.
This section establishes a comprehensive flood risk evaluation framework through three key methodological innovations: First, we define flood severity classification criteria by integrating historical disaster data with meteorological, geological, and drainage capacity parameters. Second, we analytically derive the correlation mapping between flood severity levels and node failure probabilities. Finally, we propose a novel time-dependent node criticality assessment model that synthetically incorporates both topological importance and disaster propagation dynamics. The proposed model quantitatively evaluates the time-evolving vulnerability levels of power nodes during flood events, thereby establishing a theoretical foundation for dynamic instrument transformer deployment strategies.
2.1. Flood Disaster Intensity Classification
These quantitative mappings transform abstract flood predictions into actionable deployment parameters, ensuring the optimization framework reflects realistic disaster physics rather than static assumptions.
Based on nationwide historical flood disaster data, we develop a dynamic water depth prediction model that systematically incorporates three critical external factors: (1) regional topographic variations (slope gradient, elevation differences), (2) drainage system capacity (pump station performance, pipe network density), and (3) annual precipitation characteristics (intensity-duration-frequency relationships). The model formulation is expressed as:
where represents the water accumulation depth at node at time t; denotes the initial water depth; is the rainfall intensity function; and indicates the drainage rate of the region, represents the integration variable for time, .
The rainfall intensity in this study is characterized using the Chicago Design Storm (CDS) model:
In the equation, parameters , , and represent rainfall pattern characteristics, represents the time elapsed since the storm onset, which are determined based on historical meteorological data from the specific region.
Therefore, using historical meteorological data from Henan Province as a case study, the classification criteria for flood disaster severity levels are presented in Table 1.

Table 1.
Classification of Flood Disaster Severity Levels.
Under the assumption that all distribution network nodes experience identical water depths during disasters, we establish a mapping relationship between disaster intensity and equipment failure probability. The failure probability of node i can be expressed as:
where represents the fitting coefficient, typically set to 1.5, k = 1.5 is chosen based on empirical analysis of equipment failure data from the 2021 Henan floods, where this value provides the best fit (R2 = 0.89) to observed failure patterns.
The flood disaster intensity classification framework established in this section serves two critical functions in the subsequent IT deployment optimization:
Linkage to Equipment Failure Probability (Equation (3)): Water depth predictions from Equation (1) directly parameterize the logistic failure model, enabling cost–benefit analysis that prioritizes deployment at nodes with optimal survivability–criticality trade-offs.
Real-Time Criticality Assessment (Equation (8)): The time-varying water depth drives the dynamic load redistribution model (Equations (6) and (7)), which updates node importance metrics throughout disaster progression. This temporal evolution enables adaptive monitoring strategies that respond to shifting network vulnerability patterns.
2.2. Time-Varying Risk Assessment Model
Under extreme weather events such as floods, power distribution networks exhibit complex dynamic vulnerability characteristics. Conventional static vulnerability assessment methods fail to accurately capture the spatiotemporal evolution of node criticality in power systems. Therefore, we first define a comprehensive node importance metric by integrating both topological structure and functional attributes of the distribution network:
where represents the load weight of node , and are weighting coefficients (typically = 0.6, = 0.4), and denotes the betweenness centrality of node .
In Equation (4), can be further expressed as:
In the equation, represents the total number of shortest paths between nodes s and t, while denotes the number of these shortest paths that pass through node .
Natural disasters such as floods typically trigger cascading effects, including substation outages that lead to load transfers. Consequently, it is essential to develop: (1) a dynamic nodal load model during disaster events, and (2) a nodal overload failure model caused by load variations across network nodes.
(1) Nodal Dynamic Load Model
Let time point 0 represent the moment of disaster occurrence, using the node’s baseline load under normal operating conditions as the initial value for parameter . When node failures are caused by the disaster, their original loads must be transferred to adjacent nodes. Specifically, if node i fails due to the disaster, its load will be reallocated according to the admittance-based weight distribution principle of the grid topology.
In the formulation, represents the set of failed nodes; denotes the line admittance between node i and node j; and indicates the neighbor set of node i.
(2) Dynamic Update Mechanism
For each surviving node j, calculate its line load ration:
where represents the maximum load capacity of the node. If node fails, when the load ratio of its adjacent lines exceeds 90% of the threshold, downstream node overload failure is triggered.
(3) Dynamic Update of Node Importance Metrics
Due to the failure of some nodes in disaster scenarios, the importance metrics of each surviving node need to be recalculated. The formula for dynamically updating node importance metrics is as follows:
where represents the initial importance metric of each node; denotes the baseline load of node i; and is set to 0.3.
3. Multi-Objective Optimal Deployment Model for Instrument Transformers
This section proposes a multi-objective optimization model for flood-resilient instrument transformer deployment, based on the time-varying risk assessment model of nodes, while comprehensively considering factors such as deployment cost and fault coverage rate. A genetic-greedy hybrid algorithm is designed to achieve a precise and efficient solution for the model.
3.1. Establishment of the Multi-Objective Optimization Model
3.1.1. Objective Function Design
(1) Minimization of Deployment Costs
Assuming there are N nodes in the target distribution network, considering node failure issues in disaster scenarios, the node failure probability from Equation (3) is incorporated into the cost function. Optimization prioritizes nodes with lower failure probabilities, and the deployment cost objective function can be expressed as:
In the formulation, indicates whether node has a metering device deployed, ; represents the equipment and operational maintenance cost of node .
(2) Maximization of Fault Coverage Rate
When a measuring device is deployed at node , it can monitor both itself and adjacent nodes. Combined with the node importance metric function in Equation (4), the maximization of fault coverage rate for the target distribution network can be expressed as:
where is an indicator function, which can be expressed as:
In the formulation, indicates whether node has an instrument transformer deployed.
3.1.2. Constraint Condition Design
(1) Budget Constraint for Instrument Transformer Deployment
In practical engineering applications, there is typically a maximum project budget, and the total cost of instrument transformer deployment must be controlled below this budget threshold.
where represents the budget for instrument transformer deployment.
(2) Critical Node Coverage Constraint
In the entire distribution network system, there exist several critical nodes. The node importance evaluation metric is determined by Equation (4). Based on historical data, when node exceeds 0.7, it can be identified as a critical node.
The system must cover all nodes whose importance exceeds the threshold of 0.7 at any time during disaster propagation.
(3) Full Node Coverage Constraint
To ensure complete coverage where every node in the network is monitored either directly or indirectly, the following condition must be satisfied: Node itself must have a measuring device deployed, or at least one of its neighboring nodes must be equipped with an instrument transformer.
3.2. Enhanced GGHA
To address the limitations of traditional optimization algorithms—including poor global search capability, susceptibility to local optima, and low solution accuracy—this paper proposes a hybrid algorithm that integrates the global search ability of genetic algorithms with the local optimization strategy of greedy algorithms. The proposed method incorporates an importance-based intelligent initialization strategy and an elite retention mechanism to ensure rapid convergence during the solution process, ultimately obtaining the optimal instrument transformer deployment scheme.
Step 1: Node Importance-Based Population Initialization Strategy
Traditional genetic algorithms typically select initial population individuals through random principles, which can easily generate low-quality initial solutions and negatively impact the algorithm’s solving speed and accuracy. Therefore, this paper proposes a node importance-based population initialization strategy, where locations with higher node importance have a greater probability of being selected for instrument transformer deployment, while retaining a degree of randomness to maintain population diversity and global search capability. The probability of selecting node during population initialization is:
In the formulation, represents the random selection probability to maintain population diversity; and denote the dynamic importance metrics of nodes i and , respectively; and is the importance guidance coefficient, where corresponds to purely random initialization, and indicates fully importance-based deterministic initialization.
Step 2: Fitness Function Construction
Integrating the deployment cost minimization objective in Equation (12) and the fault coverage maximization objective in Equation (13), a multi-objective optimization fitness function is designed to evaluate the performance of each individual. The expression of the multi-objective optimization fitness function is shown in the following equation:
Step 3: Genetic Operations
In the genetic algorithm parameter configuration, simulated binary crossover (SBX) and polynomial mutation operators are employed for genetic operations. The crossover probability is set to 0.8, while the mutation probability is defined as 1/N (where N represents the chromosome length).
Step 4: Greedy Local Optimization
The greedy algorithm typically considers only locally optimal solutions during the solving process. To enhance the local search capability of the genetic algorithm in our approach, we introduce a greedy local optimization algorithm to refine the optimal solution set of each generation. This algorithm iterates through undeployed nodes, calculates the ratio between newly observable nodes and instrument transformer costs for each candidate node, and prioritizes deployment of nodes with the highest ratios until the budget is exhausted.
In the equation, represents the change value of system fault coverage rate when deploying an instrument transformer at node ; represents the effective probability of node . The node with the highest value is selected to join the deployment scheme, balancing coverage improvement and disaster prevention cost.
Step 5: Elite Retention Strategy
To prevent the loss of optimal individual solutions during the solving process, this paper introduces an elite retention strategy. The approach combines parent and offspring populations for non-dominated sorting, retains the top 50% individuals with highest fitness values, and replicates them to the next generation population with a probability of 1 through iterative operations.
Step 6: Iteration Termination
The iterative process terminates when the solution set’s improvement rate remains below 1% for five consecutive generations.
4. Case Study Analysis
4.1. Data Preparation
The proposed methodology was implemented in MATLAB R2021b on Intel i7-10700K with 32GB RAM. For each disaster level, 500 Monte Carlo simulations generated node failure scenarios using the logistic failure model, with the GGHA executed 30 independent times per scenario. Key limitations include: (1) instantaneous disaster modeling ignoring gradual development, (2) uniform spatial assumptions neglecting heterogeneity, (3) equipment standardization overlooking age/manufacturer variations, and (4) constant load patterns during disasters.
This paper validates the effectiveness of the proposed hybrid algorithm in flood disaster scenarios using the IEEE 123-node test system. A comparative analysis is conducted on deployment costs, fault coverage rates, and dynamic response performance under different disaster severity levels and budget constraints. The configuration of the IEEE 123-node system is presented in Table 2.

Table 2.
Basic Parameters of the IEEE 123-Node Test System.
This study considers extreme disaster scenarios, addressing different levels of flood disasters based on their maximum precipitation. Specifically, for Level 1 disasters corresponding to a water depth of 0.5 m, the node failure probability obtained from Equation (3) is 18.243%; for Level 2 with water depth of 1m, the node failure probability is 26.894%; for Level 3 with water depth of 1.5 m, the node failure probability is 37.754%; and for Level 4 assuming water depth of 2 m, the node failure probability is 50%.
Regarding the simulation of initial failed nodes, this paper employs the Monte Carlo method to determine node failure status. For each node , a random number is generated. is compared with the node failure probability function under different disaster scenarios. If , node is determined to have failed, and the set of failed nodes can be denoted as:
4.2. Performance Analysis of the GGHA
To verify the solving capability of the proposed GGHA, five benchmark test functions were selected, including two unimodal functions (F1–F2) and two multimodal functions (F3–F4), as specified in Table 3. Comparative evaluations were conducted against three classical algorithms: Genetic Algorithm (GA), Greedy Algorithm (GDA), and Particle Swarm Optimization (PSO), demonstrating GGHA’s performance across different types of function optimization problems.

Table 3.
Specifications of the Benchmark Functions.
To ensure fairness, all algorithms were configured with a population size of 100 and a maximum iteration count of 200. The parameter settings were as follows: GA: crossover probability Pc = 0.8, mutation probability Pm = 0.01 [17]; GDA: randomization parameter [18]; PSO: learning factors c1 = c2 = 1.495, random numbers r1 = r2 = 0.5 [19]. The GGHA parameters were kept consistent with those of GA and GDA.
The convergence results of the test functions are shown in Figure 1. The results demonstrate that PSO, GA, and GDA all exhibited premature convergence during the optimization process, particularly when dealing with complex multimodal functions. In contrast, the proposed GGHA effectively escaped local optima. For instance, when trapped in local optima while solving function F4, GGHA rapidly escaped due to its integration of the greedy algorithm, which enables quick identification of local optima within specific regions. Through elite retention strategy comparisons with the original optimal solutions, GGHA efficiently breaks free from local optimal ranges, yielding results with superior global observability. Consequently, employing the GGHA for objective function optimization produces solutions with higher accuracy and feasibility.
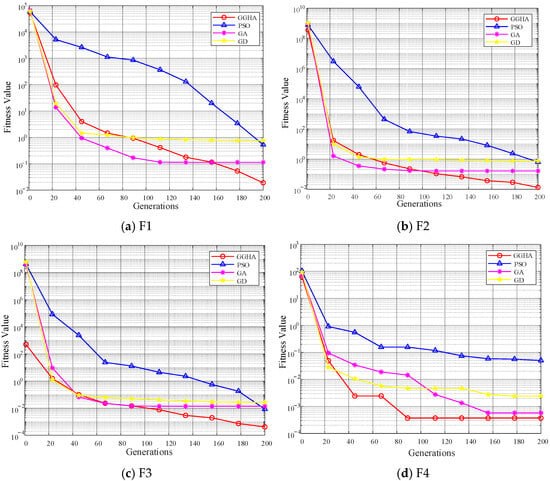
Figure 1.
Convergence Performance Comparison of Different Algorithms on Benchmark Functions.
To rigorously validate the robustness and solution precision of the proposed algorithm in multi-objective constrained optimization, we conducted comprehensive comparative experiments across four distinct flood severity levels (I–IV). The fitness function was parameterized with weight coefficients (=1, =1000), budget constraint M = ¥100k (comprising RMB 80k for EVT deployment and RMB 20k for maintenance), and disaster loss threshold G = RMB 10M.
Figure 2 presents the convergence comparison between the proposed GA-GDA and three classical optimization algorithms across four disaster severity levels. The results demonstrate that GA-GDA maintains stable objective function values with fluctuations constrained within ±2.5% under all disaster scenarios, confirming its robust performance in complex constrained optimization. As further evidenced in Table 4, GA-GDA achieves a solution quality of 0.847, representing 7.5%, 11.7%, and 8.7% improvements over PSO, GA, and GD, respectively. These findings validate the effectiveness of the hybrid strategy. Compared to conventional algorithms, the proposed method achieves superior balance among three optimization objectives: cost-efficiency (economic), monitoring effectiveness, and response timeliness, thereby mitigating the bias inherent in single-objective optimization approaches.
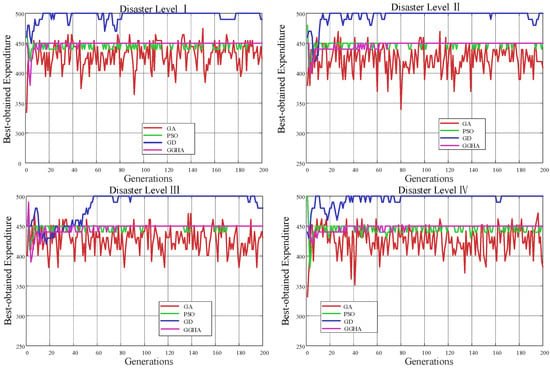
Figure 2.
Convergence Performance Comparison of Different Algorithms Across Four Disaster Severity Levels.

Table 4.
Performance Comparison of Different Algorithms.
4.3. Optimal Instrument Transformer Deployment Analysis
To thoroughly evaluate the adaptability and robustness of the proposed time-varying risk assessment-based optimal deployment model under varying disaster intensities, comparative analyses were performed across four flood disaster severity levels, with results presented in Figure 3.
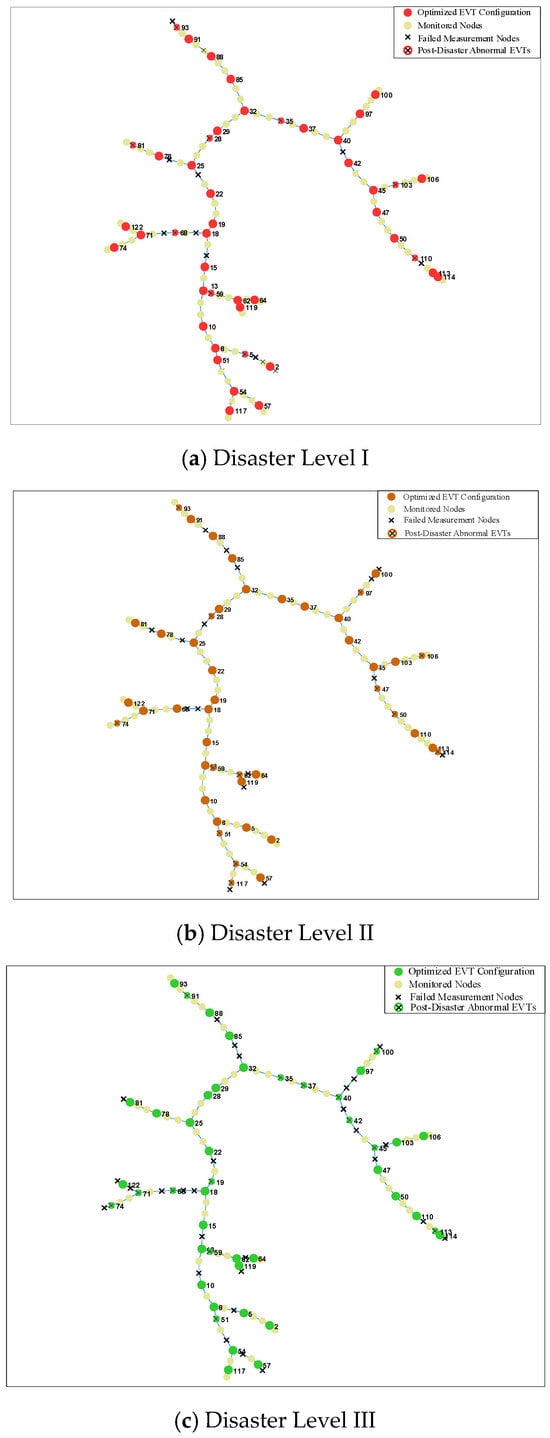
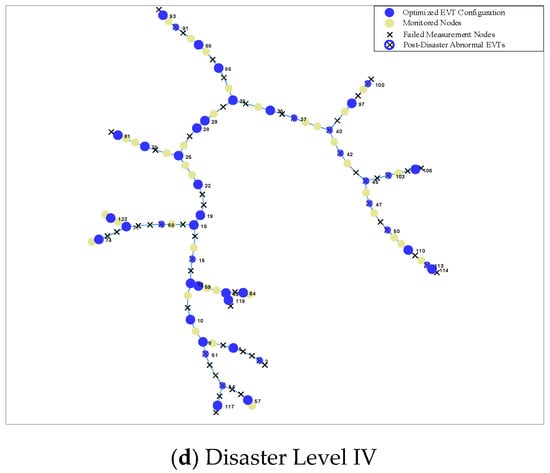
Figure 3.
Optimal LVIT deployment topology under varying disaster severity levels on IEEE 123-node system.
As shown in Figure 3, all four disaster scenarios demonstrate a distinct “core-edge” deployment pattern for EVTs: dense monitoring networks are formed at critical topological nodes and major feeder convergence points, while sparse configurations are implemented for less important end-nodes with lighter loads. However, as disaster severity increases, the deployment focus gradually shifts toward nodes with higher elevations and stronger structural importance. Under Level I disaster conditions (Figure 3a), the algorithm preferentially deploys more monitoring devices near load centers to ensure comprehensive situational awareness during normal operations. In contrast, under Level IV disaster conditions (Figure 3d), EVT configurations become significantly concentrated in high-elevation nodes, demonstrating the algorithm’s intelligent recognition and adaptation to disaster risk propagation characteristics.
To intuitively demonstrate the capability of the proposed deployment strategy in meeting extensive measurement requirements across varying disaster levels, a statistical analysis of the aforementioned simulation results was conducted. The summarized outcomes are presented in Table 5. As indicated in the table, the normal coverage rate remains consistently at 100% under all disaster scenarios, confirming that the proposed configuration strategy ensures comprehensive monitoring of critical nodes during disaster-free conditions. Furthermore, the disaster coverage rate is maintained above 78.7%, implying that measurements can still be obtained from over 78.7% of the nodes even after the occurrence of a disaster. These findings validate the robustness of the algorithm in fulfilling fundamental monitoring requirements and provide substantial support for the daily operational maintenance of distribution networks.

Table 5.
Optimization Results under Multi-Severity Disasters.
4.4. Universality Analysis
To validate the universality of the proposed method, the optimal deployment locations under both disaster-free and four different disaster levels were calculated based on the IEEE 33-node system, verifying the stability and effectiveness of the algorithm across varying network topologies and stochastic disaster scenarios.
Figure 4 illustrates the optimal allocation and deployment of sensors using the proposed algorithm under four disaster levels. When the disaster level increases to Level 3, the layout of EVTs also exhibits a trend of clustering toward the main branches, enhancing system robustness by increasing redundant configuration at critical nodes. Further analysis of pre-disaster and post-disaster coverage rates is presented in Table 6. The results indicate a nonlinear impact of disaster levels on coverage: as the disaster level escalates, the disaster coverage rate decreases from 92.5% to 73.3%, a drop of 19.2%. This is because the decline in coverage remains gradual at lower disaster levels but becomes abrupt under higher disaster conditions. The significantly increased probability of node failures under severe disasters triggers cascading failures, leading to the loss of some critical observation nodes and disrupting the observability structure of the network.
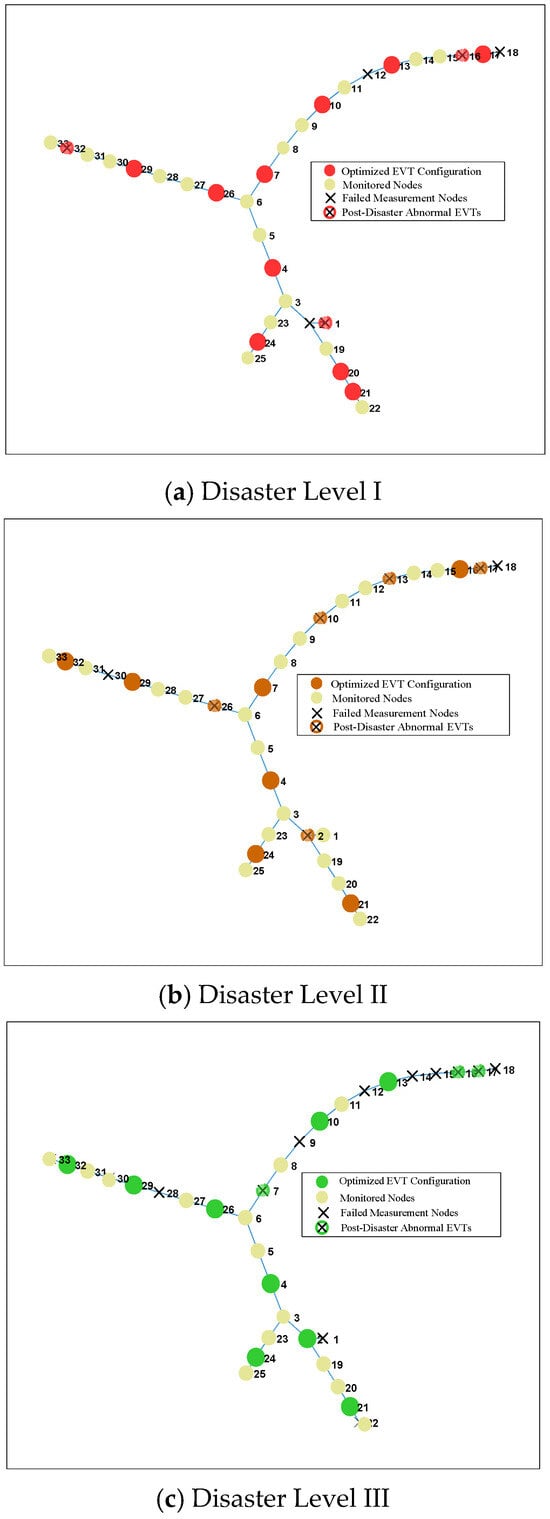
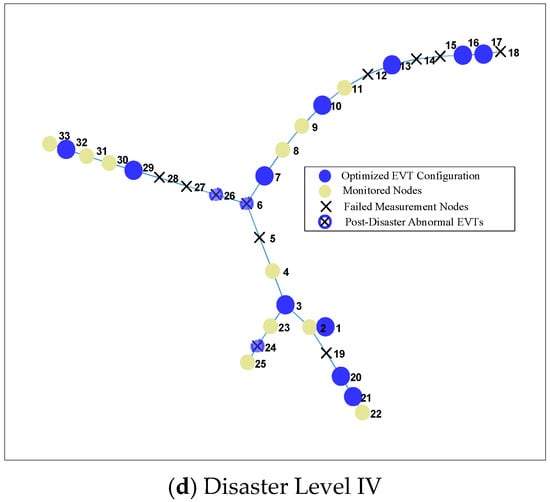
Figure 4.
Optimal LVIT deployment topology under varying disaster severity levels on IEEE 33-node system.

Table 6.
Optimization Outcomes for Multi-Level Disasters on the IEEE 33-Bus System.
In summary, the proposed strategy can maintain a disaster coverage rate greater than 70% under low to medium disaster levels, meeting the requirements for rapid power restoration. However, under extreme Level IV disasters, the coverage rate drops substantially, necessitating the integration of dynamic emergency monitoring measures to ensure the security of the distribution network.
5. Conclusions
Facing the dynamic monitoring challenges of sensor metering in flood disaster scenarios, this paper proposes an optimal deployment strategy for low-voltage sensors based on time-varying risk assessment. The main contributions and conclusions are as follows:
- (1)
- A time-varying risk assessment model is established, which quantifies the mapping relationship between water depth and node failure probability using a logistic function. It innovatively introduces a disaster cascade failure mechanism and combines topological betweenness centrality with real-time load weights to achieve a dynamically updated node criticality index.
- (2)
- A multi-objective deployment optimization model is constructed, focusing on minimizing deployment costs and maximizing fault coverage rate. The model incorporates dynamic response constraints such as communication delay and inspection routes, while strictly enforcing budget limitations, full coverage of critical nodes, and observability of all network nodes, thereby achieving robust configuration of disaster preparedness resources.
- (3)
- An efficient hybrid solution algorithm is designed, combining a genetic algorithm with a greedy strategy to leverage the global search capability of the former and the local optimization efficiency of the latter. Simulation results demonstrate the strong global and local search abilities of the proposed algorithm. Tests on multi-level disaster scenarios using the IEEE 123-node system and IEEE 33-node system show that the proposed strategy maintains high fault coverage rates under Level I–IV disasters, meeting the requirements for rapid power restoration in low to medium-intensity disasters. Future work will integrate artificial intelligence technologies to further enhance the real-time prediction capability of dynamic response constraints.
Author Contributions
Conceptualization, Y.D. and J.F.; Methodology, Y.D. and J.F.; Software: All experiments in this study were implemented in the Matlab 2023b environment, K.H.; Validation, K.H.; Formal analysis, Y.D.; Investigation, K.H., L.Y. and Q.Y.; Resources, L.Y. and Q.Y.; Data curation, L.Y. and Q.Y.; Writing—original draft, Y.D.; Writing—review & editing, J.F.; Visualization, Y.D.; Supervision, J.F.; Project administration, J.F. All authors have read and agreed to the published version of the manuscript.
Funding
This work was supported by State Grid Corporation Science and Technology Project (5700-202424272A-1-1-ZN) “Research on Disaster Backup Metering Devices, Field Calibration, and Emergency Sensing Technologies for Flood and Other Natural Disasters.”
Data Availability Statement
Data are contained within the article.
Conflicts of Interest
Author Y.D., J.F. and K.H. were employed by the company China Electric Power Research Institute Co., Ltd. Author L.Y. and Q.Y. were employed by the company State Grid Henan Electric Power Company, Marketing Service Center of State Grid Henan Electric Power Company. The remaining authors declare that the research was conducted in the absence of any commercial or financial relationships that could be construed as a potential conflict of interest.
References
- Zadehbagheri, M.; Dehghan, M.; Kiani, M.; Pirouzi, S. Resiliency-constrained placement and sizing of virtual power plants in distribution networks considering extreme weather events. Electr. Eng. 2024, 107, 2089–2105. [Google Scholar] [CrossRef]
- Chauhan, S.; Dahiya, R. Multiple μPMU placement solutions in active distribution networks using nonlinear programming approach. Int. Trans. Electr. Energy Syst. 2021, 31, e13116. [Google Scholar] [CrossRef]
- Cao, B.; Yan, Y.; Wang, Y.; Liu, X.; Lin, J.C.-W.; Sangaiah, A.K.; Lv, Z. A Multiobjective Intelligent Decision-Making Method for Multistage Placement of PMU in Power Grid Enterprises. IEEE Trans. Ind. Inform. 2023, 19, 7636–7644. [Google Scholar] [CrossRef]
- Hu, Z.; Su, R.; Veerasamy, V.; Huang, L.; Ma, R. Resilient Frequency Regulation for Microgrids Under Phasor Measurement Unit Faults and Communication Intermittency. IEEE Trans. Ind. Inform. 2025, 21, 1941–1949. [Google Scholar] [CrossRef]
- von Meier, A.; Stewart, E.; McEachern, A.; Andersen, M.; Mehrmanesh, L. Precision Micro-Synchrophasors for Distribution Systems: A Summary of Applications. IEEE Trans. Smart Grid 2017, 8, 2926–2936. [Google Scholar] [CrossRef]
- Li, X.; Scaglione, A.; Chang, T.H. A Framework for Phasor Measurement Placement in Hybrid State Estimation Via Gauss-Newton. IEEE Trans. Power Syst. 2014, 29, 824–832. [Google Scholar]
- Lei, X.; Li, Z.; Jiang, H.; Yu, S.S.; Chen, Y.; Liu, B.; Shi, P. Deep-learning based optimal PMU placement and fault classification for power system. Expert Syst. Appl. 2025, 292, 128586. [Google Scholar] [CrossRef]
- Mandal, A.K.; De, S. Joint Optimal PMU Placement and Data Pruning for Resource Efficient Smart Grid Monitoring. IEEE Trans. Power Syst. 2024, 39, 5382–5392. [Google Scholar] [CrossRef]
- Jian, J.; Zhao, J.; Ji, H.; Bai, L.; Xu, J.; Li, P.; Wu, J.; Wang, C. Supply Restoration of Data Centers in Flexible Distribution Networks With Spatial-Temporal Regulation. IEEE Trans. Smart Grid 2024, 15, 340–354. [Google Scholar]
- Zhao, G.; Tan, Y.; Pan, Z.; Guo, H.; Tian, A. Multi-objective optimal scheduling of microgrid considering pumped storage and demand response. Electr. Power Syst. Res. 2025, 247, 111837. [Google Scholar] [CrossRef]
- Hu, X.; Wu, L.; Han, M.; Zhao, X.; Sang, X. Hybrid response dynamic multi-objective optimization algorithm based on multi-armed bandit model. Inf. Sci. 2025, 681, 121192. [Google Scholar]
- He, Y.-L.; Wu, X.-W.; Sun, K.; Liu, X.-Y.; Wang, H.-P.; Zeng, S.-M.; Zhang, Y. A novel MOWSO algorithm for microgrid multi-objective optimal dispatch. Electr. Power Syst. Res. 2024, 232, 110374. [Google Scholar] [CrossRef]
- Adalja, D.; Patel, P.; Mashru, N.; Jangir, P.; Jangid, R.; Gulothungan, G.; Khishe, M. A new multi-objective crested porcupine optimization algorithm for solving optimization problems. Sci. Rep. 2025, 15, 14380. [Google Scholar] [CrossRef] [PubMed]
- Sun, S.; Yu, P.; Xing, J.; Wang, Y.; Yang, S. Multi-objective collaborative optimization of active distribution network operation based on improved particle swarm optimization algorithm. Sci. Rep. 2025, 15, 8999. [Google Scholar] [CrossRef] [PubMed]
- Wang, Z.; Pei, Y.; Li, J. A comprehensive analysis on enhancing multi-objective evolutionary algorithms using chaotic dynamics and dominance relationship-based search strategies. IEEE Access 2024, 13, 33455–33470. [Google Scholar]
- Xu, X.-F.; Wang, K.; Ma, W.-H.; Wu, C.-L.; Huang, X.-R.; Ma, Z.-X.; Li, Z.-H. Multi-objective particle swarm optimization algorithm based on multi-strategy improvement for hybrid energy storage optimization configuration. Renew. Energy 2024, 223, 120086. [Google Scholar]
- Meng, L.L.; Cheng, W.Y.; Zhang, B.; Zou, W.Q.; Fang, W.K.; Duan, P. An Improved Genetic Algorithm for Solving the Multi-AGV Flexible Job Shop Scheduling Problem. Sensors 2023, 23, 3815. [Google Scholar] [CrossRef] [PubMed]
- Lu, C.; Liu, Q.; Zhang, B.; Yin, L. A Pareto-based hybrid iterated greedy algorithm for energy-efficient scheduling of distributed hybrid flowshop. Expert Syst. Appl. 2022, 204, 117555. [Google Scholar]
- Sheng, L.; Li, H.; Qi, Y.C.; Shi, M.H. Real Time Screening and Trajectory Optimization of UAVs in Cluster Based on Improved Particle Swarm Optimization Algorithm. IEEE Access. 2023, 11, 81838–81851. [Google Scholar] [CrossRef]
Disclaimer/Publisher’s Note: The statements, opinions and data contained in all publications are solely those of the individual author(s) and contributor(s) and not of MDPI and/or the editor(s). MDPI and/or the editor(s) disclaim responsibility for any injury to people or property resulting from any ideas, methods, instructions or products referred to in the content. |
© 2025 by the authors. Licensee MDPI, Basel, Switzerland. This article is an open access article distributed under the terms and conditions of the Creative Commons Attribution (CC BY) license (https://creativecommons.org/licenses/by/4.0/).