Abstract
The increasing digitalization of energy infrastructures, particularly electric vehicle (EV) charging systems, has expanded their vulnerability to cyber threats. This paper presents a modular AI-driven platform for detecting attacks on EV charging infrastructures. The platform combines real-time data collection tools (Tshark, Nozomi Guardian, SNMP/Syslog, Elasticsearch Logstash and Kibana (ELK)) with Long Short-Term Memory (LSTM) Autoencoder-based anomaly detection. Data were gathered from a charging facility at RSE with twelve OCPP-J v1.6 charging stations, including normal and simulated Denial of Service (DoS) scenarios. The model, trained on multivariate time-series traffic data, achieved 97.1% Accuracy and 98.6% Recall, ensuring robust anomaly detection and minimizing false negatives. Although Precision was lower (52%) due to traffic variability, the system effectively detected both cyber-induced and operational anomalies, such as station disconnections. This work demonstrates the value of integrating deep learning with real-time monitoring to enhance the resilience of smart energy systems. Future developments will focus on improving precision, expanding protocol coverage, and addressing advanced threats such as data injection and Man-in-the-Middle attacks.
1. Introduction and Related Work
In recent years, the energy sector has undergone a significant transformation. Traditional power grids, once based on a linear “producer-consumer” model, are evolving into more dynamic and distributed systems where users can act as both consumers and producers of energy. This shift, driven by the proliferation of renewable sources, electrification of demand and smart technologies, has significantly increased the complexity of managing energy flows. Seamless connectivity between energy devices and control systems has become essential to ensure operational efficiency and system resilience.
However, this evolution also expanded the cyberattack surface. Modern energy infrastructures, particularly electric vehicle (EV) charging networks, are now among the most sensitive targets for cyber threats. These systems bridge the physical and digital domains, making them vulnerable to a wide range of attacks, from denial-of-service (DoS) and data injection to manipulation of charging behavior and malware propagation. The potential consequences include service disruption, data breaches, and even destabilization of the broader power grid.
To address these emerging risks, the European Union has introduced a series of cybersecurity regulations and directives. Foremost among them is the Network and Information Systems (NIS2, EU 2022/2555), which came into force in 2023. It updates the original NIS directive from 2016 and expands the cybersecurity obligations for operators of critical infrastructure, including renewable energy facilities and EV charging networks. Article 21 mandates that essential and important entities implement proportionate technical, operational, and organizational measures based on their risk exposure, size, and the potential societal and economic impact of incidents.
Complementing this regulatory framework is the ISA/IEC 62443 standard [1], which emphasizes timely incident response (Functional Requirement (FR) 6) and provides foundational guidance for securing industrial automation and control systems.
Within this context, advanced tools are essential to support cybersecurity analysts in identifying and responding to threats. Automated systems can assist in risk assessment and strategy formulation, enabling early detection of adversarial activity across the cyber kill chain. To meet this need, we have developed a modular platform that supports analysts during both design and operational phases. It offers methodological and practical assistance for risk evaluation—whether planning countermeasure deployment or monitoring live systems for early signs of attack. By enabling timely threat detection and informed response strategies, the platform contributes to safeguarding the resilience and functionality of smart energy infrastructures.
Recent research has explored complementary approaches using artificial intelligence (AI) and machine learning (ML) for cyber-attack detection in energy systems.
Dogaru et al. [2] applied deep neural networks to detect false data injection attacks in power grids by learning normal behavior and identifying anomalies. Jacob et al. [3] introduced a topological machine learning model for Distribution System Operators (DSOs), leveraging persistent homology and spatio-temporal graph learning to detect charging manipulation attacks (CMAs). Their approach uses voltage and power flow data to identify compromised stations, offering a scalable and real-time solution.
Tanyıldız et al. [4] proposed a hybrid framework based on Generative Adversarial Networks (GANs), integrating Long Short-Term Memory (LSTM), Gated Recurrent Unit (GRU), and Convolutional Neural Network (CNN) models to estimate the Remaining Useful Life (RUL) of EV charging systems under cyberattack scenarios.
Girdhar et al. [5], explored stochastic anomaly detection through a post-event forensic framework based on the 5Ws & 1H methodology, emphasizing the importance of probabilistic models in complex cyber-physical environments. Unlike their forensic focus, our platform aims to prevent attacks through real-time monitoring and proactive detection.
Makhmudov et al. [6] developed an online intrusion detection system using Adaptive Random Forest classifiers with Adaptive Windowing drift, trained on the CIC EV Charger Attack Dataset 2024 (CICEVSE2024) [7]. Other studies also utilize this dataset, though many rely on simulated environments that may not reflect realistic behaviors. Moreover, most approaches focus on flow-level indicators and overlook packet-level granularity. Also [8] introduces a novel ML model for cyber-attack detection utilizing the CICEVSE2024 dataset. The study addresses emerging cybersecurity challenges in Electric Vehicle Supply Equipment (EVSE) by leveraging a comprehensive dataset that captures both benign and malicious activities—including Reconnaissance, Backdoor, Cryptojacking, and Denial of Service (DoS) attacks. Two detection models are proposed: the Host Anomaly Detection Model (HADM) and the Power Anomaly Detection Model (PADM), both employing machine learning algorithms to classify attack scenarios with high accuracy. This work highlights the potential of ML-based approaches to enhance the resilience of Electric Vehicle Supply Equipment (EVSE) (systems within clean energy transportation infrastructures).
However, several approaches rely on publicly available datasets, which can be useful when real infrastructure is not accessible. Additionally, most of them focus on a limited set of ICT indicators based on aggregated flow data rather than detailed packet-level analysis. Nonetheless, many existing studies, including [8,9], predominantly utilize flow-level indicators and may still overlook the benefits of packet-level analysis. Our platform, instead, leverages real-time traffic and packet-oriented indicators collected from an actual EV charging infrastructure.
The article is structured as follows: Section 2 presents an overview of the data collection and analysis platform, Section 3 introduces the EV charging infrastructure facility used for the validation of the analysis platform, Section 4 highlights the data collection, Section 5 presents normal and anomalous scenarios, Section 6 introduces AI Long Shor-Term Memory (LSTM) Autoencoder detection models and reports the analysis and the results of the model validation with the testbed datasets, and Section 7 provides some conclusions.
2. Data Collection and Analysis Platform
The development of advanced systems capable of continuously monitoring both devices and communications within energy infrastructures is essential to ensure timely detection of suspicious activities. An effective system must not only be able to collect and process large volumes of data in real-time but also apply advanced techniques—such as machine learning-based anomaly detection—to identify abnormal behaviors.
Analyzing and detecting cyberattack processes targeting energy infrastructures requires models and tools that can accurately represent the operational context.
This article presents an advanced monitoring and analysis platform reflecting the typical phases of AI-based technologies.
Data Collection Components
The data collection platform (Figure 1) is built upon several key tools:
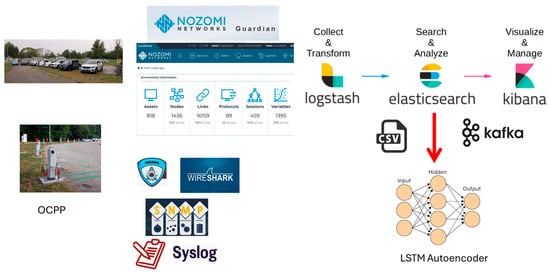
Figure 1.
Data collection and analysis platform.
- Tshark [10]: the command-line version of the Wireshark application [11], Tshark is a free and open-source tool capable of capturing network data packets and storing them in a decoded format. The installed version is 2.6.8. Within the platform, Tshark is used to capture traffic packets, forward them to other modules, and save them to files (e.g., in JavaScript Object Notation (JSON) format) for further analysis.
- Nozomi Networks Guardian [12]: a cybersecurity sensor (aka probe) designed to monitor and protect industrial and OT and Internet of Things (IoT) networks from cyber threats and operational anomalies. Guardian provides full network visibility by automatically mapping all assets, connections, and communication protocols. It can operate as a passive probe, monitoring network traffic without interfering with the normal operation of industrial systems. This makes it particularly valuable in critical infrastructures, such as energy systems, where operational continuity is essential. In the platform, Guardian is queried by Logstash to retrieve indicator values.
- SNMP Agents: software components that implement the Simple Network Management Protocol (SNMP) to collect, store, and transmit information as defined in the Management Information Base (MIB) to an SNMP manager. Within the platform, these agents send data to Logstash for processing.
- Syslog Agents: software components that collect and forward significant cybersecurity-related events in syslog format. These events are sent to Logstash for further processing and integration into the monitoring pipeline.
- Elastic Logstash Kibana (ELK) Stack [13]: a powerful suite of open-source tools used for data ingestion, storage, and visualization. It consists of three main components:
- ○
- Elasticsearch: a distributed, RESTful search and analytics engine that stores and indexes data in near real-time.
- ○
- Logstash: a data processing pipeline that ingests data from multiple sources simultaneously, transforms it, and sends it to a storage backend.
- ○
- Kibana: a visualization tool that enables users to explore and analyze data through interactive dashboards, charts, and graphs.
Multiple instances of the ELK stack have been deployed, each consisting of one or more Elasticsearch nodes, a Logstash node, and a Kibana node. These nodes are distributed across several servers within the Power Control Systems—Resilience Testing (PCS-ResTest) Laboratory and a server at the IoT and Big Data Laboratory at RSE Milan headquarters. The installations are deployed both on bare metal and within Docker containers [14]. Additionally, the platform includes submodules based on OpenDistro, an open-source distribution derived from the ELK stack. Within the platform, various Logstash pipelines have been configured to properly process incoming data—whether events, measurements, or network traffic packets captured by Tshark. These pipelines extract relevant information from different sources and forward it in real-time to the Elasticsearch engine. Using Kibana, real-time dashboards and visualizations have been created to analyze the data and display selected metrics. Furthermore, specific Logstash pipelines are used to forward processed data to offline modules within the platform, such as the Autoencoder-based detection module, using Comma Separated Values (CSV)-formatted output to generate datasets. Logstash is also used to interface with the Apache Kafka module through dedicated pipelines, enabling real-time data delivery to online detection modules based on Autoencoders and Dynamic Bayesian Networks.
- Apache Kafka [15]: a distributed streaming platform that enables real-time publishing, subscribing, and storage of data streams. It is designed to handle high-throughput data flows from multiple sources and distribute them to multiple consumers. Kafka has also been deployed using Docker and integrated into the platform. The configuration includes a Zookeeper server and a Kafka broker. Kafka is connected to Logstash to receive collected data, ensuring efficient real-time data stream management. The Kafka pipeline has been configured to allow the detection model to perform real-time predictions on incoming data.
- LSTM Autoencoder: a neural network architecture designed to process sequential data by combining two key components—Autoencoders [16,17,18] and LSTM neural networks [19]. This hybrid model leverages the encoding-decoding capabilities of autoencoders and the temporal learning strengths of LSTM units, making it particularly effective for tasks such as anomaly detection in time-series data.
3. Facility: RSE EV Charging Infrastructure
The experimental EV charging infrastructure at RSE (Figure 2) includes twelve charging stations from five different manufacturers. Nine of these are locally connected via Ethernet and fiber optic cables, while the remaining three are IoT-enabled devices connected over the public Internet. All stations communicate with a central management system (Open Charge Point Protocol, OCPP, controller) using the OCPP-J v1.6 protocol, which relies on JSON over WebSocket [20]. The central system is hosted on a virtual machine within RSE’s private cloud environment, built on the OpenStack platform [21].
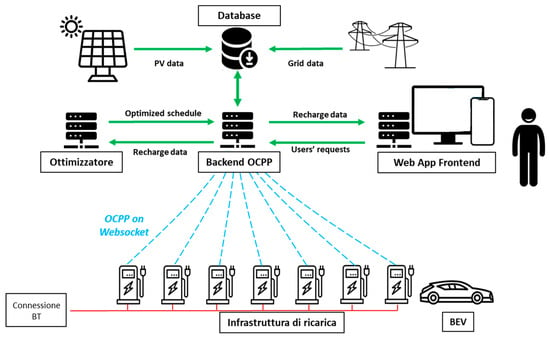
Figure 2.
EV recharging infrastructure.
The infrastructure is secured by a perimeter firewall configured for network segmentation and traffic isolation between the charge points, the cloud-based controller, and auxiliary systems. Additionally, a power quality analyzer, installed in a dedicated control cabinet, is connected via Ethernet and communicates with the private cloud using the Modbus/Transmission Control Protocol (TCP) protocol. The analyzer provides high-resolution, real-time measurements of electrical parameters such as voltage, current, total harmonic distortion (THD), and power factor, supporting advanced monitoring and diagnostics.
3.1. OCPP Protocol
OCPP is an open, application-level communication protocol designed to standardize the interaction between EV charging stations (charge points) and centralized management systems (also called Charging Station Management Systems, CSMS). It was developed by the Open Charge Alliance to promote interoperability across different hardware and software vendors in the electric mobility ecosystem.
OCPP ensures that charging stations and backend systems can communicate regardless of manufacturer, enabling flexibility in infrastructure development and upgrades. The protocol relies on WebSocket over TCP for real-time, low-latency, bidirectional data exchange. All messages are formatted in JSON, making them readable and easily integrated with modern software platforms. Moreover, the OCPP application layer supports command/response and event-driven messages, allowing dynamic control and monitoring.
In a standard OCPP setup the charging station acts as the WebSocket client, initiating a persistent connection to the backend system. The CSMS acts as the WebSocket server, handling multiple incoming connections from charge points.
The initial connection begins with a Hypertext Transfer Protocol (HTTP) handshake that upgrades to a WebSocket channel, after which all communication occurs over that persistent channel.
3.2. OCPP Message Structure and Realistic Data Collection
OCPP defines a wide range of messages to cover operational needs. Common examples include:
- BootNotification: Sent by the station at startup to register with the backend.
- Authorize: Checks user authentication credentials before a charging session.
- StartTransaction/StopTransaction: Marks the beginning and end of a charging session.
- MeterValues: Reports real-time energy consumption during charging (e.g., energy active import, active power import, current import L1, L2 and L3).
- Heartbeat: Keeps the connection alive and confirms the station is online.
- StatusNotification: Informs the backend of changes in the station’s state (available, faulted, etc.).
- RemoteStartTransaction/RemoteStopTransaction: Allows remote control of charging sessions.
- Configuration commands: Enable remote diagnostics, firmware updates, and parameter changes.
4. Passive Traffic Monitoring and Variable Extraction
The modules for monitoring and extracting variables from network traffic were implemented using passive traffic capture techniques, ensuring that normal operational communications remain unaffected. Specifically, the monitoring setup was applied to network switches located within the Virtual Local Area Networks (VLANs) that connect the experimental devices—namely, the charging stations to the OCPP controller.
Data collection related to OCPP traffic (Figure 3) is performed through two main methods: Direct traffic sniffing using the Tshark tool, and Traffic analysis via probes from the Nozomi Networks Guardian sensor.
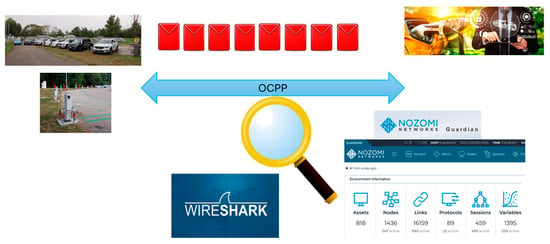
Figure 3.
EV recharging infrastructure data collection.
In both cases, the captured information is forwarded to and analyzed through the ELK stack, enabling real-time visualization and correlation of network events for cybersecurity and operational insights.
The following figures (Figure 4, Figure 5 and Figure 6) showcase several Kibana dashboards developed to visualize the values of key indicators profiling the communications between the charging stations and the controller of the electric vehicle charging infrastructure.

Figure 4.
Dashboards of indicators related to the charging infrastructure: Retransmitted packets, Received packets and bytes.

Figure 5.
Dashboards of indicators related to the charging infrastructure: Retransmitted Bytes, Sent Packets and Bytes.

Figure 6.
Dashboards of indicators related to the charging infrastructure: Received and sent bytes, average byte retransmissions, and retransmission percentage.
For the case study of the electric vehicle charging infrastructure, it was essential to integrate an OT-specific analysis tool like Nozomi Networks Guardian with the ELK stack (Figure 7). This integration enables the creation of a unified platform capable of collecting information from diverse sources, which can then be forwarded to specialized analysis modules for further processing.
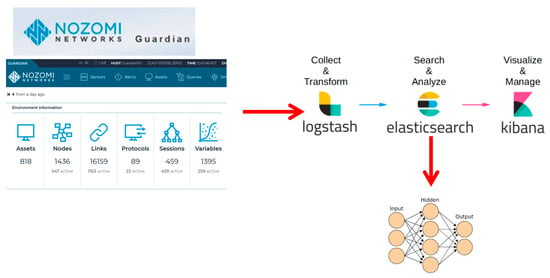
Figure 7.
Data collection architecture.
5. Normal and Cyberattack Scenarios in Charging Infrastructure
In the normal operating scenario, network traffic is captured during the everyday functioning of the electric vehicle charging infrastructure. Communication between the charging stations and the central controller, based on the OCPP-J v1.6 protocol [12], is passively intercepted and analyzed using Nozomi Networks Guardian tool. The extracted variable values are then ingested into the Elastic Stack platform via a dedicated Logstash pipeline. The resulting dataset, derived from typical OCPP traffic under standard operating conditions, serves as a reference baseline for training and validating artificial intelligence models, particularly for applications in anomaly detection. In this scenario, RSE employees autonomously used the charging infrastructure to power their electric vehicles, creating a realistic operational environment for traffic capture and indicator evaluation. This setup ensures the authenticity and representativeness of the collected dataset, as it reflects genuine usage patterns and interactions. By passively observing normal system behavior, a precise and comprehensive baseline of network traffic was established—an essential foundation for training AI models focused on anomaly detection and behavioral analysis.
The anomalous scenario was simulated by conducting a series of controlled cyberattacks targeting the experimental EV charging infrastructure.
Using a real-world infrastructure—employed daily by RSE employees and to charge company vehicles—provided a realistic environment for cybersecurity experiments. This setup enabled accurate assessments aligned with what might occur during actual attacks on public or private charging networks used by EV users.
A specific charging station was temporarily dedicated to the experiments, with an informed EV user connected for charging. This ensured the exchange of typical OCPP-J messages between the station and the controller, creating a realistic communication pattern.
Detecting DoS attacks is particularly challenging due to several factors as massive volume of traffic can peak suddenly, making it hard to distinguish between legitimate spikes in usage and malicious activity.
In some cases, traffic originates from multiple sources, often using botnets, which makes tracing the origin difficult (Distributed Denial of Service (DDoS) attacks).
Moreover, attackers frequently use sophisticated methods to mimic legitimate traffic patterns, bypassing traditional security filters and intrusion detection systems. Anomaly-based detection systems, machine learning algorithms, and real-time monitoring tools adapting to evolving attack patterns are essential components to quick identification and fast mitigation reducing service interruptions.
For this reason, to simulate adversarial conditions within the charging infrastructure, a simplified Denial of Service (DoS) flooding module was employed to generate controlled network-based attacks. The attack vector originated from a host machine situated within the same local area network (LAN) as the targeted charging station, exploiting its local proximity to deliver high volumes of malicious traffic. During the tests several Internet Control Message Protocol (ICMP) packets and packets with TCP flags (SYN and RST) set are generated varying the emission frequency. This configuration was designed to model insider threat scenarios, wherein a legitimate device is compromised or unauthorized access is obtained by a malicious actor within the internal network.
DoS scenarios are particularly relevant given that many LAN environments lack sufficient safeguards against traffic flooding, often operating under the implicit assumption that internal entities are inherently trustworthy.
During the execution of these simulated attacks, the charging station exhibited pronounced packets retransmission and communication latency with the OCPP controller, and in several instances, experienced temporary disconnections. Network traffic captured throughout these events revealed distinct anomalies when compared to baseline profiles derived from nominal operating conditions. This differential analysis enabled the extraction of characteristic patterns associated with attack behavior.
The resulting dataset of anomalous traffic was subsequently used to support the development and training of AI-driven anomaly detection models.
The platform collected and analyzed traffic during the attacks, identifying their impact on communication between the charging station and the controller. Anomalies in packet volume and retransmissions were detected and visualized using Kibana dashboards.
Figure 8 presents the dashboard plotting an example of an indicator where the effects of the attacks are visible.
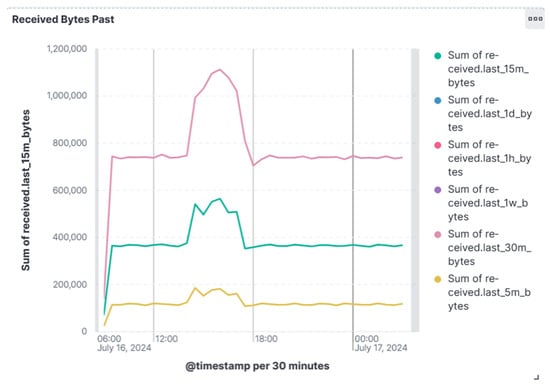
Figure 8.
Example of monitored indicator.
Table 1 presents 14 indicators used for the training of the AI model and for the detection of the DoS attack. The values of each indicator are collected every 5 s, balancing the need for rapid attack detection with the requirement to avoid overloading the platform.

Table 1.
Indicators collected by the platform.
6. AI Techniques for Monitoring Traffic Between Charging Infrastructure and Controller
6.1. Anomaly Detection Using LSTM Autoencoder: Architecture and Data
There are numerous methods for incorporating artificial intelligence into anomaly detection in network traffic. The effectiveness of these methods is significantly affected by the accessibility of data and particular monitoring goals. A well-known challenge is acquiring public datasets of malicious traffic that are both realistic and adequately varied.
In the realm of overseeing communications between the controller and charging stations within RSE electric vehicle infrastructure, we possess time-series data that reflect normal traffic, devoid of any known attacks. Consequently, an unsupervised anomaly detection strategy was implemented, concentrating on the identification of generic anomalies within the traffic. This method provides the benefit of training an AI model without the necessity for prior knowledge of specific attack types. Nevertheless, it also introduces the difficulty of differentiating between anomalies induced by cyberattacks and those arising from benign irregularities, such as hardware failures or non-malicious misbehaviors.
Considering these trade-offs, we opted for an LSTM Autoencoder architecture to develop a deep learning model aimed at detecting anomalies in the communication between the charging station and the controller.
An LSTM Autoencoder is a variant of the traditional autoencoder that incorporates LSTM layers, making it well-suited for handling sequential data such as time-series, text sequences, or audio signals. It is particularly effective at compressing and reconstructing input data, and at identifying anomalies in datasets with temporal dependencies.
In this instance, the LSTM Autoencoder is trained to replicate standard traffic patterns between the controller and the charging station. Subsequently, the model is evaluated using traffic data gathered during the cyberattack scenarios. Anomalous traffic is detected by analyzing the reconstruction error, which is the disparity between the model’s output and the actual input. This error tends to be considerably greater when the model processes anomalous data, as it strays from the patterns it acquired during training on normal traffic. Figure 9 illustrates the typical architecture of an LSTM Autoencoder.
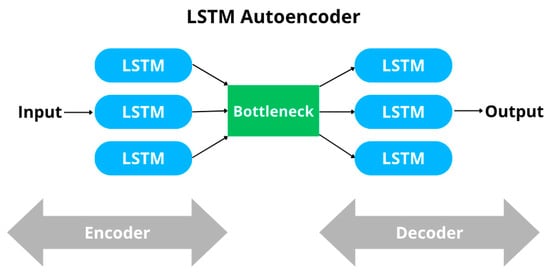
Figure 9.
LSTM Autoencoder Architecture.
Specifically, the implemented architecture consists of three main parts:
- Encoder: Three stacked LSTM layers with 128, 64, and 32 units, respectively. The first two layers return sequences, allowing the model to capture hierarchical temporal features, while the third layer reduces the sequence into a fixed-size latent vector. The ReLU activation function is applied throughout.
- Bottleneck (Inner Layer): The latent vector produced by the encoder is repeated across the time dimension, forming the compressed representation of the input sequence.
- Decoder: A symmetric set of LSTM layers with 32, 64, and 128 units reconstructs the sequence from the latent representation. Finally, a TimeDistributed Dense layer generates the output for each timestep, preserving the dimensionality of the original features. The ReLU activation function is applied throughout.
This architecture ensures that long-term temporal dependencies are preserved while effectively compressing the input into a compact latent representation, which facilitates the detection of anomalous patterns through reconstruction error analysis. Table 2 summarizes the hyperparameters used to train the presented architecture.

Table 2.
Training hyperparameters.
The LSTM Autoencoder was trained for 300 epochs using OCPP traffic data, which was based on multivariate time-series obtained from Nozomi Networks Guardian. The dataset used in this study contains a total of 145,532 rows, corresponding to individual time-series observations of the communication traffic between the controller and the charging station. This dataset included several calculated variables, organized at a constant sampling rate. It offered a more comprehensive, multi-dimensional perspective of the OCPP traffic.
The model was trained on normal traffic intervals and was evaluated on data gathered during a flooding-type DoS attack, which was specifically conducted in the PCS-ResTest Laboratory at RSE.
To guarantee robustness and generalizability, the training process incorporated over 16 different datasets, differing by:
- Time period: June, July, September, and October, along with various combinations of these months.
- Scenario type: Normal versus anomalous traffic.
This extensive dataset approach facilitated a detailed assessment of the model capability to identify anomalies across various conditions. The multivariate dataset employed for training the model comprises OCPP traffic data exchanged between the test charging station and the controller. It encompasses 14 variables obtained from the TCP layer, gathered over multiple time intervals during which the traffic displayed normal behavior. The chosen time windows extend from late June to early July, and from 25 September to 24 October.
On the afternoon of 16 July, a series of DoS flooding attacks were executed with the intention of deliberately creating anomalies within the dataset. These anomalies served to evaluate the model’s capability to identify abnormal behavior and to measure its effectiveness.
Figure 10 and Figure 11 present two segments of the multivariate time-series, concentrating on the following variables:
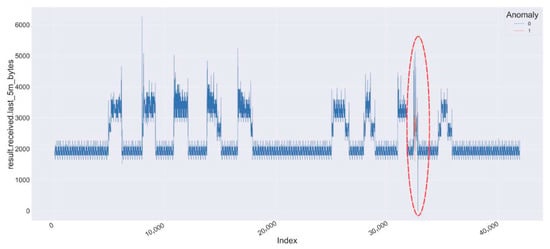
Figure 10.
Data traffic between the EV charging station and the controller for the variable result.received.last_5m_bytes exhibits anomalous behavior, indicated by the red circle.
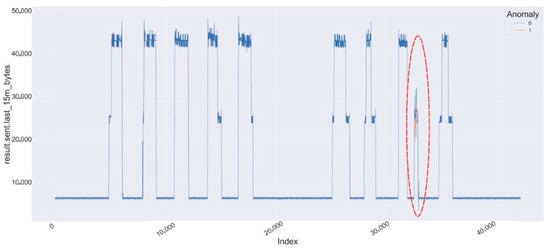
Figure 11.
Data traffic between the EV charging station and the controller for the variable result.sent.last_15m_bytes exhibits anomalous behavior, indicated by red circle.
- result.received.last_5m_bytes
- result.sent.last_15m_bytes
Each figure displays two weeks of data: one depicting normal traffic, while the other presents a combination of normal and anomalous traffic. The anomalies induced by the DoS flooding attacks on 16 July are distinctly marked in red. The contrast between normal and anomalous data is visually pronounced, highlighting the influence of the attacks on traffic behavior.
6.2. Analysis and Results
The training dataset was divided according to the conventional 80/20 ratio, a widely adopted practice in machine learning to balance the amount of data available for training and validation [22,23]. Specifically, 80% of the data was allocated for training purposes and 20% for validation. Both training and validation processes utilized traffic data deemed normal, whereas testing was carried out on mixed datasets that included both normal and anomalous traffic.
Figure 12 illustrates the learning curves derived from the model. It is clear from the curves that the model attained a high level of performance during the training phase.
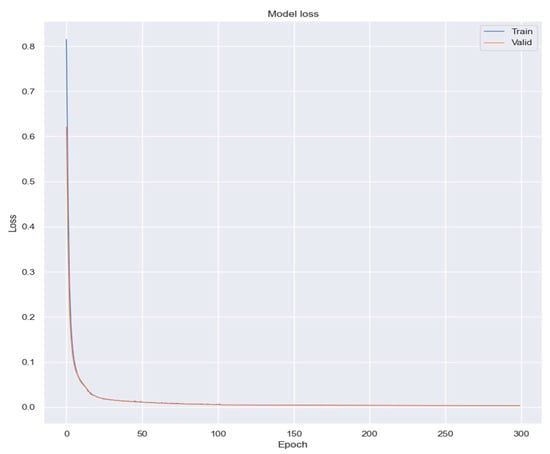
Figure 12.
Model loss during training and validation over 300 epochs. The graph shows a rapid decrease in loss for both training (blue) and validation (orange) datasets, indicating effective learning and convergence of the model.
After the model was trained, it became essential to establish a threshold value, beyond which any prediction error would be deemed indicative of an anomaly. To determine an appropriate threshold for anomaly detection, we evaluated the reconstruction error across a wide range of candidate values.
Figure 13 and Figure 14 report the ROC curve and the Precision-Recall (PR) curves, respectively, which provide complementary insights into the model’s discriminative performance. The ROC curve yielded an AUC of 0.995, indicating an excellent ability to distinguish between normal and anomalous samples. However, the average precision (AP) derived from the PR curve was 0.13, reflecting the strong class imbalance in the dataset and highlighting the challenge of maintaining high precision while achieving high recall. For each threshold, we computed key performance metrics, including Accuracy, Precision, and Recall. Figure 15 illustrates the outcomes for varying the threshold over 100 iterations. Based on this analysis, a threshold of 0.166 was selected as the operational point. At this value, the model achieves an Accuracy of 0.971, a Precision of 0.52, and a Recall of 0.986. While Precision remains modest, the high Accuracy and Recall demonstrate a reasonable trade-off between false positives and false negatives. This choice is further motivated by the operational requirements of anomaly detection in electric vehicle charging infrastructures, where missing an actual anomaly (false negative) is substantially more costly than issuing an occasional false alarm.
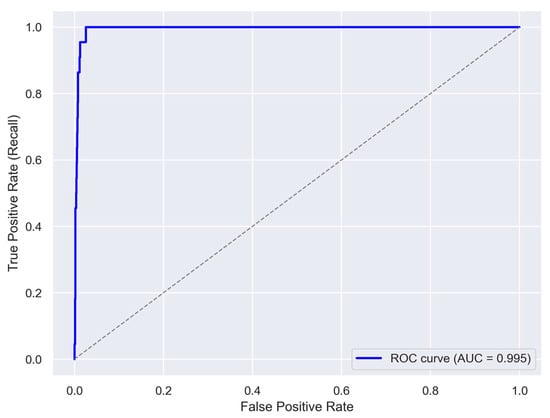
Figure 13.
ROC curve of the model. The blue curve illustrates the trade-off between true positive rate and false positive rate. The model achieves an AUC of 0.995, indicating excellent classification performance. The dashed gray line represents a random classifier.
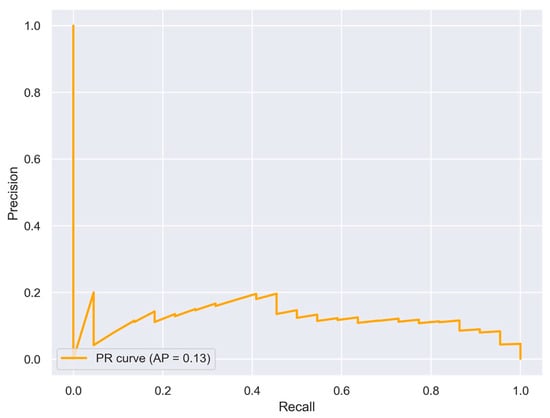
Figure 14.
Precision-Recall curve of the model. The orange curve illustrates the trade-off between precision and recall across different thresholds. The average precision (AP) score is 0.13.
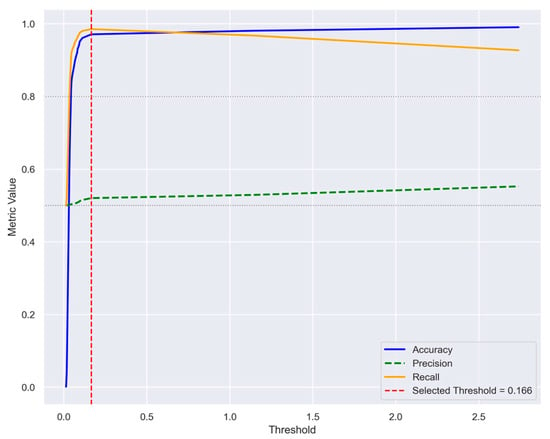
Figure 15.
Performance metrics across threshold values over 100 iterations. Accuracy, Precision, and Recall are plotted as functions of the threshold. The selected threshold of 0.166 is highlighted with a red dashed line.
The model underwent testing on data that included anomalies resulting from the attacks on July 16. Overall, the model achieved high performance, confirming the suitability of the features in the multivariate dataset for training the LSTM Autoencoder in detecting anomalous traffic. Figure 16 illustrates the confusion matrix generated from the test dataset. It is evident that, in this instance, anomalies are accurately identified with no false negatives. The model attains an Accuracy rate of 97%, with 3% of the data classified as normal being misidentified as anomalous. To further evaluate the classification performance, standard metrics including Precision, Recall, and F1-score were computed for both classes. For the “Anomaly” class, the model achieved a perfect Recall of 100%, indicating that all anomalous instances were correctly identified. However, the Precision was notably low (≈4%), suggesting a high rate of false positives in Normal class. This imbalance resulted in a modest F1-score of approximately 8%.
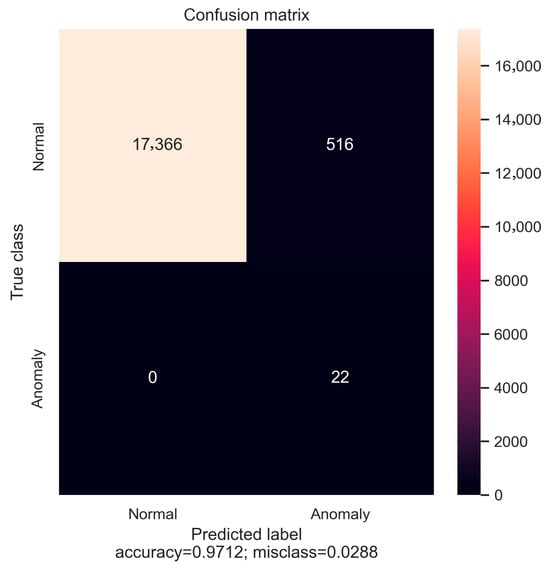
Figure 16.
Confusion Matrix of the LSTM Autoencoder model. All anomalies are correctly identified (no false negatives), while 3% of normal instances are misclassified. The model achieves 97.1% Accuracy, with high Recall for anomalies and strong Precision for normal traffic.
In contrast, the “Normal” class exhibited excellent performance, with both Precision and Recall values close to optimal. The Precision was 100%, and the Recall reached approximately 97%, yielding a high F1-score of 99%. These results demonstrate the model’s strong ability to correctly classify normal instances with minimal error. While the overall Accuracy of 97.1% is encouraging, it is important to note that this metric is influenced by the dominance of the “Normal” class in the dataset. The disparity in Precision for the “Anomaly” class highlights the need for further refinement, particularly in reducing false positive rates to improve reliability in anomaly detection tasks.
Figure 17 illustrates a comparison between the actual anomalies and those identified by the model within the test dataset. In Figure 17a, the 22 anomalous points that correspond to the time intervals during which the attacks were launched are displayed. Figure 17b shows the points that the model has classified as anomalous. It is evident that the model also categorizes certain points as anomalous that lie outside the precise attack intervals. These points are likely influenced by residual effects or tail effects resulting from repeated attacks occurring in quick succession. This pattern indicates that the model is responsive not only to the immediate effects of the attacks but also to the short-term disturbances they create within the system.
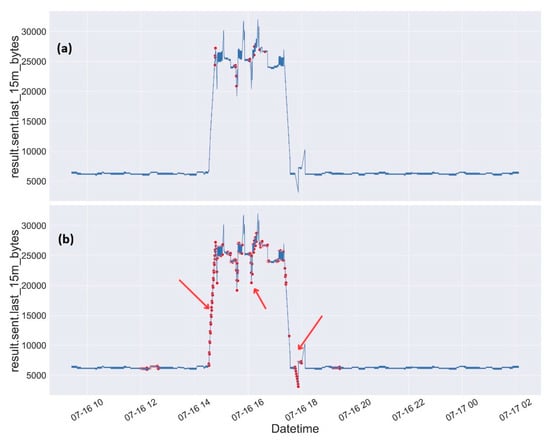
Figure 17.
Comparison between actual anomalies (a) and those detected by the model (b) on the multivariate test dataset. Normal traffic is shown in blue, red dots indicate anomalies, and red arrows in (b) highlight misclassification and tail effects.
In addition to the anomalies generated during cyberattack scenarios, the model was also tested on traffic data containing anomalies caused by charging station disconnections (see Figure 18). These events, although not malicious in nature, represent critical operational irregularities that the monitoring system must be able to detect. The model demonstrated strong performance in this context as well, achieving a Recall of 99%, a Precision of 54%, and an F1-score of 70%. These results confirm the model’s ability to identify nearly all disconnection events, with a moderate rate of false positives. Figure 19 presents the confusion matrix obtained from this test, highlighting the classification outcomes for both normal and anomalous traffic. The high Recall shows that disconnection anomalies are overall not missed, while the Precision reflects the challenge of distinguishing them from benign fluctuations in traffic behavior.
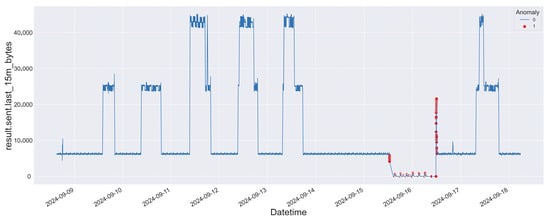
Figure 18.
The graph displays the number of bytes sent in the last 15 min between 9 September and 18 September 2024. Normal traffic is shown in blue, while anomalies, caused by charging station disconnections, are highlighted with red dots.
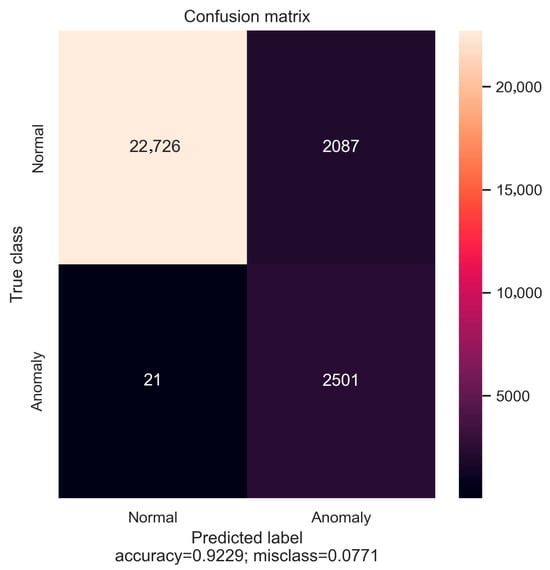
Figure 19.
Confusion matrix for anomaly detection during charging station disconnection events. The matrix shows 2501 true positives and 21 false negatives for the “Anomaly” class, and 22,726 true negatives with 2087 false positives for the “Normal” class. The model achieved an overall Accuracy of 92.3%.
7. Conclusions
This work introduced a modular and flexible platform for monitoring and analyzing events and measurements within energy infrastructures, leveraging the ELK stack and AI-based techniques. Due to its adaptability in connecting with various data sources offered by monitoring probes like Nozomi Networks Guardian for communication protocols—like OCPP—the platform proved effective in multiple experimental settings, including electric vehicle charging systems.
Building on the modular platform described above, this work also explored the integration of LSTM Autoencoder models for unsupervised anomaly detection in electric vehicle charging infrastructures. Specifically, the model was trained on multivariate time-series data representing normal traffic between the controller and charging stations and evaluated using data collected during controlled DoS flooding attacks.
The architecture, composed of stacked LSTM layers and a symmetric decoder, effectively captured long-term temporal dependencies and reconstructed normal traffic patterns with high fidelity. Anomalies were detected by analyzing reconstruction errors, with a selected threshold of 0.166 yielding an Accuracy of 97.1%, a Recall of 98.6%, and a Precision of 52%. These results confirm the model’s ability to detect anomalous behavior, particularly in scenarios where false negatives must be minimized.
While the model achieved perfect recall for attack-induced anomalies, the relatively low precision highlights the challenge of distinguishing malicious traffic from benign irregularities. Nonetheless, the high classification performance for normal traffic and the overall robustness of the model across multiple datasets and time windows demonstrate its suitability for real-world deployment.
This integration of deep learning into the monitoring platform reinforces its potential for proactive threat detection and complements traditional IT security measures. Future developments will focus on refining precision, expanding protocol support and adapting the model to diverse network topologies and attack types—such as data injection and Man-in-the-Middle scenarios—thus enabling context-specific anomaly detection. Additionally, the data collection framework will be extended to incorporate new indicators relevant to these expanded use cases.
Ultimately, the combination of flexible data integration and AI-driven analysis represents a significant step toward resilient and adaptive cybersecurity solutions for energy infrastructures undergoing digital transformation.
Author Contributions
Conceptualization, R.T.; Methodology, R.T.; Software, A.M. and G.W.; Validation, R.T. and A.M.; Formal Analysis, A.M.; Writing—Original Draft Preparation, R.T.; Writing—Review & Editing, A.M. and G.D.; Project Administration, G.D. All authors have read and agreed to the published version of the manuscript.
Funding
This work has been financed by the Research Fund for the Italian Electrical System under the Three-Year Research Plan 2025–2027 (MASE, Decree n.388 of 6 November 2024), in compliance with the Decree of 12 April 2024.
Data Availability Statement
The raw data supporting the conclusions of this article will be made available by the authors on request.
Acknowledgments
The results achieved have been possible thanks to a research collaboration agreement with Nozomi Networks.
Conflicts of Interest
Author Gabriele Webber is employed by the company Nozomi Networks. The remaining authors declare that the research was conducted in the absence of any commercial or financial relationships that could be construed as a potential conflict of interest.
References
- IEC 62443-3-3:2013 Industrial Communication Networks—Network and System Security—Part 3-3: System Security Requirements and Security Levels. Available online: https://webstore.iec.ch/en/publication/7033 (accessed on 3 November 2025).
- Dogaru, D.; Dumitrache, I. Cyber Attacks of a Power Grid Analysis using a Deep Neural Network Approach. J. Contr. Eng. Appl. Inform. 2019, 21, 42–50. [Google Scholar]
- Jacob, R.A.; Uddin, J.; Wang, J.; Coskunuzer, B.; Zhang, J. Cyber Attack Detection in Electric Vehicle Charging Stations Using Topological Data Aided Learning. In Proceedings of the IEEE Power & Energy Society General Meeting, Austin, TX, USA, 27–31 July 2025. [Google Scholar]
- Tanyıldız, H.; Şahin, C.B.; Dinler, Ö.B.; Migdady, H.; Saleem, K.; Smerat, A.; Gandomi, A.H.; Abualigah, L. Detection of cyber-attacks in electric vehicle charging systems using a remaining useful life generative adversarial network. Sci. Rep. 2025, 15, 10092. [Google Scholar] [CrossRef] [PubMed]
- Girdhar, M.; Hong, J.; You, Y.; Song, T.-J.; Govindarasu, M. Cyber-Attack Event Analysis for EV Charging Stations. In Proceedings of the 2023 IEEE Power & Energy Society General Meeting (PESGM), Orlando, FL, USA, 16–20 July 2023; pp. 1–5. [Google Scholar] [CrossRef]
- Makhmudov, F.; Kilichev, D.; Giyosov, U.; Akhmedov, F. Online Machine Learning for Intrusion Detection in Electric Vehicle Charging Systems. Mathematics 2025, 13, 712. [Google Scholar] [CrossRef]
- Buedi, E.D.; Ghorbani, A.A.; Dadkhah, S.; Ferreira, R.L. Enhancing EV Charging Station Security Using a Multi-dimensional Dataset: CICEVSE2024. In Data and Applications Security and Privacy XXXVIII; Ferrara, A.L., Krishnan, R., Eds.; Lecture Notes in Computer Science; Springer: Cham, Switzerland, 2024; Volume 14901. [Google Scholar]
- Kumar, A.G.; Amandeep; Dahiya, S. Machine Learning for Advancing Electric Vehicles Security Leveraging CICEVSE2024. In Proceedings of the 2025 International Russian Smart Industry Conference (SmartIndustryCon), Sochi, Russia, 24–28 March 2025; pp. 240–245. [Google Scholar]
- Rahman, M.M.; Chayan, M.M.H.; Mehrin, K.; Sultana, A.; Hamed, M.M. Explainable Deep Learning for Cyber Attack Detection in Electric Vehicle Charging Stations. In Proceedings of the 11th International Conference on Networking, Systems, and Security (NSysS ‘24), New York, NY, USA, 19–21 December 2024; Association for Computing Machinery: New York, NY, USA; pp. 1–7. [Google Scholar] [CrossRef]
- Tshark—Manual Page. Available online: https://www.wireshark.org/docs/man-pages/tshark.html (accessed on 3 November 2025).
- Wireshark. Available online: https://www.wireshark.org/ (accessed on 3 November 2025).
- Guardian—Monitoraggio Della Rete OT, Nozomi Networks. Available online: https://it.nozominetworks.com/products/guardian (accessed on 3 November 2025).
- Elastic Stack. Available online: https://www.elastic.co/elastic-stack/ (accessed on 3 November 2025).
- Docker. Available online: https://www.docker.com/ (accessed on 3 November 2025).
- Apache Software Foundation. Apache Kafka. Available online: https://kafka.apache.org/ (accessed on 3 November 2025).
- Rumelhart, D.E.; Hinton, G.E.; Williams, R.J. Learning internal representations by error propagation. In Parallel Distributed Processing: Explorations in the Microstructure of Cognition; MIT Press: Cambridge, MA, USA, 1986; Volume 1, Chapter 8; pp. 318–362. [Google Scholar]
- Cottrell, G.W.; Munro, P.; Zipser, D. Learning Internal Representation from Gray-Scale Images: An Example of Extensional Programming. In Proceedings of the 9th Annual Conference of the Cognitive Science Society, Seattle, WA, USA, 16–18 July 1987; Chaper 9. pp. 208–240. [Google Scholar]
- Kramer, R.G. Nonlinear Principal Component Analysis using Autoassociative Neural Networks. Am. Inst. Chem. Eng. J. 1991, 37, 233–243. [Google Scholar] [CrossRef]
- Hochreiter, S.; Schmidhuber, J. Long Short-Term Memory. Neural Comput. 1997, 9, 1735–1780. [Google Scholar] [CrossRef]
- Open Charge Alliance, Open Charge Point Protocol 1.6. 2015. Available online: https://openchargealliance.org/protocols/open-charge-point-protocol/#OCPP1.6 (accessed on 3 November 2025).
- OpenInfra Foundation, OpenStack. Available online: https://www.openstack.org/ (accessed on 3 November 2025).
- Kohavi, R. A study of cross-validation and bootstrap for accuracy estimation and model selection. In Proceedings of the 14th International Joint Conference on Artificial Intelligence (IJCAI), Montreal, QC, Canada, 20–25 August 1995; Volume 2, pp. 1137–1145. [Google Scholar]
- Xu, Y.; Goodacre, R. On splitting training and validation set: A comparative study of cross-validation, bootstrap and systematic sampling for estimating the generalization performance of supervised learning. J. Chemom. 2018, 2, 249–262. [Google Scholar] [CrossRef]
Disclaimer/Publisher’s Note: The statements, opinions and data contained in all publications are solely those of the individual author(s) and contributor(s) and not of MDPI and/or the editor(s). MDPI and/or the editor(s) disclaim responsibility for any injury to people or property resulting from any ideas, methods, instructions or products referred to in the content. |
© 2025 by the authors. Licensee MDPI, Basel, Switzerland. This article is an open access article distributed under the terms and conditions of the Creative Commons Attribution (CC BY) license (https://creativecommons.org/licenses/by/4.0/).