You are currently viewing a new version of our website. To view the old version click .
Electronics
  • Article
  • Open Access

24 September 2025

Dynamic Visual Privacy Governance Using Graph Convolutional Networks and Federated Reinforcement Learning

,
and
1
Department of Engineering Science and Ocean Engineering, National Taiwan University, Taipei 10617, Taiwan
2
Department of Information Management, National Taiwan University of Science and Technology, Taipei 10617, Taiwan
*
Authors to whom correspondence should be addressed.
This article belongs to the Special Issue Security and Privacy for Modern Wireless Communication Systems, 3rd Edition

Abstract

The proliferation of image sharing on social media poses significant privacy risks. Although some previous works have proposed to detect privacy attributes in image sharing, they suffer from the following shortcomings: (1) reliance only on legacy architectures, (2) failure to model the label correlations (i.e., semantic dependencies and co-occurrence patterns among privacy attributes) between privacy attributes, and (3) adoption of static, one-size-fits-all user preference models. To address these, we propose a comprehensive framework for visual privacy protection. First, we establish a new state-of-the-art (SOTA) architecture using modern vision backbones. Second, we introduce Graph Convolutional Networks (GCN) as a classifier head to counter the failure to model label correlations. Third, to replace static user models, we design a dynamic personalization module using Federated Learning (FL) for privacy preservation and Reinforcement Learning (RL) to continuously adapt to individual user preferences. Experiments on the VISPR dataset demonstrate that our approach can outperform the previous work by a substantial margin of 6% in mAP (52.88% vs. 46.88%) and improve the Overall F1-score by 10% (0.770 vs. 0.700). This provides more meaningful and personalized privacy recommendations, setting a new standard for user-centric privacy protection systems.

1. Introduction

In the contemporary digital landscape, visual content has become the lingua franca of social interaction, with billions of images shared daily across online platforms. This torrent of user-generated content, however, creates a significant attack surface for privacy breaches, where seemingly innocuous photographs can inadvertently expose privacy attributes ranging from personal documents to geolocation data. This phenomenon, often termed the privacy paradox, underscores a critical gap between users’ desire for social engagement and their ability to manage the associated privacy risks effectively [,].
To address this, the field of automated visual privacy assessment has gained traction, typically formulating the problem as an image recognition task. Seminal studies, such as that by Jiang et al. [], have laid important groundwork by employing deep learning models, like ResNet (Residual Network) [] combined with a custom attention mechanism called PSSA (Privacy-Specific Spatial Attention), to detect privacy attributes. However, we argue that such approaches are constrained by outdated assumptions and suffer from three limitations:
  • Legacy architectures: Previous approaches are built only upon legacy architectures, which lack the powerful feature representation capabilities of modern state-of-the-art (SOTA) vision backbones like Vision Transformer (ViT) [].
  • Failure to model label correlations: Previous approaches fail to model the label correlations and co-occurrence patterns that exist between them (e.g., the “passport” attribute is highly correlated with “face”).
  • Static user preference models: Their user preference models are typically static and collective, derived from one-off user studies, which cannot adapt to the dynamic and deeply personal nature of individual privacy boundaries.
This paper posits that a truly effective visual privacy system must evolve from a static prediction tool into a dynamic, personalized, and explainable governance partner. We propose a holistic framework that systematically addresses the aforementioned limitations. Our main contributions are threefold:
  • To overcome legacy architectures, we establish a new SOTA baseline by employing modern ConvNeXt [] backbone and advocate for a more balanced evaluation protocol that emphasizes not only mAP but also the Overall F1-score (OF1), which is more representative of real-world performance in privacy-sensitive applications.
  • To solve the problem of failure to model label correlations, we introduce Graph Convolutional Networks (GCNs) as a classifier head to explicitly leverage label correlations for more coherent and accurate predictions, a technique proven effective in general multi-label contexts [].
  • To replace the static user preference models, we design a dynamic and privacy-preserving framework that integrates Federated Learning (FL) [] and Reinforcement Learning (RL) []. FL ensures that user preference models are trained on-device to preserve privacy, while RL allows the system to continuously and dynamically adapt to each user’s evolving privacy feedback, treating them as a unique individual.
Through extensive experimentation on the VISPR dataset, we demonstrate that our framework not only sets a new baseline in predictive performance but also provides a more robust, personalized, and interpretable solution for visual privacy governance.

3. Proposed Methods

To address the limitations of prior work, we propose a framework for visual privacy governance that is performant, robust, and personalized. As illustrated in Figure 1, our framework is composed of three main stages: (1) A core privacy attribute recognition module that leverages a new vision backbone and GCN to model label correlations. (2) A dynamic personalization module that uses FRL to adapt to individual user preferences while preserving privacy. (3) A dynamic risk assessment module that synthesizes the model’s predictions and the user’s preferences into an intuitive risk score.
Figure 1. Overall architecture of our proposed framework.

3.1. Privacy Attribute Recognition

The foundation of our framework is a powerful and balanced recognition model; we improve upon existing methods in two key aspects: the feature extractor and the classifier design. Instead of relying on ResNet-50, we employ a mkilodern vision model ConvNeXt as our backbone feature extractor ϕ ( · ) . Given an input image I, it extracts a high-dimensional feature map Z = ϕ ( · ) . This provides a richer and more powerful feature representation, which is crucial for identifying subtle privacy attributes. The entire backbone is fine-tuned on the target dataset using a weighted loss function to mitigate the effects of class imbalance. Recognizing that privacy attributes are not independent, we replace the conventional linear classifier with a GCN head to explicitly model label correlations. We construct a directed graph G = ( V , E ) , where each node v i V corresponds to one of the C privacy attributes. The edges E represent the conditional probability between attributes, estimated from the training set. The adjacency matrix A R C × C is defined as:
A i j = P l a b e l j l a b e l i
This matrix captures the likelihood of attribute j appearing given that attribute i is present. We operate on the assumption that this statistical co-occurrence, derived from the training data, serves as a strong proxy for the underlying label correlations between privacy attributes. For instance, the high co-occurrence of ‘passport’ and ‘face’ labels reflects their inherent semantic link. Therefore, the graph G constructed from these statistical relationships provides the structural priors needed to guide the GCN toward making semantically coherent predictions. The initial node features, H ( 0 ) R C × D , are derived from the image features Z. The layer-wise propagation rule is:
H ( l + 1 ) = σ ( A ^ H ( l ) W ( l ) )
where A ^ is the normalized adjacency matrix, W ( l ) is the trainable weight matrix of the l-th layer, and σ is an activation function. The output of the final GCN layer, H ( L ) , which now contains correlation-aware label representations, is used to produce the final multi-label predictions.

3.2. Dynamic and Personalized Governance via FRL

To overcome the static, one-size-fits-all nature of previous user preference models, we introduce a dynamic personalization module based on a synthesis of Federated Learning and Reinforcement Learning. The methodology is composed of three key components: a simulated learning environment, the agent’s architecture, and a two-stage learning framework.

3.2.1. Simulation Environment

To train and evaluate the personalization agents without requiring real user data, we developed a simulation environment based on the OpenAI Gym interface []. The state space is a continuous vector representing the 68 privacy attribute probabilities predicted by our main GCN model for a given image. The action space is discrete, where an action corresponds to selecting one of the 68 attributes to recommend for user attention (e.g., to be blurred or reviewed). The agent’s goal is to select the action that is most relevant to the user’s preferences. Then, to simulate diverse user preferences, we created five distinct user personas: Techie, Social, Family, Financial, and PrivacyGrade. Each persona is defined by a set of keywords (e.g., “financial” keywords include ‘card’, ‘receipt’, ‘bank’). The environment automatically calculates a reward based on the agent’s action. Actions that correctly identify an attribute matching the active persona’s keywords receive a higher positive reward, while incorrect suggestions for these privacy attributes incur a larger penalty, thus guiding the agent to learn the persona’s specific concerns.

3.2.2. Agent Architecture

The core of our personalization module is a Deep Q-Network (DQN) agent []. The agent’s neural network architecture is a Multi-Layer Perceptron (MLP) with two hidden layers (512 and 256 neurons, respectively), LeakyReLU activation functions, and Dropout layers with a rate of 0.5 for regularization. This network takes the state vector as input and outputs a Q-value for each possible action.

3.2.3. Two-Stage Learning Framework

Our framework employs a two-stage process to effectively train the agents:
Stage 1: Federated Pre-training: We first train a set of initial preference models using the Federated Averaging (fed_avg) algorithm [,]. In this stage, each client’s DQN agent is trained locally in a supervised manner, using a standard BCEWithLogitsLoss function to learn the general preferences of its corresponding user persona. This pre-training provides the agent with a strong baseline understanding of user preferences before any real-time interaction.
Stage 2: Online Fine-tuning from Corrective Feedback: During the interactive evaluation phase, the agent adapts based on specific corrective feedback rather than a simple scalar reward. When a user’s feedback is received (simulated as a list of correctly and incorrectly flagged attributes), the agent undergoes online fine-tuning. This process uses a weighted BCEWithLogitsLoss, where the loss for correcting a mistake is given a significantly higher weight (weight = 10.0) than the weight for reinforcing a correct suggestion (weight = 5.0). This asymmetrical weighting scheme ensures that the agent learns rapidly from its errors. Furthermore, this fine-tuning is only applied to attributes where the agent’s initial prediction confidence exceeded a threshold of 0.1, preventing updates on uncertain predictions. The Online Fine-tuning from Corrective Feedback algorithm is shown in Algorithm 1.
A critical aspect of our framework is the seamless integration of the dynamic personalization module with the core privacy attribute recognition module. The DQN agent acts as an intelligent post-processing, personalized re-ranking module. The workflow is as follows: (1) For a given image, the ConvNeXt-GCN classifier first produces an initial vector of attribute probabilities, representing an objective, user-agnostic analysis of the content. (2) This probability vector is then passed as the input state to the user’s personalized DQN agent. (3) The agent, based on its learned policy reflecting the user’s unique preferences, outputs a vector of Q-values. Each Q-value, Q u ( s , a i ) , quantifies the expected future reward of flagging attribute i for user u, effectively serving as a learned, context-aware importance weight. This ensures that the personalization is built upon a robust visual understanding provided by the core classifier.
Algorithm 1: Online Fine-tuning from Corrective Feedback
Require: Agent π , current state s, user feedback F = { F c o r r e c t ,   F w r o n g } , learning rate η , episodes e, confidence threshold θ c o n f
Ensure: Updated agent π
  1: Initialize optimizer for agent π with learning rate η .
  2: Get prediction confidences P from state s
  3: I v a l i d { i P i > θ c o n f } //Select indices of high-confidence predictions
  4: if  I v a l i d is empty then return  π
  5: Initialize target vector T and weight vector W for indices in I v a l i d
  6: for each index I   I v a l i d  do
  7:       if I   F c o r r e c t  then
  8:            T i ←1.0, W i ←5.0//Reinforce correct suggestions
  9:       else if I   F w r o n g  then
10:            T i ←0.0, W i ←10.0//Penalize incorrect suggestions more heavily
11: end if
12: end for
13: Initialize loss function L = BCEWithLogitsLoss(weight = W)
14: for e = 1 to E do
15:    Get prediction scores S p r e d π ( s )
16:     S m a s k e d ← select scores from S p r e d with indices I v a l i d
17:    loss L ( S m a s k e d , T)
18:    Update agent π by minimizing loss Via gradient descent
19: end for
20: return updated agent π

3.3. Dynamic Risk Assessment

To provide users with a clear and actionable privacy evaluation, we introduce a dynamic risk assessment module that leverages the output of the personalized DQN agent. This module moves away from abstract quantification methods in favor of a transparent scoring mechanism rooted in the agent’s learned policy. Instead of learning a static weight vector, the DQN agent for a given user u outputs a Q-value vector, Q u ( s , ) , for any given state s (the image’s predicted attribute probabilities). Each element in this vector, Q u ( s , a i ) , represents the agent’s learned expectation of future reward for taking the action ai (i.e., flagging the i-th privacy attribute). The final, personalized Risk Score ( S u ) is defined as the maximum Q-value in this output vector:
S u = max i   Q u ( s , a i )
This approach ensures the risk score is both intuitive and deeply personal. A high score signifies that the agent has identified at least one attribute that it strongly believes is highly relevant to the user’s specific privacy concerns, providing a meaningful and actionable signal for sharing decisions. To ensure this score is not a black box, the entire Q-value vector is used to generate a ranked list of detected attributes, sorted by personal relevance. Furthermore, a bounding box is used to visually pinpoint this attribute’s location in the image, providing direct visual evidence.
To illustrate this mechanism in practice, Figure 2 and Figure 3 provide qualitative examples of the system’s user-facing output. Figure 2 demonstrates the detection of sensitive attributes like faces and semi-nudity in a complex public scene, while Figure 3 showcases its effectiveness in identifying personal data within a passport. It is important to note that our model performs image-level, multi-label classification; consequently, the score shown for a given label (e.g., a12_semi_nudity at 0.4464 in Figure 2) represents the overall confidence for that attribute’s presence anywhere in the image. The combination of a ranked risk list (the “why”) and illustrative visual indicators (the “where) transforms the system from a black-box detector into a transparent governance partner, delivering the clear, actionable feedback necessary to build user trust.
Figure 2. Qualitative Example of Privacy Detection in a Complex Scene. This figure illustrates the system’s ability to identify multiple privacy attributes in a crowded public environment, such as complete faces (a9_face_complete), partial faces (a10_face_partial), and semi-nudity (a12_semi_nudity).
Figure 3. Qualitative Example of Privacy Detection in a Sensitive Document. This example showcases the framework’s effectiveness in analyzing sensitive documents containing Personally Identifiable Information. The system identifies the document as a passport (a31_passport) and the embedded photograph as a complete face (a9_face_complete) with very high confidence.

4. Experimental

4.1. Experimental Setup

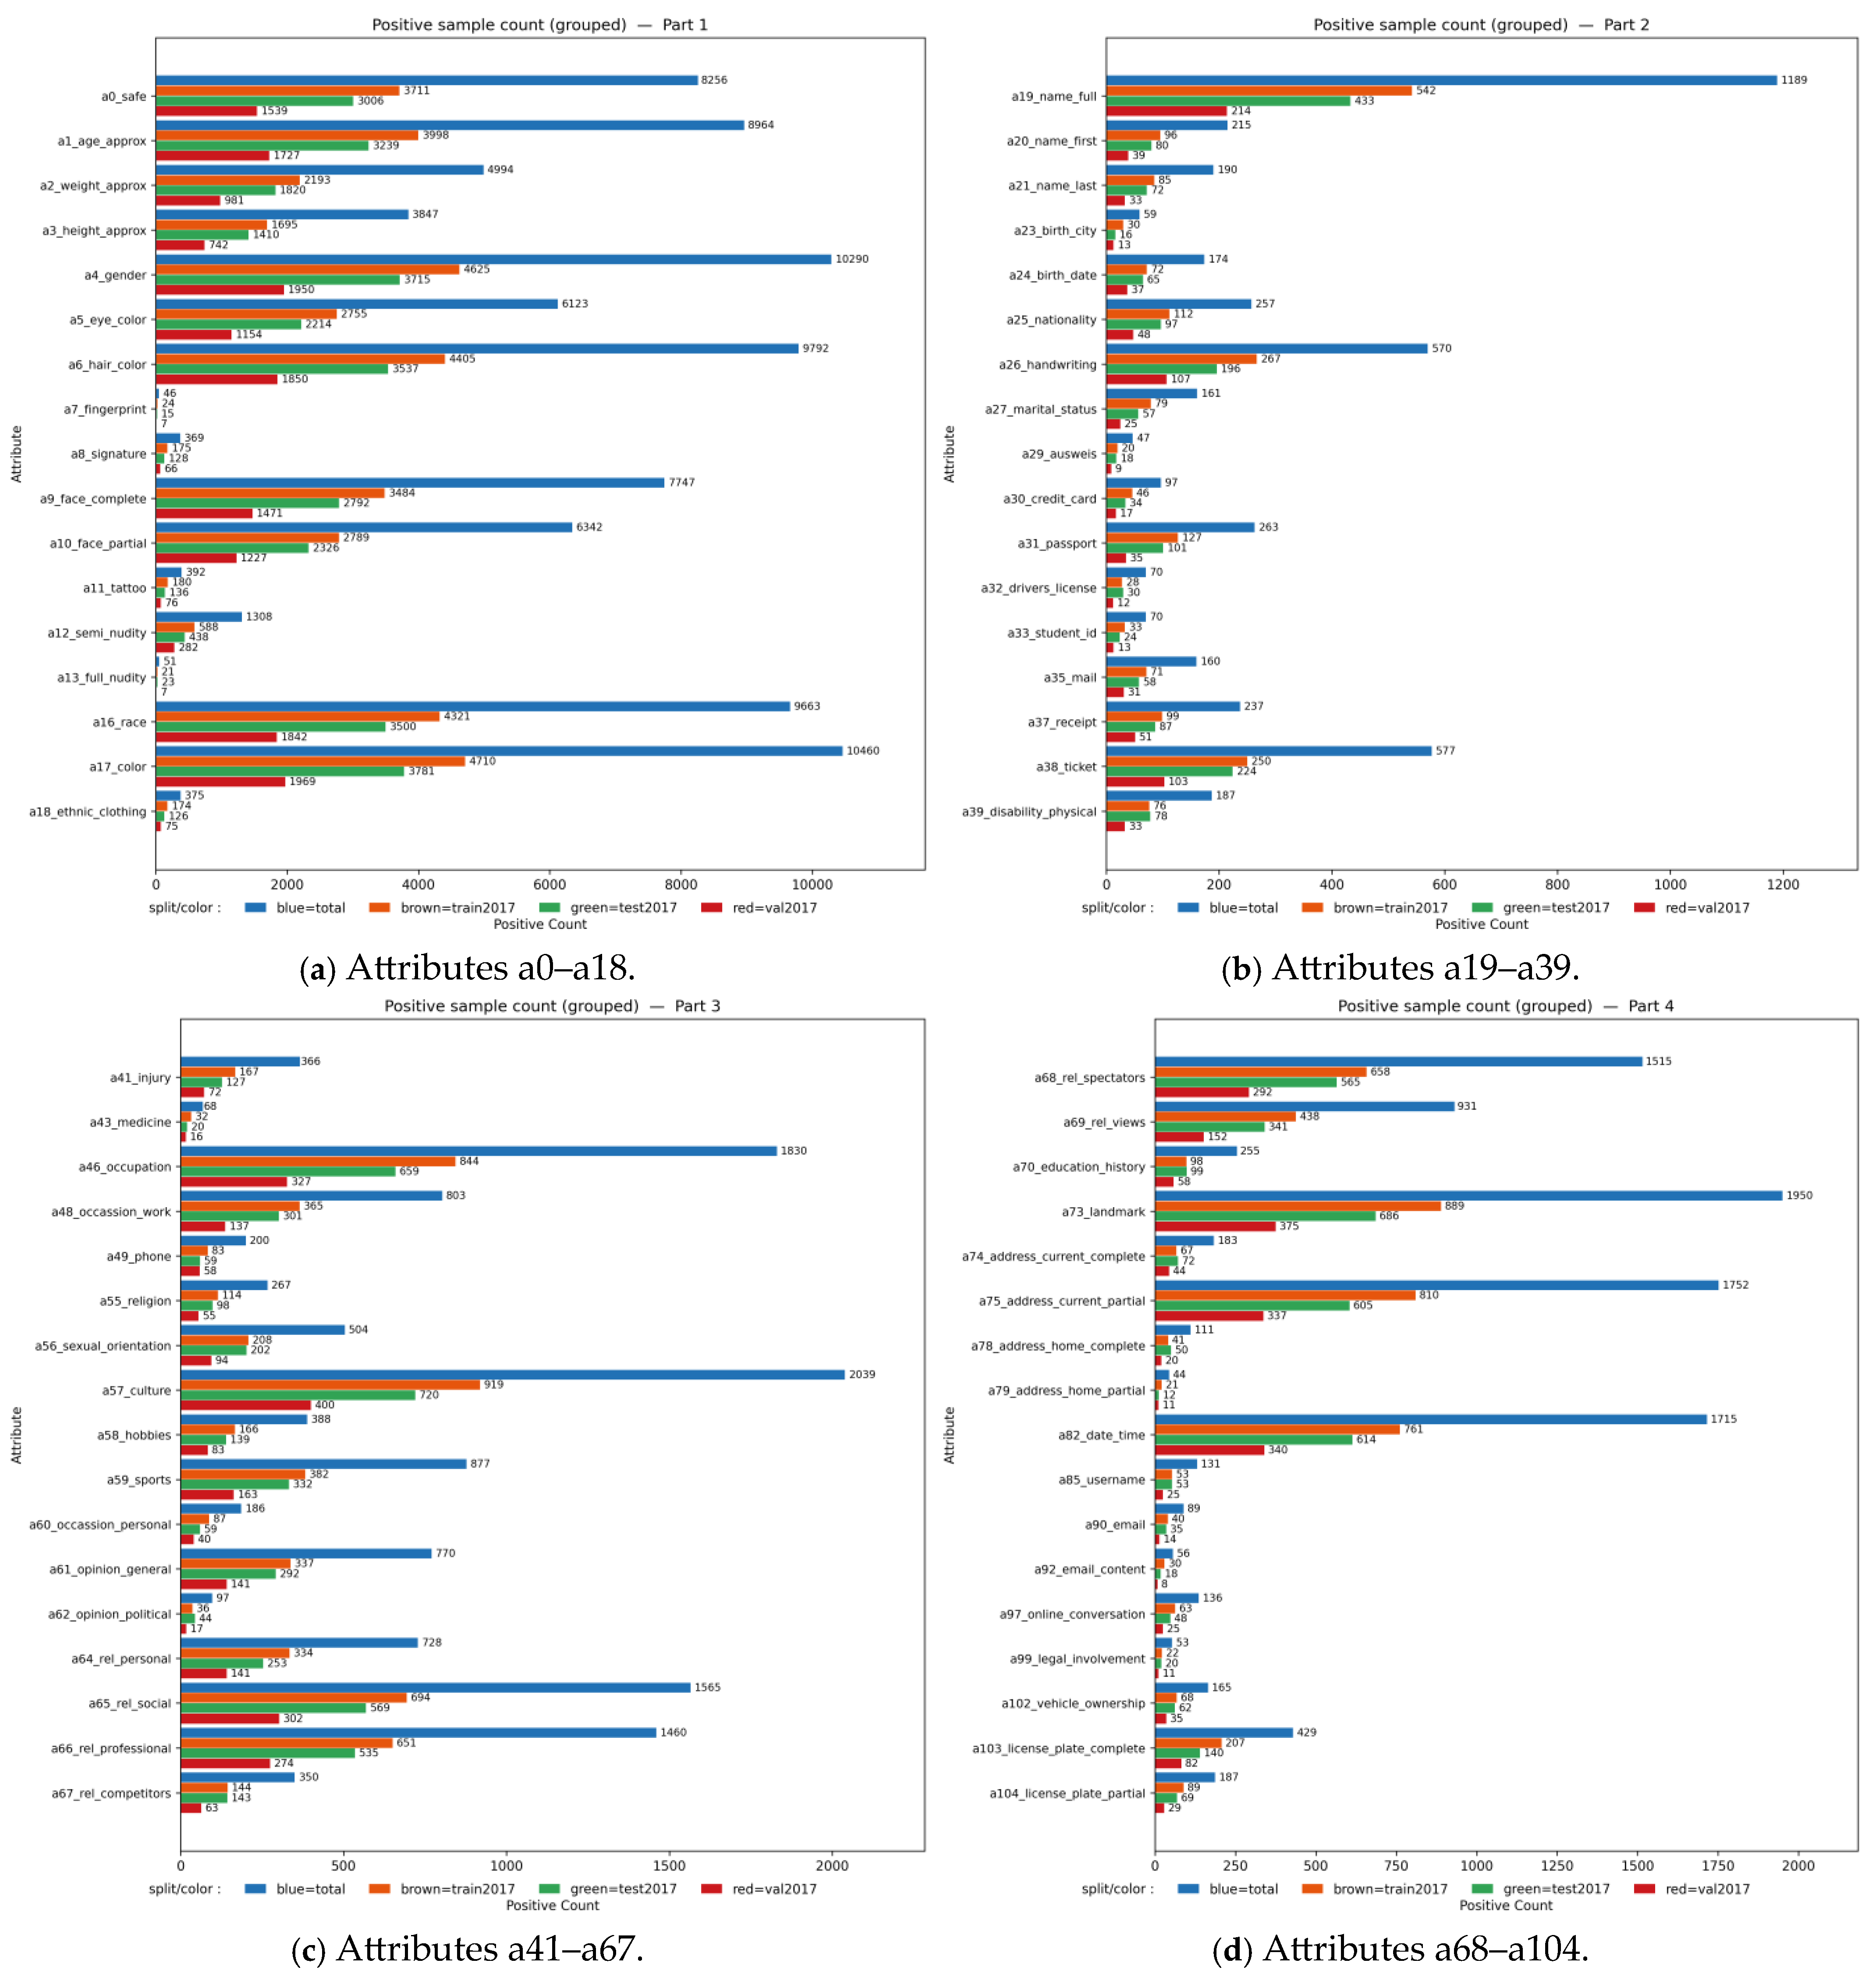
To ensure fair, head-to-head comparison and reproducibility with prior art, our experiments are conducted on the VISPR dataset. All images are resized to 224 × 224 pixels. For training, we apply standard data augmentation techniques, including random resized cropping, horizontal flipping, and color jittering. For validation and testing, we use a single center crop. All images are normalized using the mean and standard deviation of ImageNet. Figure 4 illustrates the distribution of positive samples for each privacy attribute across the entire VISPR dataset and its respective training, validation, and test splits. The visualizations reveal two primary challenges inherent to this dataset:
Figure 4. Distribution of positive samples for each privacy attribute across different data splits in the VISPR dataset. The charts illustrate the severe class imbalance and few-shot learning challenges.
Extreme Class Imbalance: The dataset exhibits a classic long-tailed distribution. Common attributes such as a17_color and a4_gender have over 10,000 positive samples in total, providing enough data for training. In contrast, many critical privacy attributes are extremely rare. For example, the a7_fingerprint attribute has only 46 samples in the entire dataset, and a21_full_nudity has only 51.
Severe Few-Shot Learning Problem: This imbalance directly leads to a few-shot learning scenario for many crucial classes. As shown in the training set distribution, the model has very limited data to learn from for the most sensitive privacy attributes. For instance, there are only 24 training samples for a7_fingerprint, 21 for a21_full_nudity, 21 for a79_address_home_partial, and 33 for a32_drivers_license.
These data characteristics pose a significant challenge, as a model trained on such imbalanced data can become biased towards the majority classes while failing to reliably detect the rare but critical ones. While our evaluation is conducted on the VISPR dataset, its selection is deliberate for validating the robustness and real-world applicability. VISPR is not only the standard benchmark used in seminal works, enabling a direct and fair comparison, but also a well-design dataset encapsulated the core challenges of real-world visual privacy governance. Its 68 fine-grained attributes are highly representative of the diverse privacy risks found in user-generated content on Internet. More importantly, the severe class imbalance and few-shot learning problems inherent in the dataset serve as a realistic proxy for the natural rarity of sensitive privacy attributes in the real-world. Many researchers have shown strong performance on VISPR to prove its robustness against long-tailed distributions and its capability to detect infrequent yet critical privacy threats, thus convincingly demonstrating its utility for the target application. As a single dataset cannot fully capture all aspects of robustness, extending evaluation to additional datasets and cross-domain scenarios is an important direction for future work. To mitigate this, we employ a weighted loss function during training, as detailed in Section 4.3.

4.2. A New SOTA Architectures with ConvNeXt-Base Model

To validate our first contribution of establishing a new SOTA baseline with modern architectures, we compare our fully optimized model against the previous method, ResNet-50+PSSA. Our model utilizes a ConvNeXt-Base model pretrained on ImageNet as its backbone for feature extraction. The output dimension of the CNN backbone is 1024. A key feature of our architecture is a dual-head classifier design. In addition to a standard linear classifier head, we incorporate a GCN head to model label correlations. The final prediction is a weighted ensemble of the outputs from both heads, where the weights (alpha and beta) are learnable parameters optimized during training. The learned weights from our best model were alpha = 1.1119 and beta = 0.9838.
For the 2 layered GCN components:
Label Embeddings: We use pretrained CLIP text embeddings (512-dim) as the initial node features for the attributes, capturing rich semantic meaning [].
Graph Construction: The adjacency matrix, which defines the label graph structure, is constructed using a PMI-KNN approach. We compute the Positive Pointwise Mutual Information (PMI) between all label pairs from the training set and then build a sparse graph by connecting each label to its k = 15 nearest neighbors []. A self-loop weight of p = 0.25 is applied to each node. This method proved more effective than a simpler binary adjacency matrix based on a conditional probability threshold (t = 0.4).
The model is trained for 15 epochs with a batch size of 36. We use the Adam optimizer with a learning rate of 1 × 10⁻⁴ and a weight decay of 1 × 10⁻⁴ []. The learning rate is managed by a cosine decay scheduler with a 3-epoch linear warmup. To handle the severe class imbalance inherent in the dataset, we employ the BCEWithLogitsLoss criterion with positive class weighting (pos_weight), where weights are inversely proportional to class frequencies. To accelerate training, we utilize Automatic Mixed Precision (AMP). For evaluation, we report mean Average Precision (mAP), overall precision (OP), overall recall (OR), and overall F1-score (OF1). We use standard terminology: TP = true positives, FP = false positives, and FN = false negatives. mAP is computed by first obtaining, for each class, the average precision (AP) as the area under that class’s precision–recall curve using the ranked prediction scores without thresholding; mAP is the mean of AP over all classes. OP/OR/OF1 are overall metrics, obtained by aggregating TP, FP, and FN over all images and classes before computing precision, recall, and their harmonic mean. Notably, to achieve optimal OF1, we determine a per-class decision threshold on the validation set and apply these thresholds to the test set.
As shown in Table 1, our method has outperformed [] by 6% in mAP. Furthermore, it demonstrates a deliberate and favorable performance trade-off. It achieves a substantial 14.7 percentage point increase in OR at the cost of 0.007 drop in OP. This design, which errs on the side of caution, is critical for privacy applications where failing to detect a risk is significantly more costly than a false alarm. Consequently, the OF1 is the most pertinent metric, as it reflects this essential balance between risk sensitivity and practical usability.
Table 1. Comparison with the previous method on the VISPR dataset.

4.3. Structured Label Correlations with GCN

To demonstrate our second contribution, the effectiveness of using GCN to model label correlations, we compared the performance of the linear head (CNN only), the GCN head (GCN only), and the final weighted ensemble model. A powerful backbone is fundamental to extracting rich visual features. To select the best-performing backbone, we evaluated several mainstream pretrained models on our task. The Configuration column specifies the classification head used (Linear or GCN) and, where applicable, the training protocol (e.g., Oversampling + Dropout). As shown in Table 2, models based on the ConvNeXt architecture consistently demonstrated the highest performance ceiling, particularly in mAP and OR metrics. Its modern convolutional design proved highly effective for this fine-grained recognition task. Therefore, we selected ConvNeXt-Base as the backbone for all subsequent optimization experiments.
Table 2. Performance comparison of different backbones.
After selecting ConvNeXt-Base as the backbone, we conducted further studies to determine the optimal configuration for our GCN head, focusing on the label embedding method and the graph construction strategy. The results shown in Table 3 indicate that while using GloVe embeddings with a binary adjacency matrix yielded the highest mAP, the combination of CLIP embeddings and a PMI-KNN graph achieved the best OF1 score (0.770). We attribute this to CLIP’s richer semantic representations and PMI-KNN’s more precise modeling of label correlations. Given our emphasis on building a balanced and reliable system, we selected this combination for our final model.
Table 3. Performance comparison of different GCN component configurations.
We validate our core architectural design: a dual-head that combines a standard linear classifier with our optimized GCN classifier. The results shown in Table 4 clearly indicate the complementary nature of the two heads. The CNN-only head is a high-recall, low-precision detector, while the GCN-only head is a high-precision, low-recall classifier. Our model successfully synergizes these strengths, achieving the best performance across both mAP and, crucially, the OF1. We posit that the GCN head functions not as a standalone predictor, but as a semantic consistency regulator. The CNN-only head, operating directly on rich visual features, acts as a high-recall, low-precision detector; it excels at proposing a wide range of potential privacy attributes but is prone to making uncorrelated errors. Conversely, the GCN-only head demonstrates high-precision but low-recall characteristics. This is because it lacks direct visual grounding and primarily makes decisions based on the relational structure of the label graph.
Table 4. Head ablation on the VISPR dataset.
Therefore, the abysmal standalone performance of the GCN head is expected. Its contribution materializes in the ensemble, where it modulates the initial, high-recall predictions from the CNN. By leveraging the learned label correlations, the GCN can suppress semantically implausible predictions and amplify combinations of attributes that are logically coherent, thereby correcting the CNN’s errors. This synergy allows our final model to successfully synergize these complementary strengths, achieving the best performance across both mAP and, crucially, the OF1 score.
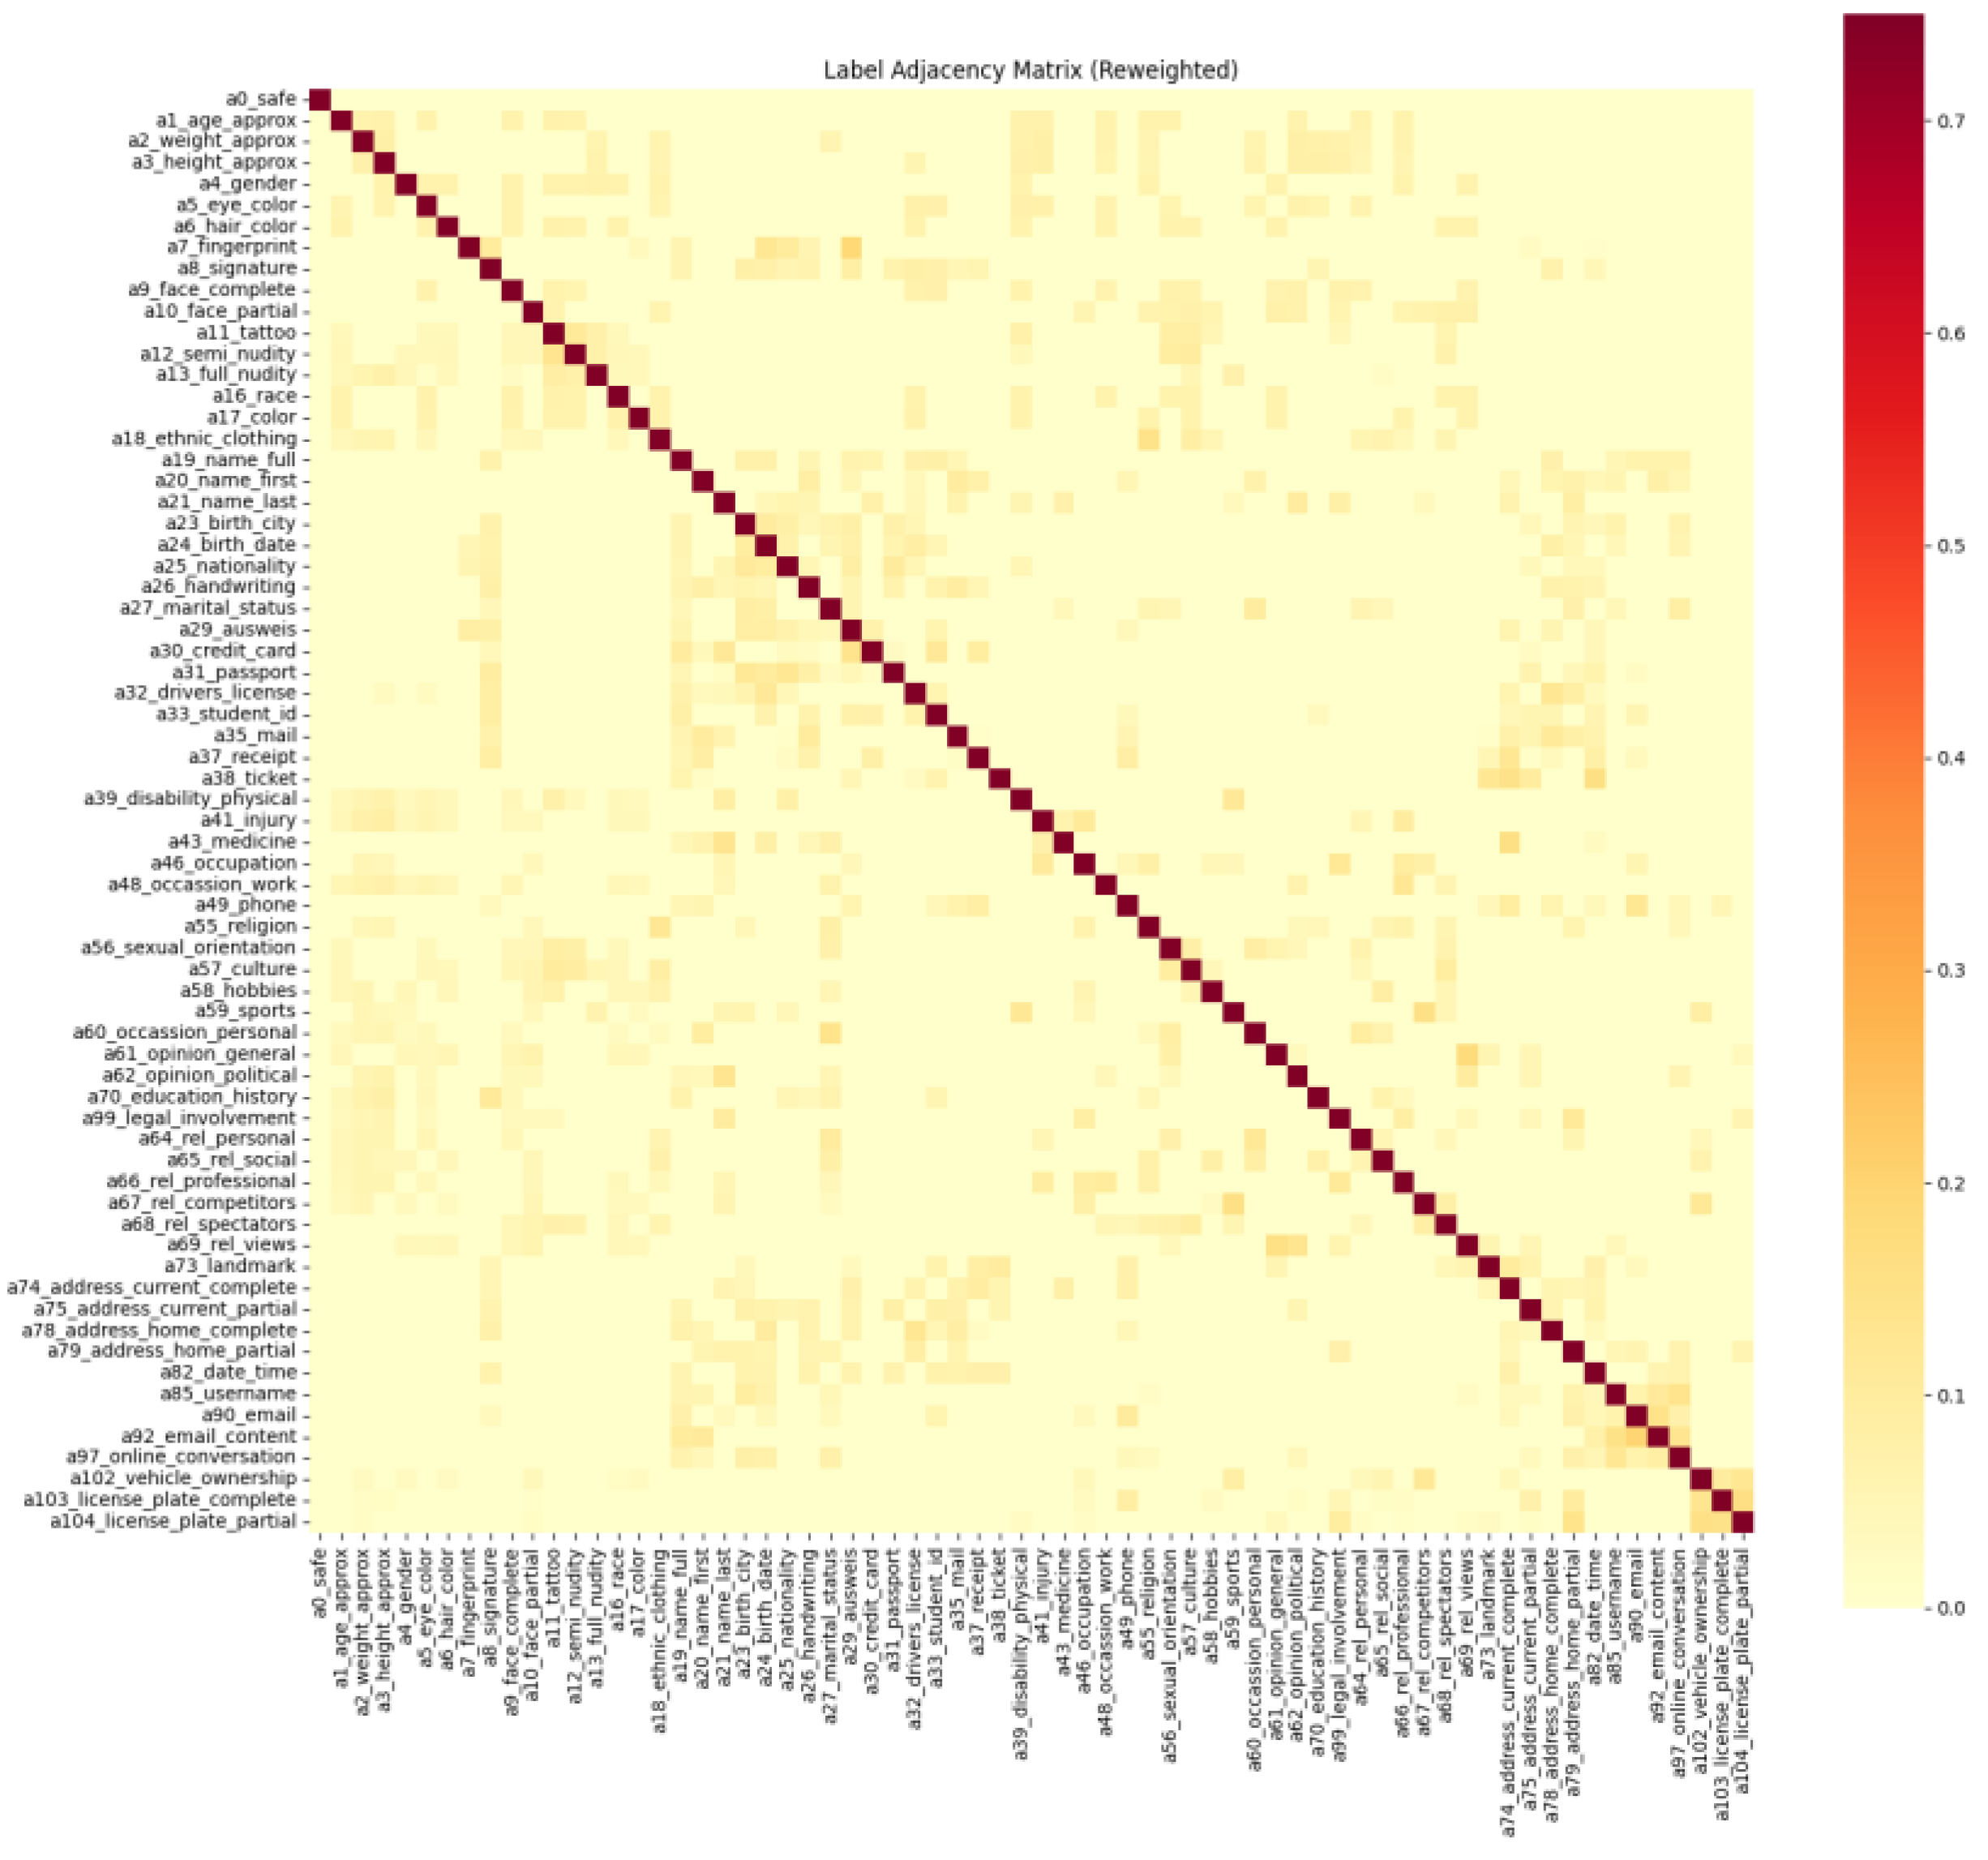
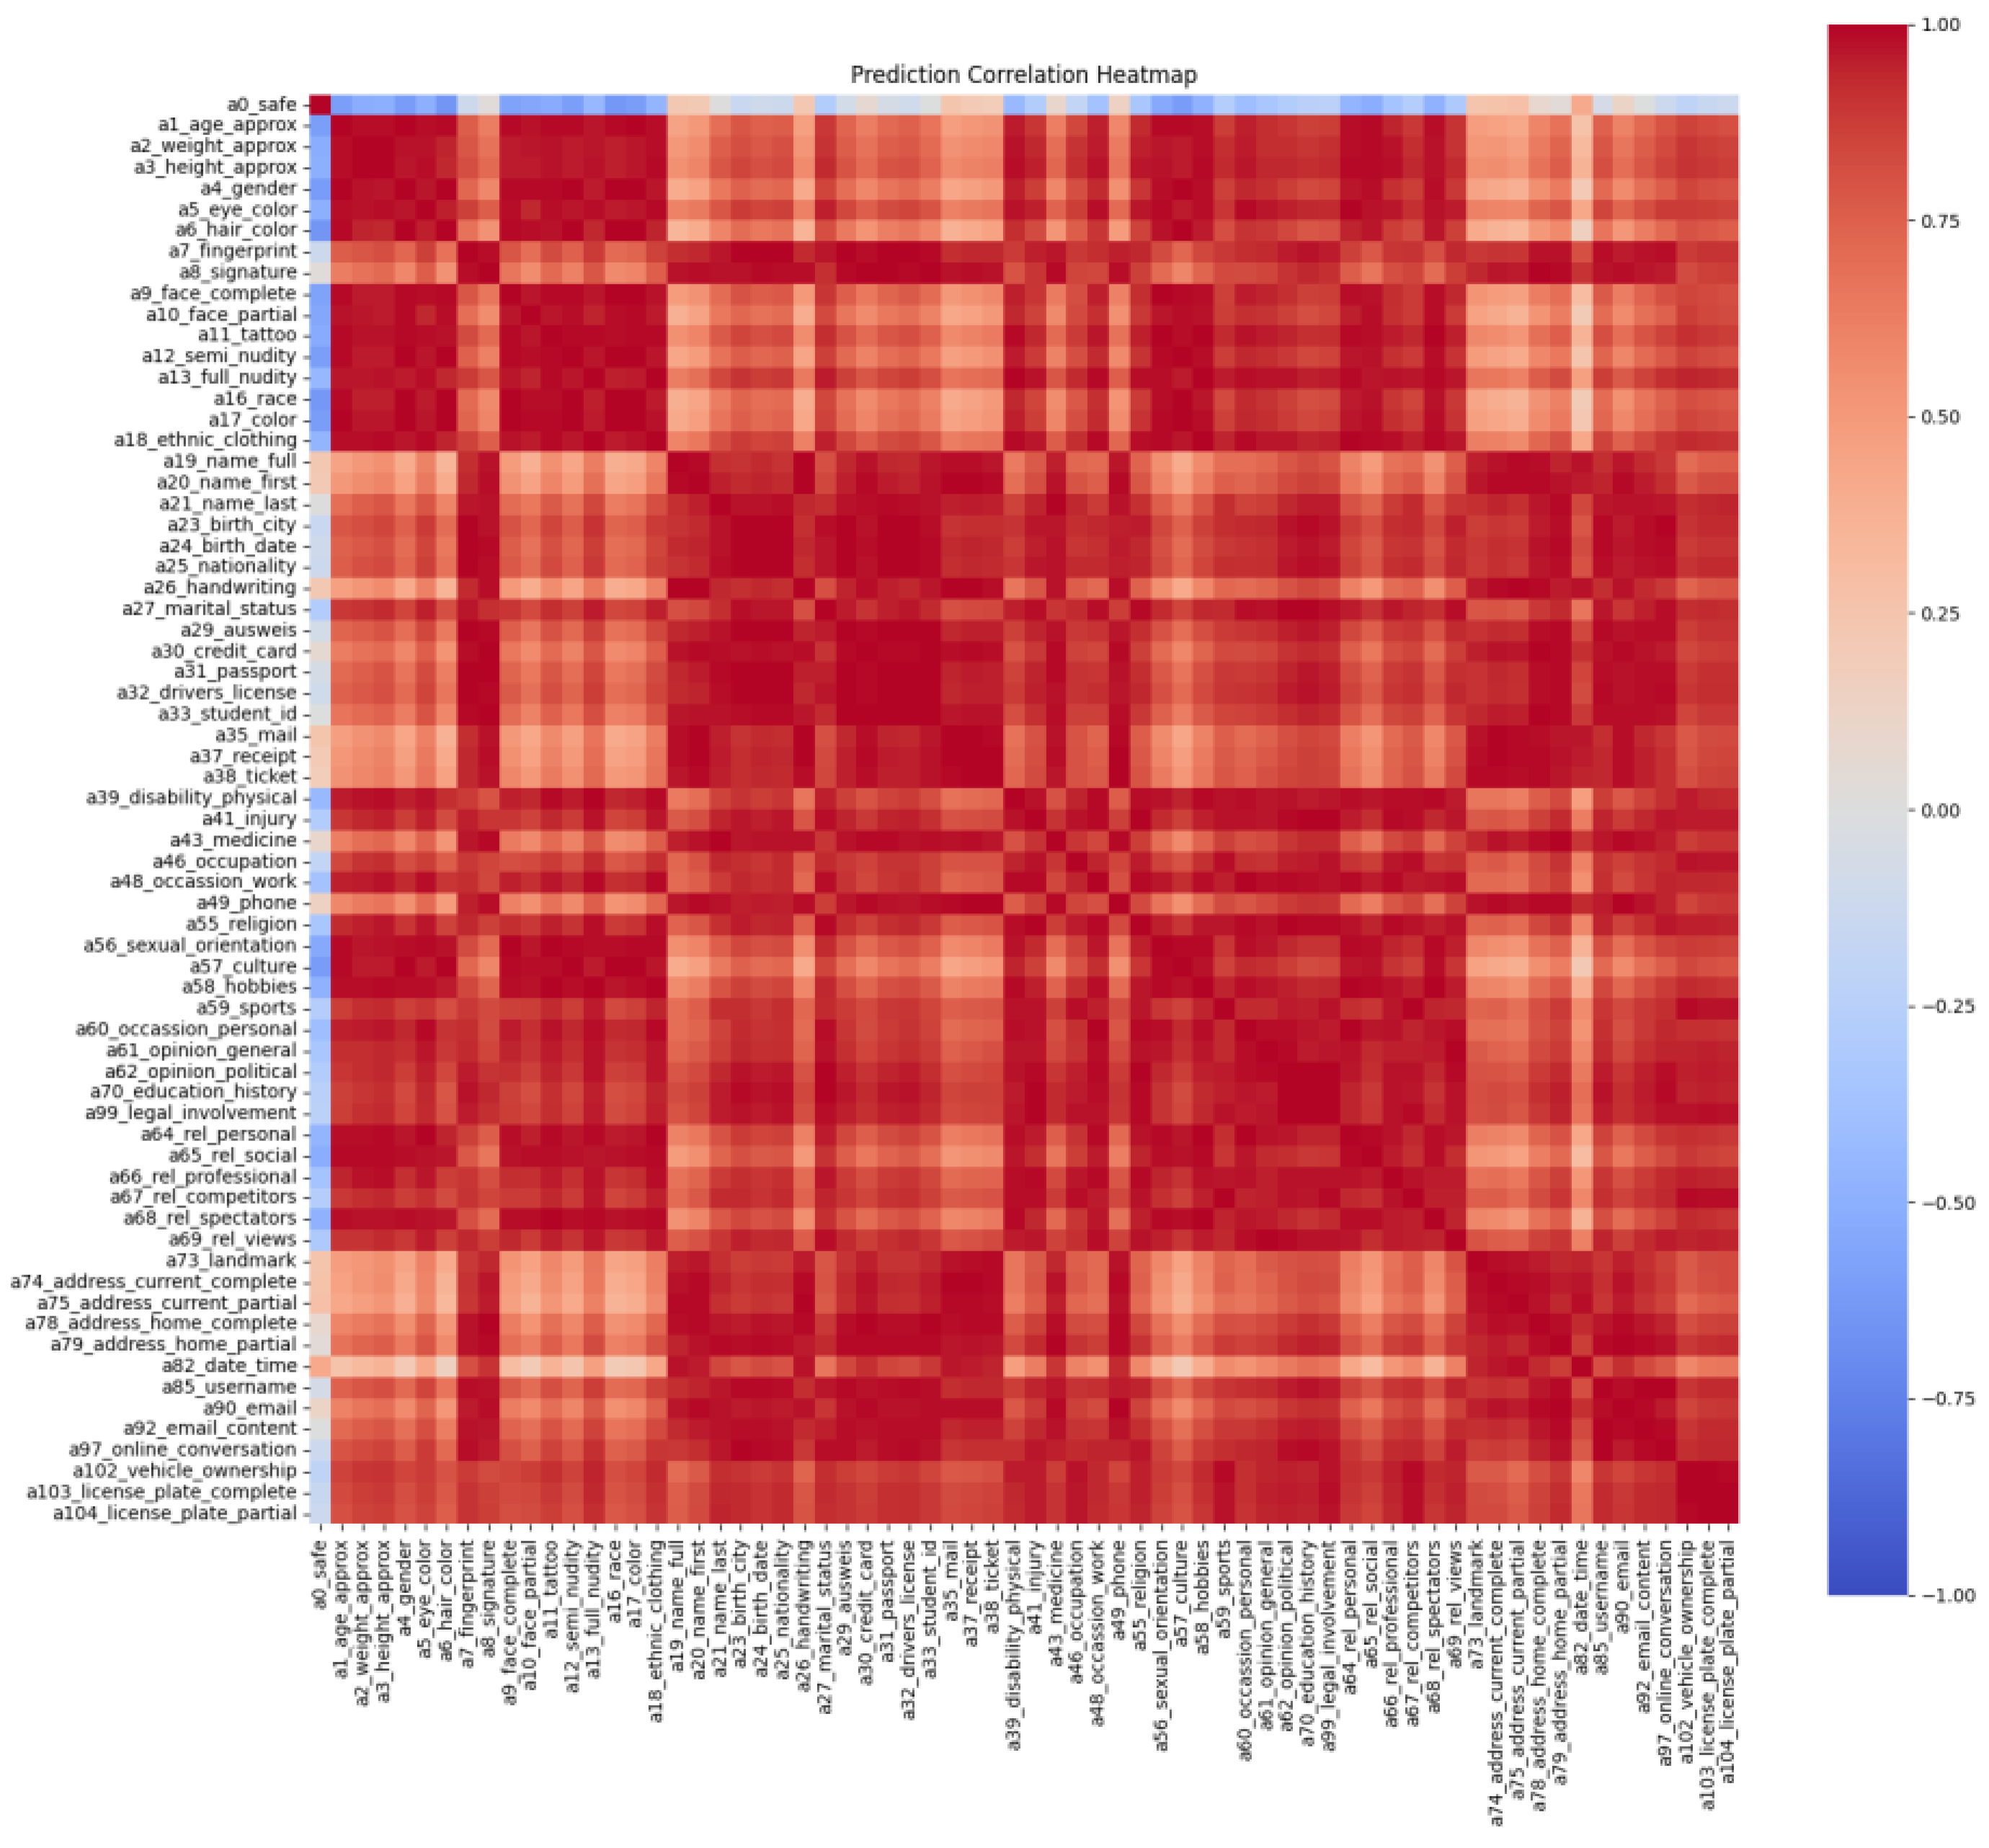
To qualitatively demonstrate the effectiveness of our GCN head in modeling label correlations, we visualize and compare the prediction correlation matrices generated by the linear head versus the GCN head, as shown from Figure 5, Figure 6 and Figure 7. Figure 5 shows the prediction correlation from the standard linear head. As observed, outside of the main diagonal, the heatmap is largely unstructured and pale. This indicates that the predictions for different attributes are largely uncorrelated, as the model treats each label as an independent classification task. For instance, the model might predict a high probability for a31_passport without necessarily increasing its confidence for a9_face_complete. Figure 6 displays the label adjacency matrix, which encodes the co-occurrence relationships between attributes learned from the training data. This matrix serves as the structural prior for our GCN, with brighter spots indicating stronger correlations between attributes. Figure 7 shows the prediction correlation from our GCN head. In contrast to the linear head’s heatmap, the prediction correlation from our GCN head exhibits strong, block-like structures. These red blocks (positive correlation) clearly mirror the relationships defined in the adjacency matrix. For example, attributes related to personal identity like a31_passport, a9_face_complete, a20_name_first, and a21_name_last now show strong positive correlations in their predictions. This visually confirms that our GCN head has successfully learned to leverage the label graph to produce structured and logically coherent predictions. This visual evidence strongly supports our claim that incorporating a GCN is a crucial step toward building a more intelligent and context-aware privacy detection system.
Figure 5. Unstructured Predictions from the Linear Head. This heatmap visualizes the prediction correlations from the CNN-only classifier. The lack of strong off-diagonal patterns indicates that the model treats each privacy attribute independently, failing to capture their real-world relationships.
Figure 6. The PMI-KNN label adjacency matrix used by the GCN, which visualizes the co-occurrence relationships between attributes and serves as structured prior knowledge.
Figure 7. Structured Predictions from the GCN Head. In contrast to the linear head, the GCN head produces highly structured predictions, as shown by the distinct block-like correlations. These patterns closely mirror the adjacency matrix in Figure 4, visually confirming that the GCN successfully leverages the label graph to enforce semantic consistency.

4.4. Dynamic Personalization with FRL

To evaluate the effectiveness of our FRL module in adapting to diverse user preferences, we designed a simulation-based experiment, as collecting real-world, long-term user feedback is impractical. We simulated five distinct user personas to represent a variety of privacy concerns: Techie, Social, Family, Financial, and PrivacyGrade. Each persona’s preferences are defined by a set of keywords that map to specific privacy attributes, allowing for automated reward generation. The overall training process followed the Federated Averaging paradigm over 5 communication rounds, where each client trained a local Deep Q-Network agent for 50 epochs before model aggregation. The final evaluation was conducted on a set of 100 images over 40 rounds of simulated interaction. In each round, the agent performed inference, received simulated feedback, and then underwent online fine-tuning driven by an asymmetrical reward system where incorrect suggestions were penalized more heavily (reward = −3) to encourage the agent to prioritize user satisfaction.
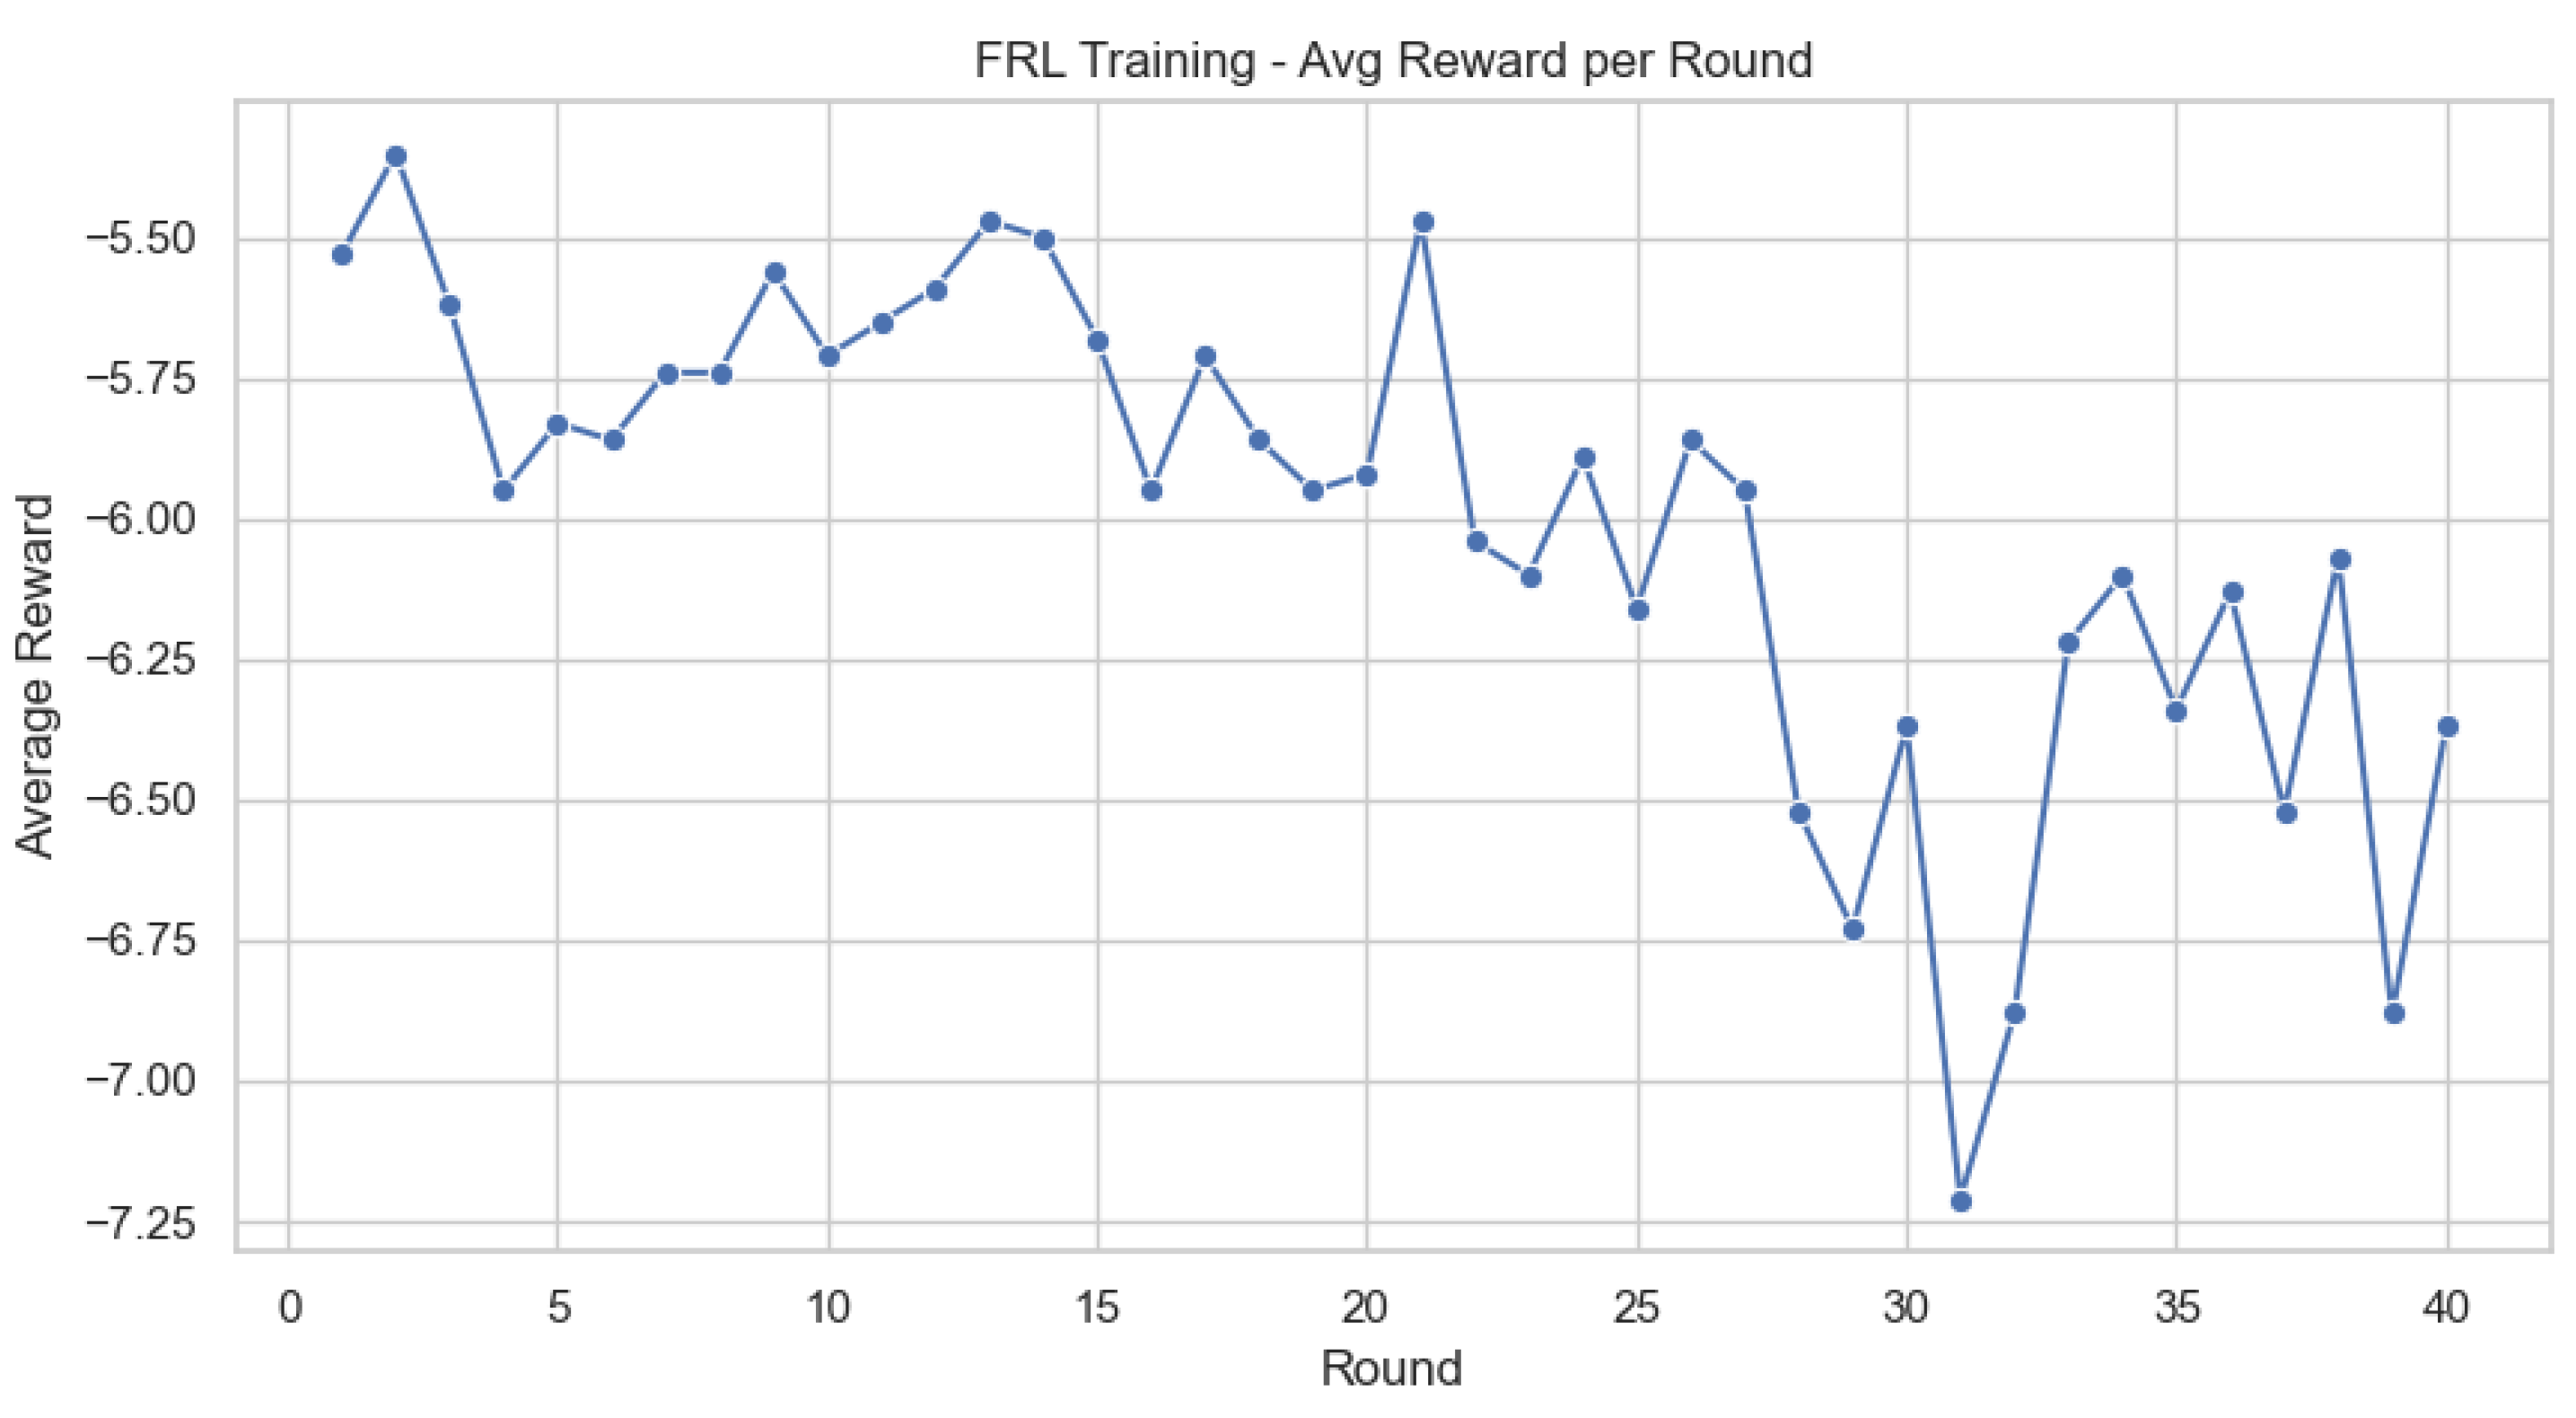
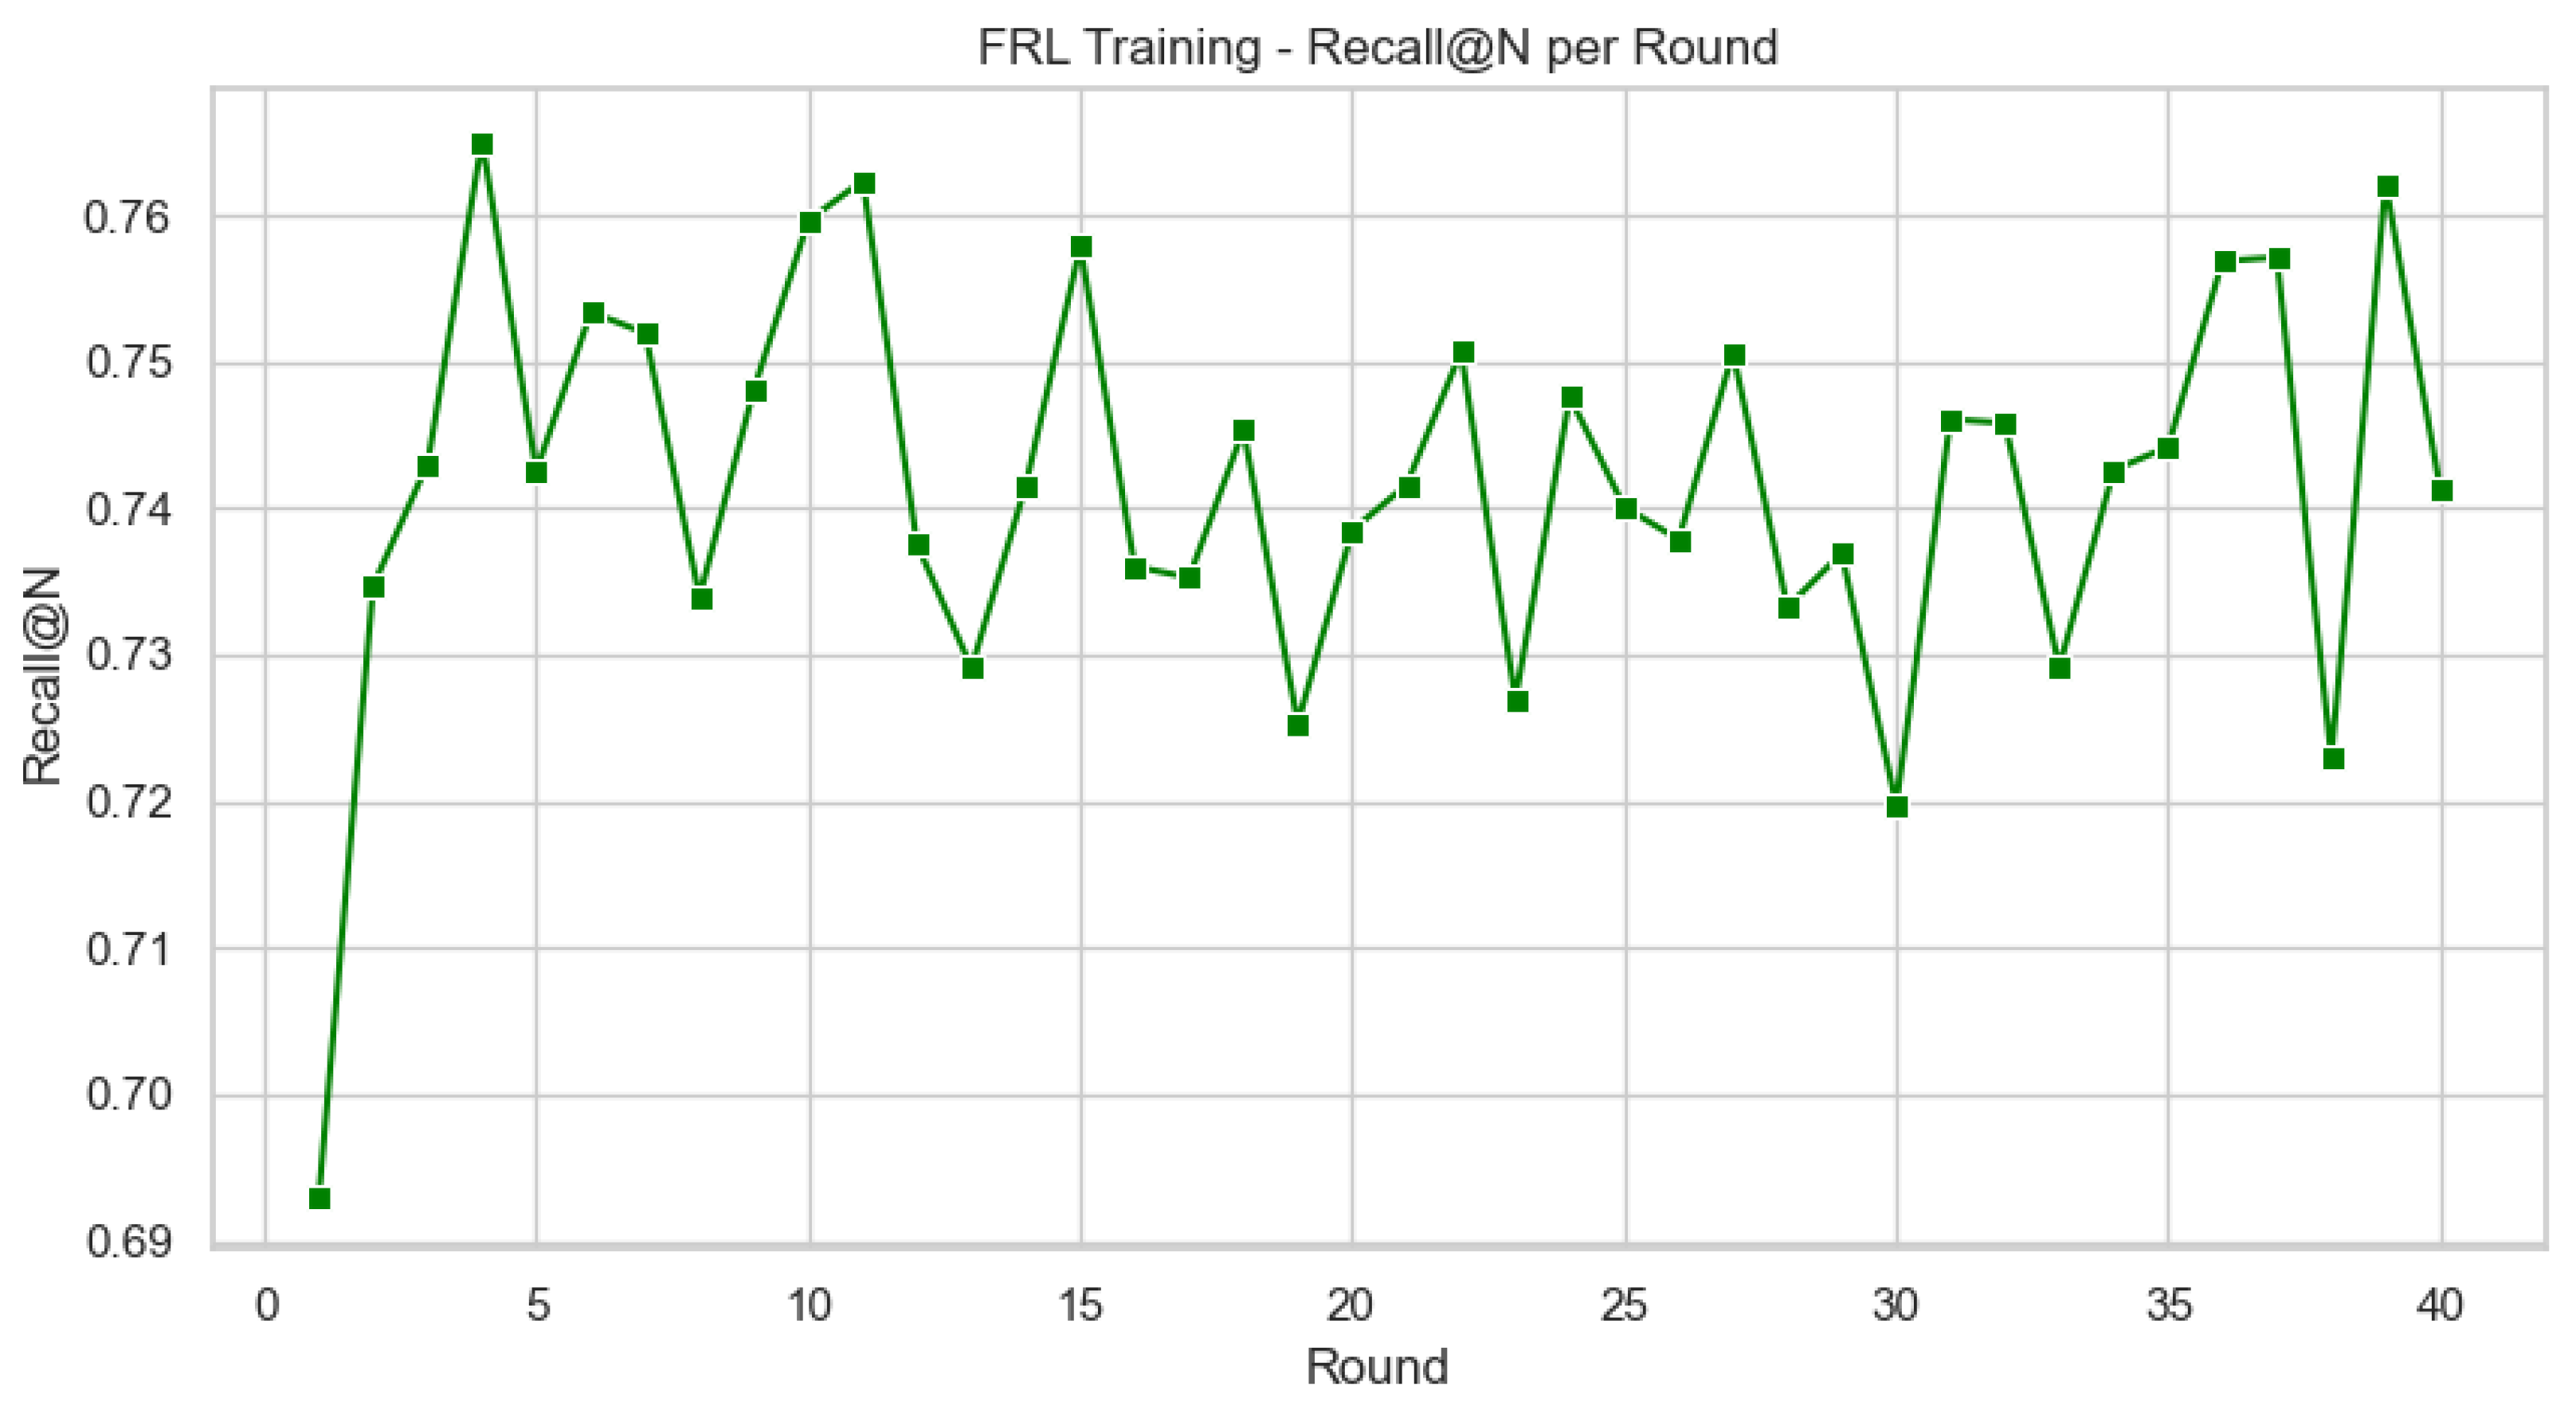
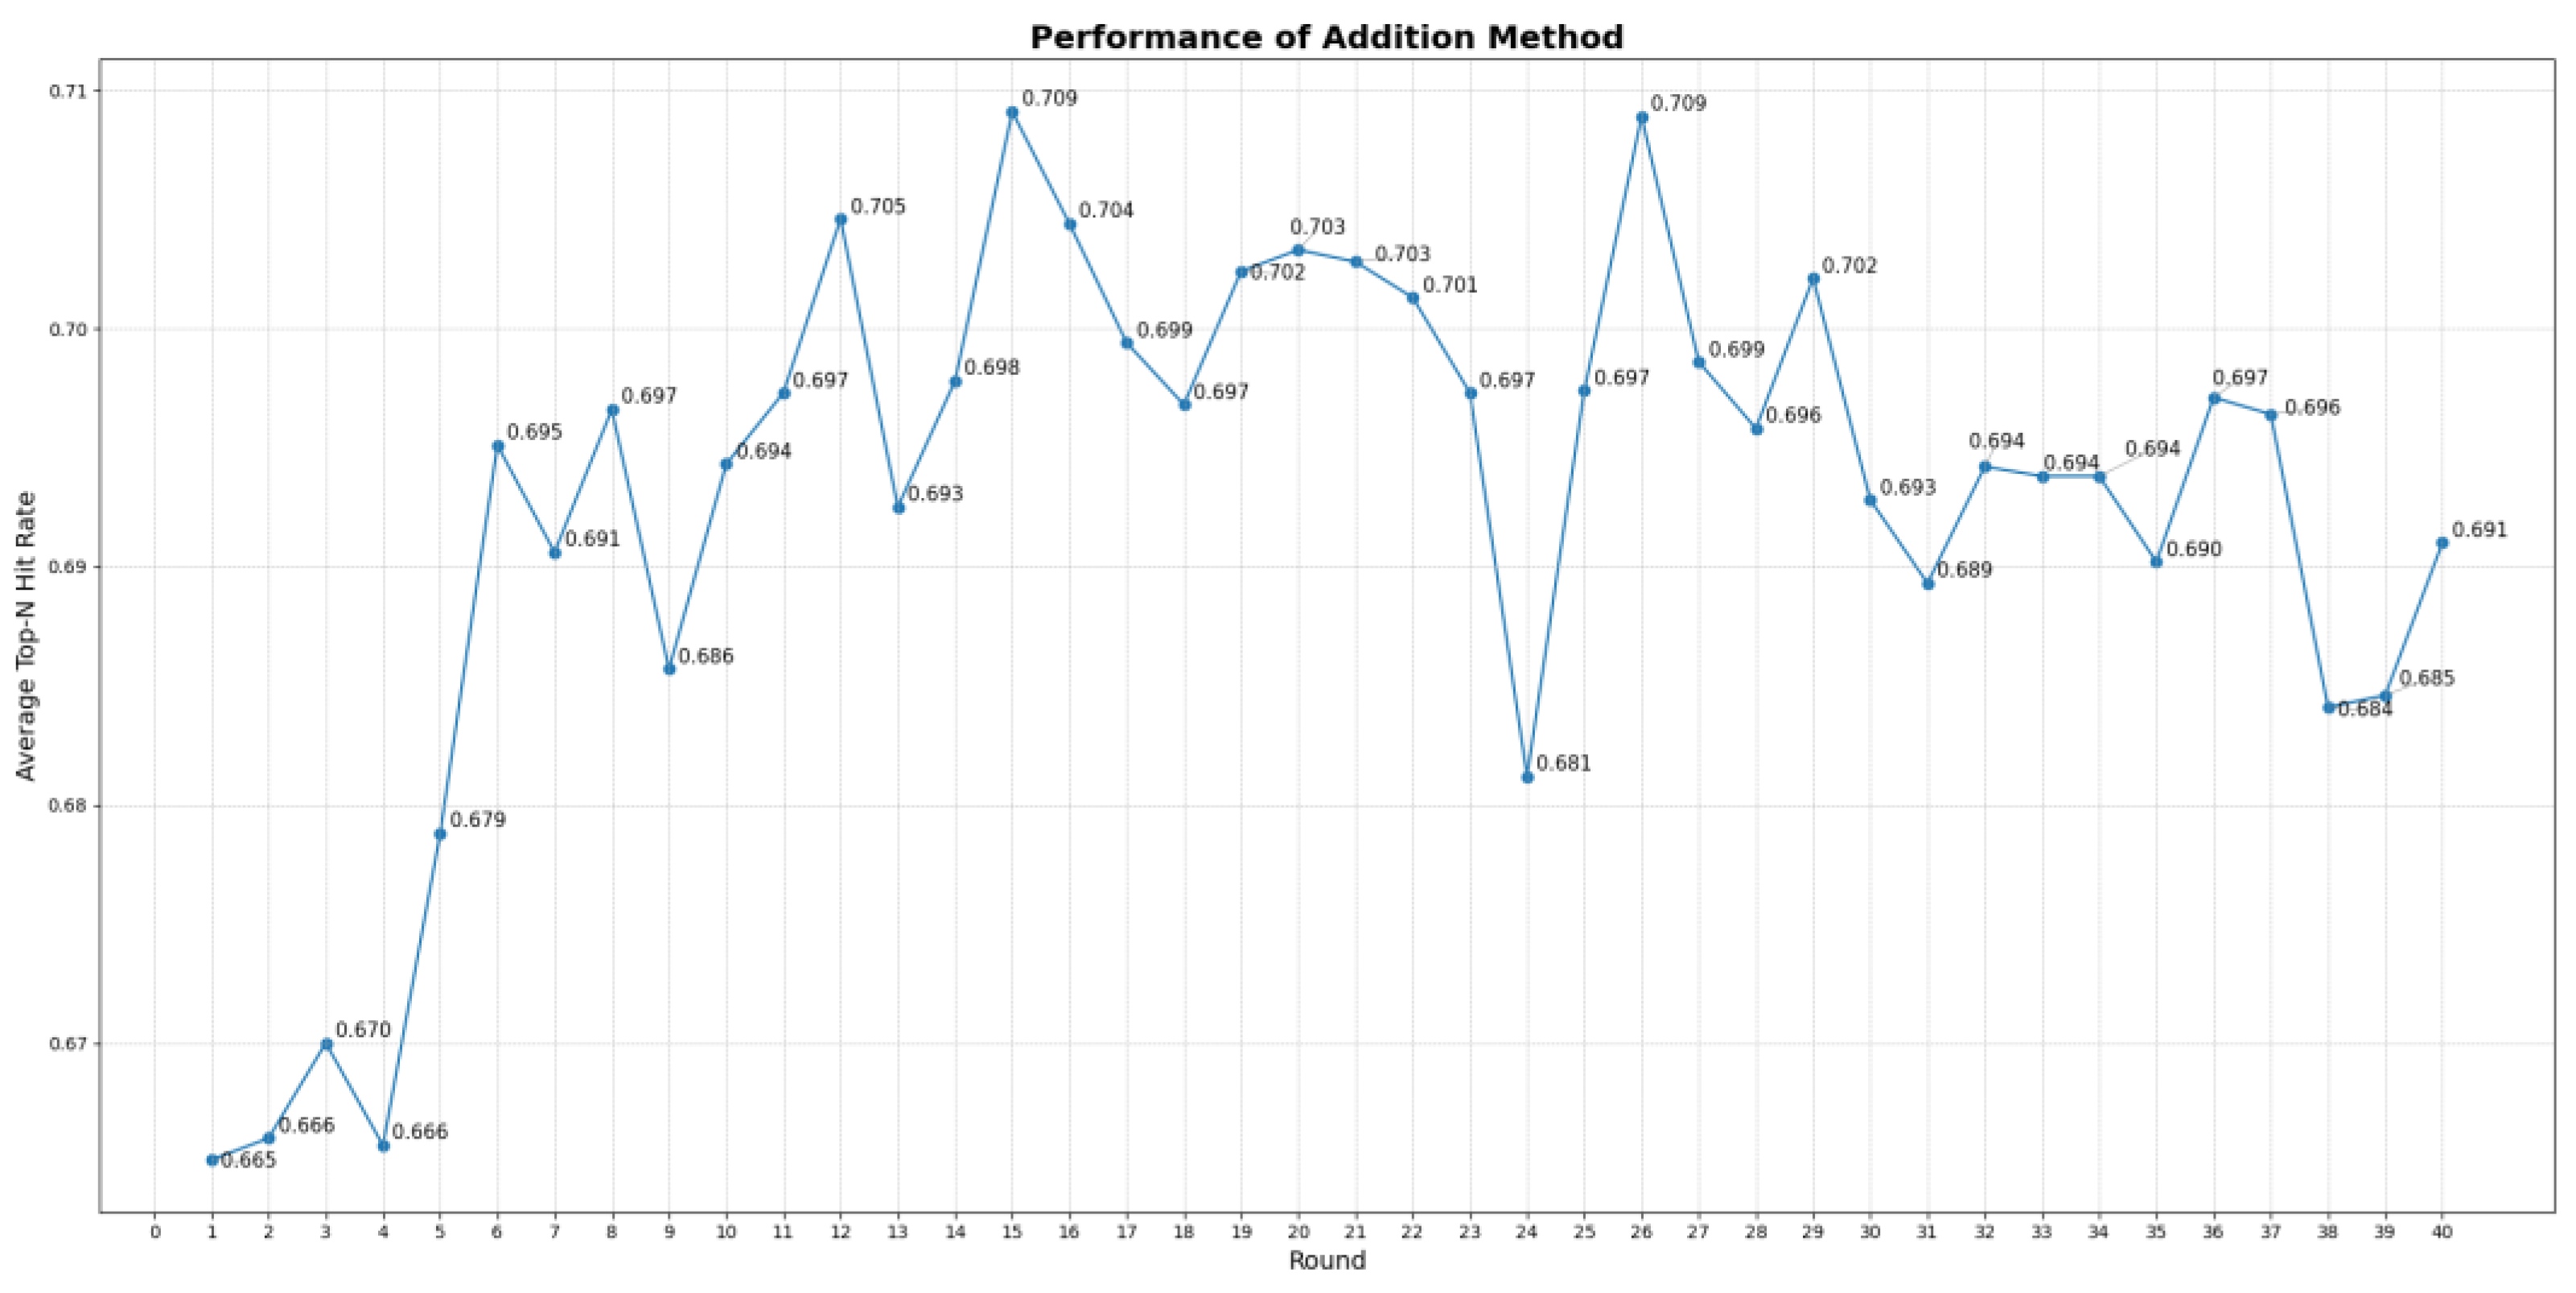
Figure 8 shows the average reward trajectory over 40 rounds. Despite the asymmetric penalty design pushing the absolute reward downward over time, the agent’s retrieval quality remains stable (and slightly improves) as seen in Figure 9, where Recall@N stays in the ~0.74–0.76 band for most rounds. This decoupling is expected because we weigh corrections more than confirmations, deliberately biasing the scalar reward to prioritize user satisfaction when mistakes occur. Most importantly, the multiplicative rule consistently outperforms additive fusion (Figure 10 vs. Figure 11). The multiplicative method reaches a best Top-N hit rate around 0.77 and stabilizes near 0.74–0.76 after early rounds, whereas the additive rule peaks near 0.71 and hovers around 0.69–0.70 thereafter. This confirms that consensus-seeking fusion amplifies agreements across clients while suppressing noisy local preferences, yielding higher and more stable personalization quality. Taken together, these results demonstrate that our FRL module learns persona-specific preferences online without centralizing user data, maintains strong retrieval quality under asymmetric feedback, and benefits materially from consensus-based (multiplicative) aggregation on the server. In practice, this means the system adapts to individual users while remaining robust to client heterogeneity, precisely the behavior the personalization layer is designed to achieve.
Figure 8. Average Reward Trajectory During FRL Personalization. The plot shows the average reward per round for the agent. The gradual downward trend is an expected outcome of our asymmetric feedback model, where incorrect suggestions are penalized more heavily than correct ones are rewarded.
Figure 9. Recall@N across rounds during FRL personalization. This plot demonstrates that despite the reward trend seen in Figure 6, the agent’s practical performance, measured by Recall@N, remains high and stable after the initial learning phase. This confirms that the agent is effectively learning and adapting to the user persona’s preferences throughout the interaction.
Figure 10. Top-N hit rate with multiplicative fusion (40 rounds). This graph shows the Top-N hit rate using the multiplicative aggregation method. The performance quickly stabilizes in a high range (0.74–0.76), demonstrating that this consensus-based approach effectively amplifies shared preferences across clients, leading to robust and superior personalization quality.
Figure 11. Top-N hit rate with additive fusion (40 rounds). In contrast to the multiplicative method in Figure 8, the additive fusion approach shown here achieves a lower and less stable Top-N hit rate, hovering around 0.69–0.70. This comparison highlights the superiority of the consensus-seeking multiplicative approach for handling diverse user preferences in a federated setting.

4.5. Computational Cost

To validate the real-world applicability of our proposed framework, particularly its feasibility for deployment on resource-constrained edge devices within a federated learning setting, we conducted a comprehensive evaluation of its computational cost. This section presents a detailed analysis of three key aspects: model size, training and fine-tuning costs, and inference latency. All performance benchmarks were conducted on a desktop computer with Intel i5-9400F CPU, RTX 3060 12 GB GPU, 32 GB RAM. In a federated learning architecture, the computational load is strategically divided between server-side initial training and client-side continuous fine-tuning. On our experimental platform, training the core model for 15 epochs took 1 h, 8 min, and 53 s, with a peak memory usage of 1905.33 MB. This phase corresponds to the server-side training in a federated setup. As a one-time, offline process, it does not consume resources on the end-user’s device. We simulated the on-device personalization scenario by performing 40 rounds of updates using 100 images. Low inference latency is essential for a seamless user experience. We measured the inference latency of our framework with the following results:
  • Average Classifier Latency: 19.1322 ms/image
  • Average RL Agent Latency: 0.5352 ms/image
  • Average Total Inference Latency: 19.6675 ms/image
The total inference latency of under 20 ms allows the system to operate at over 50 Frames Per Second, which is more than sufficient for real-time applications. Notably, the decision-making overhead of the RL agent constitutes only 2.7% of the total latency, demonstrating that our framework can provide sophisticated personalization with minimal performance impact.
Our analysis shows that the proposed framework achieves an excellent balance between computational performance and deployment feasibility. By design, the most resource-intensive training tasks are offloaded to a central server, while the on-device operations remain lightweight and efficient. The experimental data confirms that our framework possesses a manageable model size, highly efficient personalization fine-tuning, and outstanding real-time inference speed, validating its feasibility for deployment on resource-constrained edge devices.

5. Conclusions and Future Works

In this paper, we proposed a comprehensive visual privacy governance framework to address the limitations of prior work: legacy architectures, failure to model label correlations, and static user preference models. Our framework utilizes a modern ConvNeXt backbone with an innovative dual-head GCN classifier to model label correlations, alongside a FRL module for dynamic privacy-preserving. Experiments on the VISPR dataset show that our recognition model can outperform the previous method by 6% in mAP while achieving a 10% higher OF1.
Looking ahead, our primary focus is to build upon this foundation to enhance its real-world applicability. First, to confirm the generalization of our core recognition model, future work will involve evaluation of additional privacy datasets and diverse real-world collections. A second key priority is to validate the FRL module beyond simulated personas by conducting controlled user studies with real-world feedback, a task for which our privacy-preserving federated architecture is inherently well-suited. Furthermore, to improve reliability, future iterations must address the challenges of severe class imbalance and concept drift. We plan to explore advanced few-shot learning methodologies for rare attributes and integrate continual learning frameworks to ensure the system can adapt to new privacy categories and evolving societal norms. In parallel, we will tighten on-device efficiency through model compression and extend the framework’s scope to video privacy by modeling spatiotemporal correlations, further broadening its impact on protecting user privacy in a dynamic digital world.

Author Contributions

Conceptualization, R.-I.C. and C.Y.; Methodology, R.-I.C. and C.Y.; Software, C.Y. and W.-X.L.; Validation, C.Y. and W.-X.L.; Formal Analysis, R.-I.C. and C.Y.; Investigation, R.-I.C. and C.Y.; Data Curation, C.Y. and W.-X.L.; Writing—Original Draft Preparation, R.-I.C. and C.Y.; Writing—Review and Editing, R.-I.C. and C.Y.; Visualization, R.-I.C. and C.Y.; Supervision, R.-I.C.; Project Administration, R.-I.C.; Funding Acquisition, R.-I.C. All authors have read and agreed to the published version of the manuscript.

Funding

This research received no external funding.

Data Availability Statement

The research presented in this study is based on the publicly available VISPR dataset, which can be accessed at https://tribhuvanesh.github.io/vpa/ (accessed on 15 August 2025). No new data were created during this study.

Conflicts of Interest

The authors declare no conflicts of interest.

Abbreviations

The following abbreviations are used in this manuscript:
mAPmean Average Precision
OPOverall Precision
OROverall Recall
OF1Overall F1-score
GCNGraph Convolutional Network
FLFederated Learning
RLReinforcement Learning
FRLFederated Reinforcement Learning
CNNConvolutional Neural Network
ViTVision Transformer
ResNetResidual Network
GNNGraph Neural Network
MLRMulti-Label Image Recognition
VISPRVisual Privacy Dataset
PSSAPrivacy-Specific Spatial Attention
CLIPContrastive Language–Image Pre-training
GloVeGlobal Vectors for Word Representation
PMIPositive Pointwise Mutual Information
KNNk-Nearest Neighbors
PMI-KNNPMI-based kNN graph
MLPMulti-Layer Perceptron
DQNDeep Q-Network
AMPAutomatic Mixed Precision
BCEWithLogitsLossBinary Cross-Entropy with Logits Loss
pos_weightpositive class weighting
AdamAdaptive Moment Estimation
AdamWAdam with decoupled Weight Decay
GELUGaussian Error Linear Unit
LeakyReLULeaky Rectified Linear Unit
SVMSupport Vector Machines
NLPNatural Language Processing

References

  1. Gross, R.; Acquisti, A. Information revelation and privacy in online social networks. In Proceedings of the 2005 ACM Workshop on Privacy in the Electronic Society, Alexandria, VA, USA, 7 November 2005; pp. 71–80. [Google Scholar]
  2. Kokolakis, S. Privacy attitudes and privacy behaviour: A review of current research on the privacy paradox phenomenon. Comput. Secur. 2017, 64, 122–134. [Google Scholar] [CrossRef]
  3. Jiang, H.; Zuo, J.; Lu, Y. Connecting Visual Data to Privacy: Predicting and Measuring Privacy Risks in Images. Electronics 2025, 14, 811. [Google Scholar] [CrossRef]
  4. He, K.; Zhang, X.; Ren, S.; Sun, J. Deep residual learning for image recognition. In Proceedings of the IEEE Conference on Computer Vision and Pattern Recognition, Las Vegas, NV, USA, 27–30 June 2016; pp. 770–778. [Google Scholar]
  5. Dosovitskiy, A.; Beyer, L.; Kolesnikov, A.; Weissenborn, D.; Zhai, X.; Unterthiner, T.; Dehghani, M.; Minderer, M.; Heigold, G.; Gelly, S. An image is worth 16 × 16 words: Transformers for image recognition at scale. arXiv 2020, arXiv:2010.11929. [Google Scholar]
  6. Liu, Z.; Mao, H.; Wu, C.-Y.; Feichtenhofer, C.; Darrell, T.; Xie, S. A convnet for the 2020s. In Proceedings of the IEEE/CVF Conference on Computer Vision and Pattern Recognition, New Orleans, LA, USA, 18–24 June 2022; pp. 11976–11986. [Google Scholar]
  7. Chen, Z.-M.; Wei, X.-S.; Wang, P.; Guo, Y. Multi-label image recognition with graph convolutional networks. In Proceedings of the IEEE/CVF Conference on Computer Vision and Pattern Recognition, Long Beach, CA, USA, 16–17 June 2019; pp. 5177–5186. [Google Scholar]
  8. Kairouz, P.; McMahan, H.B.; Avent, B.; Bellet, A.; Bennis, M.; Bhagoji, A.N.; Bonawitz, K.; Charles, Z.; Cormode, G.; Cummings, R. Advances and open problems in federated learning. Found. Trends Mach. Learn. 2021, 14, 1–210. [Google Scholar] [CrossRef]
  9. Qi, J.; Zhou, Q.; Lei, L.; Zheng, K. Federated reinforcement learning: Techniques, applications, and open challenges. arXiv 2021, arXiv:2108.11887. [Google Scholar] [CrossRef]
  10. Orekondy, T.; Schiele, B.; Fritz, M. Towards a visual privacy advisor: Understanding and predicting privacy risks in images. In Proceedings of the IEEE International Conference on Computer Vision, Venice, Italy, 22–29 October 2017; pp. 3686–3695. [Google Scholar]
  11. Liu, Z.; Lin, Y.; Cao, Y.; Hu, H.; Wei, Y.; Zhang, Z.; Lin, S.; Guo, B. Swin transformer: Hierarchical vision transformer using shifted windows. In Proceedings of the IEEE/CVF International Conference on Computer Vision, Montreal, BC, Canada, 11–17 October 2021; pp. 10012–10022. [Google Scholar]
  12. Chen, T.; Xu, M.; Hui, X.; Wu, H.; Lin, L. Learning semantic-specific graph representation for multi-label image recognition. In Proceedings of the IEEE/CVF International Conference on Computer Vision, Seoul, Republic of Korea, 27 October–2 November 2019; pp. 522–531. [Google Scholar]
  13. Guo, H.; Zheng, K.; Fan, X.; Yu, H.; Wang, S. Visual attention consistency under image transforms for multi-label image classification. In Proceedings of the IEEE/CVF Conference on Computer Vision and Pattern Recognition, Long Beach, CA, USA, 15–20 June 2019; pp. 729–739. [Google Scholar]
  14. Lanchantin, J.; Wang, T.; Ordonez, V.; Qi, Y. General multi-label image classification with transformers. In Proceedings of the IEEE/CVF Conference on Computer Vision and Pattern Recognition, Nashville, TN, USA, 20–25 June 2021; pp. 16478–16488. [Google Scholar]
  15. Zhao, J.; Yan, K.; Zhao, Y.; Guo, X.; Huang, F.; Li, J. Transformer-based dual relation graph for multi-label image recognition. In Proceedings of the IEEE/CVF International Conference on Computer Vision, Montreal, BC, Canada, 11–17 October 2021; pp. 163–172. [Google Scholar]
  16. Pati, S.; Kumar, S.; Varma, A.; Edwards, B.; Lu, C.; Qu, L.; Wang, J.J.; Lakshminarayanan, A.; Wang, S.-h.; Sheller, M.J. Privacy preservation for federated learning in health care. Patterns 2024, 5, 100974. [Google Scholar] [CrossRef] [PubMed]
  17. Brockman, G.; Cheung, V.; Pettersson, L.; Schneider, J.; Schulman, J.; Tang, J.; Zaremba, W. Openai gym. arXiv 2016, arXiv:1606.01540. [Google Scholar] [CrossRef]
  18. Mnih, V.; Kavukcuoglu, K.; Silver, D.; Rusu, A.A.; Veness, J.; Bellemare, M.G.; Graves, A.; Riedmiller, M.; Fidjeland, A.K.; Ostrovski, G. Human-level control through deep reinforcement learning. Nature 2015, 518, 529–533. [Google Scholar] [CrossRef] [PubMed]
  19. Fallah, A.; Mokhtari, A.; Ozdaglar, A. Personalized federated learning: A meta-learning approach. arXiv 2020, arXiv:2002.07948. [Google Scholar] [CrossRef]
  20. McMahan, B.; Moore, E.; Ramage, D.; Hampson, S.; y Arcas, B.A. Communication-efficient learning of deep networks from decentralized data. In Proceedings of the Artificial Intelligence and Statistics, Fort Lauderdale, FL, USA, 20–22 April 2017; pp. 1273–1282. [Google Scholar]
  21. Radford, A.; Kim, J.W.; Hallacy, C.; Ramesh, A.; Goh, G.; Agarwal, S.; Sastry, G.; Askell, A.; Mishkin, P.; Clark, J. Learning transferable visual models from natural language supervision. In Proceedings of the International Conference on Machine Learning, Virtual, 18–24 July 2021; pp. 8748–8763. [Google Scholar]
  22. Yao, L.; Mao, C.; Luo, Y. Graph convolutional networks for text classification. In Proceedings of the AAAI Conference on Artificial Intelligence, Honolulu, HI, USA, 27 January–1 February 2019; pp. 7370–7377. [Google Scholar]
  23. Kingma, D.P.; Ba, J. Adam: A method for stochastic optimization. arXiv 2014, arXiv:1412.6980. [Google Scholar]
  24. Fang, Y.; Wang, W.; Xie, B.; Sun, Q.; Wu, L.; Wang, X.; Huang, T.; Wang, X.; Cao, Y. Eva: Exploring the limits of masked visual representation learning at scale. In Proceedings of the IEEE/CVF Conference on Computer Vision and Pattern Recognition, Vancouver, BC, Canada, 17–24 June 2023; pp. 19358–19369. [Google Scholar]
Disclaimer/Publisher’s Note: The statements, opinions and data contained in all publications are solely those of the individual author(s) and contributor(s) and not of MDPI and/or the editor(s). MDPI and/or the editor(s) disclaim responsibility for any injury to people or property resulting from any ideas, methods, instructions or products referred to in the content.

Article Metrics

Citations

Article Access Statistics

Multiple requests from the same IP address are counted as one view.