Abstract
The health of electricity meters directly affects measurement accuracy and the interests of users. Traditional evaluation methods for electricity meters are limited by static error detection and manual calibration, and are unable to capture dynamic operating conditions or the complex influence of the power environment. To address this issue, this paper proposes an enhanced Cox proportional hazard (CoxPH) model based on Transformer for evaluating the health of electricity meters through a data-driven approach. This model integrates the data collected by the terminal (such as three-phase voltage, current, power, etc.) and operation and maintenance records. After data preprocessing, key covariates were extracted, including the average values of three-phase voltage and current fluctuations, current polarity reversal, and measurement error. The Transformer-based Cox proportional hazard (Trans CoxPH) model overcomes the linear assumption of the traditional CoxPH model by utilizing the self-attention and multi-head attention mechanisms of Transformer, and is able to capture the nonlinear relationships and time dependencies in time-series power data. Experimental results show that the performance of the Trans CoxPH model is superior to the traditional CoxPH model, temporal convolutional network-based Cox proportional hazard (TCN-CoxPH) model, extreme gradient boosting-based Cox proportional hazard (XGBoost CoxPH) model, and DeepSurvival long short-term memory (DeepSurvival LSTM) model. On the validation set, its concordance index (C-index) reaches 0.7827 with a Brier score of only 0.0501, significantly improving prediction accuracy and generalization ability. This model can effectively identify complex patterns and provides a reliable tool for the intelligent operation and maintenance of a power metering system.
1. Introduction
Electricity meters are the main devices for measuring residential electricity and industrial electricity. The health of a meter greatly affects the accuracy of measurement of electricity consumption, which is related to the operational efficiency of the system, the user’s safety, and the fairness of paying electricity bills [1]. However, during the long-term operation of an electric energy meter, due to environmental factors, aging, external interference, and complex power environments, the performance of the meter may deteriorate. There may be measurement errors or even faults, which seriously affect the reliability of power data and the interests of users. In terms of the impact of complex power environments on the assessment of the health of electricity meters, traditional assessment of meter health mainly focuses on the detection of static errors, and lacks relevant indicators under dynamic operating conditions (such as power factor, voltage fluctuation rate, etc.), which leads to limitations in the health assessment index system for electricity meters. Secondly, the current assessment and detection of the health of electricity meters rely on regular manual calibration, and are thus unable to capture specific instances of the power environment interfering with electricity meters. When the voltage temporarily drops, data jumps cannot be recorded. The cumulative damage to components caused by long-term loads is difficult to quantify. Regarding the mechanisms by which complex power environments impact electricity meters, voltage fluctuations prevent the sampling circuits inside the electricity meter from stably obtaining voltage signals, thereby affecting the calculation of active power. Long-term voltage fluctuations also affect the stability of the power supply for electricity meters, resulting in decreased sampling accuracy or data loss. Nonlinear loads cause transient interference, disrupting the synchronization of the sampling clock or the sampling accuracy.
In recent years, there has been extensive research on the reliability and engineering of electricity meters. Many researchers have determined the length of the reliable life of electricity meters based on simulation analyses of key components. Li et al. determined the key components of electricity meters and analyzed their stresses and failure mechanisms based on simulation, providing a basis for improving the reliable service life of smart meters [2]. However, the actual complex working conditions were not fully covered in the simulation of each component of the meter. Altenburg et al. designed and evaluated a low-fault smart meter architecture. The architecture reduced the probability of failure and enhanced system reliability by combining a reliability block diagram (RBD) and Monte Carlo simulation [3]. Azmi et al. modeled and analyzed the performance of a three-phase electricity meter, showing that it has high reliability in measuring voltage, current, power factor, active power, reactive power, and energy consumption [4]. Diahovchenko et al. studied the influence of voltage and current waveform distortion on modern single-phase and three-phase energy meters in the electricity system of the Slovak Republic, and experimentally tested the error of different meters under non-sinusoidal conditions [5]. The above studies on the reliability of electricity meters tested by simulation prove the direct impact of the electrical environment on a meter’s deterioration and hence its reliability. However, simulations usually focus on a single physical dimension, and it is difficult to integrate multi-modal data, such as user behavior and maintenance records. In addition, the construction of high-precision simulation models requires much professional domain knowledge and the modeling needs to be repeated for different meter models, resulting in low efficiency.
With the development of information automation in power systems, power data can be acquired and uploaded to data management systems by the power data acquisition terminals used with electricity meters [6,7]. The collected power data can reflect the health of the electricity meter [8]. A terminal used with an electricity meter can collect the load parameter data of the power line, including voltage, current, power, power factor, electricity consumption, and other time-series data [9,10,11]. Therefore, online monitoring of power-line load parameters and mapping the relationship between terminal data acquisition and the running health of electricity meters are effective methods of managing the health of electricity meters [12]. The data-driven method can fuse multi-source data, extract cross-dimensional correlations through deep learning and other algorithms, and improve prediction accuracy. If the data infrastructure is already in place, the data-driven method has the advantages of shorter development cycles, better scalability, and lower long-term maintenance costs [13,14,15,16,17]. Data-driven models based on natural environment data are commonly used to evaluate the running health of meters. Duan et al. proposed a machine learning-based electricity meter operation state evaluation method with the operation test data of electricity meters from different manufacturers in extreme environments and Gaussian process regression modeling [18]. However, the impact of grid voltage fluctuations was ignored, and the large sample data processing ability based on GPR and the OSE framework has certain limitations. Zhao et al. proposed a deep learning model based on Transformer–Encoder–BiLST with data from operating electricity meters as the dataset to evaluate the running state of electricity meters [19]. The model focuses on the state data of the meter itself, which is more objective than the environmental indicators. However, the indicators selected in their study were not comprehensive, and there were few methods of modern data collection, ignoring the influence of other data types. Zhao et al. employed users’ electricity consumption information data to monitor meter faults based on the RNN model, and used transfer learning to improve training efficiency and generalization ability [20]. But the grid search adopted in their study required a lot of computing resources and time. Cai et al. proposed an online method to assess electricity meter health status based on information fusion. The entropy weight method was used to fuse indicators and a state assessment model was established in combination with a linear function. The effectiveness of the method was verified by actual data [21]. Liu et al. proposed a fault detection method for electricity meters based on deep learning, which used LSTM and an improved CNN model to detect faults by analyzing data collected from electricity meters [22]. Liu et al. used deep learning methods to accurately identify electricity meters with excessive measurement errors, and combined multiple neural networks to improve model classification performance [23]. Chen et al. proposed a smart meter status assessment and replacement system based on informatization and big data analysis [24].
In recent years, the application of adaptive proxy models in the field of reliability assessment has received increasing attention. Yang et al. [25] proposed a new learning function, providing important ideas for the development of this field. The core of this research lies in the construction of a learning mechanism that does not rely on the prediction variance of the Kriging model. By adaptively selecting the optimal update samples, it achieves flexible integration with various proxy models, effectively improving the computational efficiency and accuracy of reliability assessment in complex scenarios.
With the analysis above, this paper explored the value of the power information data collected at the terminal and integrated the operation and maintenance records of electricity meters for the assessment of the health status of electricity meters. Considering the limitations of the linear hypothesis of the relationship between covariates and risk in the traditional Cox proportional hazards (CoxPH) model, the Transformer Cox proportional hazards (Trans CoxPH) model is proposed to analyze the health status of electricity meters.
The remainder of the paper is organized as follows. In Section 2, the dataset is obtained from terminal data and operation and maintenance records and preprocessed. In Section 3, the Transformer Cox proportional hazard model is proposed to analyze the health status of electricity meters. In Section 4, experiments are carried out for verification.
2. Data Preparing
2.1. Original Data
The original data in this paper were obtained from some users’ energy meters in a prefecture-level city provided by the metering center of China Southern Power Grid Corporation, including (1) the power information data collected by the terminal (voltage, current, power, power factor, power consumption, and meter code), which are time-series data collected once every hour; (2) the installation time of the equipment; and (3) work order records of equipment failure.
The data acquisition terminal equipment is a WFET-1000f-type load control management terminal. Its detailed technical parameters are shown in Table 1. The WFET-1000f-type load control management terminal complies with standards such as DL/T 645-1997, DL/T 721-2000, and DL/T 743-2001, as well as the data transmission protocol of the power load management system. In terms of data storage, it meets the relevant requirements stipulated in DL/T 533-2007 “Power Load Management Terminal.”

Table 1.
Technical parameters of the WFET-1000f-type load control management terminal.
An example of the original collected data is shown in Table 2, where 4094620303 represents the number of the electricity meter, corresponding to the work order number. The fault status of the corresponding electricity meter during the data collection period can be queried. An example of the work order records of the equipment failures is shown in Table 3.

Table 2.
Sample of the original data acquired from electricity meter 4094620303.

Table 3.
Work order records of the equipment failures.
2.2. Data Processing
Data quality is crucial in data-driven models. Poor data quality will lead to increased model errors, thus affecting the accuracy and reliability of risk prediction [26]. There are several issues in the original data, including the absence of data for certain time periods during data collection, abnormal data values, the strong linear correlation among some data columns, and the imbalance between faulty and normal samples. To assess the health status of in-service electricity meters by survival analysis based on the Cox proportional hazard model, the original data is preprocessed via data cleaning, interpolation, data transformation and dimensionality normalization. Then, the preprocessed data is used as the dataset for the Cox proportional hazard model. In the data transformation, the average value of three-phase voltage fluctuation, the average value of three-phase current fluctuation, the reverse polarity of current, the quantity difference rate, and the theoretical operation error of the meter are calculated as part of the covariates of the CoxPH model. These parameters are of physical significance in the power grid and can reflect the circuit environment the meter is located in.
The voltage fluctuation is calculated as follows:
where is the average value of three-phase voltage fluctuation, VFA, VFB, and VFC are the voltage fluctuations of three phases A, B, and C, VF is the voltage fluctuation of a phase, Vt is the instantaneous voltage, and is the daily average value of voltage. Similarly, the average value of current fluctuation is calculated in the same way. Voltage and current fluctuations reflect the power quality and the stability of system operation. In the health status assessment of electricity meters, high volatility is a sign of equipment problems or poor power quality.
The inverse polarity of current is calculated as follows:
where is the reverse polarity of the current at t, Pt is the total instantaneous power at time t, and , , and are the instantaneous power values of the A, B, and C phases at time t. Reverse current polarity is a phenomenon of abnormal current direction, which can be caused by wiring errors, equipment failures, or system design problems. This phenomenon can affect the accurate metering of electricity meters, the stable operation of the system, and the protection mechanism of the equipment.
The electricity difference rate is calculated as follows:
where DT is the reverse polarity of the current on day T, Pt is the total power at time t, and ET is the electricity consumption on day T.
The running error is calculated as follows:
where εt is the instantaneous operation error, , , is the three-phase instantaneous voltage, , , is the three-phase instantaneous current, cos φ is the power factor, and Pt is the total power. The theoretical operation error of the electricity meter is caused by the internal mechanism of the meter (such as the way of measuring signals, voltage, and current), the operating conditions of the power system, and other external factors, such as ambient temperature and load fluctuations. The theoretical operating error is an ideal and theoretically calculated error that is commonly used for accuracy calibration and performance evaluation of electricity meters.
In addition, the average value of the three-phase voltage and the sum of the three-phase current are also calculated, and an example of the dataset after data preprocessing is shown in Table 4.

Table 4.
The dataset of the sample after data preprocessing.
3. Survival Analysis Model
3.1. Traditional Cox Proportional Hazard Model
3.1.1. Cox Proportional Hazard Model
The Cox proportional hazard (CoxPH) model proposed by Cox in 1972 is an important statistical model in survival analysis [27]. It is widely used to analyze the relationship between time-to-event data and covariates, especially in medical, engineering, sociology, and other fields. The CoxPH model is a “semi-parametric” model, which does not need to explicitly specify the form of the baseline risk function [28].
The Cox proportional hazard (CoxPH) model was selected for the assessment of the health status of electricity meters, mainly due to its ability to effectively handle survival time analysis with censored data, which is suitable for the time dimension characteristics of electricity meters from installation to failure; it supports multivariate analysis, allowing the inclusion of multiple dimensions of covariates such as voltage and current and quantifying their effects; as a semi-parametric model, it does not require the preset form of the baseline risk function and can flexibly adapt to the unknown risk patterns in complex power environments; and the output risk ratio is convenient for understanding and application in engineering practice, providing a basis for maintenance decisions.
The important concepts of the CoxPH model are as follows: (1) event occurrence, referring to meter failure or replacement; (2) risk function, which represents the instantaneous risk of an individual event occurring at a certain time, as calculated in Equation (6); (3) survival time, which in this paper refers to the intermediate duration from the moment of installation to the moment of the event in the observed electricity meter; (4) censoring, meaning no event occurred during the observation period; (5) survival function, representing the probability that there is no event before a certain time in an individual meter, as shown in Equation (7); and (6) covariates, factors that affect the occurrence of events. The basic mathematical form of the CoxPH model is expressed in Equation (8):
where h(t|X) is the risk of an event occurring at time t, given the covariate X = (X1, X2, …, Xn). h0(t) is the baseline hazard function. β1, β2, …, βn is the regression coefficient of the model, which represents the influence of individual covariables on the risk. X = (X1, X2, …, Xn) is a covariate that represents the environment in which the sample is located.
The core assumption of the CoxPH model is that the risk ratio between different groups is constant and does not change over time, as shown in Equation (9). The model estimates the impact of different variables on survival time (time to event occurrence) by comparing the risk ratios of different groups.
A prominent advantage of the Cox proportional hazard (CoxPH) model lies in its lack of explicit assumptions regarding the functional form of the baseline hazard function, enabling effective adaptation to complex survival data structures. Notably, the CoxPH model exhibits superior performance in handling censored data and is highly amenable to multivariate analysis, as it can incorporate multiple covariates concurrently. Given the presence of a substantial volume of censored data in the dataset utilized in this study, coupled with the diversity and richness of data types employed to characterize the power supply environment during electricity meter operation, the CoxPH model is deemed appropriate for the statistical analysis herein.
3.1.2. Construction and Maximization of Partial Likelihood Function
The key to the CoxPH model is to construct a partial likelihood function to estimate the parameters of the model (β1, β2, …, βn). It is difficult to directly maximize the likelihood function since the baseline hazard function h0(t) is unknown. Thus, the parameters are estimated by constructing a partial likelihood function. The partial likelihood function is constructed based on the conditional survival function, where the hazard of individual i at a specific time ti is relative to the hazard of other individuals without an event. For each event ti, the partial likelihood function is expressed as follows:
where β’Xi represents the influence of a covariate on sample hazard; R(ti) represents the set of active or inactive individuals at time ti. k is the total number of events that occur. To solve the parameters β, the regression coefficients can be solved by maximizing a partial likelihood function L(β) in logarithmic form. The logarithmic form of the partial likelihood function is shown in Equation (11). The Newton–Raphson method was used to maximize the log-partial likelihood function.
3.2. Transformer Cox Proportional Hazard Model
The poor generalization ability of the traditional CoxPH model is partly due to the assumption of a linear relationship between covariates and regression coefficients. The CoxPH model assumes a linear relationship between covariates and the log-hazard ratio, failing to capture the nonlinear relationships that may exist among the log-hazard ratios corresponding to different covariates [29]. The linear covariate assumption of the Cox proportional hazard model is fundamentally in conflict with the nonlinear relationships (such as accelerated aging and threshold effects) that are commonly observed in electricity meter health data. Mathematically, this assumption leads to the inability of the linear approximation of the risk rate to match the true nonlinear function, resulting in biased parameter estimation. Statistically, the insufficient model fitting manifests as systematic deviation of residuals, decreased likelihood values, and reduced predictive performance. Ultimately, these issues will lead to prediction errors in the risk of electricity meter failures, affecting the accuracy of maintenance decisions, and potentially causing cost waste or a decline in power supply reliability.
For example, if the true relationship between the covariate and the risk is hi(t) = h0(t) · exp (β1 X12 + β2 log (X2 + β3 X1 X2), the linear terms of the traditional Cox model (β1 X1 + β2 X2) clearly cannot approximate the aforementioned complex structure.
This leads to underfitting of the model, which means that the model cannot accurately reflect the actual nonlinear relationships, and cannot fit the data well or adequately characterize the patterns in the data. Secondly, the linear assumption is sensitive to extreme values. However, the extreme values may result from equipment failures and cannot be arbitrarily removed in preprocessing, which may lead to inaccurate estimation of regression coefficients, affecting model stability and predictive accuracy. Thirdly, the limited flexibility of the linear model leads to difficulty in adapting to complex data structures and patterns, leading to key information loss and reducing interpretability and practicality. Thus, to enhance the model fitting and predictive ability, this paper proposes a model integrating a deep neural network with the traditional CoxPH model; the model architecture is shown in Figure 1.
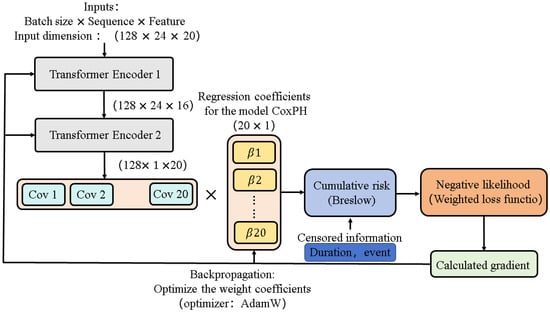
Figure 1.
The Trans CoxPH model architecture.
Based on the self-attention mechanism, Transformer can calculate the dependence between each time step and all other time steps in parallel by stacking multiple self-attention layers and feedforward neural network layers. By automatically learning the features of different scales, the short-term local features of time-series data can be extracted, and the long-term global information can be captured to accurately model the sampled data. The multi-head attention mechanism is shown in Figure 2.
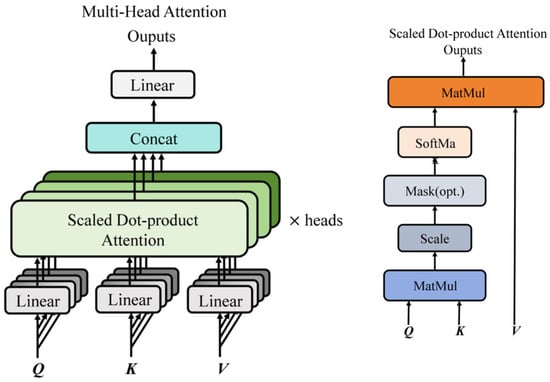
Figure 2.
The multi-head attention mechanism.
When dealing with time-series data, the model can better understand complex patterns in the data as well as features at different time scales based on multi-scale feature extraction. In addition, Transformer introduces position encoding to encode the position information in the sequence and then integrates it into the input of the model. Thus, the model can sense the global position of each sequence element and can then deal with sequential time-series data well. It shows good generalization ability when dealing with time-series data of different types and sources. Whether it is time-series data with linear trends, nonlinear relationships, periodic fluctuations, or noise, Transformer can find the rules and features in the data through the self-attention mechanism and the learning of a multi-layer neural network, and establish an effective and accurate model.
The data collected in this paper is of obvious timeliness and huge volume. Meanwhile, there is a variety of complex patterns and distributions in the data. The Transformer Encoder module of the Trans CoxPH model proposed in this paper is used to extract deep features in the data and understand complex data patterns. The Transformer Encoder architecture is shown in Figure 3. The output feature information of the Transformer Encoder is used as a covariate. The corresponding sample event labels and survival time data are input to fit the CoxPH model [30,31].
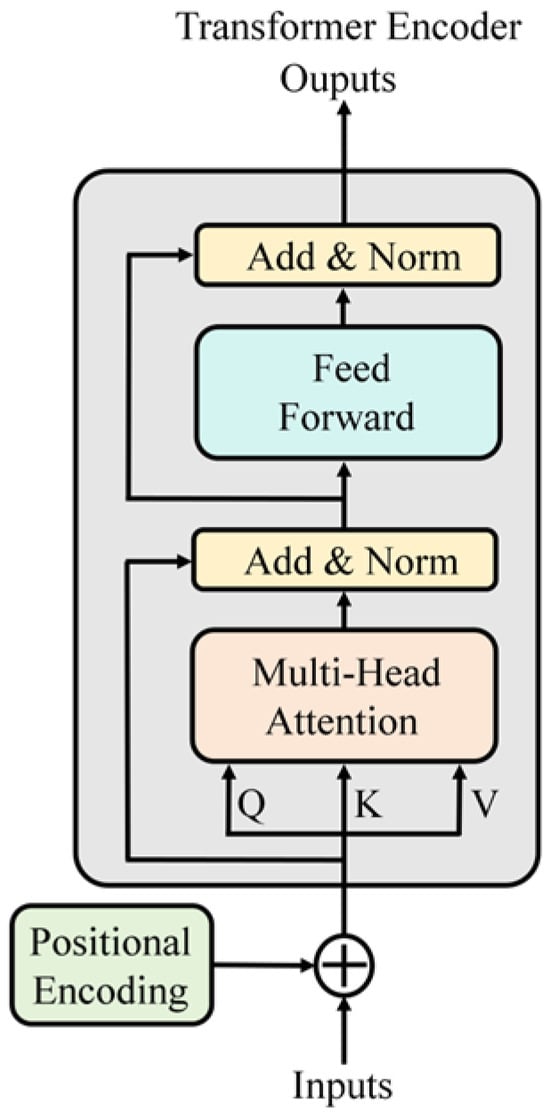
Figure 3.
Architecture of Transformer Encoder.
When using the transposed CoxPH model for fitting, the dataset sample we used was time-series data. The self-attention mechanism can be used to capture the correlations between any positions in the input time series; this mechanism enables the model to automatically identify and focus on the time points that significantly contribute to “electric meter anomaly risk”; it can also capture key abnormal features across time (such as a sudden voltage drop leading to long-term damage). The positional encoding mechanism in the Transformer module embeds the time sequence information into the input features, and the positional encoding enables the Transformer to effectively analyze the spatiotemporal features of the electric meter data, providing technical support for the precise assessment of equipment health status.
Furthermore, the dataset sample we used also has multi-dimensionality. The multi-head attention mechanism is a multi-threaded version of the self-attention mechanism (equivalent to multiple self-attention mechanisms working simultaneously). This mechanism maps multi-dimensional input data to multiple subspaces and then performs attention calculations in parallel. Different heads can focus on different dimensions of abnormal behavior (such as current fluctuations, sudden changes in power factor, and their impact on the health of the electric meter).
The loss function is the negative log form of the partial likelihood function. The regression coefficients are used as parameters to be optimized. The weight parameters of the Transformer Encoder are jointly optimized in the back propagation. The expression of the loss function is as follows:
where β′ is the regression coefficient and is the covariate. R(ti) represents the set of individuals that survive or are censored at time ti. k is the total number of events that occur.
Due to the existence of data imbalance in the training dataset, this paper uses a weighted loss function to introduce weight coefficients for different samples or related items, thereby reflecting the varying importance of different data in the loss calculation. For each sample i, a weight w (w > 0, and ∑wi = 1) is introduced, and the weighted loss function can be expressed as
Here, the weights wi are applied to each sample’s corresponding loss calculation item. This means that the samples with larger weights have a greater contribution to the overall loss, and the model training will pay more attention to these types of samples.
4. Experiment
4.1. Traditional Hazard Proportional Model
4.1.1. Data Preparation and Model Training Settings
The data includes the following: survival time: duration shown in Table 3; event occurrence tag: fault or no fault shown in Table 3; covariates: power factor shown in Table 3, along with voltage fluctuation, current fluctuation, current reverse polarity, quantity difference, meter operating error, voltage average, and current sum. The original data is processed as the input of the model by the Max–Min normalization, eliminating the influence of dimension inconsistency between different datasets on the fitting results of the model. The data is divided into 70% for the training set and 30% for the validation set.
The benchmark hazard function was estimated using the Breslow method and ridge regression regularization technique, where the coefficient of the regularization term penalizer = 0.1.
4.1.2. Analysis of the Results of Significance Testing
The results of the regression coefficient calculations and significance tests are presented in Table 5. In survival analysis theory, a covariate with a p-value less than 0.05 is deemed to have a significant impact on event occurrence. As indicated in Table 3, power factor, voltage fluctuation, current reverse polarity, quantity difference, voltage average, and total current all exert significant effects on the fault risk of electricity meters, which aligns with the established knowledge in power engineering.

Table 5.
Regression coefficient solution results and Wald test results.
In practical engineering applications, an excessively low power factor can lead to equipment overload caused by reactive power, which significantly shortens the service life of the internal capacitors and coils within the meter. In power supply environments where the voltage fluctuation rate exceeds ±5%, the breakdown failure rate of the meter’s power module increases by more than 25% on a year-on-year basis. Current reverse polarity predominantly occurs due to wiring errors in power grid equipment or lightning surges, which can directly result in the burnout of electricity metering chips. A continuous quantity difference rate exceeding 2‰ often indicates the presence of abnormal contact impedance in the meter’s metering circuit or deterioration in Transformer characteristics. When the total current remains above 80% of the rated value for an extended period, the oxidation rate of copper bar connections accelerates, and the chip junction temperature exceeds the safety threshold. These engineering observations and the statistical model’s test conclusions mutually validate each other.
4.1.3. Traditional CoxPH Model Verification
In the theory of survival analysis, the main basis for the evaluation of the CoxPH model is the concordance index (C-index). It is used to measure how well the model predicts. Any pair of samples is said to be consistent if the one with the higher risk score predicted by the model actually happened earlier. It is calculated as follows:
The C-index of the fitted CoxPH model is 0.61 on the training set, but only 0.40 on the validation set. Five samples with different covariate values are randomly drawn from the training and validation sets, respectively. The sample plots of survival functions are shown in Figure 4 and Figure 5. The corresponding data of the selected sample points are shown in Table 6.
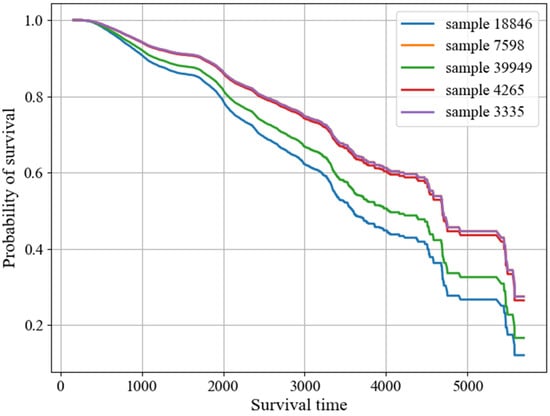
Figure 4.
Plot of the survival function for a random sample in the training set.
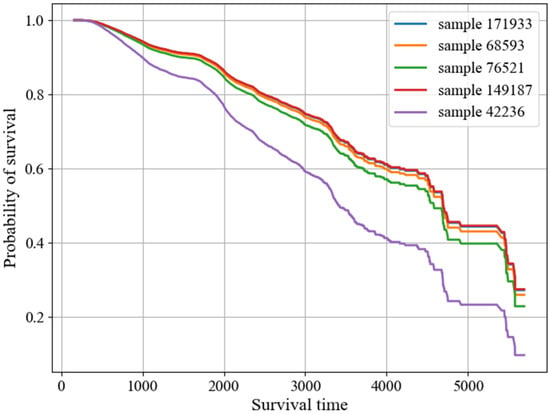
Figure 5.
Plot of the survival function for random samples in the validation set.

Table 6.
Values of covariates corresponding to the selected samples.
As shown in Figure 5, the sample with the largest slope of the survival function has an event. However, there is no consistent performance on the validation set. The results of the C-index show that the generalization ability of the traditional CoxPH model is not ideal.
The Brier score is used to evaluate the accuracy of a model’s prediction of survival probabilities at a specific time point t. The Brier score is typically within the range of [0, 1], and a smaller value indicates that the model’s prediction of survival probabilities at time t is more accurate. The Brier score of the CoxPH model needs to be processed by inverse probability of censoring weighted (IPCW) to handle censored data, in order to eliminate the interference of censoring on the assessment. The specific formula is as follows:
In the formula, N represents the sample size. Si(t) represents the predicted survival probability of the model, while Yi(t) is the actual survival status indicator variable. wi(t) represents the IPCW weight.
In the experimental results, the Brier score of the traditional CoxPH model was 0.2206, while that of the Trans CoxPH model was 0.0501. The latter is superior to the former.
In survival analysis, the log-rank test is a non-parametric statistical method used to compare whether there are statistically significant differences among two or more survival curves.
Upon examination, the p-values for both the traditional CoxPH model and the Trans CoxPH model were 0.005. This indicates that at the significance level of 0.05, both models can significantly fit the data, meaning that the covariates included in the models as a whole have a significant impact on survival time.
4.2. Trans CoxPH Model
4.2.1. Data Preparing and Model Training Settings
The data is prepared as follows: survival time: duration is shown in Table 3; event occurrence tag: fault or no fault is shown in Table 3; covariates: three-phase voltage, current and power are shown in Table 1; total power, power factor; three-phase voltage fluctuation, current fluctuation; reverse polarity of current, power difference rate, meter operation error, and 20 feature dimensions. It is noteworthy that the dimension of the model input data in Section 4.1.1 is only 8 because there are very strong linear relationships between some of the 20 columns, which would cause the model to fail. To solve this problem, we removed and merged the data columns with strong linear relationships. This problem would not be caused by the Trans CoxPH algorithm. In order to maximize the use of data characteristics, the data columns with strong linear relationships are not eliminated and merged. The input data is also normalized by Max–Min and divided into 70% for the training set and 30% for the validation set.
The number of heads of the multi-head attention mechanism in the Transformer Encoder is set to four, and two encoders are stacked. The AdamW optimizer is used, and the weight decay strategy is added. The learning rate scheduler ReduceLROnPlateau is used, and the monitoring metric is the loss function value.
4.2.2. Trans CoxPH Model Verification
During the training, the loss of the model based on the training set and the validation set is shown in Figure 6. The consistency of the trained Trans CoxPH model is tested. In the test results, the consistency index of the model based on the training set is 0.7825, and the consistency index based on the validation set is 0.7827. Five random samples from the validation set are selected, and their survival functions obtained under the Trans CoxPH model are shown in Figure 7. Since the Wald test relies on the asymptotic normality and the accurate calculation of the standard errors of the parameter estimates, the deep structure, non-convex optimization, and strong correlation between the parameters of the Trans CoxPH model make these assumptions untenable. So, the Wald test does not apply.
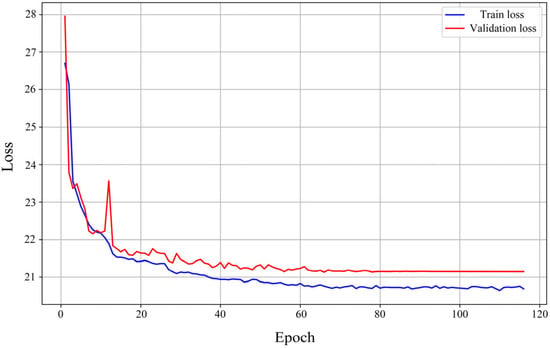
Figure 6.
Model loss in training set and validation set.
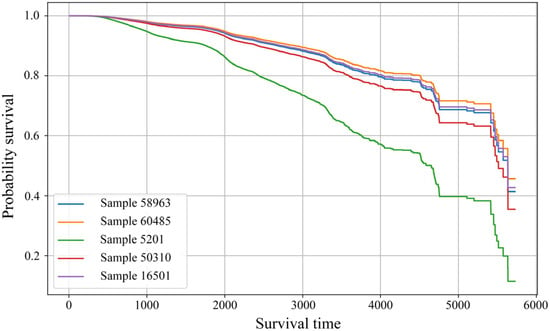
Figure 7.
Sample survival function under Trans CoxPH model prediction.
Compared with the traditional CoxPH model, the C-index of the traditional CoxPH model based on the training set is 0.61, reflecting that the predictive ability of the risk ranking of the traditional CoxPH model is only slightly better than that of random guessing (C-index = 0.5). The C-index values of the Trans CoxPH model based on the training set and validation set reach 0.7825 and 0.7827, respectively, showing a significant increase of 23%. This significant improvement benefits from the nonlinear features extracted by the Transformer Encoder, which can more accurately capture the complex patterns of meter failures.
In terms of model robustness, the following observations have been made: 1. The traditional Cox model is sensitive to noise and wrongly amplifies the fluctuating trend. However, the Transformer structure extracts the global context through multi-head attention, suppressing local disturbances and endowing the Trans CoxPH model with a robust mechanism. Even if there are short-term fluctuations in voltage and current, the model can “see” the overall trend and ignore isolated anomalies. As an example, the current fluctuated violently for a certain hour, but the overall load remained stable. The Transformer can capture the trend of “long-term stable operation” and reduce the impact of short-term noise. 2. Trans CoxPH reduces the impact of abnormal shocks by representing them with nonlinear features, improving the model’s robustness. Outliers may cause large fitting residuals in traditional linear models, but in the Transformer, the encoding layer does not directly use the original values, but converts them into high-dimensional vector representations. Subsequent attention weights can automatically reduce the “weight” of abnormal points in the aggregation process; after adding the positional encoding (positional encoding) or anomaly mask (mask) mechanism, the abnormal points can be explicitly identified and “blocked.” As an example, the power factor suddenly became 0 at a certain moment. The features at this point were “down-weighted” or masked by the Transformer’s attention mechanism and did not cause serious misguidance in the final risk prediction.
4.2.3. Control Experiment
The Temporal Convolutional Network (TCN) is a neural network architecture designed for processing sequential data. It has been applied in various fields, such as speech recognition, natural language processing, and time-series prediction, and has performed exceptionally well in these areas. Therefore, in this paper, the Transformer module of the previously established Trans CoxPH is replaced with a TCN module, thereby constructing a TCN-CoxPH model to compare its performance with the model proposed in this paper. The schematic diagram of the TCN-CoxPH model is shown in Figure 8.
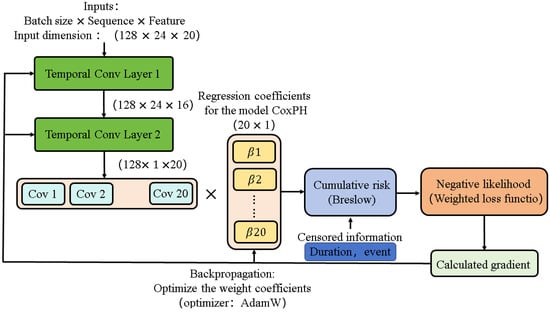
Figure 8.
The TCN CoxPH model architecture.
The XGBoost CoxPH model combines the gradient boosting tree (XGBoost) from the field of machine learning with the Cox risk function. It uses the hierarchical splitting strategy of the tree model to automatically discover the nonlinear combinations of features and controls the model complexity through regularization terms. This model performs exceptionally well when dealing with large-scale structured data, can efficiently output the ranking of feature importance, and is suitable for scenarios requiring rapid feature selection. The DeepSurvival LSTM model is in the field of deep learning and is based on the recurrent neural network architecture. It is designed for time-series-dependent data and captures the dynamic change patterns in the survival process through LSTM units. It is particularly suitable for handling scenarios involving longitudinal follow-up data (such as multiple biomarker measurements). This model can model the impact of time-varying covariates on the survival outcome.
This paper also established the XGBoost CoxPH and DeepSurvival LSTM models, and then used several evaluation metrics such as C-index, Brier score, and log-rank test to assess the performance of all the models established in this paper. The experimental results are shown in Figure 9.
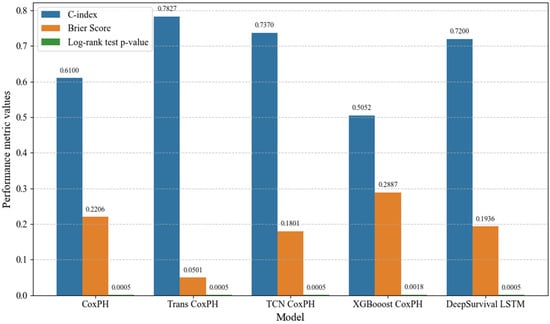
Figure 9.
Model performance comparison experiment results.
From the results of the comparative experiments, it can be seen that the Trans CoxPH model outperforms the machine learning method (XGBoost CoxPH) and the deep learning method (DeepSurvival LSTM) in terms of the C-index metric and the Brier score, and also outperforms the model with the TCN permutation Transformer module (TCN CoxPH). In the log-rank test, the p-values of the five models were all less than 0.05, indicating that there were significant differences in the survival distributions of different groups under these models.
4.2.4. Analysis of the Impact of Model Hyperparameters on Models
The multi-head attention mechanism maps the input features to multiple subspaces for parallel attention computations. The number of heads directly affects the dimension and granularity of feature extraction. A small number of heads (such as 1–2) may prevent the model from fully capturing the nonlinear relationships among multi-dimensional covariates (such as voltage, current, power factor, etc.), resulting in insufficient feature extraction and a reduced adaptability of the model to complex power environments. The evaluation metrics such as C-index may also be lower. A large number of heads (such as more than eight) will increase the model’s complexity and computational load, potentially leading to overfitting, and redundant subspace calculations may introduce noise and reduce the model’s generalization ability. In the model proposed in this paper, the number of attention heads is set to 4, balancing the feature capture ability and computational efficiency, enabling the model to effectively focus on abnormal features of different dimensions (such as current fluctuations, power factor mutations).
The number of stacked encoder layers determines the depth of feature extraction and affects the model’s ability to capture deep nonlinear relationships. If the number of layers is too small (such as one layer), it is difficult to extract the complex temporal dependencies in the power data (such as the cumulative effect of long-term voltage fluctuations on the aging of the electricity meter). The model may be underfitting and unable to reflect the true risk patterns. Having too many layers (such as three or more) may lead to overfitting of the local noise in the training data (such as instantaneous current fluctuations), resulting in a decrease in the C-index of the validation set and a weakened generalization ability. The model proposed in this paper has two stacked encoder layers, which not only ensures the extraction of deep features (such as the fault risk with multi-factor coupling), but also avoids overfitting.
5. Conclusions
Traditional methods for assessing the health status of electricity meters are limited by static error detection and reliance on manual calibration, making them unable to adapt to complex dynamic power environments. Existing models have deficiencies in handling nonlinear relationships and temporal dependencies in power data. To address this, this paper proposes a Transformer Cox proportional hazard (Trans CoxPH) model. The traditional Cox proportional hazard (CoxPH) model, due to its assumption of a linear relationship between covariates and risk, fails to capture nonlinear patterns in electricity meter health data (such as cumulative aging effects caused by long-term voltage fluctuations and threshold effects of current overload). Additionally, it struggles to effectively process time-series power data with complex temporal dependencies, resulting in poor generalization ability and low prediction accuracy in practical applications.
To tackle these issues, the research first constructs a dataset by collecting terminal monitoring data (including three-phase voltage, current, power, etc.) and operation and maintenance records. After preprocessing steps such as cleaning and interpolation, key covariates with physical significance in power systems are extracted, including three-phase voltage/current fluctuation averages and current reverse polarity, to characterize the operating environment of electricity meters.
Experimental results show that the traditional CoxPH model, constrained by its linear assumption, achieves a C-index of only 0.40 on the validation set, indicating poor generalization ability. In contrast, the Trans CoxPH model integrates the self-attention and multi-head attention mechanisms of the Transformer, enabling it to extract deep nonlinear features and capture temporal dependencies. It effectively identifies complex patterns such as the impact of cumulative voltage fluctuations on meter aging. The Trans CoxPH model achieves a C-index of 0.7827 and a Brier score of 0.0501 on the validation set, significantly outperforming traditional CoxPH, TCN-CoxPH, and other models.
In summary, the Trans CoxPH model effectively overcomes the limitations of linear models in processing complex power data, improving the accuracy and reliability of electricity meter health status assessment. It provides a data-driven solution for intelligent operation and maintenance of power systems, facilitating fault early warning, optimizing maintenance strategies, and ensuring the safe and efficient operation of power metering systems.
Author Contributions
Conceptualization, J.Y.; methodology, J.Y.; validation, J.Y., W.Y. and J.W.; data curation, J.W. and R.X.; writing—original draft preparation, J.Y.; visualization, J.W.; project administration, J.Y.; funding acquisition, J.Y. and M.X. All authors have read and agreed to the published version of the manuscript.
Funding
This research was funded by [The Guizhou Advanced Sensing and Power Chip Technology Innovation Talent Team] [Guizhou Science and Technology Talent CXTD [2025] 034].
Data Availability Statement
This article uses user data from China Southern Power Grid Company, which also provided financial support for the research. To protect user privacy, the company has a formal policy prohibiting researchers from disclosing any of its data to third parties. Per its data usage agreement, this regulation and our ethical obligation mean we cannot share the underlying data—even in anonymized or aggregated form.
Conflicts of Interest
Authors Jing Yang, Wenbo Ye and Minyong Xin were employed by the company Guizhou Power Grid Co., Ltd.. The remaining authors declare that the research was conducted in the absence of any commercial or financial relationships that could be construed as a potential conflict of interest.
References
- Grigoraș, G.; Raboaca, M.S.; Dumitrescu, C.; Manea, D.L.; Mihaltan, T.C.; Niculescu, V.-C.; Neagu, B.C. Contributions to power Grid system analysis based on clustering techniques. Sensors 2023, 23, 1895. [Google Scholar] [CrossRef]
- Li, W.; Yuan, R.; Guo, J.; Li, H.; Ye, X. Determination of key components and failure mechanism analysis of smart electricity meter. In Proceedings of the 2021 3rd International Conference on System Reliability and Safety Engineering (SRSE), Harbin, China, 26–28 November 2021; IEEE: Washington, DC, USA, 2021; pp. 78–82. [Google Scholar]
- Altenburg, T.; Staegemann, D.; Volk, M.; Turowski, K. Reliability Estimation and Optimization of a Smart Meter Architecture Using a Monte Carlo Simulation. SN Comput. Sci. 2023, 4, 438. [Google Scholar] [CrossRef]
- Azmi, N.H.; Leh, N.A.M.; Kamaruzaman, N.A. Modeling of energy meter using MATLAB/Simulink. In Proceedings of the 2018 9th IEEE Control and System Graduate Research Colloquium (ICSGRC), Shah Alam, Malaysia, 3–4 August 2018; IEEE: Washington, DC, USA, 2018; pp. 75–80. [Google Scholar]
- Diahovchenko, I.; Dolník, B.; Kanálik, M.; Kurimský, J. Contemporary electric energy meters testing under simulated nonsinusoidal field conditions. Electr. Eng. 2022, 104, 1077–1092. [Google Scholar] [CrossRef]
- Cao, L.; Wang, Z.; Yue, Y. Analysis and prospect of the application of wireless sensor networks in ubiquitous power internet of things. Comput. Intell. Neurosci. 2022, 2022, 9004942. [Google Scholar] [CrossRef]
- Sheng, Q.; Huang, L.; Wang, X.; Jiang, J.; Li, P.; Zhang, J.; Qu, S. Research and analysis on evaluation methods of electrical performance of Smart Energy Meters. J. Phys. Conf. Ser. 2021, 1802, 032135. [Google Scholar] [CrossRef]
- Priya, B.G. Whispers of the Grid: Unraveling the Mysteries of Automated Energy Billing, Fault Detection, and Raspberry Pi’s Power Unplug System. In Proceedings of the 2023 4th International Conference on Smart Electronics and Communication (ICOSEC), Trichy, India, 20–22 September 2023; IEEE: Washington, DC, USA, 2023; pp. 95–100. [Google Scholar]
- Labib, L.; Billah, M.; Sultan Mahmud Rana, G.; Sadat, M.N.; Kibria, M.G.; Islam, M.R. Design and implementation of low-cost universal smart energy meter with demand side load management. IET Gener. Transm. Distrib. 2017, 11, 3938–3945. [Google Scholar] [CrossRef]
- Nainar, K.; Iov, F. Smart meter measurement-based state estimation for monitoring of low-voltage distribution grids. Energies 2020, 13, 5367. [Google Scholar] [CrossRef]
- Sharma, K.; Saini, L.M. Performance analysis of smart metering for smart grid: An overview. Renew. Sustain. Energy Rev. 2015, 49, 720–735. [Google Scholar] [CrossRef]
- Chen, X.; Li, T.; Cao, F.; Chu, P.; Zhao, X.; Huang, R.; Liu, L.; Zhang, C. A Method of Evaluating Operation of Electric Energy Meter. IOP Conf. Ser. Earth Environ. Sci. 2018, 153, 042030. [Google Scholar] [CrossRef]
- Hughes, W.; Zhang, W.; Cerrai, D.; Bagtzoglou, A.; Wanik, D.; Anagnostou, E. A hybrid physics-based and data-driven model for power distribution system infrastructure hardening and outage simulation. Reliab. Eng. Syst. Saf. 2022, 225, 108628. [Google Scholar] [CrossRef]
- Wang, J.; Chen, H.; Si, Y.; Zhu, Y.; Zhu, T.; Yin, S.; Liu, B. FDIA localization and classification detection in smart grids using multi-modal data and deep learning technique. Comput. Electr. Eng. 2024, 119, 109572. [Google Scholar] [CrossRef]
- Fekri, M.N.; Grolinger, K.; Mir, S. Distributed load forecasting using smart meter data: Federated learning with Recurrent Neural Networks. Int. J. Electr. Power Energy Syst. 2022, 137, 107669. [Google Scholar] [CrossRef]
- Ahmad, T.; Madonski, R.; Zhang, D.; Huang, C.; Mujeeb, A. Data-driven probabilistic machine learning in sustainable smart energy/smart energy systems: Key developments, challenges, and future research opportunities in the context of smart grid paradigm. Renew. Sustain. Energy Rev. 2022, 160, 112128. [Google Scholar] [CrossRef]
- Koshy, S.; Rahul, S.; Sunitha, R.; Cheriyan, E.P. Smart grid–based big data analytics using machine learning and artificial intelligence: A survey. In Artificial Intelligence and Internet of Things for Renewable Energy Systems; Woodhead Publishing: Cambridge, England, 2021; Volume 12, p. 241. [Google Scholar]
- Duan, J.; Tang, Q.; Ma, J.; Yao, W. Operational status evaluation of smart electricity meters using Gaussian process regression with optimized-ARD kernel. IEEE Trans. Ind. Inform. 2023, 20, 1272–1282. [Google Scholar] [CrossRef]
- Zhao, Z.; Chen, Y.; Liu, J.; Cheng, Y.; Tang, C.; Yao, C. Evaluation of operating state for smart electricity meters based on transformer–encoder–BiLSTM. IEEE Trans. Ind. Inform. 2022, 19, 2409–2420. [Google Scholar] [CrossRef]
- Zhao, Q.; Mu, J.; Han, X.; Liang, D.; Wang, X. Evaluation model of operation state based on deep learning for smart meter. Energies 2021, 14, 4674. [Google Scholar] [CrossRef]
- Cai, H.; Chen, H.; Ye, X.; Zhang, X.; Wen, H.; Li, J.; Guo, Q. An on-line state evaluation method of smart meters based on information fusion. IEEE Access 2019, 7, 163665–163676. [Google Scholar] [CrossRef]
- Liua, M.; Liuc, D.; Sunc, G.; Zhaoc, Y.; Wangc, D.; Liue, F.; Fangd, X.; Hee, Q.; Xuc, D. Detection of malfunctional smart electricity meters based on deep learning of electricity usage data. arXiv 2019, arXiv:1907.11377. [Google Scholar]
- Liu, M.; Liu, D.; Sun, G.; Zhao, Y.; Wang, D.; Liu, F.; Fang, X.; He, Q.; Xu, D. Deep learning detection of inaccurate smart electricity meters: A case study. IEEE Ind. Electron. Mag. 2020, 14, 79–90. [Google Scholar] [CrossRef]
- Chen, M.; Gu, X.; Wang, Y.; Ma, Y.; Li, J.; Liu, S.; Ye, X.; Lin, Z.; Yang, L. Evaluation and Replacement of Smart Meters. In Proceedings of the 2020 International Conference on Smart Grids and Energy Systems (SGES), Perth, Australia, 23–26 November 2020; IEEE: Washington, DC, USA, 2020; pp. 1005–1010. [Google Scholar]
- Yang, S.; Meng, D.; Wang, H.; Yang, C. A novel learning function for adaptive surrogate-model-based reliability evaluation. Philos. Trans. R. Soc. A 2024, 382, 20220395. [Google Scholar] [CrossRef]
- Tripathi, S.; Muhr, D.; Brunner, M.; Jodlbauer, H.; Dehmer, M.; Emmert-Streib, F. Ensuring the robustness and reliability of data-driven knowledge discovery models in production and manufacturing. Front. Artif. Intell. 2021, 4, 576892. [Google Scholar] [CrossRef] [PubMed]
- Flynn, R. Survival analysis. J. Clin. Nurs. 2012, 21 Pt 20, 2789–2797. [Google Scholar] [CrossRef]
- Harrell, J.; Frank, E.; Harrell, F.E. Cox proportional hazards regression model. In Regression Modeling Strategies: With Applications to Linear Models, Logistic and Ordinal Regression, and Survival Analysis; Springer: Berlin/Heidelberg, Germany, 2015; pp. 475–519. [Google Scholar]
- Mahmud, M. Impact of Data-Dependent Model Selection on Inference. Master’s Thesis, Concordia University, Montreal, QC, Canada, 2000. [Google Scholar]
- Shi, D.; Zhao, J.; Wang, Z.; Zhao, H.; Wang, J.; Lian, Y.; Burke, A.F. Spatial-temporal self-attention transformer networks for battery state of charge estimation. Electronics 2023, 12, 2598. [Google Scholar] [CrossRef]
- Wang, X.; Liu, H.; Du, J.; Yang, Z.; Dong, X. CLformer: Locally grouped auto-correlation and convolutional transformer for long-term multivariate time series forecasting. Eng. Appl. Artif. Intell. 2023, 121, 106042. [Google Scholar] [CrossRef]
Disclaimer/Publisher’s Note: The statements, opinions and data contained in all publications are solely those of the individual author(s) and contributor(s) and not of MDPI and/or the editor(s). MDPI and/or the editor(s) disclaim responsibility for any injury to people or property resulting from any ideas, methods, instructions or products referred to in the content. |
© 2025 by the authors. Licensee MDPI, Basel, Switzerland. This article is an open access article distributed under the terms and conditions of the Creative Commons Attribution (CC BY) license (https://creativecommons.org/licenses/by/4.0/).