Abstract
The switch open-circuit fault signal of the Vienna rectifier possesses non-stationary characteristics and is also vulnerable to external interference factors, such as sensor noise and load variation. This phenomenon reduces the performance of traditional methods, including model-based and signal-based algorithms. In order to improve the accuracy, convergence rate, and robustness of diagnosis models, a hybrid deep learning Transformer–BiTCN optimized via ISGA (Improved Snow Geese Algorithm, ISGA) is proposed in this paper. Firstly, to assess the Vienna rectifier’s open-circuit fault signal, the time-varying and non-stationary characteristics generation mechanism is analyzed. Then, combining the fault signal characteristics of the Vienna rectifier, the hybrid deep learning model using Transformer–BiTCN, along with multi-scale feature fusion, is presented to extract hierarchical features, including both global temporal dependencies and local characteristics to enhance fault diagnosis accuracy and model robustness. Finally, the ISGA optimization algorithm with the Bloch initialization strategy and the Rime search mechanism is further presented to optimize the hyperparameters of the Transformer–BiTCN model so as to improve convergence and improve accuracy. Finally, the effectiveness of our proposed method is tested by simulations and experiments. It has been verified that the Transformer–BiTCN along with ISGA optimization is robust to non-stationary open-circuit fault signals and can achieve high diagnosis accuracy with a fast convergence rate.
1. Introduction
The DC charging pile for electric vehicles, including a front-end system and a back-end system, has undergone rapid development to achieve a fast-charging speed and high efficiency []. The front-end system is responsible for obtaining a stable DC power supply with high efficiency, low input current harmonics, and high reliability []. The stability of the front-end system directly affects the safety and operation efficiency of the whole DC charging pile. Compared with two-level voltage source rectifiers (2L-VSR) and three-level neutral point clamped rectifiers (3L-NPC), Vienna rectifiers have the advantages of a high power factor, efficiency, reliability, and lower voltage stress in their switching devices, making Vienna rectifiers especially suitable for scenarios with high requirements for power density and power quality, such as grid integration of new energy sources, industrial high-performance power centers, electric vehicle charging systems, and so on [,]. However, the Vienna rectifier possesses multiple power switches, which are the most vulnerable part of the entire system. It has been recorded that Vienna rectifier faults are mainly caused by switch failures, including short-circuit faults and open-circuit faults [,,]. Short-circuit faults can be easily detected via over-current protection circuits by triggering the protection and interruption of the power supply. On the other hand, open-circuit faults are difficult to identify since the Vienna rectifier can operate continuously with distorted voltages and currents. This results in excessive switch device stress and finally causes irreversible damage and tremendous economic losses. Therefore, the research on the Vienna rectifier’s SOCF diagnosis (switch open-circuit fault, SOCF) is of significant importance.
Generally speaking, the diagnosis of the SOCF of the Vienna rectifier can be divided into a model-based method, a signal-based method, and a data-based method.
For the model-based method, values of the voltage/current are firstly calculated using a mathematical model; the differences between the normal condition and the fault condition are then compared to realize fault diagnosis. However, the diagnosis performance is greatly affected by the modeling accuracy of the converter and uncertain changes in system parameters, leading to low accuracy of diagnosis results []. For the signal-based method, time domain signal characteristics are employed by individually established indexes or rules [,,,]. For example, in [], the position of the open-switch fault is estimated by the grid angle via the input currents. In [], the fault diagnosis method for open circuit faults is presented, which is independent on fundamental wave assumptions and electric interconnection information. In [], by analyzing the features of different fault states, a space vector-based diagnosis method for open-circuit fault identification for the Vienna rectifier is presented. In [], the current path and voltage vectors were analyzed under the fault condition to detect an open-switch fault. However, for all these signal-based methods, the diagnosis performance heavily relies on prior knowledge of the fault and a pre-designed threshold. In contrast to the signal-based or model-based methods, data-based algorithms can fully learn the sequential feature from measured data without requiring any simplifications or assumptions of the system’s physical model. Therefore, recent research consequently shifts the focus to accurate open-circuit fault diagnosis using artificial intelligence approaches [,,,]. For example, in [], an improved LSTM was constructed through quantum particle swarm optimization for a Modular Multilevel Converter. In [], the SOCF diagnosis of multiple inverters has been proposed by adopting extreme learning machines. In [], a fault diagnosis method based on the channel attention mechanism for the SOCF diagnosis of the Vienna rectifier was presented, where only nine types of switch faults were considered. Moreover, for all abovementioned methods, model performance may be greatly affected by the model’s parameters, which are usually designed randomly. It is hard to find the best model parameters via the enumeration method through parameter combinations. However, there are a few studies on the optimization of a deep learning model’s parameters to achieve high accuracy for SOCF diagnosis of the Vienna rectifier.
In this paper, a hybrid deep learning Transformer–BiTCN optimized via ISGA (Improved Snow Geese Algorithm, ISGA) has been proposed for the SOCF diagnosis. Without prior knowledge or manual threshold selection, the measured currents and DC voltage can be directly used for feature extraction, and achieve high diagnostic accuracy and robustness. The innovations of this paper are listed as follows:
- The hybrid deep learning network using BiTCN (Bidirectional Temporal Convolutional Network, BiTCN) and Transformer is proposed to explore hierarchical feature representations. In detail, both global temporal dependencies and local features from forward direction to backward direction can be extracted, leading to high accuracy and strong robustness.
- The ISGA with the Bloch initialization strategy and the Rime search mechanism is proposed to automatically optimize the hyperparameters of hybrid deep learning so as to make the Transformer–BiTCN model achieve a fast convergence rate. The presented non-intrusive SOCF diagnosis approach does not require any mathematical models or additional sensors, with diagnostic time of less than 10 ms.
- The effectiveness of proposed ISGA-optimized Transformer–BiTCN algorithm is further compared with other methods, including a BiTCN-based method, Transformer-based method, and Transformer–BiTCN-based method. With the help of simulations and an experimental platform, it has been confirmed that the ISGA-optimized Transformer–BiTCN can achieve the highest accuracy and the fastest convergence speed.
The rest of this paper is organized as follows. In Section 2, a description of the problem addressed in this study is presented, followed by time-varying and non-stationary characteristics analysis of the open-circuit fault. In Section 3 and Section 4, the structure of the Transformer–BiTCN and the ISGA algorithm-optimized Transformer–BiTCN are introduced, respectively. Cases are studied via simulations and experiments to examine the model performance in Section 5. Finally, the conclusions are drawn in Section 6.
2. Problem Description and Non-Stationary Characteristics Analysis of SOCF Signal
2.1. Problem Description
The topology of the Vienna rectifier is demonstrated in Figure 1. Here, ea, eb, and ec are source voltages; ia, ib, and ic are three-phase input currents; La, Lb, and Lc are input inductors, which perform roles of energy storage and filtering; six diodes, D1 to D6, are used for the three-phase uncontrolled rectifier; T1 to T6 are power switches for power transmission; and udc1 and udc2 are the DC voltages of the upper and lower capacitors on the DC side. The corresponding control principle is shown in Figure 2 to obtain PWM T1~T6 for a stable DC voltage udc and low harmonic distortion of ia, ib, and ic.
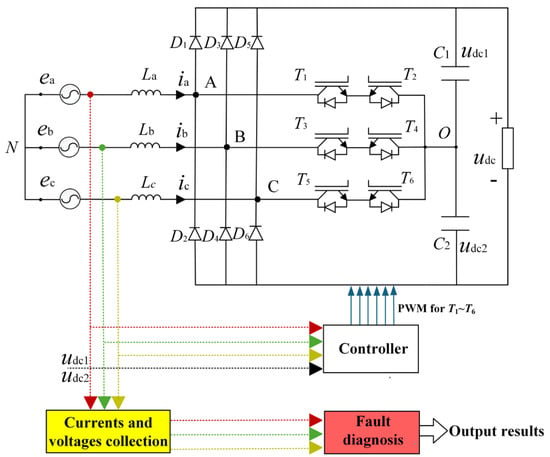
Figure 1.
The topology of the Vienna rectifier.
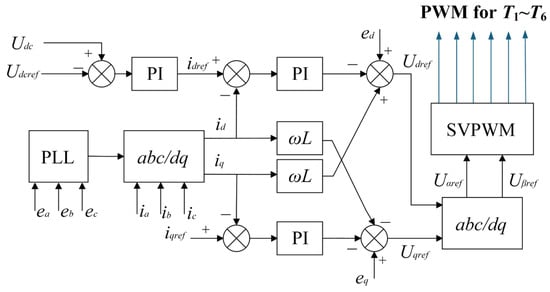
Figure 2.
The control principle of the Vienna rectifier.
For the Vienna rectifier, it is easy to immediately detect and clear the short circuit via hardware overcurrent protection. However, the early-stage characteristics of open-circuit faults are not obvious, with a long incubation period. As the fault duration increases, open-circuit faults will further cause significant damages. In this paper, SOCF diagnosis of the Vienna rectifier has been studied without any mathematical models or additional sensors. As shown in Table 1, a total of 20 SOCFs, including a single-switch fault and double-switch fault, have been considered in this paper.

Table 1.
Label of SOCFs considered in this paper.
2.2. Time-Varying and Non-Stationary Characteristics Analysis of SOCF Signal
Affected by strong nonlinearity and multi-closed-loop control, the Vienna rectifier’s open-circuit fault characteristics vary with time, exhibiting significant periodic non-stationary behavior. As shown in Figure 3, the input currents ia, ib, and ic and DC voltages udc1 and udc2 possess severe distortion for an open-circuit at T2 and T4 due to a disrupted current path. In conclusion, open-circuit faults damage the original current path of the Vienna rectifier, which triggers alternating and unpredictable periodic time-varying and non-stationary characteristics. In addition, ia, ib, ic, udc1, and udc2 are also susceptible to external interference factors, such as sensor noise and load variation, which further aggravates the time-varying and non-stationary characteristics of the SOCF signal.

Figure 3.
Waveforms of switch open-circuit faults occurring at T2 and T4: (a) the input currents ia, ib, and ic; (b) the DC voltages udc1 and udc2.
3. Proposed Hybrid Deep Learning Based on Transformer–BiTCN
As analyzed in Section 2, the input of the SOCF diagnosis model is ia, ib, ic, udc1, and udc2, and the output is the labels given in Table 1. In this paper, the SOCF diagnosis method using deep learning is employed since it can automatically learn the sequential features without requiring any simplifications or assumptions of the system’s physical model. It is well-known that the essence of deep learning is to extract the feature probability distribution of samples in datasets, and therefore, the probability distribution inevitably varies with time when it faces the time-varying and non-stationary characteristics of the SOCF signal. Therefore, it is difficult for traditional deep learning to adapt to dynamic changes in SOCF signal: ia, ib, ic, udc1, udc2.
SOCF diagnosis tasks, especially under non-stationary, multi-scale, and periodic signal conditions, require models that can capture long-range temporal dependencies via the Transformer’s self-attention mechanism and can preserve local pattern details and directional features via BiTCN. Therefore, the hybrid Transformer–BiTCN algorithm benefits from the complementary advantages of both architectures. More specifically, the Transformer excels at global signal sequence modeling but may struggle with localized temporal features or computation efficiency. The BiTCN, on the other hand, is effective in extracting local and multi-scale time-series features. By combining them together, the hybrid Transformer–BiTCN can result in more robust and accurate SOCF diagnostic results.
Details of the hybrid deep learning model based on Transformer–BiTCN with multi-scale feature fusion is presented in Figure 4, which can effectively respond to the time-varying and non-stationary characteristics of the SOCF signal: ia, ib, ic, udc1, udc2. Generally, the feed-forward layer of a traditional Transformer model [] is replaced by a BiTCN network with multiple kernel sizes to enhance local feature extraction capability while preserving the global perspective of the traditional Transformer, which is more suitable for the time-varying and non-stationary context of SOCF diagnosis of the Vienna rectifier.
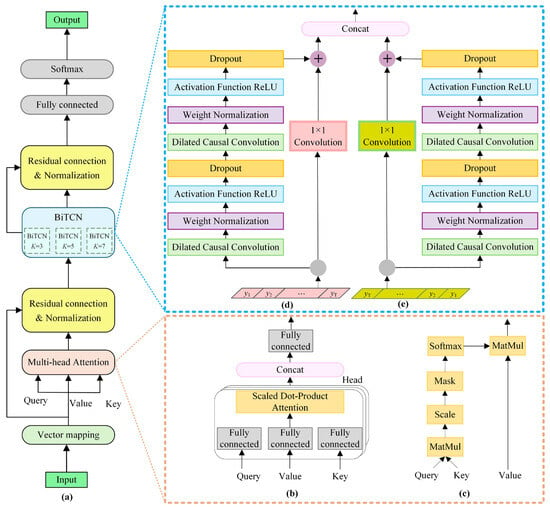
Figure 4.
Framework of proposed hybrid deep learning model based on a Transformer–BiTCN. (a) The whole network diagram. (b) The schematic diagram of the multi-head mechanism. (c) The calculation of scaled dot-product attention. (d) The schematic diagram of forward TCN for each kernel size K. (e) The schematic diagram of backward TCN for each kernel size K.
As demonstrated in Figure 4, the proposed hybrid deep learning model mainly includes vector mapping, multi-head attention, and a BiTCN module, which will be demonstrated in detail in the following parts of this section.
3.1. Vector Mapping
Vector mapping converts the input sequence into a fixed-dimensional vector space, thereby enabling the further learning of subsequent layers. Since convolutional calculations are embedded in the hybrid deep learning model, it is necessary to encode the positions of the input sequences to establish the relative positions of each input element. The Sinusoidal positional encoding used in this paper is shown in Equation (1).
where pos is the position of input sequence; 2i and 2i + 1 are, respectively, the values of positional encoding vector for 2i-th and (2i + 1)-th; and dmodel is the dimension.
3.2. Multi-Head Attention and Normalizaiton
The attention mechanism is the core of the Transformer network. As shown in Figure 4b, multi-head attention is employed in this paper to obtain the correlation between data in the input sequence. Here, multiple heads using scaled dot-product attention are stacked together with same Query, Key, and Value vectors. The detailed calculation method is given in Equations (2)–(4). Firstly, the input x is multiplied by the matrix UQ, UK, and UV to obtain Query vector Q, Key vector K, and Value vector V, respectively. Then, according to Figure 4c, the attention weight of the i-th head can be obtained through Equation (3), where the dimension of K is dk. Finally, according to Equation (4), whose weight matrix is Uoutput, the H1, H2,···, Hn are concated to focus on different features embedded in the input sequence, thereby improving its generalization ability.
3.3. Principle of BiTCN
The TCN (Temporal Convolutional Network, TCN) is a neural network architecture designed to process time-series data. The core of the TCN lies in the stacking of multiple one-dimensional dilated causal convolutions. Unlike traditional Recurrent Neural Networks that require sequential processing, the TCN can perform parallel processing on the entire sequence, thus offering significant advantages in handling sequential data. Meanwhile, the TCN network’s integration of techniques, including causal convolution, dilated convolution, and residual blocks, could solve the problem of model performance degradation, thus exhibiting high efficiency and accuracy [,].
In this paper, since multiple variables, including currents ia, ib, and ic and DC voltages udc1 and udc2, are introduced to a deep learning network, the ability of the TCN to capture local features of input sequences degrades, leading to reduced generalization capability. The main reason for this is that the TCN has a unidirectional structure, without accessing future data features from the lower layer. In other words, the feature at a specific time step in an upper layer only depends on the features at the current time step and earlier time steps in the lower layer.
Hence, as illustrated in Figure 4, by transmitting information in both forward and reverse directions, the BiTCN using different kernel sizes K (K = 3, 5, 7) is adopted. It helps to capture local features with different receptive fields, thereby enriching the diversity of local details and enhancing the model’s representational capability. This is beneficial to dealing with time-varying and non-stationary sequential data for SOCF diagnosis of the Vienna rectifier.
4. Proposed ISGA-Optimized Transformer–BiTCN Algorithm
The hyperparameters of deep learning models have a significant influence on both the model performance and training process. For example, larger kernel sizes in BiTCN modules may increase the computational burden of the model, while smaller ones may fail to capture sufficient temporal information. A grid search is a typical technique for hyperparameter determination, which systematically traverses various hyperparameter combinations to find the optimal model performance. In this way, the effectiveness of the grid search is highly dependent on predefined traversal space, resulting in failure to identify an optimal solution if it lies outside the predefined values. Moreover, nested loop navigation is also essential for a grid search, leading to increased computational time. Furthermore, as hyperparameter dimensionality increases, the sparsity of the parameter space intensifies. Even if each hyperparameter takes only a small number of values (e.g., 3–5), the total number of effective combinations in the high-dimensional space still grows exponentially, leading to a sharp decline in search efficiency and even rendering traversing infeasible.
Therefore, it is hard to find the best solution through parameter combinations or a grid search since the diagnosis method always has various hyperparameters. Fundamentally, hyperparameter optimization in the deep learning model of the Transformer–BiTCN is typically a highly non-convex optimization problem, and the use of a metaheuristic algorithm can enable more effective exploration within this non-convex search space. The SGA is a novel nature-inspired metaheuristic algorithm. Owing to its Brownian motion mechanism, it excels at escaping local optima and precisely searching for the optimal value. Furthermore, it can enhance the number of effective iterations of the algorithm when applied to long-cycle, non-stationary open-circuit SOCF diagnosis, making it particularly applicable to open-circuit fault diagnosis of the Vienna rectifier.
In this paper, an ISGA-optimized Transformer–BiTCN algorithm is presented to determine the model’s hyperparameters, including learning rate decay factor, dropout rate, batch size, layer number of the Transformer, and the number of attention heads.
4.1. Presented ISGA Algorithm
Compared with traditional SGA [], the following improvements have been made in certain aspects to accelerate the algorithm’s convergence speed and enhance the accuracy of the optimal solution. Here, the ISGA is an intelligent optimization strategy designed to efficiently search the hyperparameter space and structural configurations of abovementioned deep hybrid model. In detail, the ISGA is employed to optimize key hyperparameters and network structure parameters. This data-driven, automated optimization helps to achieve a more efficient, accurate, and generalized model, avoiding human bias in design and significantly improving diagnostic performance over default or manually tuned models.
- A.
- Bloch-Based Population Initialization Strategy
For the traditional SGA algorithm, the search space relies entirely on randomness, leading to low convergence accuracy and slow convergence speed. In this paper, a Bloch coordinate-encoding scheme is combined with SGA to enhance the diversity of the population and accelerate the algorithm’s convergence speed.
Figure 5 shows the Bloch sphere representation of a qubit. It is known that the point P on the sphere can be determined by and θ, and any qubit corresponds to a point on the Bloch sphere. Therefore, all qubits can be represented using Bloch coordinates, as shown in Equation (5).
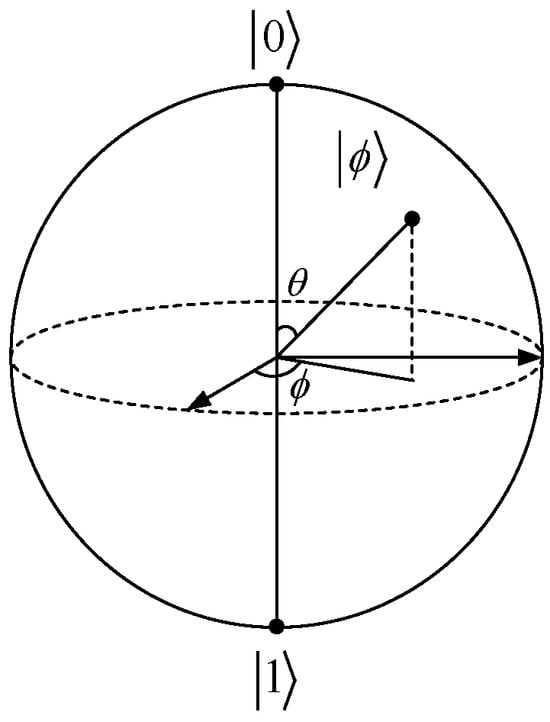
Figure 5.
Bloch sphere representation of a qubit.
Then, the Bloch coordinates of qubits are directly used as the encoding, whose encoding scheme is as follows:
where r is a random number within the interval [0, 1], , ; N is population size; ; n is dimension of the optimization space; and .
Each candidate solution simultaneously occupies 3 positions in the space, meaning it represents the following 3 optimal solutions at the same time: Solution X, Solution Y, and Solution Z, as given in Equation (7).
The Bloch coordinates of the j-th qubit on the candidate solution pi are denoted as . In the optimization problem, the value range of the j-th dimension of each solution space is [aj,bj]. Then, the transformation formula for mapping from the unit space to the optimization problem’s solution space is
Hence, each candidate solution corresponds to three solutions of the optimization problem. Among all candidate solutions, N individuals with smaller fitness values are selected as the initial population. This helps to enhance the traversing ability of the search space, increasing the diversity of the population, thereby improving the quality of the population and accelerating the algorithm’s convergence speed.
- B.
- Improved Position Update Technique via Rime Search Strategy
The SGA algorithm relies on an exploration stage and development stage. Specifically, the exploration stage, namely a herringbone shape, is responsible for discovering the global optimal region through random perturbations and group collaboration and the development stage, namely a straight-line shape, is accountable for local refinement search. After the exploration phase identifies potential optimal regions, the development phase concentrates resources to conduct a refined search in the neighborhood of the optimal solution through straight-line flight. Hence, the performance of the development phase is of significant importance to achieve a high-efficiency local search and precise convergence.
As shown in Equation (9), the traditional SGA is guided by the current solution if rand > 0.5, which may lead to the entire algorithm being unable to escape the local optimum.
Here, ⊕ denotes entry-wise multiplication and Pbt and Pit are the optimal solution positions at the current iteration and the current particle position.
In order to solve abovementioned problem, under the condition of rand > 0.5, Equation (9) of the traditional SGA is refined using the Rime search strategy. As shown in Equation (10), the position of the Rime particles is calculated as follows []:
where denotes the new position of the updated particle, with p and q as the q-th particle of the p-th Rime agent; is the q-th particle of the best Rime agent in the Rime population R; t is the current number of iterations; T is the maximum number of iterations of the algorithm; the rand() function controls the direction of particle movement together with cosθ, which will change following the number of iterations; and β is the environmental factor, which follows the number of iterations to simulate the influence of the external environment and is used to ensure the convergence of the algorithm. The default value of ω is 5.
In this way, as the soft ice condensation area increases, its strong randomness and wide coverage enable the algorithm to rapidly cover full-space searches, thereby balancing globality and locality in the optimization process. Meanwhile, the hard ice, influenced by external factors, tends to condense in the same direction. Due to the consistent growth direction of hard ice, it easily intersects with other hard ice, enabling dimensional exchange between ordinary particles and optimal particles, which helps improve solution accuracy.
In general, compared with traditional SGA, our proposed ISGA with a Rime mechanism can improve the convergence of the algorithm and simultaneously achieve the ability to jump out of the local optimum.
4.2. Procedure of ISGA-Optimized Transformer–BiTCN Algorithm
In this section, we give a brief introduction to the structure of proposed algorithm. The ISGA-optimized Transformer–BiTCN algorithm provides an efficient way to obtain the global optimal hyperparameters of the Transformer–BiTCN model with fast convergence speed. To be specific, the time series data of currents and voltages are introduced as the model inputs, and all data is divided into a training set, validation set, and testing set.
For the ISGA algorithm, the accuracy of the Transformer–BiTCN is considered the objective function. By optimizing the loss function of Transformer–BiTCN outputs on both training and validation data, optimal weight parameters are obtained. During the model testing stage, the optimized parameters obtained through the ISGA are used to yield the final test results. The optimization ranges of each hyperparameter to be optimized are shown in Table 2, including the learning rate decay factor ƞ, dropout rate d, batch size ρ, layer number of Transformer l, and number of attention heads h.

Table 2.
The optimization ranges of each hyperparameter to be optimized.
As demonstrated in Figure 6, the detailed structure of the proposed ISGA-optimized Transformer–BiTCN algorithm can be described as follows:
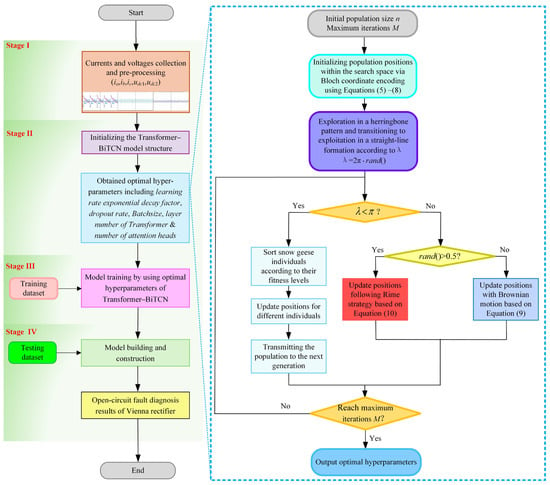
Figure 6.
Procedure of ISGA-optimized Transformer–BiTCN algorithm.
Step 1: Collect input currents ia, ib, and ic and DC voltages udc1 and udc2 of the Vienna rectifier, shown in Figure 1, under various operation conditions, and pre-process all these data through missing-value elimination, normalization, and label encoding.
Step 2: Pre-processed ia′, ib′, and ic′ and udc1 and udc2 are formed as the inputs of the model and they are divided into a training set, validation set, and testing set. It should be mentioned that there is no overlap between the three datasets.
Step 3: Set up the architecture of the Transformer–BiTCN model, as shown in in Figure 5, and apply the initialized ISGA parameters with the population initialization strategy outlined in Equations (6)–(8) to the network structure. Apply the Transformer–BiTCN with the initial parameters to recognize the open-circuit fault and calculate the corresponding fitness. The fitness function is used in this paper to reflect the accuracy of the diagnosis results after optimization. A bigger value means a better result for open-circuit diagnosis. To avoid the instability of the fitness function caused by fluctuations in a single training run, the average performance of multiple cross-validations is employed as the fitness value. In this paper, the average accuracy of F-fold cross-validation is used, as described in Equation (11):
where F is the number of cross-validation folds and Lossf(ζ) is the accuracy of the f-th fold.
Step 4: Use the ISGA algorithm to optimize the parameters according to the improved position update technique via Equations (9) and (10). During this stage, it is necessary to check whether the algorithm has reached the maximum number of iterations and whether the fitness value is less than the system threshold. If so, the iteration is terminated; otherwise, the iteration is continued.
Step 5: The final positions of snow geese individuals are used as the optimized parameters for the Transformer–BiTCN.
Step 6: The training set is used to train the other hyper-parameters of the Transformer–BiTCN model with preset parameters via the ISGA algorithm. After each training epoch, the validation set is employed to conduct model optimization validation. This ensures that the model continuously improves during the training process. Once the training reaches the preset number of iterations, the trained model is saved for subsequent testing.
Step 7: The test set is input into the model saved in step 6 to evaluate the model’s performance. If the evaluation results indicate that the model’s diagnostic capabilities cannot yet reach the optimal level, the process returns to step 6 for further model training and validation. This iterative process continues until the model’s performance meets predefined criteria. At this point, the optimally performing model is obtained. Subsequently, this offline trained model can be deployed in the actual working production of the SOCF online diagnostics.
Step 8: Use the optimized parameter to diagnose open-circuit fault of Vienna rectifier and output the recognized results.
4.3. The Implementation of the Proposed Algorithm
Once the hyperparameters of model proposed in Figure 5 are well trained, the obtained model can be applied for open-circuit fault diagnosis in a practical field. The whole flowchart for Vienna open-circuit fault diagnosis is illustrated in Figure 7.
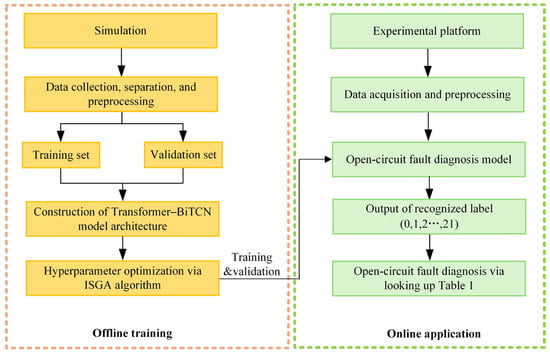
Figure 7.
Fault diagnosis process.
Step 1: The input currents ia, ib, and ic and DC voltages udc1 and udc2 of the Vienna rectifier from the experimental platform under different SOCF faults are sampled and employed as the raw signal for diagnosis.
Step 2: The raw current sampled data collected in Step 1 are pre-processed, including normalization and the removal of abnormal values.
Step 3: The pre-processed data is then directly introduced to the well-trained SOCF diagnosis model with optimized parameters and structure.
Step 4: The SOCF diagnosis results are recognized and the faulted switches are located by referring to Table 1.
5. Case Studies
5.1. Dataset Geberation
In this paper, the SOCF database has been built for model training and validation by constructing a simulation model for the Vienna rectifier. Meanwhile, an experimental platform was also developed for model testing. The simulation parameters are consistent with those of the experimental platform, as detailed in Table 3.

Table 3.
The parameters of the Vienna rectifier.
In order to cover different operating conditions of the Vienna rectifier, the following factors are considered during data generation, including wide-range load variation (0.1–8 kW), random fault occurrence time and duration, AC-side inductor variation (8–12 mH), and DC-link capacitor fluctuations (1.16–2.16 mF). With the help of MATLAB R2025a, samples are randomly generated for training and validation, respectively. Since noise is inherently ubiquitous during the practical operation of a Vienna rectifier, noise with a signal-to-noise ratio (SNR) ranging from 10 dB to 50 dB is intentionally added to the data generation process. Similarity, other samples for testing are produced via our developed platform with the same system parameters outlined in Table 3. In order to validate the proposed model’s robustness, all the abovementioned datasets have been separated into 8 groups according to system’s rated power, as shown in Table 4.

Table 4.
The separated databases.
To comprehensively evaluate the effectiveness of the proposed model in open-circuit fault diagnosis, the metrics Accuracy and Loss, as defined in Equations (12) and (13), are used to validate model performance.
Here, Ncorrect denotes the number of correct diagnostic results and Ntotal represents the total number of tests.
Here, is the output of Softmax and equals 1 if the target class of the i-th instance is k; otherwise, it equals 0.
During the training process of this model, we set a total of 500 training epochs. The selection of this number of epochs was determined through multiple experiments and optimizations. According to our tests, it is found that when the number of epochs is too small, the model fails to adequately learn the features and patterns in the data, resulting in suboptimal performance. Conversely, when the number of epochs is excessive, the model may exhibit overfitting, where it performs well on the training set but shows degraded performance on the validation and test sets. After comprehensive evaluation, setting the number of epochs to 500 strikes an appropriate balance. It ensures that the model can learn the data sufficiently while effectively preventing overfitting, enabling the model to achieve stable and excellent performance across various datasets.
For the choice of activation function, ReLU is computationally efficient and helps mitigate the vanishing gradient problem, serving as the default choice in this paper. A learning rate with an exponential decay factor is employed, and its decay factor is optimized via the ISGA algorithm. During the model training stage, the Adam optimizer is employed since it offers fast convergence speeds and strong generalization capabilities, enabling the training of high-performance models in a relatively short time.
5.2. Performance Comparison Between Different Optimization Algorithms
To further validate the improvement effects of the Bloch-based population initialization strategy and improved position update technique via the Rime strategy on the traditional SGA algorithm compared with other 4 models, as shown in Table 5, various benchmark functions were employed to evaluate the convergence speed and the quality of optimal solution.

Table 5.
The short name of different optimization models.
In Figure 8, the model performance of the presented Transformer–BiTCN model by using different optimization algorithms is demonstrated, where ABC, RBMO, TOC, traditional SGA, and ISGA are, respectively, tested on 8 databases, as shown in Table 4.
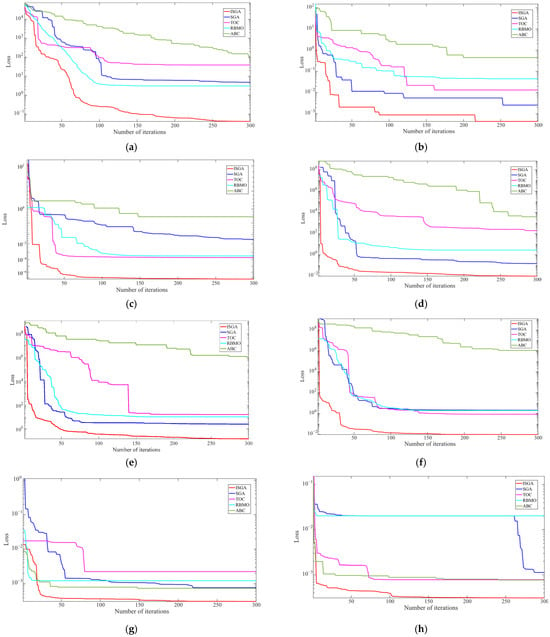
Figure 8.
The model performance of the Transformer–BiTCN by using different optimization algorithms on Database 1 to 8. (a) The model performance on Database 1. (b) The model performance on Database 2. (c) The model performance on Database 3. (d) The model performance on Database 4. (e) The model performance on Database 5. (f) The model performance on Database 6. (g) The model performance on Database 7. (h) The model performance on Database 8.
Here, the vertical axis represents the Loss during training and the horizontal axis rep resents the number of iterations. From Figure 8, it can be observed that as the number of iterations increases, the Loss of the Transformer–BiTCN model using the ISGA optimization algorithm achieves the smallest value and exhibits a convergent state. In contrast, the Loss of the Transformer–BiTCN model via other optimization algorithms is comparatively larger or converges more slowly. The convergence performance of the ISGA optimization algorithm is superior to that of optimization algorithms such as ABC, RBMO, TOC, and traditional SGA. The optimal hyperparameters of the Transformer–BiTCN model are shown in Table 6.

Table 6.
The optimized hyperparameters of Transformer–BiTCN.
Table 7 further demonstrates the performance comparison between different optimization algorithms. From Table 7, it can be concluded that our proposed ISGA-optimized Transformer–BiTCN can achieve the highest diagnosis accuracy while maintaining the lowest loss value, the shortest processing time, and the minimum number of parameters. The main reason for this is that the ISGA optimization algorithm with a Bloch initialization strategy and Rime search mechanism can enhance the model’s exploration capability to escape local optima and converge to the global optimum.

Table 7.
The performance comparison between different optimization algorithms.
5.3. Performance Comparison Between Different Deep Learning Models
As shown in Table 8, model 1 to model 9 are employed to verify the performance of the proposed hybrid model via the improved Transformer and Bi-TCN with ISGA in this paper. In order to confirm the superiority of the presented method, Dataset 1 to Dataset 8 in Table 4 are employed for comparison, where the average diagnostic accuracy on the testing set is calculated across 50 results on our built experimental platform. Figure 9 shows the deviation between the maximum and the minimum SOCF accuracy.

Table 8.
The short names of comparative models.
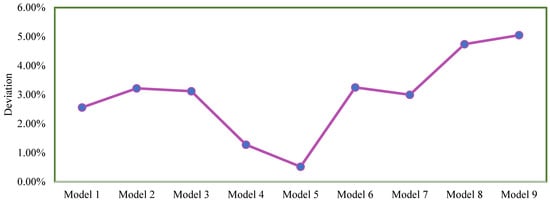
Figure 9.
The deviation value using different models.
- (1)
- The presented Model 5 achieves the highest accuracy on all datasets, including Dataset 1 to Dataset 8. This is because the proposed Transformer–BiTCN can simultaneously learn global features and temporal dependencies of SOCF signals from the forward direction to the backward direction to effectively process the time-varying and non-stationary characteristics of the SOCF signal. That is to say, the presented Transformer–BiTCN model with multi-scale feature fusion effectively exhibits superior fault diagnosis accuracy when handling fault signals with periodic non-stationary characteristics.
- (2)
- Each model achieves the highest SOCF accuracy on Dataset 4 or Dataset 5, while having the lowest accuracy on Dataset 1 or Dataset 8. For model 1 to model 9, the deviations between the maximum SOCF accuracy and the minimum SOCF accuracy are 2.56%, 3.22%, 3.12%, 1.28%, 0.52%, 3.25%, 3.00%, 4.74%, and 5.05%, respectively. The main reason lies in the fact that the discrepancy between the training set and test set is the largest in Dataset 1 and Dataset 8, while minimum difference occurs in Dataset 4 and Dataset 5, according to Table 4. However, the deviation value of our presented Transformer–BiTCN with ISGA is only 0.52%, exhibiting strong robustness and satisfied generalization ability to load variation.
- (3)
- Comparing the performance of Model 4 and Model 5, the ISGA optimization algorithm can achieve higher SOCF diagnosis accuracy, indicating that automated optimization can avoid human error and significantly improve diagnostic performance over the default or manually tuned models.

Table 9.
The performance comparison between different deep learning models.
Table 9.
The performance comparison between different deep learning models.
| Models | Database 1 | Database 2 | Database 3 | Database 4 | Database 5 | Database 6 | Database 7 | Database 8 |
|---|---|---|---|---|---|---|---|---|
| Model 1 | 91.54% | 91.63% | 91.70% | 91.82% | 91.87% | 90.79% | 90.14% | 89.31% |
| Model 2 | 89.11% | 90.78% | 91.05% | 91.38% | 92.20% | 92.33% | 92.26% | 91.84% |
| Model 3 | 95.03% | 97.41% | 97.88% | 97.83% | 98.10% | 98.15% | 98.10% | 97.75% |
| Model 4 | 98.21% | 98.90% | 99.01% | 99.27% | 99.31% | 98.71% | 98.92% | 98.03% |
| Model 5 | 99.57% | 99.76% | 99.80% | 99.85% | 99.91% | 99.69% | 99.55% | 99.39% |
| Model 6 | 88.62% | 90.01% | 91.04% | 90.97% | 91.80% | 91.87% | 90.95% | 90.76% |
| Model 7 | 88.03% | 89.44% | 90.62% | 90.33% | 90.97% | 91.29% | 91.03% | 90.80% |
| Model 8 | 94.05% | 93.30% | 96.96% | 96.74% | 98.04% | 97.71% | 97.83% | 97.57% |
| Model 9 | 92.55% | 91.98% | 95.03% | 95.76% | 97.03% | 96.72% | 96.93% | 96.07% |
5.4. Performance Comparison Between Different SNRs
As shown in Figure 10, the performance of the proposed method (namely, model 5 in Table 7) has been compared between different SNRs to confirm its robustness to noise. As clearly validated in Figure 10, the following conclusions can be drawn:
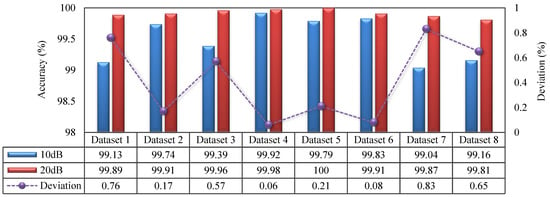
Figure 10.
Comparison between different SNRs.
- (1)
- The accuracy with the SNR being 10 dB drops slightly compared to the results with the SNR being 20 dB. However, it should be mentioned that the SOCF diagnosis accuracy is still greater than 99% for Dataset 1 to Dataset 8 with the SNR being 10 dB.
- (2)
- The maximum deviation of SOCF diagnosis accuracy between 10 dB and 20 dB is 0.83%, which confirms that the proposed model has significantly enhanced the diagnostic model’s robustness to noise under the non-stationary characteristics of the SOCF signal.
5.5. Performance Comparison with Other Linear or Gradient Approaches
To further verify the diagnostic accuracy of the proposed hybrid model via the improved Transformer and Bi-TCN model with ISGA under non-stationary open-circuit faults in Vienna rectifiers, a comparative analysis has been conducted between the presented model and other linear or gradient approaches, including Bayesian Network, Linear Support Vector Machine, Shallow Gradient Boosting Decision Tree, and Random Forests. During our testing, the average values of 50 results have been analyzed for comparative analysis, and the corresponding results are shown in Table 10. Here, it can be seen that the proposed method achieves the highest fault diagnosis accuracy, with a fault diagnosis accuracy rate of 99.69%, a precision rate of 99.76%, and a recall rate of 99.71%. This indicates that the proposed method better fits the probability distribution of fault features and therefore exhibits superior fault diagnosis accuracy when dealing with fault signals characterized by periodic non-stationarity.

Table 10.
The comparative results of diagnosis accuracy.
5.6. Online Testing on the Experimental Platform
For online testing of SOCF diagnosis, the real-time performance is related to multiple factors, mainly including sequence length of input data, model parameters, network depth, and hardware computation performance. In this paper, model parameters and network depth are optimized using ISGA algorithm. The hardware computation server is equipped with 2×NVIDIA RTX 4090 GPU (NVIDIA Corporation, Santa Clara, CA, USA) and 4 × 2 TB memory. To ensure the operation in real time, the following two different strategies are adopted: (1) parallel inference strategies across multiple GPUs to accelerate batch processing; (2) except for the optimized hyperparameters in Table 6, other parameters, such as sequence length of input data, are manually tested for satisfied real-time performance.
- A.
- Case 1: Normal operation
From Figure 11, it can be seen that the performance under normal operation condition is satisfactory. The output voltages udc1 and udc2 are 400 V, respectively, indicating that the total DC voltage is 800 V; meanwhile, the currents ia, ib, and ic are relatively smooth sine waves, which provides a solid foundation for SOCF diagnosis.

Figure 11.
Current and voltage waveforms under normal operation: (a) the input currents ia, ib, and ic; (b) the voltages udc1 and udc2.
- B.
- Case 2: The SOCF diagnosis
The SOCF diagnosis results are shown in Figure 12, Figure 13 and Figure 14. Compared with normal operation in Figure 11, it can be seen that the DC voltages udc1 and udc2 fluctuate; meanwhile, the currents are distorted once an open-circuit fault occurs. Moreover, it is also obviously observed that different SOCF types will lead to different currents (ia, ib, ic) and voltages (udc1, udc2). Conversely, the SOCF types can be detected through monitored currents (ia, ib, ic) and voltages (udc1, udc2). In this paper, the relationship or function between the monitored ia, ib, ic, udc1, and udc2, and the SOCF type in Table 1 is established via our proposed model, as presented in Figure 7, to automatically associate the monitored ia, ib, ic, udc1, and udc2 with the SOCF result.

Figure 12.
Current and voltage waveforms when open-circuit fault occurs in T1: (a) the input currents ia, ib, ic; (b) the voltages udc1 and udc2.

Figure 13.
Current and voltage waveforms when open-circuit fault occurs in T2: (a) the input currents ia, ib, ic; (b) the voltages udc1 and udc2.

Figure 14.
Current and voltage waveforms when an open-circuit fault occurs in T1 and T2: (a) the input currents ia, ib, ic; (b) the voltages udc1 and udc2.
Figure 12, Figure 13 and Figure 14 show that our proposed Transformer–BiTCN network with ISGA can accurately and quickly distinguish fault switches from healthy switches, where the output label produced using the method presented in this paper is consistent with Table 1. A large amount of data show that this method can accurately detect different switch open-circuit faults, such as open-circuit faults of one switch, double switches of the same bridge arm, and double switches of different bridge arms. Moreover, the total time for fault diagnosis is nearly 10 ms.
6. Conclusions
In this paper, a data-driven approach for the non-intrusive fault diagnosis of a Vienna rectifier is presented. The hybrid deep learning architecture via a Transformer–BiTCN model is proposed to explore hierarchical feature representations. Specifically, both global temporal dependencies and local features from the forward direction to the backward direction are achieved for high accuracy and strong robustness. Moreover, the ISGA with a Bloch initialization strategy and Rime search mechanism is also presented to automatically optimize hyperparameters of the Transformer–BiTCN for a fast convergence rate. Finally, the effectiveness and viability of the proposed model are confirmed through both simulations and experiments, with a diagnostic time of less than 10 ms and a diagnostic accuracy greater than 99.81% under the condition of an SNR of 20 dB.
In the future, we will try to adapt the proposed model for real-time operation on resource-constrained embedded platforms and further validate model robustness in industrial settings by testing it under noisy sensor data, variable latency conditions, and so on. During this process, we will also test the model’s performance over longer operating cycles, taking into account component aging.
Author Contributions
Conceptualization, Y.D. and H.J.; methodology, Y.D.; software, H.J. and Y.L.; validation, G.L., X.W. and Y.L.; formal analysis, Y.D.; investigation, H.J.; resources, Y.D.; data curation, H.J.; writing—original draft preparation, Y.D.; writing—review and editing, Y.D.; visualization, H.J.; supervision, Y.D.; project administration, Y.D.; funding acquisition, Y.D. All authors have read and agreed to the published version of the manuscript.
Funding
This research was funded in part by the National Natural Science Foundation of China under Grant 62103328 and in part by the Key Project of Shaanxi Provincial Department of Education’s Scientific Research Program under Grant 24JS037.
Data Availability Statements
Dataset available on request from the authors.
Conflicts of Interest
The authors declare no conflicts of interest. The authors also declare that the work described is original research that has not been published previously, and is not under consideration for publication elsewhere, in whole or in part. In addition, the authors declare that they have no known competing financial interests or personal relationships that could have appeared to influence the work reported in this paper.
References
- Dutta, S.; Bauman, J. An Overview of 800 V Passenger Electric Vehicle Onboard Chargers: Challenges, Topologies, and Control. IEEE Access 2024, 12, 105850–105864. [Google Scholar] [CrossRef]
- Song, W.; Yang, Y.; Du, M.; Wheeler, P. Study of Constant DC-Voltage Control for VIENNA Rectifier Under No-Load Condition. IEEE Trans. Transp. Electrif. 2025, 11, 4730–4743. [Google Scholar] [CrossRef]
- Tian, S.; Campos-Gaona, D.; Mortazavizadeh, S.; Peña-Alzola, R.; Anaya-Lara, O. Low Harmonics Offshore Hybrid HVDC System Based on Vienna Rectifier and Voltage Source Converter with Back-up Capability. IEEE Trans. Energy Convers. 2024, 39, 2169–2183. [Google Scholar] [CrossRef]
- Liao, Y.-H.; Xie, B.-R.; Liu, J.-S. A Novel Voltage Judgment Component Injection Scheme for Balanced and Unbalanced DC-link Voltages in Three-Phase Vienna Rectifiers. IEEE Trans. Ind. Electron. 2024, 71, 13567–13577. [Google Scholar] [CrossRef]
- Aslani-Gaznag, F.; Neyshabouri, Y.; Farhadi-Kangarlu, M.; Khiavi, A.M. An Open Circuit Fault-Tolerant Method for Cascaded Cross-Switched Multilevel Inverter. IEEE J. Emerg. Sel. Top. Power Electron. 2025. [Google Scholar] [CrossRef]
- Zhou, H.; Xiang, X.; Li, H.; Zhang, H.; He, S.; Li, K. Open-Circuit Fault Diagnosis for T-Type Three-Level Inverter-Fed Dual Three-phase PMSM Drives. IEEE Trans. Power Electron. 2025, 1–16. [Google Scholar] [CrossRef]
- Lee, J.-S.; Lee, K.-B. Open-Switch Fault Diagnosis and Tolerant Control Methods for a Vienna Rectifier Using Bi-Directional Switches. In Proceedings of the 2018 IEEE Energy Conversion Congress and Exposition (ECCE), Portland, OR, USA, 23–27 September 2018; pp. 4129–4134. [Google Scholar]
- Yang, C.; Zhang, F.; Cheng, L.; Zhang, Z.; Wang, T. A Fault-Tolerant Control Method for Improving Input Current Half-Wave Symmetry Under Single-Switch Open-Circuit Fault of Front-End Vienna Rectifier in More-Electric Aircraft. IEEE Trans. Power Electron. 2025, 40, 2170–2183. [Google Scholar] [CrossRef]
- Li, C.; Hu, J.; Zhao, M.; Zeng, W. An Open-Circuit Fault Diagnosis for Three-Phase PWM Rectifier Without Grid Voltage Sensor Based on Phase Angle Partition. IEEE Trans. Circuits Syst. I Regul. Pap. 2024, 71, 5318–5328. [Google Scholar] [CrossRef]
- Lenz, R.; Kugi, A.; Kemmetmüller, W. Online Fault Diagnosis for Multiple Open-Circuit Faults in Multiphase Drives with Current Harmonics. In Proceedings of the 2024 International Conference on Electrical Machines (ICEM), Torino, Italy, 1–4 September 2024; pp. 1–7. [Google Scholar]
- Liu, M.; Peng, L.; Xu, W.; Guo, X.; Chen, C. A Space Vector Based Diagnosis Method for Switch Open-Circuit Fault in Vienna Rectifier. In Proceedings of the 2022 IEEE Energy Conversion Congress and Exposition (ECCE), Detroit, MI, USA, 9–13 October 2022; pp. 1–7. [Google Scholar]
- Park, J.-H.; Lee, J.-S.; Kim, M.-Y.; Lee, K.-B. Diagnosis and Tolerant Control Methods for an Open-Switch Fault in a Vienna Rectifier. IEEE J. Emerg. Sel. Top. Power Electron. 2021, 9, 7112–7125. [Google Scholar] [CrossRef]
- An, Y.; Sun, X.; Ren, B.; Zhang, X. Open-Circuit Fault Diagnosis for a Modular Multilevel Converter Based on Hybrid Machine Learning. IEEE Access 2024, 12, 61529–61541. [Google Scholar] [CrossRef]
- Xia, Y.; Xu, Y.; Zhou, N. A Transferrable and Noise-Tolerant Data-Driven Method for Open-Circuit Fault Diagnosis of Multiple Inverters in a Microgrid. IEEE Trans. Ind. Electron. 2024, 71, 8017–8027. [Google Scholar] [CrossRef]
- Hu, X.; Hu, J.; Guan, Q.; Zhang, Y.; Wang, Q.; Zhou, D. An Open-Circuit Fault Diagnosis Method for Charging Piles Based on Attention Mechanism. In Proceedings of the IECON 2024-50th Annual Conference of the IEEE Industrial Electronics Society, Chicago, IL, USA, 3–6 November 2024; pp. 1–6. [Google Scholar]
- Zou, Z.; Zeng, Z.; Wen, Y.; Wang, W.; Xu, Y.; Jin, T. Information Fusion Model Based Improved Multi-Scale Convolutional Neural Network for Fault Diagnosis in EV V2G Charging Pile. In Proceedings of the 2023 IEEE 7th Conference on Energy Internet and Energy System Integration (EI2), Hangzhou, China, 15–18 December 2023; pp. 4068–4073. [Google Scholar]
- Zhou, Y.; YLei, Z.; Liao, W.; Lian, X.; Wu, C. Remaining Useful Life Prediction of Li-Ion Batteries Based on GRU-Transformer. In Proceedings of the 2025 IEEE 14th Data Driven Control and Learning Systems (DDCLS), Wuxi, China, 9–11 May 2025; pp. 2058–2062. [Google Scholar]
- Dash, J.R.; Mohanty, P.K.; Agarwal, P.; Jena, P.; Padhy, N.P. Temporal Convolutional Network-based Capacitor Voltage Prediction with Reduced Switching Frequency for Voltage Balancing in MMC. IEEE Trans. Ind. Appl. 2025, 61, 7443–7458. [Google Scholar] [CrossRef]
- Xu, X.; Zhou, Z.; Zhao, H. Short-term power load forecasting based on TCN-LSTM model. In Proceedings of the 2024 3rd International Conference on Energy, Power and Electrical Technology (ICEPET), Chengdu, China, 17–19 May 2024; pp. 1340–1343. [Google Scholar]
- Tian, A.Q.; Liu, F.F.; Lv, H.X. Snow Geese Algorithm: A novel migration-inspired meta-heuristic algorithm for constrained engineering optimization problems. Appl. Math. Model. 2024, 126, 21. [Google Scholar] [CrossRef]
- Su, H.; Zhao, D.; Heidari, A.; Liu, L.; Zhang, X.; Mafarja, M.; Chen, H. Rime: A physics-based optimization. Neurocomputing 2023, 532, 183–214. [Google Scholar] [CrossRef]
Disclaimer/Publisher’s Note: The statements, opinions and data contained in all publications are solely those of the individual author(s) and contributor(s) and not of MDPI and/or the editor(s). MDPI and/or the editor(s) disclaim responsibility for any injury to people or property resulting from any ideas, methods, instructions or products referred to in the content. |
© 2025 by the authors. Licensee MDPI, Basel, Switzerland. This article is an open access article distributed under the terms and conditions of the Creative Commons Attribution (CC BY) license (https://creativecommons.org/licenses/by/4.0/).