Article

Microgrid Operation Optimization Strategy Based on CMDP-D3QN-MSRM Algorithm

School of Electrical and Control Engineering, Shaanxi University of Science and Technology, Xi’an 710021, China
*
Author to whom correspondence should be addressed.
Electronics 2025, 14(18), 3654; https://doi.org/10.3390/electronics14183654
Submission received: 21 August 2025 / Revised: 12 September 2025 / Accepted: 13 September 2025 / Published: 15 September 2025

Abstract

This paper addresses the microgrid operation optimization challenges arising from the variability in and uncertainty and complex power flow constraints of distributed power sources. A novel method is proposed, based on an improved Dual-Competitive Deep Q-Network (D3QN) algorithm, which is enhanced by a multi-stage reward mechanism (MSRM) and formulated within a Constrained Markov Decision Process (CMDP) framework. First, the reward mechanism of the D3QN algorithm is optimized by introducing a redesigned MSRM, enhancing the training efficiency and the optimality of trained agents. Second, the microgrid operation optimization problem is modeled as a CMDP, thereby enhancing the algorithm’s capacity for handling complex constraints. Finally, numerical experiments demonstrate that our method reduces operating costs by 16.5%, achieves a better convergence performance, and curtails bus voltage fluctuations by over 40%, significantly improving the economic efficiency and operational stability of microgrids.

1. Introduction

As renewable energy becomes more widely utilized, the energy structures of power systems are gradually transforming into cleaner and more sustainable forms [1]. Since its inception in 2003 [2], numerous pilot programs have been implemented to supply electrical (and sometimes thermal) energy to diverse users, include rural households, public institutions, industrial facilities, military bases, and remote or island communities connected to the main grid. However, distributed renewable energy sources, such as wind photovoltaic power, are subject to natural conditions, exhibiting high volatility and intermittency. These uncertainties pose a significant challenge to day-ahead scheduling in microgrids. Moreover, the complex voltage fluctuations introduced by distributed renewable energy integration create stability challenges for microgrid operation. Therefore, exploring new optimization algorithms to adapt to the volatility and intermittency of renewable energy sources has become an important direction of microgrid operation optimization research.
For over a decade, the real-time scheduling of microgrids has been a focus of attention in the research community. Many approaches have been attempted for the real-time scheduling of microgrids, such as traditional classical optimization algorithms [3], particle swarm optimization [4], stochastic programming algorithms [5], and robust optimization algorithms [6]. Classical optimization and particle swarm algorithms perform well for deterministic linear and nonlinear problems associated with microgrid operation. However, real-world microgrids involve uncertainties, such as renewable energy generation and load demands. Stochastic programming and robust optimization are primarily employed to address these uncertainties. However, both approaches heavily rely on domain expertise to construct accurate microgrid models and parameters, resulting in high development costs and limited portability and scalability.
In recent years, with the remarkable performance of deep reinforcement learning in various fields, such as gaming [7], Go [8], and robotics [9], researchers in the power system domain have begun exploring the application of this approach to the real-time scheduling of microgrids. Ref. [10] proposes a model-free backstepping control strategy based on deep reinforcement learning for controlling an advanced nine-level rectifier, which reduces the strategy’s dependence on mathematical models. Ref. [11] proposes the utilization of deep Q-networks (DQNs) to learn from forecasted loads, renewable outputs, and real-time pricing for operational strategy formulation. Ref. [12] optimizes the action selection of DQNs using a multi-parameter action mechanism to improve the solution ability. Ref. [13] showcases the application of a PSO-MPPT strategy, effectively boosting the efficiency and power output of PV systems in AC microgrids under varying atmospheric conditions. Ref. [14] presents a hybrid optimization technique that integrates an artificial neural network with Q-learning for scheduling in-home energy management. Ref. [15] proposes a Q-learning-based energy management algorithm for microgrid building clusters to reduce costs. Ref. [16] uses multi-agent reinforcement learning to solve the distributed energy management problem in microgrids. Ref. [17] proposes a microgrid energy optimization strategy based on the state of charge (SOC), according to the function of the energy storage system in different operation modes. Although effective against uncertainty, these DQN-based approaches inherently suffer from reward sparsity due to discrete action spaces. Ref. [18] mitigates this by replacing traditional baseline reward functions (BRFs) with a multi-stage reward mechanism (MSRM), improving the training efficiency and agent optimality. Although this method effectively addresses the issue of sparse rewards, its application model is oversimplified. It fails to account for self-adjustable generation units, such as fuel-based generators or electric boilers, and does not consider complex power flow variations, which results in significant limitations in practical applications. Furthermore, the design of its multi-stage reward mechanism does not comprehensively consider various data scenarios, which could lead to erroneous outcomes.
In recent years, many researchers have turned to reinforcement learning to address the challenges of reward function formulation in microgrid scheduling, which arise due to complex power flow constraints. Ref. [19] proposes a Q-learning-based energy management strategy for microgrids to cope with the efficiency and reliability of energy storage. Ref. [20] proposes a multi-agent Q-learning algorithm for load scheduling but encounters the curse of dimensionality. Ref. [21] employed a fully distributed PPO algorithm to maximize the photovoltaic active power output and maintain voltage stability in an unbalanced distribution network. Ref. [22] incorporates safety constraints—such as power flow—as gradient information to ensure that the optimal control strategy yields safe and feasible decisions. Ref. [23] proposes a DQN algorithm for unbalanced distribution systems to minimize power losses and regulate voltage. Ref. [24] discretizes battery actions via neural networks, solves remaining variables with nonlinear programming, computes immediate rewards, and derives optimal policies through Q-learning. Ref. [25] designs a convolutional neural network structure to learn optimal scheduling policies, bypassing nonlinear optimization and reducing forecast dependency. Although these methods partially resolve high-dimensional state challenges, difficulties persist in the reward function design under complex power constraints. This results in the inability of the optimization strategies generated by these methods to fully meet the requirements of microgrid operation. To overcome these limitations, this paper proposes the CMDP-D3QN-MSRM algorithm with three key innovations:
(1)
Refinement of the functional design of the multi-stage reward mechanism to prevent erroneous outcomes caused by exceptional or edge-case data.
(2)
Replacement of the original BRF in the D3QN algorithm with the improved MSRM to mitigate poor convergence resulting from reward sparsity, thereby enhancing the algorithm’s optimality-seeking capability.
(3)
Utilization of the constructed CMDP to strengthen the algorithm’s ability to handle complex power flow scenarios and improve the operational stability of microgrids.

2. Microgrid Optimization Model

2.1. Microgrid Equipment Modeling

2.1.1. Energy Storage System

The energy storage system comprises battery units that implement peak-shaving and valley-filling functionalities. Its operation coordinates with renewable energy sources to enhance microgrid reliability and economic efficiency. As a short-term reserve resource, the storage system must supply at least two hours of rated load energy. The SOC during operation is determined by the rated capacity (E) and charge/discharge power, as mathematically expressed in the following equation:
S O C t = S O C t 1 + η c h P t c h Δ t E P t d i s Δ t η d i s E
where P t c h is the power on the busbar after passing through the converter when the energy storage system is discharging at time period t; P t d i s is the power on the busbar before passing through the converter when the energy storage system is charging at time period t; η d i s and η c h are the converter efficiencies during discharging and charging, respectively.

2.1.2. Fuel Units

Fuel units provide an adjustable power supply to the microgrid by burning fuel oil, effectively reducing the dependence of the microgrid on the external grid. Their operational cost follows the quadratic function expressed in Equation (2):
C t g = a g ( P t g ) 2 + b g P t g + c g
where C t g is the generation cost of the fuel unit at moment t; P t g is the generation power of the fuel unit at moment t; and a g , b g , c g are the cost coefficients of the fuel unit.

2.1.3. Power Line Losses

Line losses in an AC microgrid are not negligible. We employ a branch current-based method for calculating power losses. The total system line loss ( P t l o s s ) can be expressed as follows:
P t l o s s = k = 1 N R k · I t k 2 R k = ρ · l
where R k is the resistance of branch k, and I t k is the magnitude of the current in branch k at time t. ρ is the resistivity of the line, and l is the length.

2.1.4. Microgrid Bus

The microgrid bus is connected to various components, including distributed power sources (e.g., photovoltaic and wind power systems), energy storage systems, fuel units, and the main power grid. The power balance at the bus is given by the following equation:
P t b = P t w · η w + P t p v · η p v + P t g P t c h + P t g r i d P t l o a d + P t d i s P t l o s s
where P t b is the net power balance; the system is balanced when P t b = 0 . P t w is the active power output from wind power generation in time period t. P t p v is the active power output from photovoltaic power generation in time period t. P t g is the active power output from the power generation from fuel units. P t g r i d is the power of energy exchange between the microgrid and the main grid; power is sold to the main grid in the case of P t g r i d < 0 , and power is purchased from the main grid in the case of P t g r i d > 0 . P t l o a d is the magnitude of active loads in time period t. η w and η p v represent the converter efficiencies of wind power generation and photovoltaic power generation, respectively.

2.2. Constraints

2.2.1. AC Trend Constraints

V min V t i V max , 0 I t i I max
where V t i is the voltage at bus i at time t; V max = 1.05 · V and V min = 0.95 · V are its upper and lower constraints; and V is the standard value of the bus voltage. I t i is the current at bus i at time t; I max = 1.05 · I is its upper constraints; and I is the standard value of the bus current.

2.2.2. Fuel Generator Operating Constraints

0 P t g P max g
where P max g and P min g are the upper and lower constraints for fuel generators.

2.2.3. Battery Operation Constraints

S O C min S O C t S O C max
where S O C max and S O C min are the maximum and minimum values of the battery charge state.

2.2.4. Microgrid and the Main Grid Interaction Constraints

P max g r i d P t g r i d P max g r i d
where P max g r i d is the maximum power exchanged between the microgrid and the main grid.

3. Optimization Model Based on Constrained Markov Strategy Process

This paper models the microgrid operation optimization process as a Markov Decision Process (MDP). The MDP framework incorporates stochastic renewable generation, real-time electricity pricing, and the energy storage system SOC to define system states and determine optimal energy dispatch decisions. Formally, the MDP is defined by the tuple <S,A,P,R>.

3.1. State Space

The state space, denoted by S, contains all the environmental information required for the microgrid operation optimization process. To simplify the model, only the time-varying information is included in the state. The state space S is defined by the following equation, where p p r i c e is the real-time electricity price of the main grid:
S = [ t , P t l o a d , P t p v , P t w , S O C t , p p r i c e ]

3.2. Action Space

In the microgrid, the controllable actions include the output power of the fuel unit and the charge/discharge power of the energy storage system. The action space A is defined as follows:
A = [ P t g , P t d i s , P t c h , P t g r i d ]

3.3. Transfer Probability

Since the state transition probability is affected by renewable energy uncertainties and is difficult to model accurately, a deep reinforcement learning algorithm is employed in this study to extract the transition model from historical data:
p s s a = p [ S t + 1 = s | S t = s , A t = a ]

3.4. Reward Function

The reward function consists of the self-balancing rate ( R t s ), reliability rate ( R t r ), microgrid operating cost ( C t ), and penalty function ( f t ), as shown in (12):
R ( s t , a t ) = f ( R t s , R t r , C t , f t )

3.4.1. Self-Balancing Rate

The self-balancing rate is defined as the percentage of a microgrid’s load that is supplied by its internal distributed energy resources over a defined period. Achieving a higher self-balancing rate contributes to reduced dependence on the main grid, increased energy self-sufficiency, lower power procurement costs, and diminished carbon emissions, as shown in Equation (13):
R t s = 1 P t g + P t g r i d P t l a o d + P t c h
In this study, the threshold for the self-balancing rate is set at 0.9. This signifies that 90% of the energy demand is met by internal resources. This approach encourages the microgrid to reduce its reliance on the main grid, decreases carbon emissions, and avoids the excessive costs associated with pursuing 100% self-sufficiency.

3.4.2. Reliability Rate

Reliability is defined as the ability of a microgrid to deliver the required power to its stakeholders continuously and stably under specified operational conditions. This ability is directly quantified by the reliability rate, which calculates the ratio of the total generation to the total demand. A value consistently maintained within the [0.95, 1.05] range indicates a highly reliable system that avoids both power shortages (below 0.95) and significant power surpluses (above 1.05) that could lead to stability issues:
R t r = P t w + P t p v + P t g P t c h + P t g r i d + P t d i s P t l o s s P t l o a d

3.4.3. Operating Costs

The microgrid operating costs mainly include the cost of purchasing power purchases from the main grid and the cost of generating power from the fuel units, as shown in (15):
C t = C t g + C t g r i d C t g r i d = P t g r i d p p r i c e Δ t

3.4.4. Penalty Functions

Within the traditional MDP framework, penalty functions can be employed to handle complex constraints by incorporating them into the objective function, as shown in (16), where k is the penalty coefficient and m represents the number of violated constraints:
f = k m
Since m solely represents the number of violated constraints and does not reflect their severity, the setting of the penalty coefficient (k) significantly impacts the algorithm’s performance. This necessitates extensive trial-and-error adjustments during the design phase, increasing implementation difficulty and reducing the algorithm’s ability to handle complex constraints. Therefore, this paper employs the CMDP to formulate the penalty function for the microgrid constraints, as shown below:
f t = β max max 0 , V t i V max , V min V t i / V + max max 0 , S O C t S O C max , S O C min S O C t + max 0 , P t g P max g / P max g + max max 0 , P t g r i d P max g r i d , P max g r i d P t g r i d / P max g r i d
where the first term calculates the degree of overloading of each bus voltage. The second term is the degree of constraint violation of the energy storage system’s state of charge. The third term is the degree of constraint violation of the fuel unit. The fourth term is the degree of constraint violation of the exchanged power of the main grid.

4. Microgrid Operation Optimization Based on CMDP-D3QN-MSRM Algorithm

4.1. D3QN Algorithm

The D3QN algorithm is a deep reinforcement learning algorithm that combines the Double DQN and Dueling DQN [26]. It leverages the Dueling DQN architecture to construct a Q-network that decomposes the Q-value estimation into a state value function and an advantage function. This decomposition facilitates more effective action selection. Concurrently, D3QN employs the Double DQN mechanism to mitigate the Q-value overestimation problem, thereby enhancing the algorithm’s ability to converge towards near-optimal solutions. The network structure, illustrated in Figure 1, consists of two fully connected layers. The first fully connected layer extracts salient features from the input data. These features are then fed into the second fully connected layer, which implements the Dueling DQN structure by branching into separate streams: one estimating the state value function and the other estimating the advantage function. This decoupling enables better policy generalization by independently learning the values of states and the relative importance of actions.
The valuation of the estimation network (Q) is defined as shown in Equation (17):
Q ( s t , a t ; θ , θ v , θ A ) = V ( s t ; θ , θ v ) + A ( s t , a t ; θ , θ A ) ) 1 N a A ( s t , a ; θ , θ A )
where s t , a t are the state and action at time t, respectively; θ v , θ A is the parameter of the state value function network; N a is the dimension value of the agent’s action; and a represents all possible actions.
The D3QN algorithm utilizes the ε g r e e d y strategy to select the action of the agent; that is, in each selection of the action, the agent will have a probability of 1 ε to select the action with the largest Q-value and randomly select the action with a probability of ε , and the value of ε will be gradually reduced to make the algorithm result converge. The target value of the Q-network in this process is shown in Equation (18):
y t = r t + γ Q ( s t + 1 , arg max a Q ( s t + 1 , a t ; θ , θ v , θ A ) ; θ , θ v , θ A )
where γ is the discount factor and θ , θ v , θ A is the network parameter of Q . The training objective of the D3QN is to minimize the loss function of the following equation.
L ( θ ) = Ε [ ( y t Q ( s t , a t ; θ , θ v , θ A ) ) 2 ]

4.2. Multi-Stage Reward Evaluation Mechanism

In conventional deep reinforcement learning approaches for microgrid operation optimization, BRFs are typically employed to simultaneously address operational cost minimization and constraint satisfaction. This function generally takes the following mathematical form:
r t = ( C t + D t r + D t s f t ) D t r = P t w + P t p v + P t g P t c h + P t g r i d P t l o a d + P t d i s D t s = P t w + P t p v P t c h P t d i s P t l o a d f = k m
where D t r in (20) is the active power balance equation, and D t s is the constraint for achieving self-sufficiency using distributed energy resources. However, such a simple design of the reward function leads to the problem of sparse rewards.
To address the above issues, this paper introduces a multi-stage reward mechanism. This mechanism divides the reward function into three stages: the step reward, the final reward, and external expert intervention, thereby enhancing the training efficiency and solution quality. The corresponding pseudocode is provided below (Algorithm 1).
Algorithm 1. Multi-Stage Reward Mechanism
1: Set penalty reward coefficient ζ 1 , ζ 2 , ζ 3
2: for episode in 1 to M do
3:  Initialize final reward r f i n a l and step reward r t s t e p
4:  for t in l to T do
5:     Observe state St and action At
6:     if External expert intervention is met then
7:        P t E is given by exert inputs
8:     else
9:        P t E is given by DRL
10:    end if
11:    Calculate step reward at every t: r t = r t s t e p
12:    Calculate final reward at every t:
                r f i n a l = r f i n a l + r t 1 + r t 2 + r t 3
13:    if episode terminates t = T then
14:       r t = r f i n a l
15:    else
16:        r t = r t s t e p
17:    end if

4.3. Step Rewards

Step rewards are immediate rewards provided to the agent after each action, representing an assessment of the environmental state. These rewards are calculated based on defined metrics, as shown below:
r t s t e p = δ 1 · i = 1 t R t s / t i = 1 t R t r / t i = 1 t C t ( P t l o a d P t w P t p v ) p p r i c e / t 2
r t s t e p = ζ 1 · i = 1 t R t s ζ 2 · i = 1 t R t r 1 ζ 3 · i = 1 t C t i = 1 t f t t
where Equation (21) represents the step reward adopted from Ref. [12], and δ 1 is the reward factor. The first term in (21) reflects the self-balancing rate of the microgrid operation from time step 1 to t. The second term represents the reliability rate of the microgrid operation from time step 1 to t. The third term indicates the degree of cost savings achieved during the microgrid operation over the same period.
However, the second term in (21) only encourages the agent to select actions where the total power output from all components exceeds the load demand. This formulation fails to ensure actual power balance and has therefore been revised as the second term in (22). The third term in (21) was originally formulated as a ratio to evaluate cost savings. However, a critical numerical instability arises when the load demand approaches the renewable generation output: the denominator (representing the operating cost) tends toward zero, causing the reward value to diverge toward infinity. This exploding reward does not reflect the actual performance and could mislead the agent toward suboptimal solutions. To avoid this singularity, we replace the fractional form with the denominator itself—the operating cost—as the third term in the revised reward function (22). This reformulation preserves the incentive to minimize costs while ensuring numerical stability across the entire operational state space.
Furthermore, Equation (21) neglects the operational challenges posed by power flow constraints. Consequently, a fourth penalty term is added in (22). Due to the differing orders of magnitude among these revised reward components, a single reward coefficient (as used in (21)) is inadequate. Separate coefficients are therefore assigned to normalize their magnitudes. To determine appropriate scaling coefficients, a global sensitivity analysis framework based on Bayesian optimization was employed. This study utilized the variation range of the three components in Equation (23) to preliminarily determine the baseline values for the scaling coefficients. Subsequently, a sensitivity analysis was conducted based on these baseline values, ultimately determining that the values of ζ 1 , ζ 2 , ζ 3 are 10, 0.2, and 100.

4.4. Final Reward

The final reward is provided to the agent at the end of each training episode. It offers a comprehensive evaluation of the agent’s behavior throughout the episode, thereby encouraging the pursuit of long-term benefits. Similar to the step reward, the final reward also comprises four components, as shown in (23):
r t f i n a l = ( t = 1 T r t 1 + r t 2 + r t 3 ) f t
The final reward in this study differs from that in Ref. [12] primarily through the incorporation of an additional penalty function. The first component assesses the agent’s contribution to the microgrid’s self-balancing rate. An additional reward is granted if the self-balancing rate is greater than or equal to 0.95; otherwise, the reward is calculated based on the ratio of the battery discharge capacity to the total load demand. It is defined as follows:
r t 1 = 1 + P t d i s P t l o a d + P t c h · ζ 1 , R t s 0.95 P t d i s P t l o a d + P t c h · ζ 1 , R t s < 0.95 ]
The second component evaluates the agent’s effectiveness at maintaining the power supply reliability throughout the episode. A fixed reward is given if the reliability rate remains between 0.95 and 1.05; otherwise, no reward is granted. It is defined as follows:
r t 2 = 0 , R t r 1 > 0.05 ζ 2 · R t r 1 , R t r 1 0.05
The third component quantifies the cost savings achieved by the agent through optimized energy management. It incentivizes actions that reduce electricity procurement costs from the main grid, thereby enhancing the microgrid’s economic efficiency. It is defined below:
r t 3 = C t · ζ 3
The fourth component is a penalty that assesses whether the agent’s actions violate operational constraints. Penalties are assigned according to the severity of the violation, guiding the agent to develop optimal strategies that enhance operational security without breaching constraints. Its definition is consistent with (16).

4.5. Expert Intervention

During agent training, the external expert intervention module continuously monitors environmental states. Based on predefined operational thresholds, it generates explicit control signals by incorporating domain-specific a priori knowledge derived from classical energy management rules or optimization techniques. This intervention mechanism prevents convergence to suboptimal policies. Specifically, when system states violate predefined safety boundaries, supplementary rule-based controls override the agent’s learning process:
P t e s s = P t d i s , S O C t 1 > 0.85 R t 1 s > 0.9 P t c h , S O C t 1 < 0.25 R t 1 s < 0.9 P t D R L , o t h e r P t d i s = P L P P V P W T P t c h = U t E I c h E I c h E = r c h B E
where P t D R L denotes the charging or discharging strategy formulated by the agent, U t E denotes the terminal voltage of the energy storage system, and I c h E denotes the charging current (calculated from the charging rate ( r c h ) and capacity ( B E )).
The energy storage system is mandated to discharge when it is nearly saturated ( S O C t 1 > 0.85 at the previous time step) and renewable energy generation is sufficient ( R t 1 s > 0.9 ). This prevents overcharging. Conversely, the system is required to charge when its available energy is low ( S O C t 1 < 0.25 at the previous time step) and renewable energy generation is insufficient ( R t 1 s < 0.9 ). This prevents excessive discharging. The terminology used in this paper is summarized in Appendix A.

5. Example Analysis

5.1. Simulation Environment Setup

The experimental data—including the PV generation, wind power output, electrical load, and real-time electricity prices—originated from actual operating records of the CAISO system [27] in California. We utilized 2021–2022 data as the training set for neural network development and reserved the 2023 data for testing.
As shown in Figure 2, the microgrid configuration comprises three 350 kVA diesel generators, two 2000 kWh battery storage units, three 300 kW photovoltaic arrays, two 300 kW wind turbines, and multiple load centers. Key operational parameters include a 1000 kVA power exchange limit with the main grid and battery state-of-charge constraints (10–90% operating range).
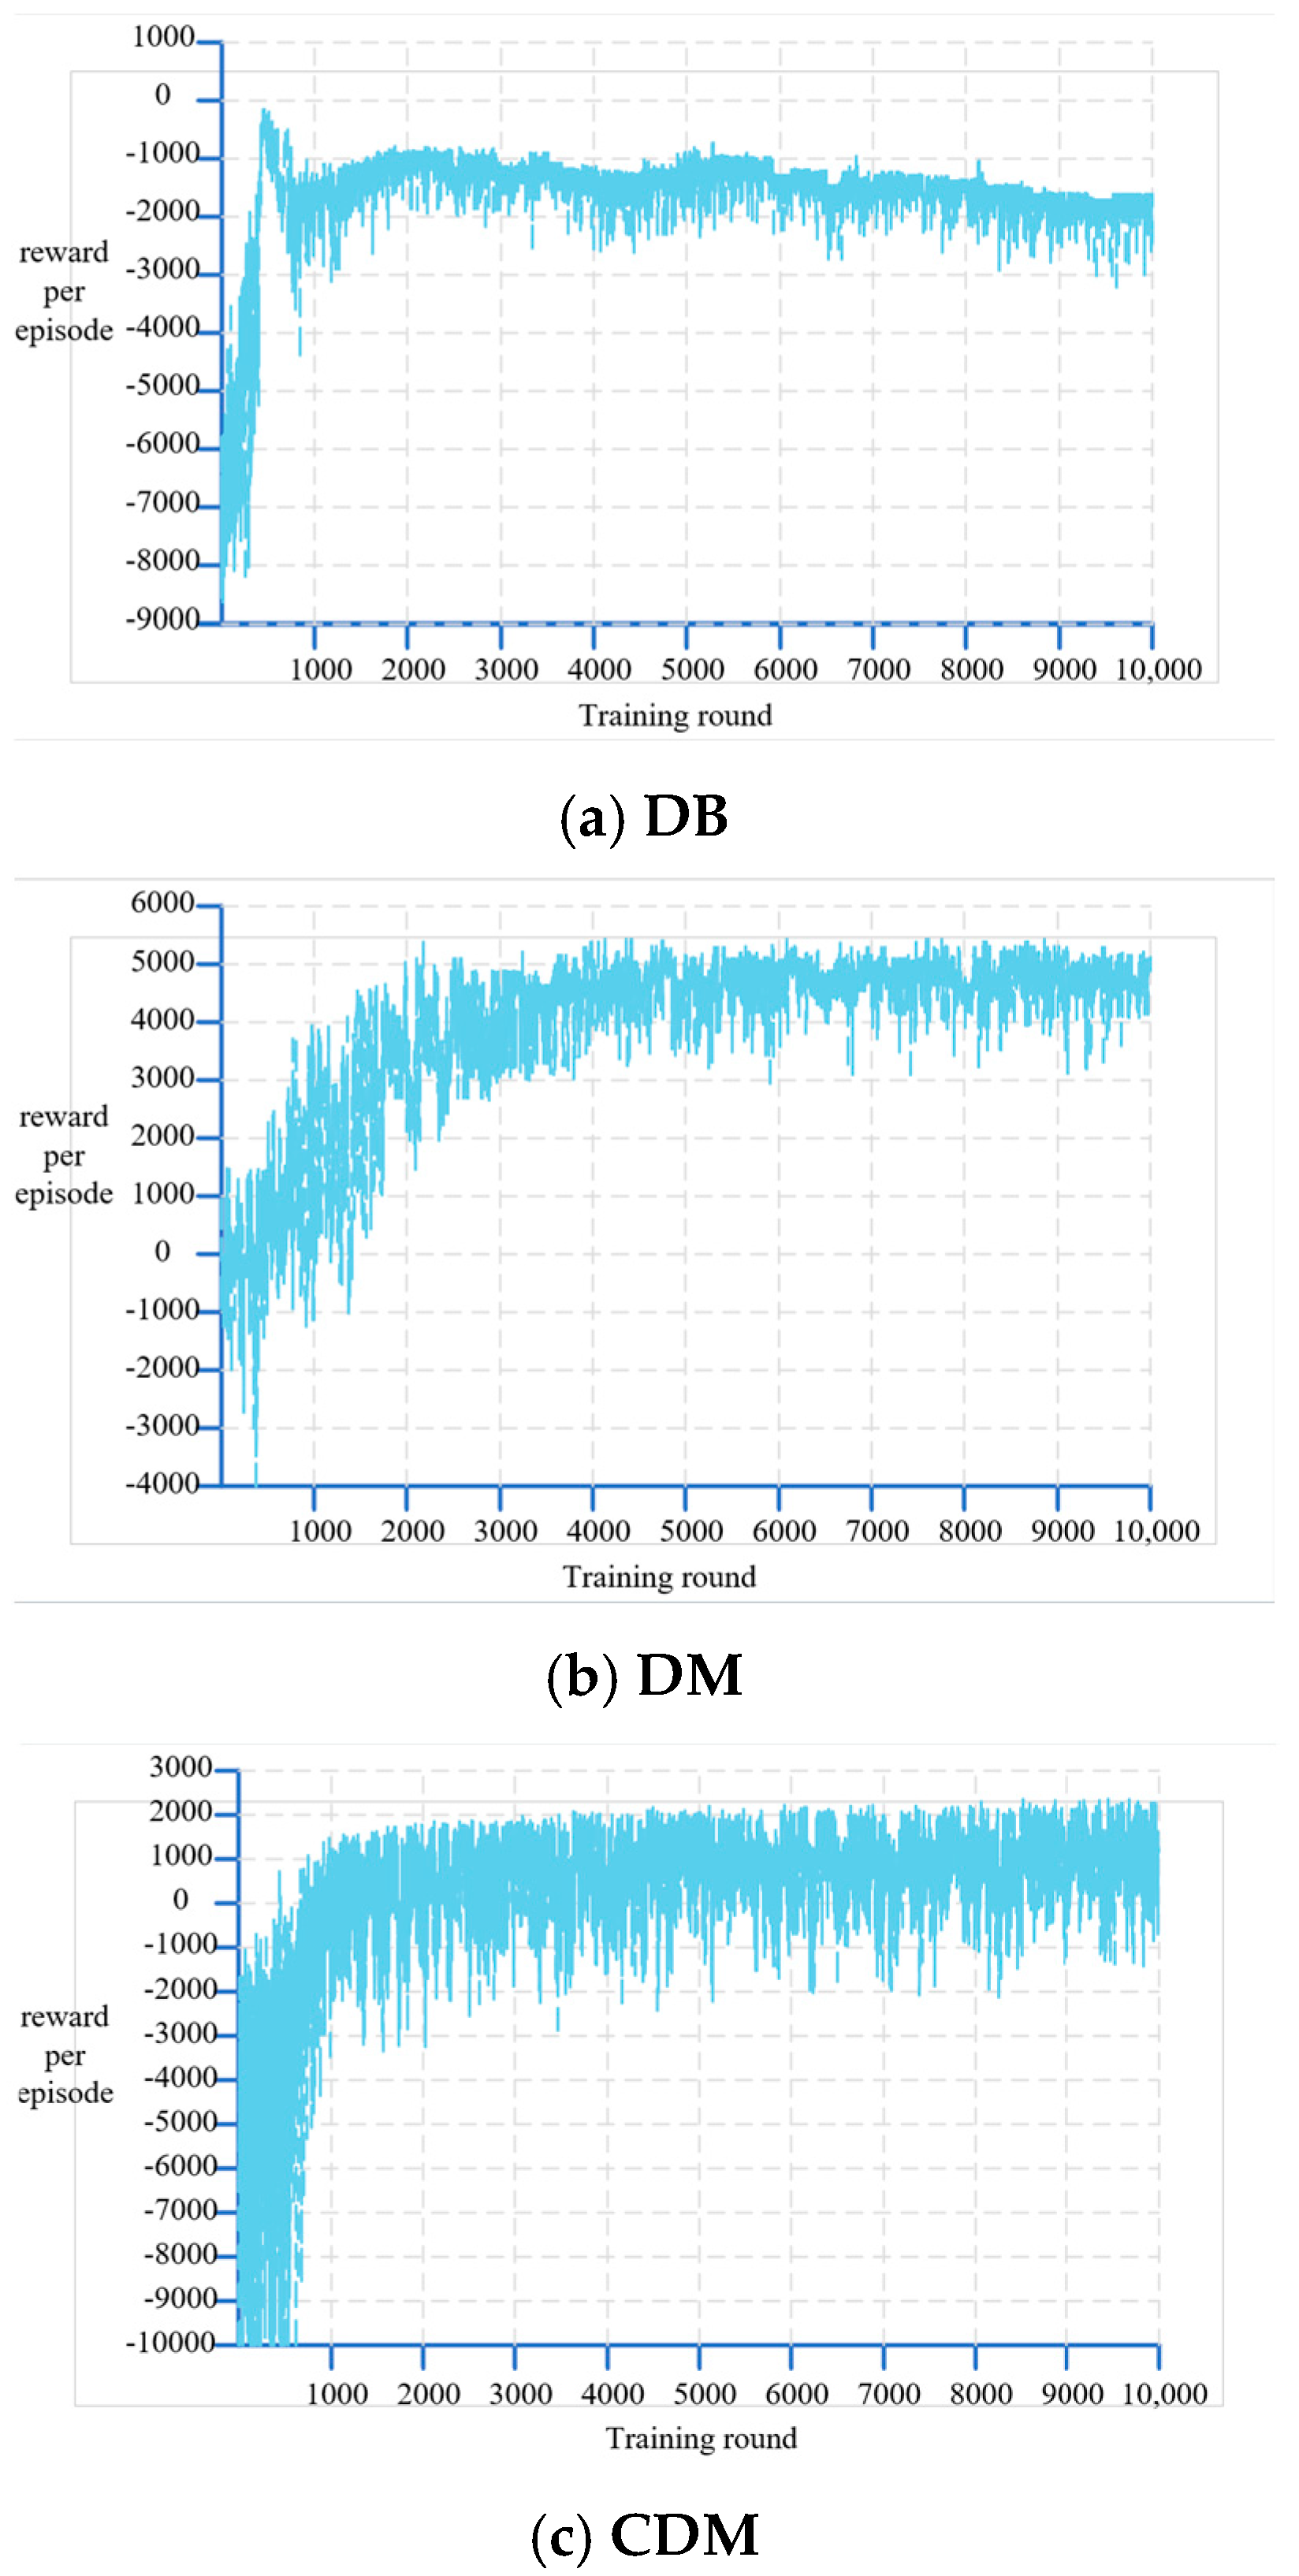
This study implements three algorithms sharing identical agent training frameworks: D3QN-BRF(DB), D3QN-MSRM(DM), and CMDP-D3QN-MSRM(CDM). Their neural network architecture consists of two feature extraction modules with fully connected layers sized 5 × 512 and 512 × 512; a value function stream comprising layers 512 × 256 and 256 × 1; and an advantage function stream containing layers 512 × 256 and 512 × 3. Here, dimension 5 corresponds to the state space size, while 3 denotes the action space dimension. All hidden layers employ ReLU activation functions. The implementation, developed in Python3.9, utilizes TensorFlow2.0 for neural network training. The values of the parameters used in the algorithm are shown in Table 1. The experimental setup comprised an 18-core AMD EPYC 9754 CPU, an NVIDIA GeForce RTX 3090 GPU, and 24 GB of RAM. The total training duration was 8 h.

5.2. Analysis of Training Results of Algorithms

The uncertainty and stochasticity inherent in distributed power systems can lead to reward sparsity problems for DRL algorithms, hindering their convergence to the optimal solution. This section evaluates the performance of the MSRM in improving the convergence properties of the reward function by comparing the training reward curves of the algorithms.
As shown in the training reward curves of Figure 3, all three algorithms exhibit convergence behavior around 2000 rounds. The DB algorithm displays substantial reward fluctuations during its early exploration phase. Although converging around 2000 rounds, its reward values subsequently exhibit a decreasing trend. In contrast, both the DM and CDM algorithms demonstrate a gradual and steady increase in their reward values, maintaining a slow upward trajectory throughout. These observations indicate that the BRF-based DRL algorithm, despite convergence, tends to settle toward a suboptimal solution following exploratory fluctuations. Conversely, the MSRM-based DRL algorithm provides more precise guidance, enabling it to achieve a final reward closer to the optimal solution, and yields more stable and reliable learning outcomes.
To evaluate the stability of the algorithms, five independent training runs were conducted for each algorithm using different random seeds. To reduce variance, the final performance after convergence for each run was evaluated by taking the average reward over the last 100 episodes. The results are presented in Table 2.
Table 2 presents the performance statistics of the three algorithms—DB, DM, and CDM—including the average reward, variance, and confidence interval upon convergence over five independent runs. The results clearly demonstrate that the convergence values of all three algorithms exhibit minimal fluctuation across multiple runs. The coefficients of variation (CV) for the DB, DM, and CDM algorithms are 0.00425, 0.00199, and 0.00583, respectively, all below 1%. Therefore, it can be concluded that the DB, DM, and CDM algorithms all demonstrate highly stable and reproducible convergence behavior.

5.3. Analysis of Optimization Results of Algorithms

5.3.1. Constraints of the Running Strategy

Complex power flow dynamics impose high-dimensional, multi-period nonlinear constraints on operational optimization, posing challenges for convergence to feasible solutions. This section evaluates the CMDP’s efficacy at enhancing the algorithmic handling of these constraints through a comparative analysis of constraint satisfaction metrics across optimization strategies.
Figure 4 displays the real-time voltage fluctuations across all buses following operational optimization using the CDM algorithm. It can be observed that only Bus 11 experienced a voltage limit violation at 16:00, while all other buses maintained voltages well within the permissible constraints throughout the operational period. The bus voltage conditions for the strategies formulated by the DB and DM algorithms are compared and analyzed in Table 3.
First, regarding the power setpoints for fuel units and energy storage systems during interactions with the main grid, none of the strategies generated by the three algorithms exceeded the prescribed power limits. Moreover, none of the energy storage systems experienced overcharging or over-discharging conditions.
As shown in Table 2, in terms of power balance constraints, the strategy utilizing the MSRM method significantly outperforms the BRF-based strategy across all metrics—the maximum value, minimum value, and standard deviation. The CMDP framework also shows an improved power balance performance.
Under complex power flow conditions, voltage fluctuations at buses 1–5, 7, and 8 are highly consistent across all three algorithms. In contrast, at buses 6 and 9–11, the CDM algorithm reduced voltage deviations by approximately 40% compared to the other two algorithms, and more importantly, resulted in only a single voltage limit violation, whereas the other two algorithms exhibited multiple violations.
These results demonstrate that the CMDP-based DRL algorithm effectively addresses the high-dimensional challenges arising from complex power flow conditions.

5.3.2. Analysis of Operational Strategies Developed by Each Algorithm

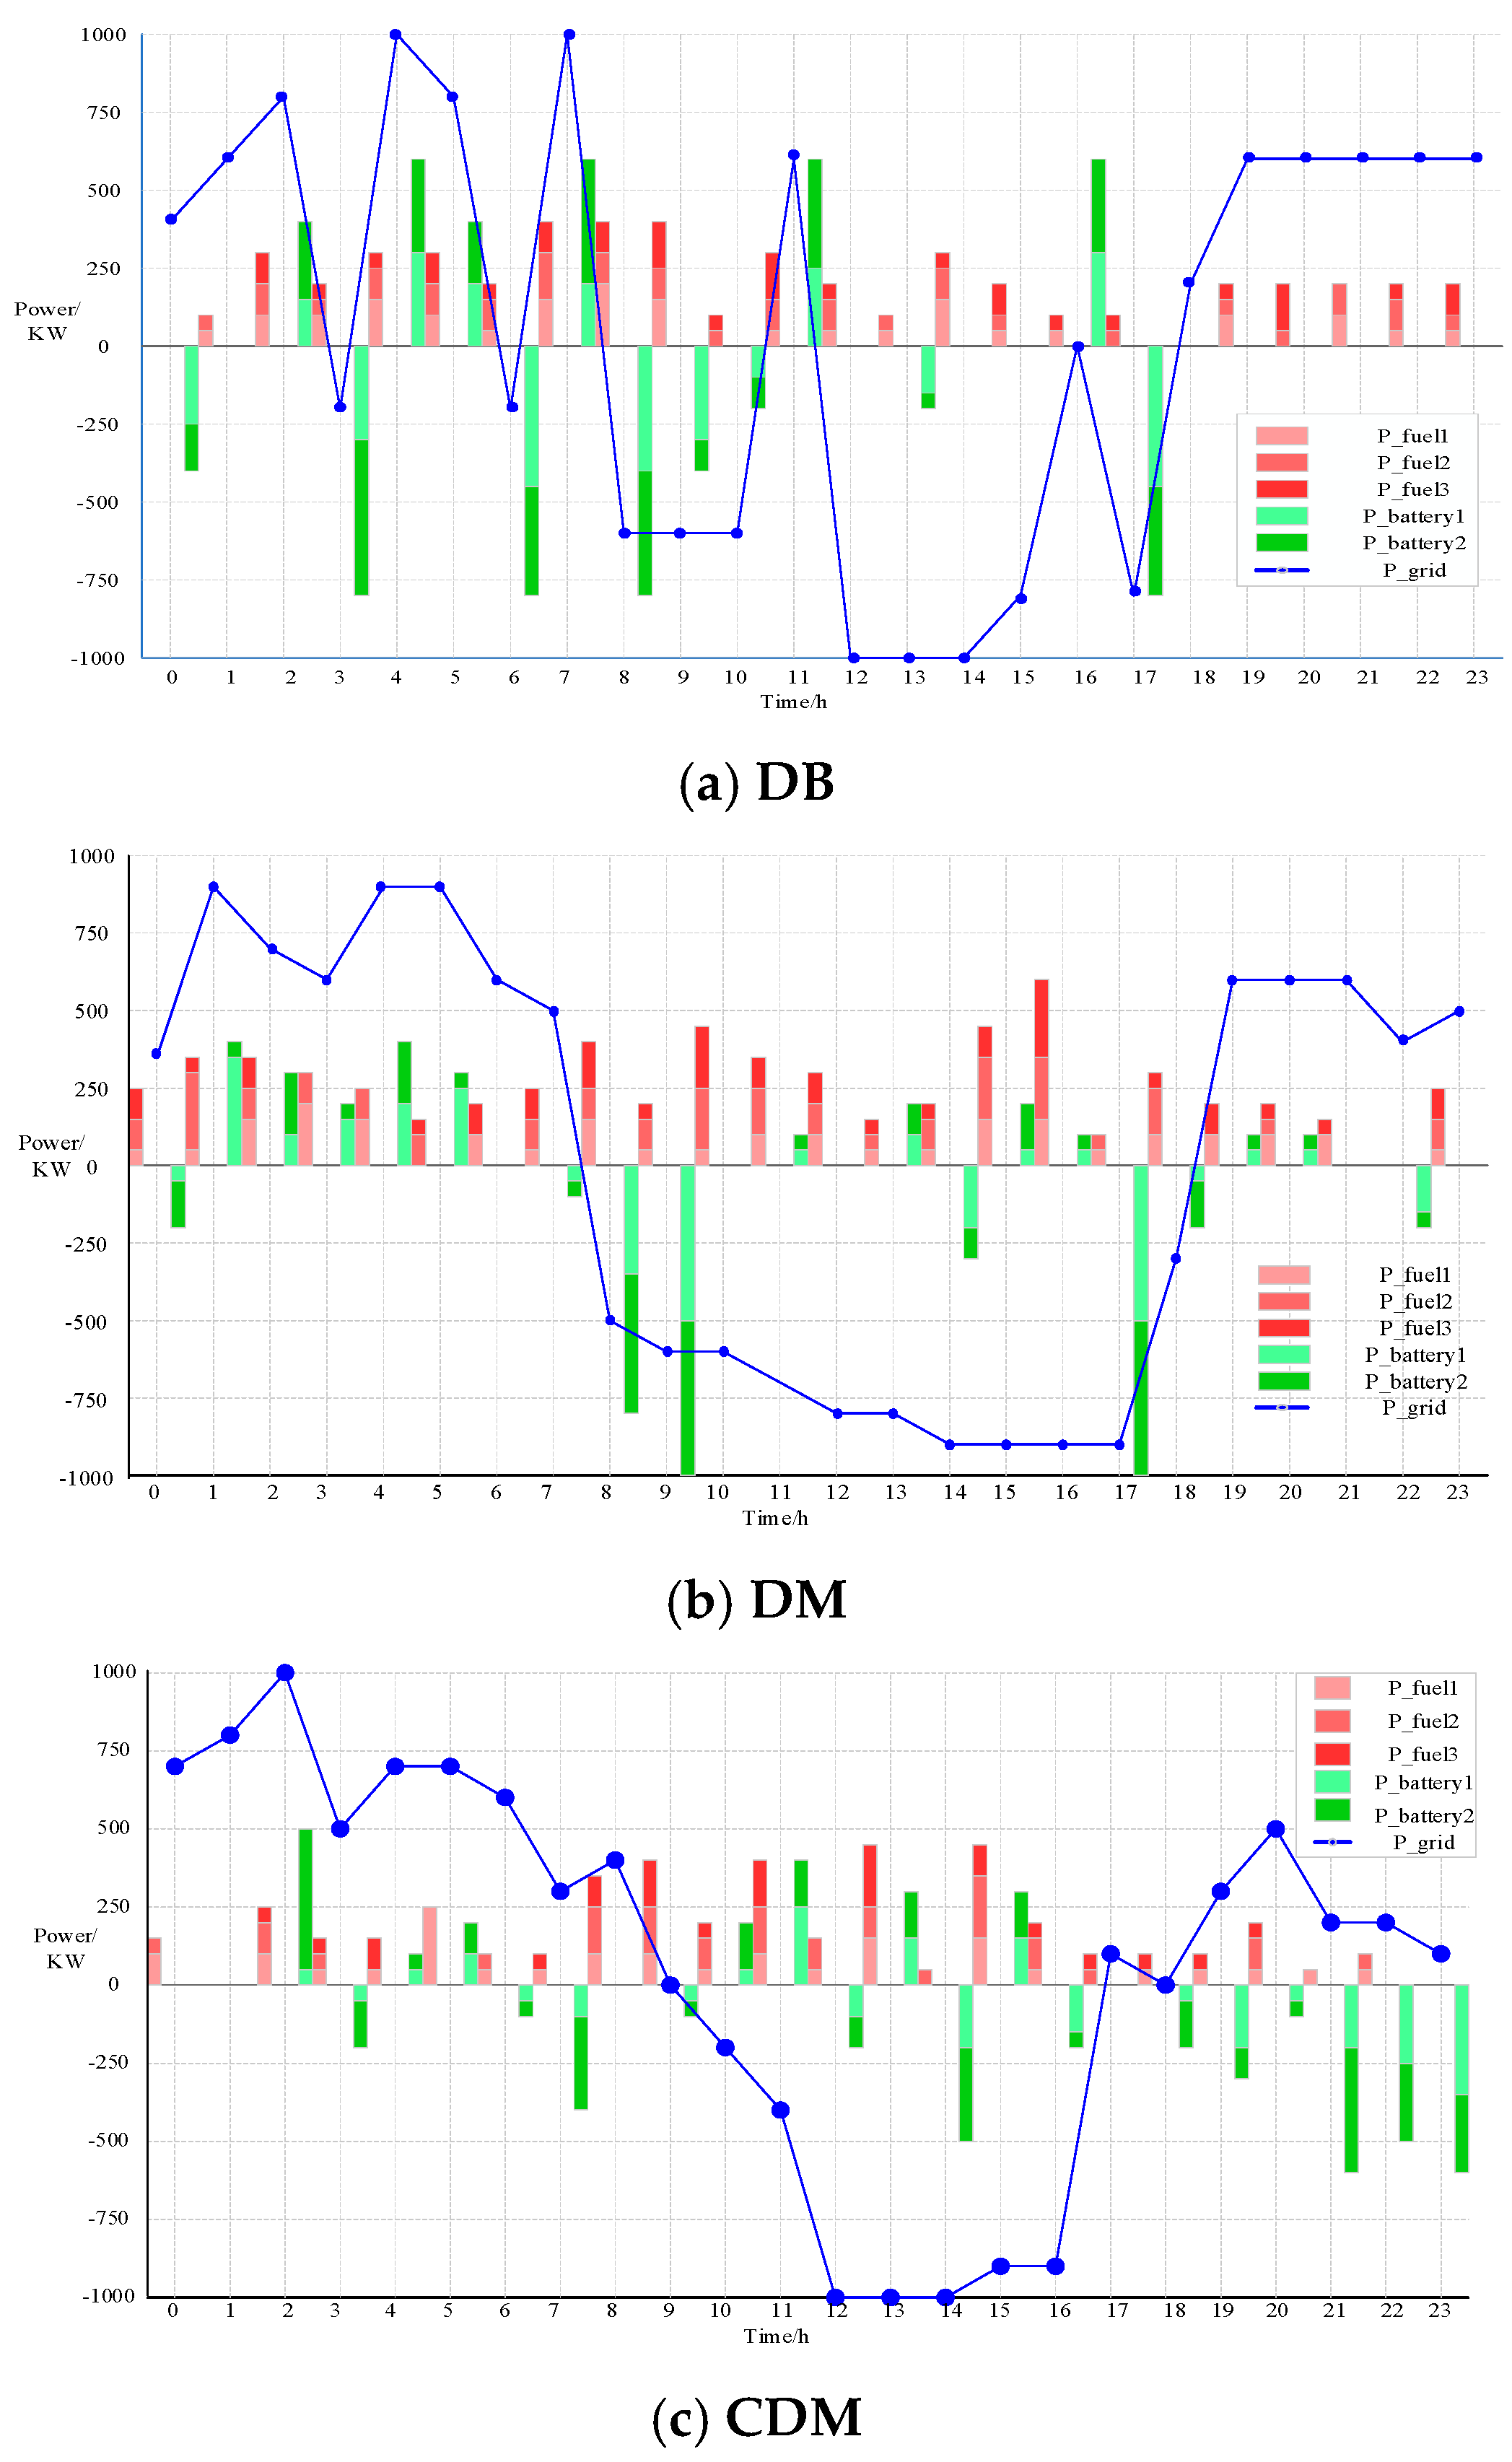
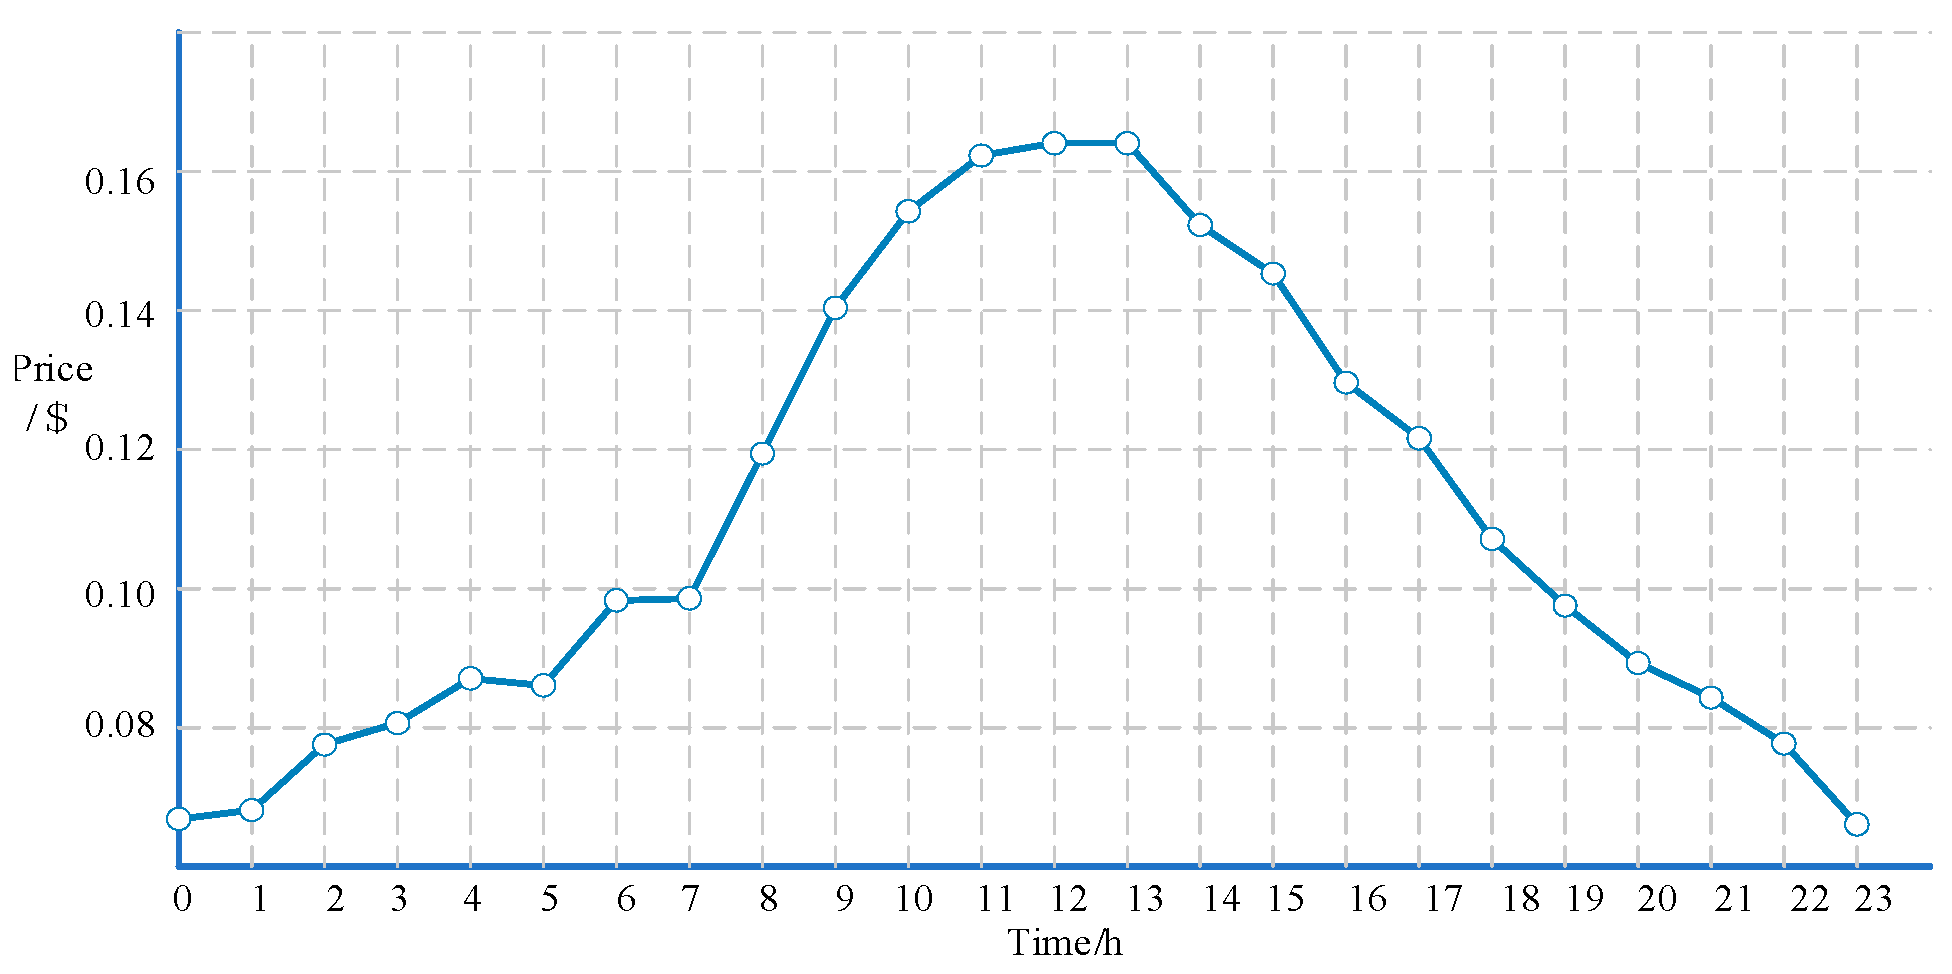
The three pre-trained neural networks were deployed separately to optimize the operation of the test system, each yielding a distinct strategy with its associated cost. The strategy produced by the DB algorithm (Figure 5a) incurred a cost of USD 285.06. In comparison, the DM algorithm (Figure 5b) achieved a lower cost of USD 253.57, while the CDM algorithm (Figure 5c) resulted in the lowest cost of USD 238.15. The real-time electricity tariff used in formulating these strategies is shown in Figure 6.
Analysis of the optimization strategies in Figure 5 and the electricity price profile in Figure 6 reveals the following operational patterns: the fuel units and the energy storage system primarily respond to the main grid’s behavior by balancing power. Since the fuel units’ generation cost is constant, they are dispatched when their production cost is lower than purchasing electricity from the main grid. This economic dispatch principle leads to increased fuel unit output during high-electricity-price periods.
All three algorithms optimize grid interaction by purchasing power from the main grid during low-price periods (0–8 h and 17–23 h) to supply loads or charge the battery and then sell power back to the grid during high-price periods (9–16 h) to reduce operating costs. However, the DB algorithm deviated from this optimal pattern by performing several counterproductive actions (e.g., at hours 3, 6, and 11) during both buying and selling windows, highlighting its convergence to a suboptimal solution. While the DM and CDM algorithms exhibited highly similar strategies from 0–16 h, the CDM algorithm achieved further cost reductions during 17–23 h. This is attributed to its superior management of the energy storage system, resulting in lower total operating costs compared to the DM algorithm.
Collectively, these results demonstrate that the CDM algorithm effectively addresses (1) the reward sparsity problem caused by the stochastic and uncertain nature of distributed power sources, and (2) the high-dimensional optimization challenges stemming from complex power flow constraints. As a result, the CDM algorithm enhances both the economic efficiency and operational reliability of scheduling strategies.

6. Conclusions and Future Perspectives

This paper addresses the operational optimization challenges posed by the uncertainty, stochasticity, and complex power constraints of distributed power sources in microgrids. To tackle these challenges, we propose a CMDP-D3QN-MSRM algorithm-based optimization strategy. The algorithm’s feasibility and effectiveness were validated through comparative experiments, leading to the following conclusions:
(1)
The CMDP-D3QN-MSRM strategy proposed in this study provides an efficient data-driven tool for addressing the trade-off between “economic efficiency” and “security” in practical microgrid operations. Compared to the D3QN algorithm, this method resolves the issue of sparse rewards, significantly reducing the microgrid’s operating costs (by 16.5%). Simultaneously, it mitigates operational risks arising from complex power flow (with voltage fluctuations reduced by over 40%). This offers a feasible technical pathway for the autonomous and intelligent operation of microgrids.
(2)
Although this study validated the proposed algorithm on a standard test microgrid, it demonstrates strong potential for scalability. For larger microgrid networks, the core framework of the algorithm requires no fundamental changes; only the state space dimensionality and constraint conditions need to be adjusted accordingly.
While this study has achieved its intended outcomes, several limitations remain, which illuminate pathways for future research:
(1)
The training in this study was based on a fixed historical data environment. Future work will explore online learning mechanisms, enabling the agent to adaptively adjust its strategies through continuous interaction with the real microgrid environment to cope with unknown load variations or equipment aging, thereby ultimately achieving real-time deployment.
(2)
To further enhance the global optimality of the scheduling scheme, we plan to investigate a hybrid framework integrating DRL with meta-heuristic algorithms For instance, DRL could be employed for rapid real-time decision making, while meta-heuristic algorithms could be utilized for refined cost optimization over longer timescales, with the two working in concert. We also plan to further refine the algorithm by comparing it with more methods (such as those in references [10,13,17], etc.).
(3)
Although this study employs heuristically designed penalty functions, it lacks formal proof of CMDP constraint satisfaction and relies on manual coefficient adjustments, which reduces its versatility. Therefore, subsequent research will utilize the Lagrangian relaxation method to address the constraint satisfaction issues and eliminate the reliance on manual parameter tuning.

Author Contributions

Conceptualization, Y.Z. and J.K.; methodology, J.K.; software, Y.Z.; validation, Y.Z. and Q.W.; formal analysis, Y.Z.; investigation, Y.Z.; resources, J.K.; data curation, Q.W.; writing—original draft preparation, Y.Z.; writing—review and editing, Y.Z.; visualization, J.K.; supervision, J.K.; project administration, J.K.; funding acquisition, J.K. All authors have read and agreed to the published version of the manuscript.

Funding

This research received no external funding.

Data Availability Statement

Data are contained within the article.

Conflicts of Interest

The authors declare no conflicts of interest.

Abbreviations

The following abbreviations are used in this manuscript:
D3QNDual-Competitive Deep Q-Network
MSRMMulti-Stage Reward Mechanism
CMDPConstrained Markov Decision Process
BRFBaseline Reward Function
DBD3QN-BRF
DMD3QN-MSRM
CDMCMDP-D3QN-MSRM

Appendix A

Table A1. Nomenclature.
State of ChargeSOCState of charge of the energy storage system, representing the battery’s remaining energy percentage.
Charge Power P t c h Charging power of the energy storage system during time period t.
Discharge Power P t d i s Discharging power of the energy storage system during time period t.
Total Line Loss P t l o s s Total active power loss in the AC lines of the microgrid during time period t.
Fuel Engine Power P t g Output power of the fuel engine during time period t.
Photovoltaic Power P t p v Power generated by the photovoltaic system during time period t.
Wind Power P t w Output power of the wind power generation system during time period t.
Main-Grid Exchange Power P t g r i d Power exchanged between the microgrid and the main grid during time period t (positive for purchasing, negative for selling).
Self-Balancing Rate R t s Ratio of the microgrid’s internal distributed energy resources meeting its own load demand over a defined period.
Reliability Rate R t r Ratio of total generation to total demand, indicating the system’s ability to provide stable and continuous power supply.

References

  1. National Energy Administration. Transcript of the National Energy Administration’s Q1 2020 Online Press Conference (2020–03-06); National Energy Administration: Beijing, China, 2 May 2021. [Google Scholar]
  2. Lasseter, R.H.; Paigi, P. Microgrid: A conceptual solution. In Proceedings of the IEEE 35th Annual Power Electronics Specialists Conference, Aachen, Germany, 20–25 June 2004; pp. 4285–4290. [Google Scholar]
  3. Anglani, N.; OritiI, G.; Colombini, M. Optimized energy management system to reduce fuel consumption in remote military microgrids. IEEE Trans. Ind. Appl. 2017, 53, 5777–5785. [Google Scholar] [CrossRef]
  4. Qi, Y.; Shang, X.; Nie, J.; Huo, X.; Wu, B.; Su, W. Operation optimization of combined heat and cold power type microgrid based on improved multi-objective gray wolf algorithm. Electr. Meas. Instrum. 2022, 59, 12–19. [Google Scholar]
  5. Feng, L.; Cai, Z.; Wang, Y.; Liu, P. Power fluctuation smoothing strategy for microgrid load-storage coordinated contact line taking into account load storage characteristics. Autom. Electr. Power Syst. 2017, 41, 22–28. [Google Scholar]
  6. Zhu, J.; Liu, Y.; Xu, L.; Jiang, Z.; Ma, C. Robust economic scheduling of cogeneration-type microgrids considering wind power consumption a few days ago. Autom. Electr. Power Syst. 2019, 3, 40–51. [Google Scholar]
  7. Mnih, V.; Kavukcuoglu, K.; Silver, D.; Rusu, A.A.; Veness, J.; Bellemare, M.G.; Graves, A.; Riedmiller, M.; Fidjeland, A.K.; Ostrovski, G.; et al. Humanlevel control through deep reinforcement learning. Nature 2015, 518, 529–533. [Google Scholar] [CrossRef]
  8. Silver, D.; Huang, A.; Maddison, C.J.; Guez, A.; Sifre, L.; van den Driessche, G.; Schrittwieser, J.; Antonoglou, I.; Panneershelvam, V.; Lanctot, M.; et al. Mastering the game of Go with deep neural networks and tree search. Nature 2016, 529, 484–489. [Google Scholar] [CrossRef] [PubMed]
  9. Kober, J.; Bagnell, J.A.; Peters, J. Reinforcement learning in robotics: A survey. Int. J. Robot. Res. 2013, 32, 1238–1274. [Google Scholar] [CrossRef]
  10. Meysam, G.; Arman, F.; Mohammad, S.; Laurendeau, E.; Al-Haddad, K. Data-Driven Switching Control Technique Based on Deep Reinforcement Learning for Packed E-Cell as Smart EV Charger. IEEE Trans. Transp. Electrif. 2024, 11, 3194–3203. [Google Scholar]
  11. Liu, J.; Chen, J.; Wang, X.; Zeng, J.; Huang, Q. Research on micro-energy grid management and optimization strategies based on deep reinforcement learning. Power Syst. Technol. 2020, 44, 3794–3803. [Google Scholar]
  12. Li, H.; Shen, B.; Yang, Y.; Pei, W.; Lv, X.; Han, Y. Microgrid energy management and optimization strategy based on improved competitive deep Q-network algorithm. Autom. Electr. Power Syst. 2022, 46, 29–42. [Google Scholar]
  13. Akarne, Y.; Essadki, A.; Nasser, T.; Laghridat, H.; El Bhiri, B. Enhanced power optimization of photovoltaic system in a grid-connected AC microgrid under variable atmospheric conditions using PSO-MPPT technique. In Proceedings of the 2023 4th International Conference on Clean and Green Energy Engineering (CGEE), Ankara, Turkiye, 26–28 August 2023; pp. 19–24. [Google Scholar]
  14. Lu, R.; Hong, S.H.; Yu, M. Demand response for home energy management using reinforcement learning and artificial neural network. IEEE Trans. Smart Grid 2019, 10, 6629–6639. [Google Scholar] [CrossRef]
  15. Kim, S.; Lim, H. Reinforcement learning based energy management algorithm for smart energy buildings. Energies 2018, 11, 2010. [Google Scholar] [CrossRef]
  16. Foruzan, E.; Soh, L.K.; Asgarpoor, S. Reinforcement learning approach for optimal distributed energy management in a microgrid. IEEE Trans. Power Syst. 2018, 33, 5749–5758. [Google Scholar] [CrossRef]
  17. Feng, C.; Zhang, Y.; Wen, F.; Ye, C.; Zhang, Y. Microgrid energy management strategy based on deep expectation Q-network algorithm. Autom. Electr. Power Syst. 2022, 46, 14–22. [Google Scholar]
  18. Goh, H.W.; Huang, Y.; Lim, C.S.; Zhang, D.; Liu, H.; Dai, W.; Kurniawan, T.A.; Rahman, S. An Assessment of Multistage Reward Function Design for Deep Reinforcement Learning-Based Microgrid Energy Management. IEEE Trans. Smart Grid 2022, 13, 4300–4311. [Google Scholar] [CrossRef]
  19. Bui, V.H.; Hussain, A.; Kim, H.M. Q-learning based operation strategy for community battery energy storage system in microgrid system. Energies 2019, 12, 1789. [Google Scholar] [CrossRef]
  20. Xu, X.; Jia, Y.W.; Xu, Y.; Xu, Z.; Chai, S.; Lai, C.S. A multi-agent reinforcement learning-based data-driven method for home energy management. IEEE Trans. Smart Grid 2020, 11, 3201–3211. [Google Scholar] [CrossRef]
  21. El, H.R.; Kalathil, D.; Xie, L. Fully decentralized reinforcement learning-based control of photovoltaics in distribution grids for joint provision of real and reactive power. IEEE Open Access J. Power Energy 2021, 8, 175–185. [Google Scholar] [CrossRef]
  22. Zhang, Q.; Dehghanpour, K.; Wang, Z.; Qiu, F.; Zhao, D. Multi-agent safe policy learning for power management of networked microgrids. IEEE Trans. Smart Grid 2021, 12, 1048–1062. [Google Scholar] [CrossRef]
  23. Zhang, Y.; Wang, X.; Wang, J.; Zhang, Y. Deep reinforcement learning based volt-VAR optimization in smart distribution systems. IEEE Trans. Smart Grid 2021, 12, 361–371. [Google Scholar] [CrossRef]
  24. Yu, H.; Lin, S.; Zhu, J.; Chen, H. Deep reinforcement learning-based online optimization of microgrids. Electr. Meas. Instrum. 2024, 61, 9–14. [Google Scholar]
  25. Ji, Y.; Wang, J. Deep reinforcement learning-based online optimal scheduling for microgrids. J. Control Decis. 2022, 37, 1675–1684. [Google Scholar]
  26. Huang, Y.; Wei, G.; Wang, Y. V-D D3QN: The variant of double deep Q-learning network with dueling architecture. In Proceedings of the 37th Chinese Control Conference, Wuhan, China, 25–27 July 2018; pp. 558–563. [Google Scholar]
  27. California ISO. Open Access Same-Time Information System (OASIS). (2020-05-20) [2021-02-26]. Available online: https://www.caiso.com/systems-applications/portals-applications/open-access-same-time-information-system-oasis (accessed on 5 September 2024).
Figure 1. D3QN network structure.
Electronics 14 03654 g001
Figure 2. Microgrid model.
Electronics 14 03654 g002
Figure 3. Reward value curves of various algorithms during training.
Electronics 14 03654 g003
Figure 4. Bus voltages for CDM algorithm strategy formulation.
Electronics 14 03654 g004
Figure 5. Operational policies formulated by each algorithm.
Electronics 14 03654 g005
Figure 6. Real-time electricity price.
Electronics 14 03654 g006
Table 1. Parameters of the D3QN-based microgrid operation optimization method.
ParameterValue
Scheduling duration (T)24
Batch size128
Learning rate (L)0.001
Initial, final, decay rates of ε 1, 0.01, 0.995
Discount factor ( γ )0.97
Target network update frequency480
Experience replay pool24,000
Converter efficiencies ( η c h , η d i s , η p v , η w )0.85, 0.9, 0.9, 0.9
Penalty coefficient (β)1000
Resistivity ( ρ ) 0.15 Ω / km
Length between each node (l)500 m
Standard voltage (V)10 kV
Standard current (I)580 A
Fuel cost factors ( a g , b g , c g )0.00015、1.057、0.4712
Table 2. Statistical analysis of each algorithm’s performance metrics.
AlgorithmAverage RewardsStandard Deviation95% Confidence Interval
DB−1731.47.36(−1738.6, −1724.3)
DM4904.69.75(4894.5, 4914.8)
CDM1012.55.9(1005.1, 1019.9)
Table 3. Balance constraints and voltage constraints for strategies formulated by each algorithm.
Comparison ValuePower BalanceBus 1Bus 2Bus 3Bus 4Bus 5Bus 6Bus 7Bus 8Bus 9Bus 10Bus 11
Standard deviationDB0.1590.0060.0110.0030.0310.0110.0510.0090.0130.0460.0420.069
DM0.0730.0060.0090.0020.030.010.0480.0080.0130.0430.0390.066
CDM0.0610.0060.0090.0010.0290.0120.0350.0050.0030.0260.0200.025
Maximum valueDB1.6191.0081.0161.0021.0311.021.0850.9961.0131.0671.0621.097
DM1.1411.0071.0171.0011.0331.0181.0111.0150.9951.0521.0671.097
CDM1.1941.0021.0161.0011.0351.0171.0181.0011.0011.0331.0471.053
Minimum valueDB0.9060.9940.9810.9910.960.9920.9530.9810.9781.0161.0121.038
DM0.910.9910.9860.9960.9540.990.930.9890.9810.9421.0111.013
CDM0.9410.9910.9910.9970.9660.9850.9320.990.9940.9670.9950.998
Disclaimer/Publisher’s Note: The statements, opinions and data contained in all publications are solely those of the individual author(s) and contributor(s) and not of MDPI and/or the editor(s). MDPI and/or the editor(s) disclaim responsibility for any injury to people or property resulting from any ideas, methods, instructions or products referred to in the content.