1. Introduction
Since the Tokyo Olympics, monitoring athletes’ tension through heart rate evaluation has emerged as an innovative element in sports broadcasting [
1]. During the 2024 Paris Olympics, the Korean archery team captured global attention by winning gold medals in all events [
2]. To prepare for such competitions, the Korean athletes focused on simulating diverse scenarios they might face during matches. For this year’s preparations, the team implemented non-contact heart rate monitoring technology, allowing real-time tracking of heart rate fluctuations during training [
3]. This method significantly enhanced athletes’ psychological stability by providing an objective understanding of their physiological responses. Heart rate is a critical biomarker in archery, directly influencing an athlete’s performance [
4,
5]. Fluctuations in heart rate reflect tension, stress, and psychological states, all of which can significantly impact results. For instance, with elevated heart rates, it is hypothesized that reduced stability can lead to lower scores. However, some athletes have demonstrated high performance even under such conditions. This discrepancy suggests that heart rate fluctuations do not always correlate with performance declines [
6,
7]. Such outcomes likely stem from the complex interaction of factors including physical fitness, mental focus, and heart rate regulation. In addition to physiological signals such as heart rate and tremor, behavioral and biochemical factors—such as anxiety, hormonal fluctuations, and neurotransmitter activity—may also influence performance in precision sports. Although not directly measured in this study, these factors form part of the broader psychophysiological context. Hand tremors have also been identified as a critical factor influencing athletic performance [
8,
9]. Micro-tremors during the shooting phase may stem from psychological tension but can also represent a physiological mechanism aimed at achieving precise targeting of the bullseye. A quantitative examination of the effects of these tremors on performance scores offers valuable insights for developing biometric-based psychological and physical training strategies.In particular, this study proposes heart rate variability and micro-tremor patterns as statistically significant indicators that can serve as novel metrics for evaluating athletes’ readiness and performance potential. By adopting a non-contact, real-time physiological monitoring approach, the proposed method enables objective assessment without interfering with athletes’ movements and concentration. This framework not only enhances training feedback but also holds strong potential for in-game application, offering actionable insights during live competitions. Moreover, by overcoming the limitations of controlled lab settings through the analysis of actual Olympic footage, this research lays a practical foundation for expanding physiological monitoring to sports such as shooting, golf, and other precision-dependent disciplines. Ultimately, this study provides essential groundwork for developing field-applicable, data-driven, personalized training systems that integrate biometric and performance analytics.This research analyzed actual Olympic match footage, ensuring accurate biometric data collection within realistic competitive settings without relying on additional equipment. Unlike traditional laboratory-based methods, this approach strives to deliver more reliable results by utilizing biometric data gathered directly from real-world competition environments. Thus, this study aims to investigate the effects of heart rate and body tremors on archery performance outcomes by applying non-contact physiological analysis to real Olympic footage. Specifically, the relationship between hand movements, heart rate, and performance scores is quantitatively evaluated using ordinal logistic regression and group-based comparisons. This study hypothesizes that elevated heart rate and excessive right-arm tremor negatively affect archery performance. While previous studies have largely relied on laboratory experiments or wearable devices, few have examined these associations in real-world competition settings. By analyzing Olympic-level footage using non-contact methods, this work contributes novel evidence on how physiological stability and biomechanical precision impact elite performance.
2. Related Works
Table 1 summarizes previous studies by categorizing them into two groups: psychological response analysis and biometric data-based analysis. Psychological response analysis focuses on HR, HRV, and attention, with limitations such as controlled indoor environments and limited data diversity. Biometric data-based analysis investigates factors such as postural sway, aiming time, and cardiopulmonary metrics but is constrained by the reliance on contact sensors and the predominance of novice participants in these studies.
2.1. Psychological Responses and Performance Analysis
Dal et al. investigated the psychophysiological differences between virtual reality (VR) archery and real archery by comparing heart rate (HR), heart rate variability (HRV), and respiration rate, along with psychological and performance differences between the two methods. Their study involved 22 participants (8 females, aged 20–24) shooting 10 arrows from an 18-m distance. Results indicated that RMSSD (a time-domain HRV measure) was significantly higher in real archery, although the proportional change was greater in the VR setting. Participants perceived real archery as more physically and mentally demanding, and they demonstrated better performance in VR archery. However, these findings are limited by their controlled experimental settings and may not fully generalize to actual competition scenarios. In contrast, our study overcomes these limitations by analyzing biometric and fine movement indicators derived from real competition data, allowing for a more accurate assessment of how these factors impact performance outcomes.
Açıkada et al. examined the impact of HR on shooting performance among 13 international-level elite athletes (7 females, 6 males). The study followed a standardized indoor protocol, where participants performed a 3-min shuttle run to elevate physiological stress, including heart rate. Then they shot three arrows from an 18-m distance. Blood lactate (BL) levels and HR were measured during rest and post-exercise conditions, with average resting HR of 119 bpm and BL of 1.72 mmol/L; post-exercise values were 168 bpm and 4.21 mmol/L, respectively. Despite the physiological stress, no statistically significant differences in shooting scores were observed between resting and post-exercise conditions (p > 0.05). While this study provided valuable insights into the physiological aspects of archery, it relied on invasive blood lactate measurements and controlled laboratory environments, limiting its applicability to real-world competitions. Our research addresses these limitations by employing a non-invasive, camera-based biometric data extraction method that enables real-time physiological monitoring in actual training and competition settings.
Vrbik et al. analyzed HR and single-channel EEG recordings in eight expert archers, comparing recurve and compound archers’ scores. Their results revealed that compound archers scored higher and exhibited greater HR and attention levels before, during, and after shooting, compared to recurve archers, while relaxation levels remained consistent. ANOVA analysis confirmed significant differences in scores, HR, and attention levels (p < 0.01) but no differences in relaxation levels. Although this study integrated HR data with EEG measurements, its small sample size and limit the generalizability of its findings. By contrast, the present research leverages real Olympic competition footage, combining HR data with fine motion analysis to provide a comprehensive understanding of biometric indicators’ effects on performance. By focusing on real-world data, we deliver more reliable and actionable insights applicable to competitive environments.
2.2. Analysis Based on Biometric and Movement Data
Keast et al. examined the relationships between postural sway, aiming time, cardiac cycle, and the timing of the first finger movement during the ECG cycle with arrow quality, categorized as good, moderate, or poor based on predefined scoring criteria. Their analysis of 240 arrows showed that postural sway significantly increased as arrow quality worsened (p < 0.05–0.001), while aiming time remained consistent among athletes but varied by arrow quality. High-quality arrows were associated with a significant increase in the cardiac cycle immediately before release (p < 0.05–0.01), and the first finger movement consistently occurred during the ST phase of the ECG cycle (p < 0.0001). While the study provided valuable insights, it was conducted in controlled environments, limiting its applicability to competitive settings. Our study addresses this limitation by analyzing data from actual Olympic-level competitions, offering a more realistic assessment of the impact of postural sway and cardiac cycles on performance.
Eswaramoorthi et al. identified key cardiopulmonary parameters influencing archery scores and analyzed their impact using PCA, HACA, and DA methods. Data were collected from 32 archers (mean age: 17), and seven key parameters (FVC, MVV, PEFR, IRV, RRR, RSBP, RDBP) were identified. HACA classified participants into high-optimal-capacity (HOCA) and low-optimal-capacity (LOCA) groups, with DA achieving classification accuracies between 90.63% and 96.88%. Despite its comprehensive approach, this study focused primarily on cardiopulmonary measurements without integrating data on fine motor movements or real competition data. In contrast, our research combines biometric data, such as HR, with movement analysis, providing a holistic perspective on the factors influencing performance in elite-level competitions.
Quan et al. investigated the relationship between aiming patterns and archery scores using accelerometer data from four novice middle school archers. Dynamic Time Warping (DTW) was used to analyze points of interest (POIs), with stepwise multiple regression models explaining scores with prediction accuracies ranging from 27.93% to 72.02%. However, the study’s reliance on contact-based sensors and novice participants limits its applicability to elite athletes in competitive scenarios. Our research overcomes these limitations by employing contactless camera-based biometric data collection for Olympic-level athletes, offering a more precise and practical understanding of aiming patterns and performance.
Ogasawara et al. proposed a feedback system to reduce postural tremors in archery using accelerometer-based measurements. The system automatically detected shooting phases (aiming, release, follow-through) and quantified tremors during aiming to predict scores, achieving a classification accuracy of 0.72 and a correlation coefficient of 0.74. While effective, this approach relied on contact-based sensors attached to the bow, limiting its practicality in high-level competition. Unlike this feedback-focused study, our research employs statistical methods to analyze the relationship between fine movements and scores, integrating HR data to explore the potential of biometric indicators for enhancing performance.
3. Method
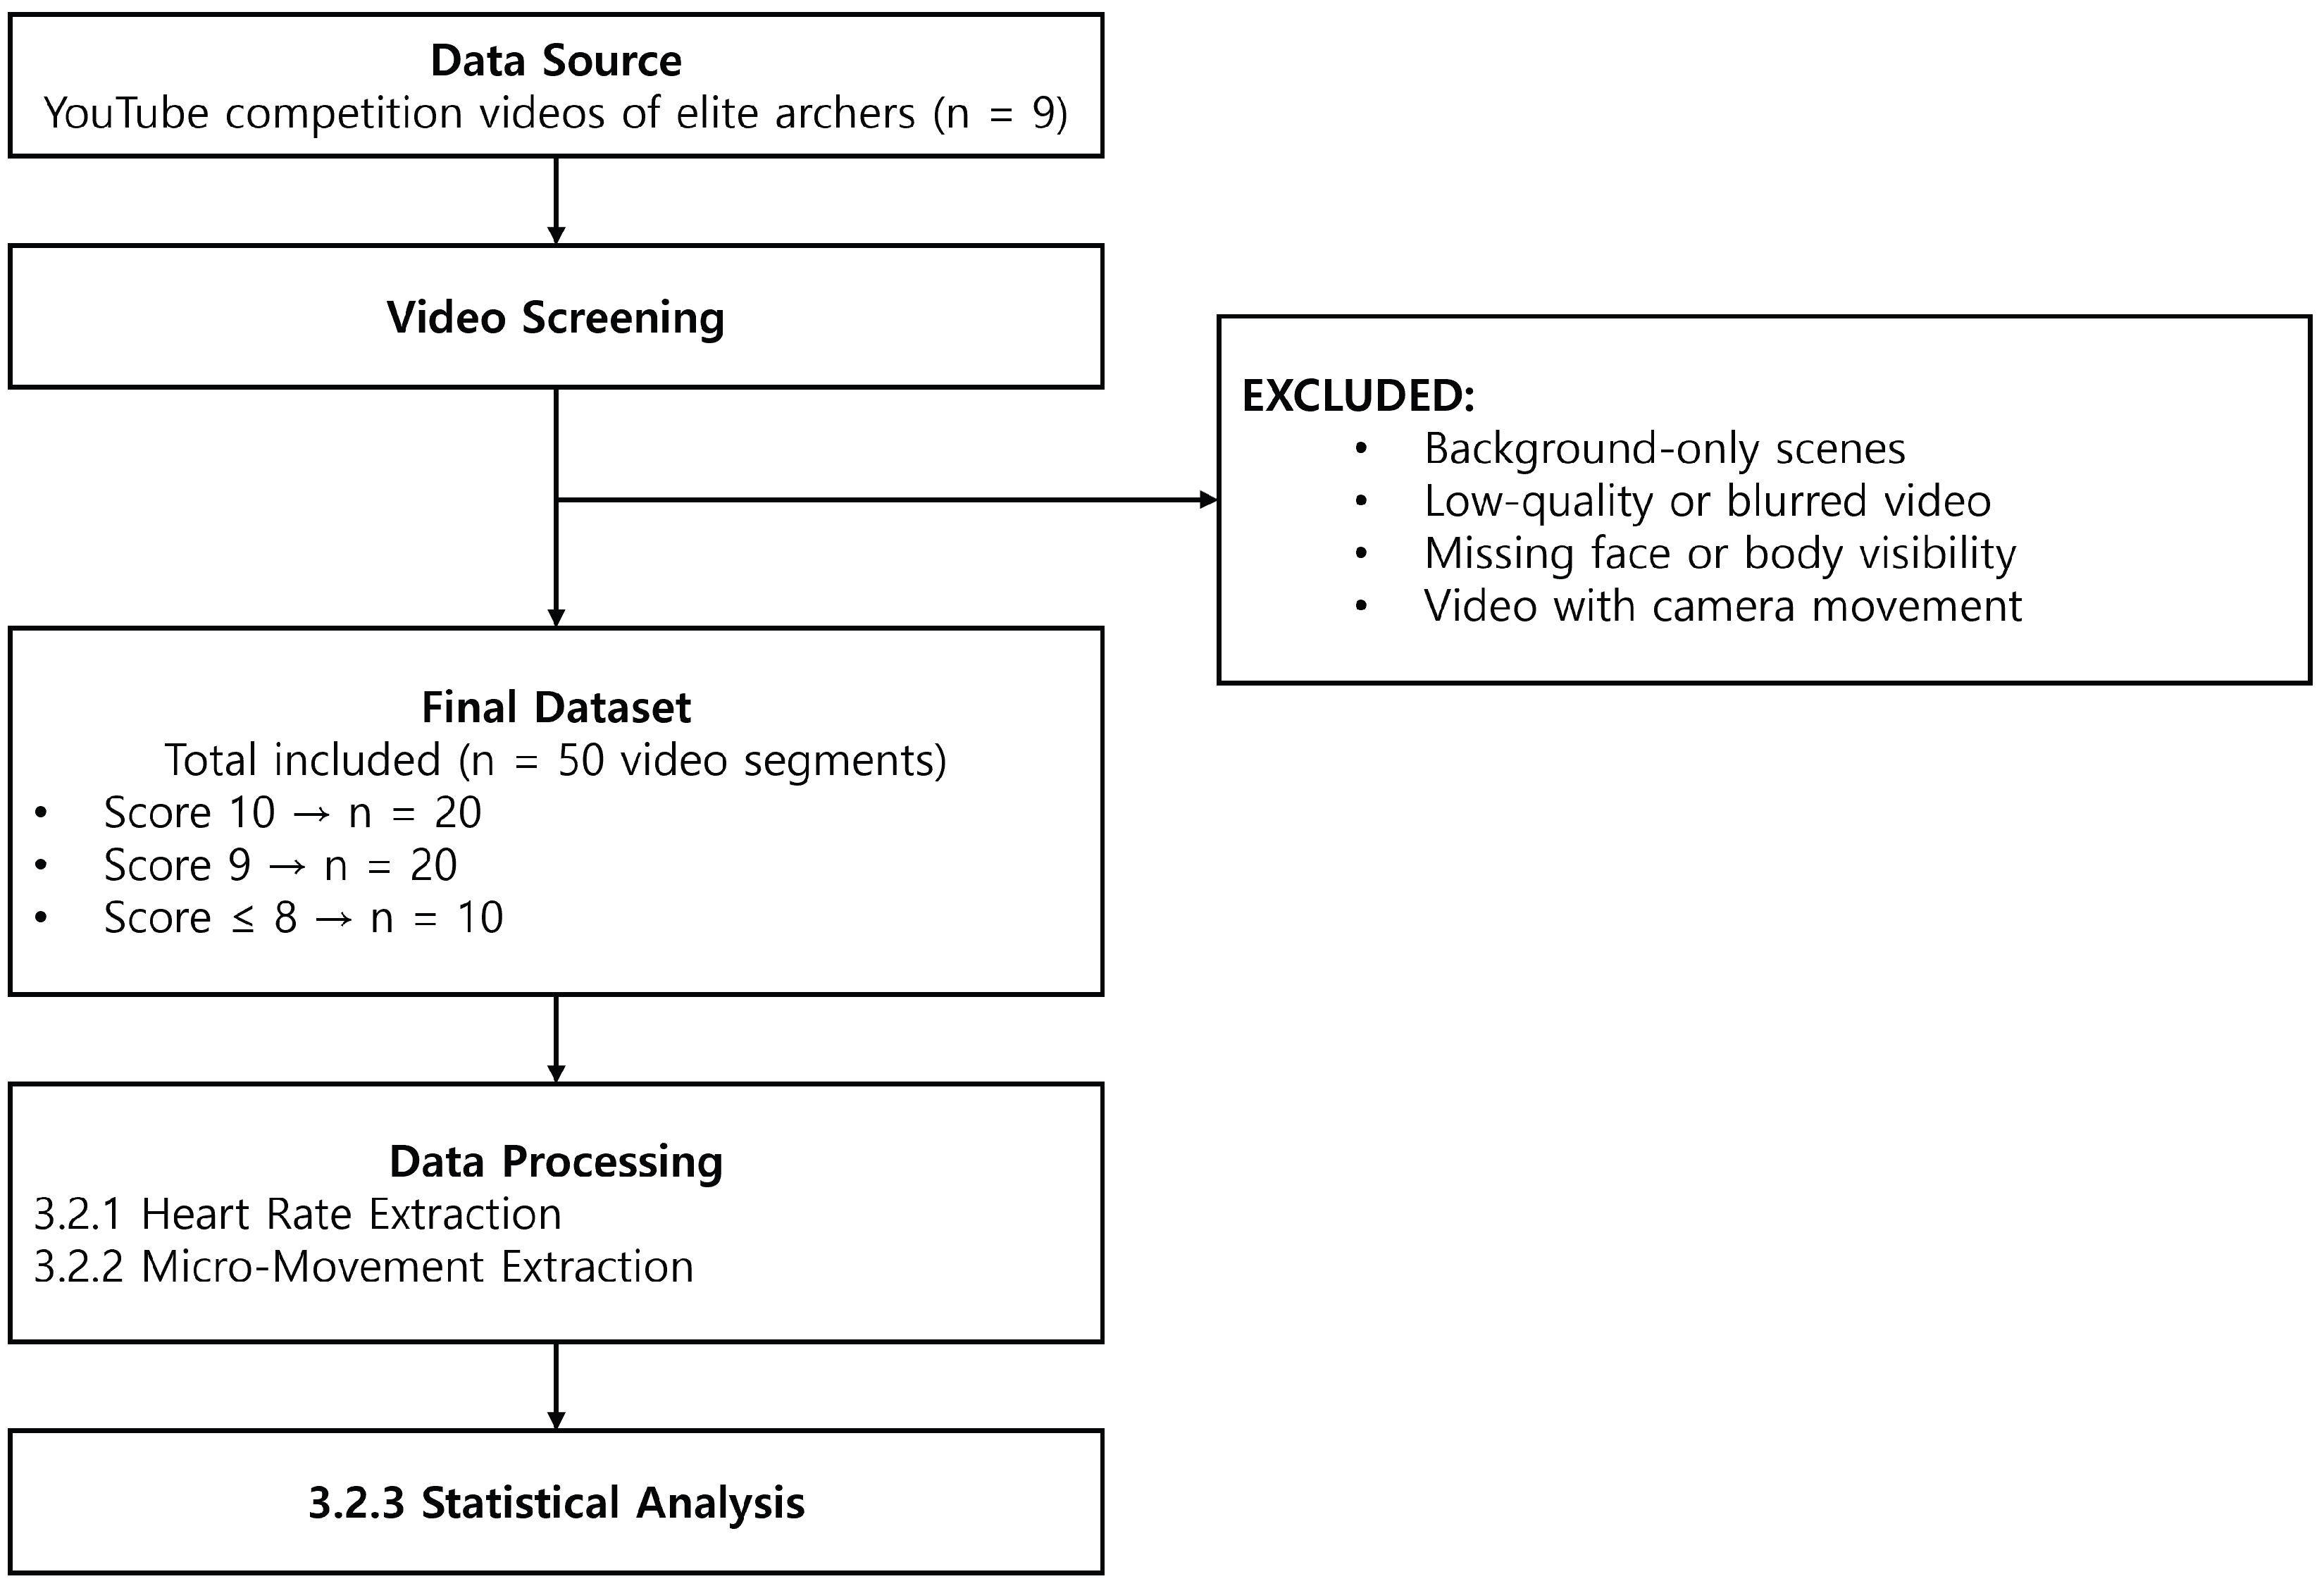
To enhance clarity and transparency of the study design, we provide a flowchart following the STROBE guidelines (
Figure 1). This diagram summarizes the overall research process, including data sources, screening and exclusion criteria, final dataset composition, and subsequent analysis steps. As shown in the figure, the study began with nine YouTube videos of elite archers. After screening and excluding background-only scenes, low-quality or blurred footage, missing face/body visibility, and clips with camera movement, a total of 50 valid video segments were retained. These segments were then categorized into three groups according to performance scores (score of 10:
n = 20; score of 9:
n = 20; score ≤ 8:
n = 10). Subsequently, rPPG-based heart rate extraction (
Section 3.2.1) and micro-movement analysis (
Section 3.2.2) were performed, followed by statistical analyses (
Section 3.2.3).
3.1. Dataset
This study investigates the correlation between heart rate and arm movement data in relation to archery performance. Simple and multiple regression analyses were conducted to assess both the individual and interactive effects of these variables. The dataset was compiled from official match footage of the World Archery Championships available on YouTube, comprising 50 high-reliability observational data points. The sample included athletes of diverse genders and backgrounds, ensuring a representative and heterogeneous dataset.
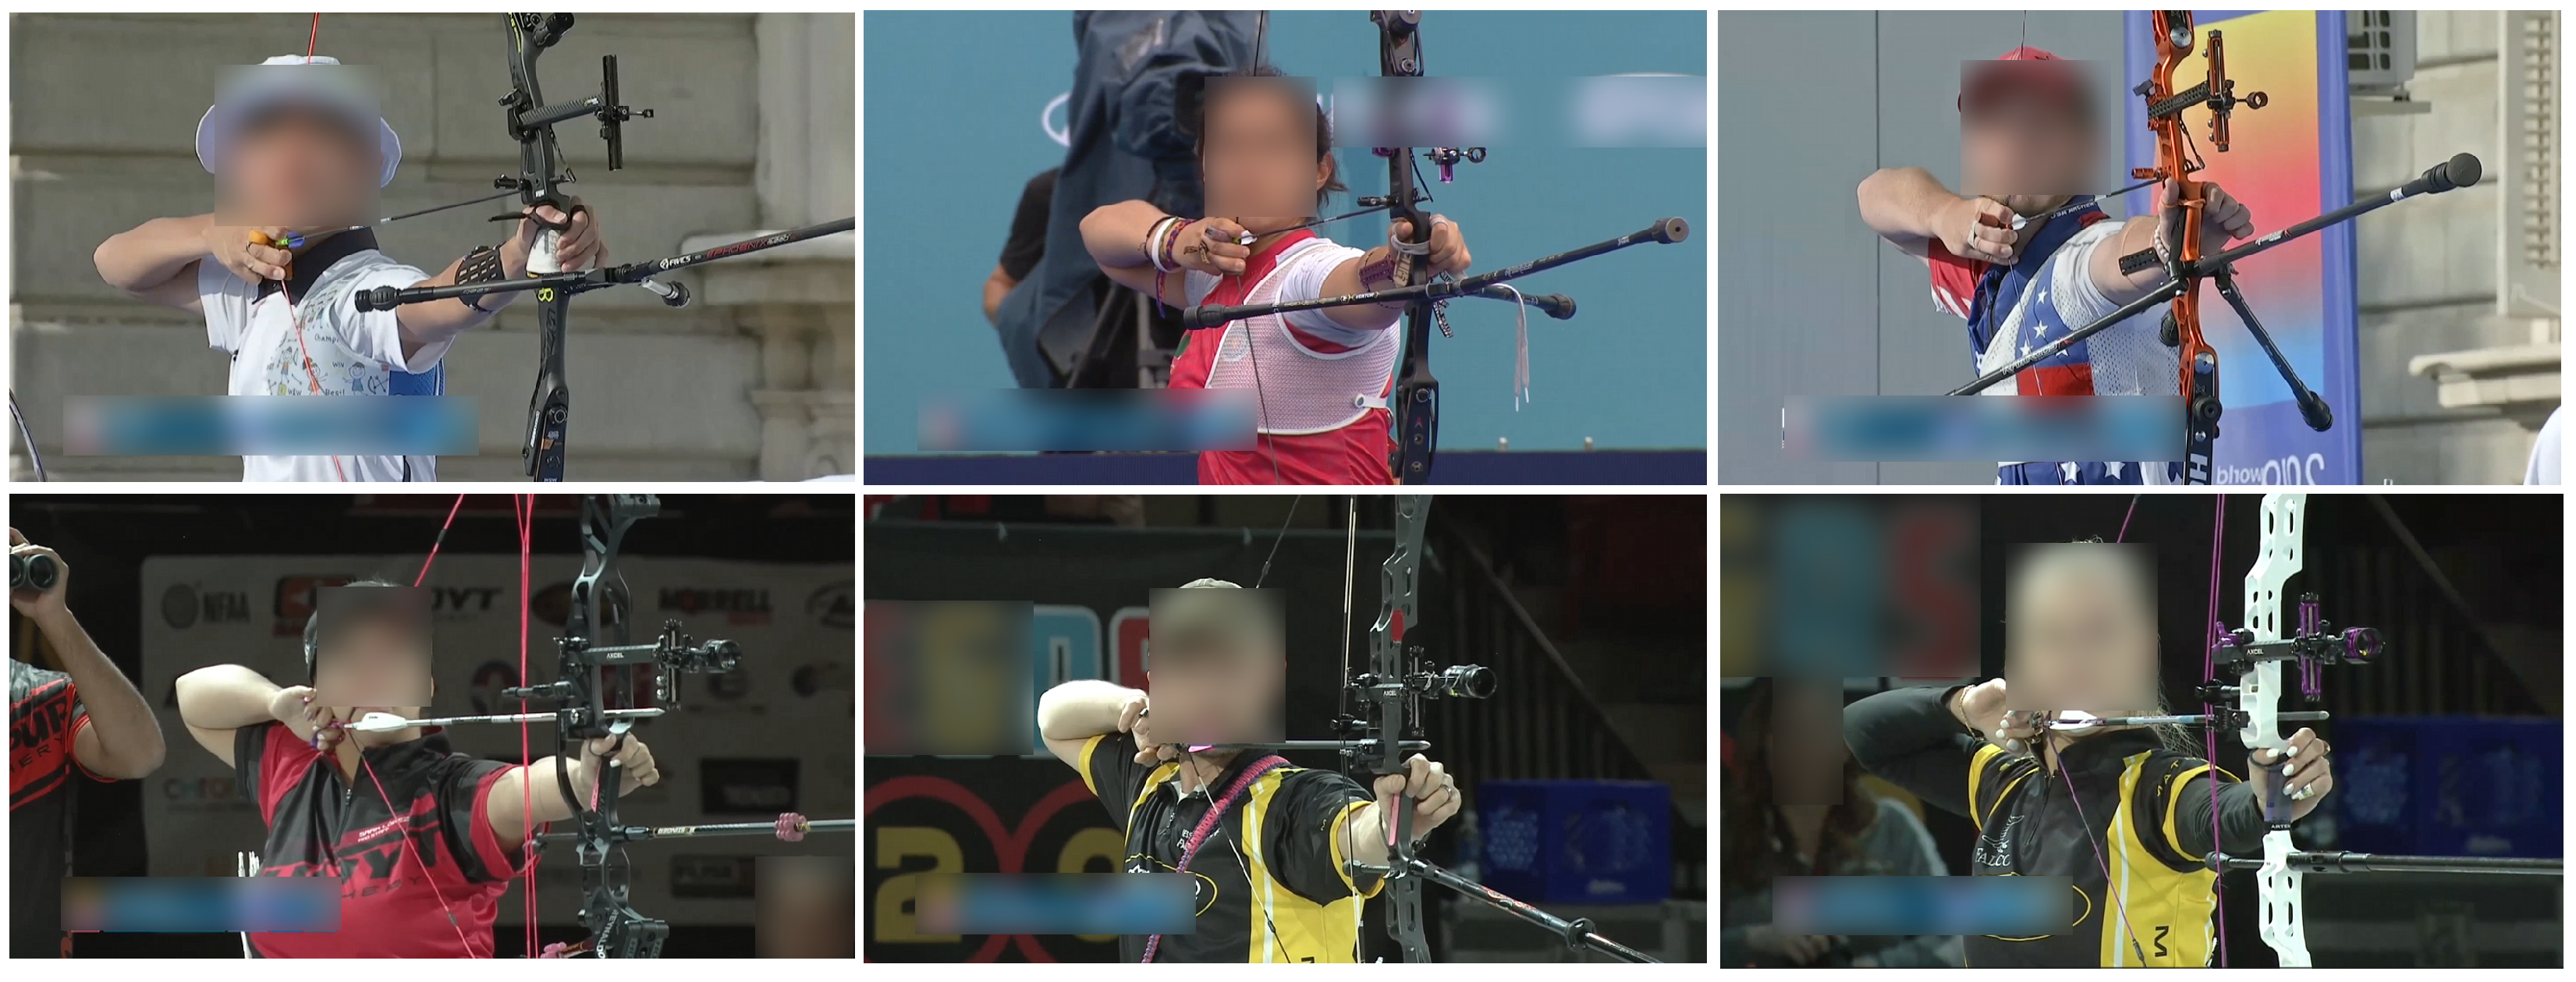
Figure 2 presents sample frames from the dataset used in this study. To ensure compliance with privacy protection and copyright regulations, all identifiable elements—such as athlete faces, broadcaster logos, and graphical overlays—were anonymized through blurring or masking.
Similar dataset sizes have been employed in previous studies. For instance, Eswaramoorthi et al. analyzed heart rate and athletic performance using 32 data points, while Ogasawara et al. predicted archery scores with only 11 data points.To assess the adequacy of the sample size from a statistical perspective, a post hoc power analysis was conducted based on the effect size (log-odds coefficient) of the movement variable obtained from the full ordinal logistic regression model that included both movement and average heart rate as predictors. The resulting statistical power was 0.9486, indicating that the sample size of 50 was sufficient to detect meaningful effects.
Each data point corresponded to a 10-s video segment recorded at 25 fps. Heart rate data were extracted from PPG signals obtained from the athlete’s facial region. Arm movement data were measured from the start of the aiming phase to the release of the bowstring. To ensure data reliability, only heart rate values with a confidence score of 0.7 or higher were included. For movement analysis, micro-movements within a 5-pixel threshold were considered. Average values across each 10-s segment were calculated for all variables to standardize the analysis.
3.2. Extraction of Biometric Indicators
3.2.1. BPM
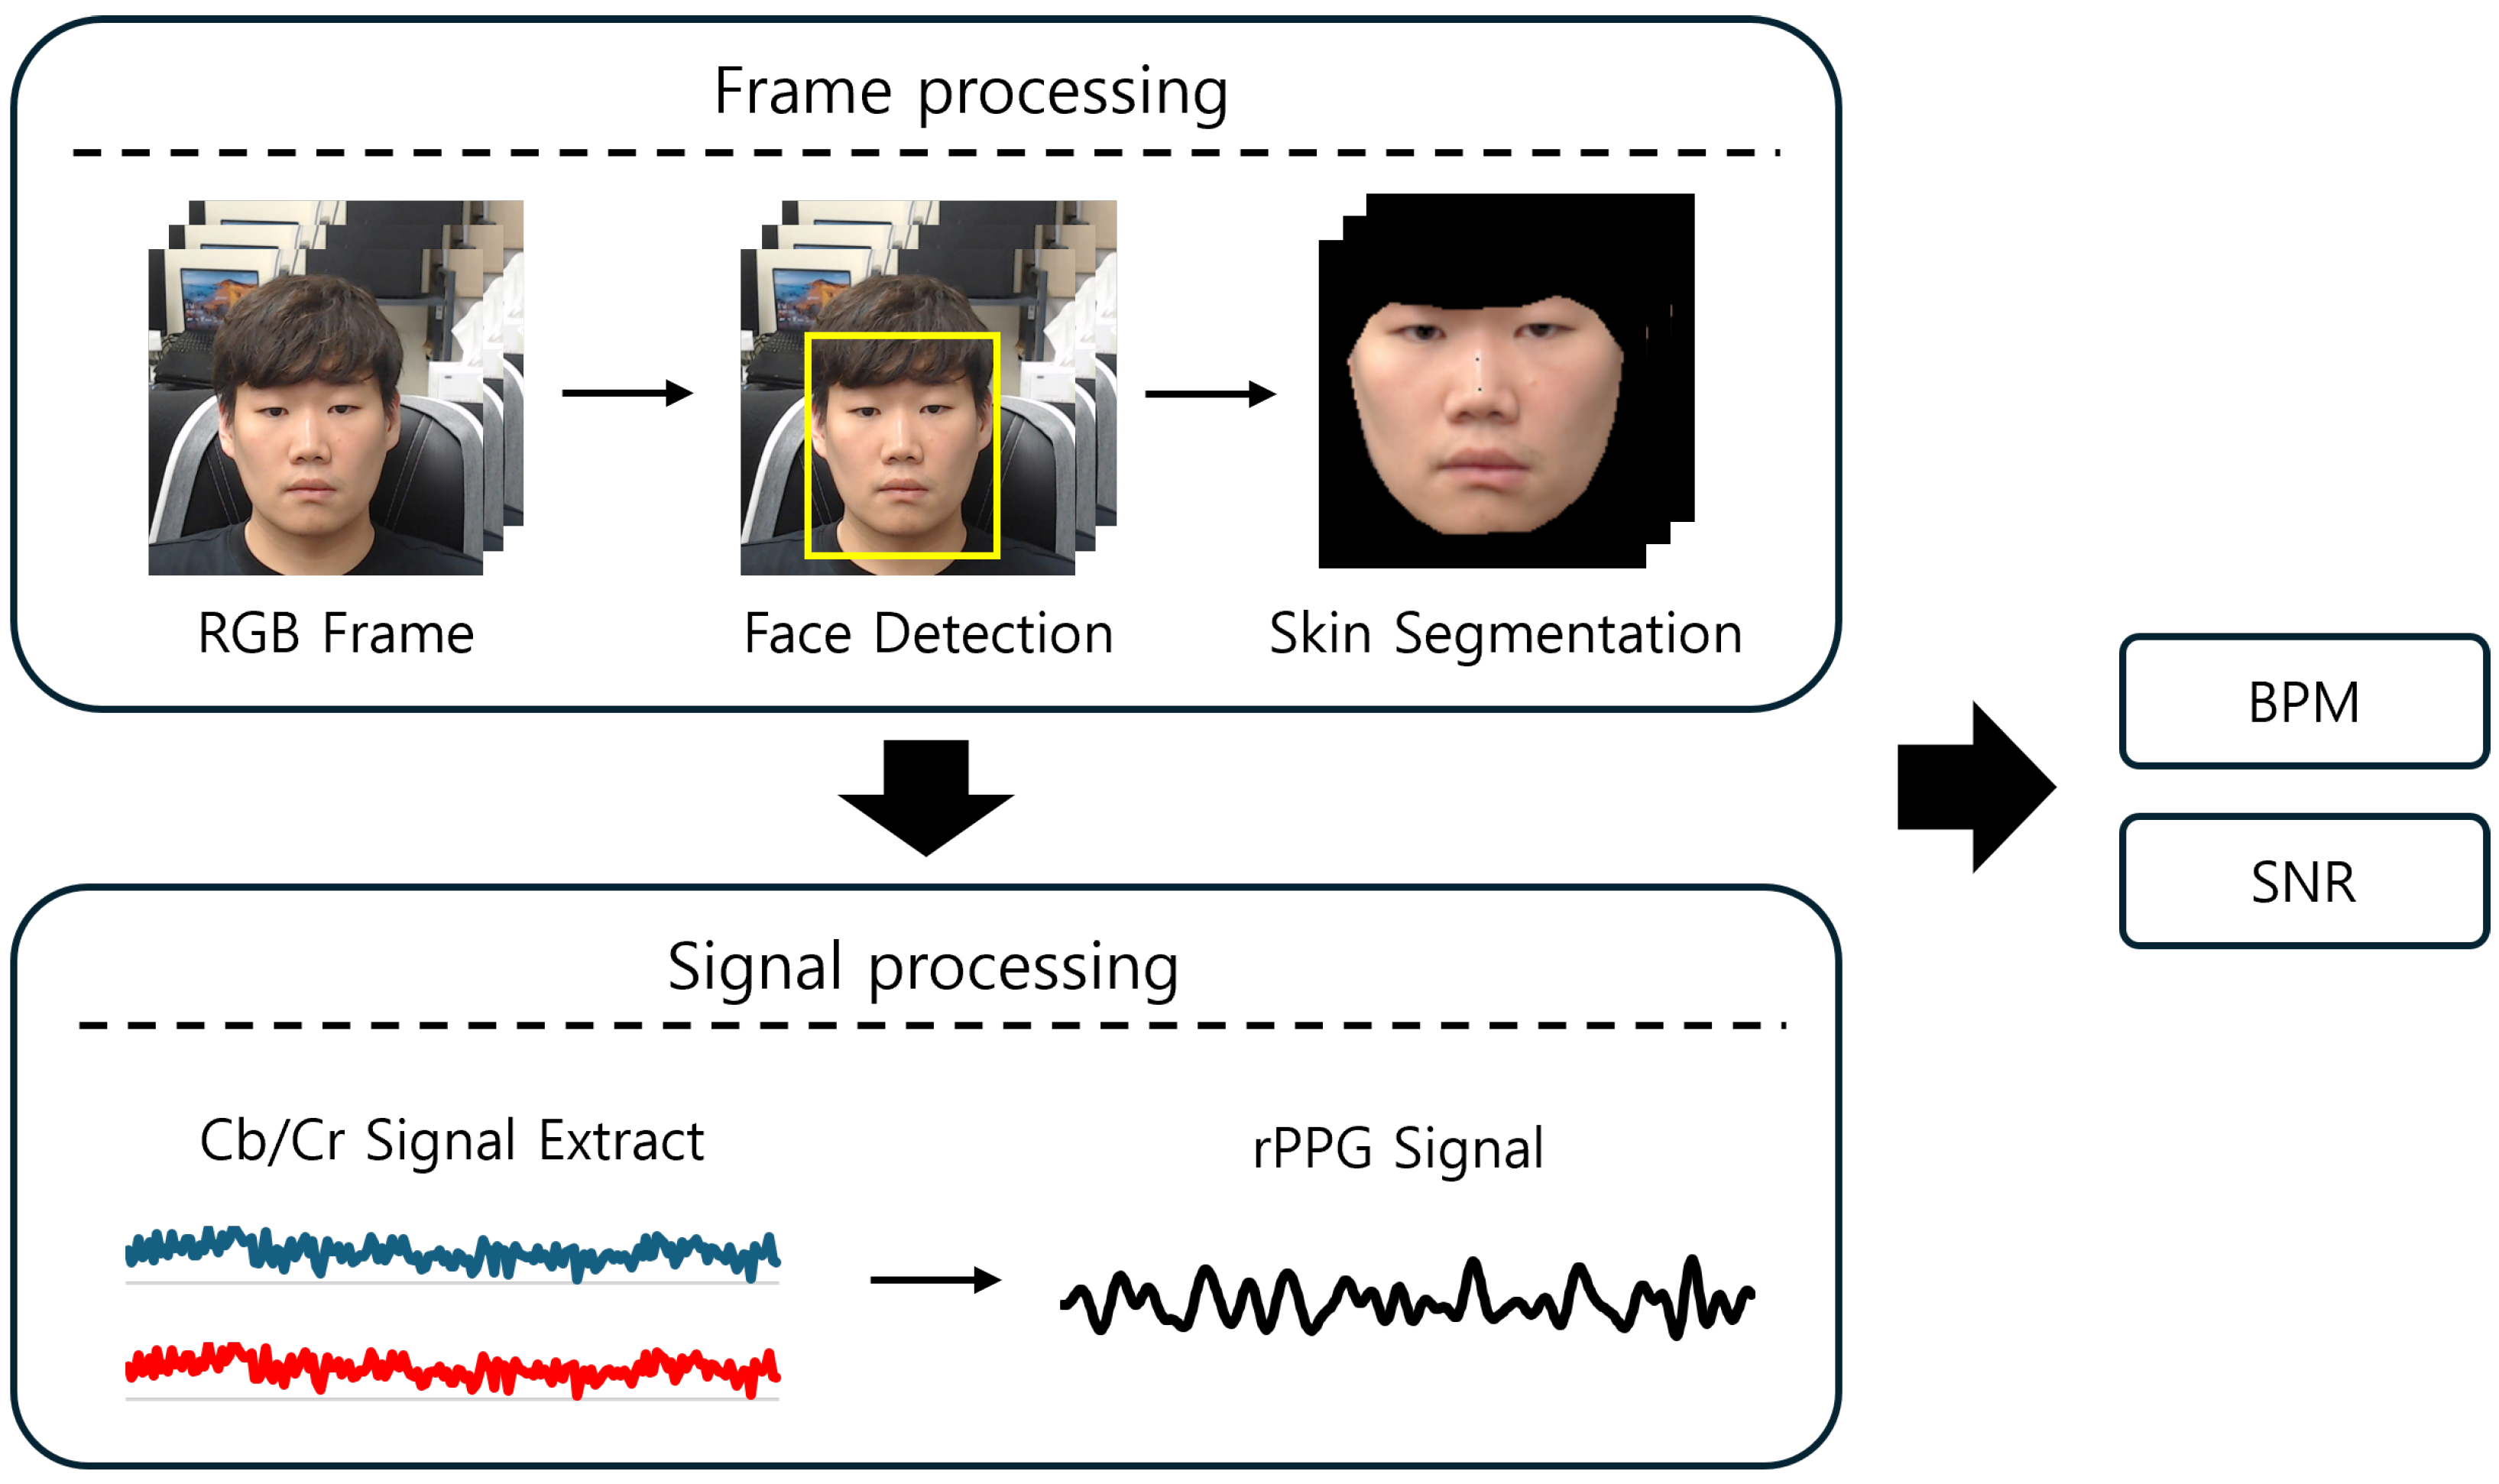
In this study, we focused on extracting the rPPG signal from the facial region of interest (ROI) using a systematic approach. The facial region was identified and tracked using a deep learning-based model to enable continuous user monitoring. Since blood absorbs light more effectively than surrounding tissues, periodic changes in skin color occur as blood flows through the vessels. We used these fluctuations to derive the rPPG signal.
Figure 3 illustrates the overall process of rPPG feature extraction.
The extraction process was carried out in several steps. Initially, the face was detected in each frame using a Face Detection model. To isolate the skin pixels, filtering was performed in the YCbCr color space, which is more resilient to variations in skin tone and lighting conditions compared to RGB. Pixels were classified as skin if their Cb and Cr values fell within the ranges of 133 to 177 and 77 to 127, respectively. The RGB frames were converted to YCbCr using Equation (
1), and any out-of-range pixel values were clipped to the nearest valid boundary. Here, R’, G’, and B’ denote normalized values of the respective color channels [
17].
Once the skin pixels were isolated using the threshold-based mask, the raw rPPG signal was extracted by analyzing the chrominance components of the skin region. Specifically, we focused on the Cr (red-difference) and Cb (blue-difference) channels, which are known to exhibit subtle yet periodic changes associated with blood volume pulses beneath the skin. To quantify this chrominance-based variation, the average value of the Cr and Cb channels over all skin pixels was computed for each frame, as expressed in Equation (
2). This value served as a frame-wise scalar representation of the rPPG signal:
where
N denotes the total number of skin pixels. By aggregating this value across successive frames, we obtained a temporal rPPG signal encoding the physiological pulse rhythm.
To improve the quality of the extracted signal, detrending and bandpass filtering were applied to remove motion-related noise, such as respiration artifacts, and to isolate frequencies within the human heart rate range (42 bpm to 180 bpm) [
18]. This filtering step ensured that meaningful physiological signals were preserved while reducing noise interference.
Subsequently, the processed rPPG signal was transformed into the frequency domain using the Fast Fourier Transform (FFT). The dominant frequency within the filtered range was identified and used to calculate the heart rate in beats per minute (bpm), following the formula described in Equation (
3).
Lastly, the confidence level of the extracted heart rate was assessed using the signal-to-noise ratio (SNR). The SNR was determined by comparing the power of the dominant frequency, representing the heart rate, to the power of noise frequencies within the rPPG signal. A higher SNR value indicated a more reliable signal, and the confidence score was calculated as outlined in Equation (
4).
3.2.2. Micro-Movement
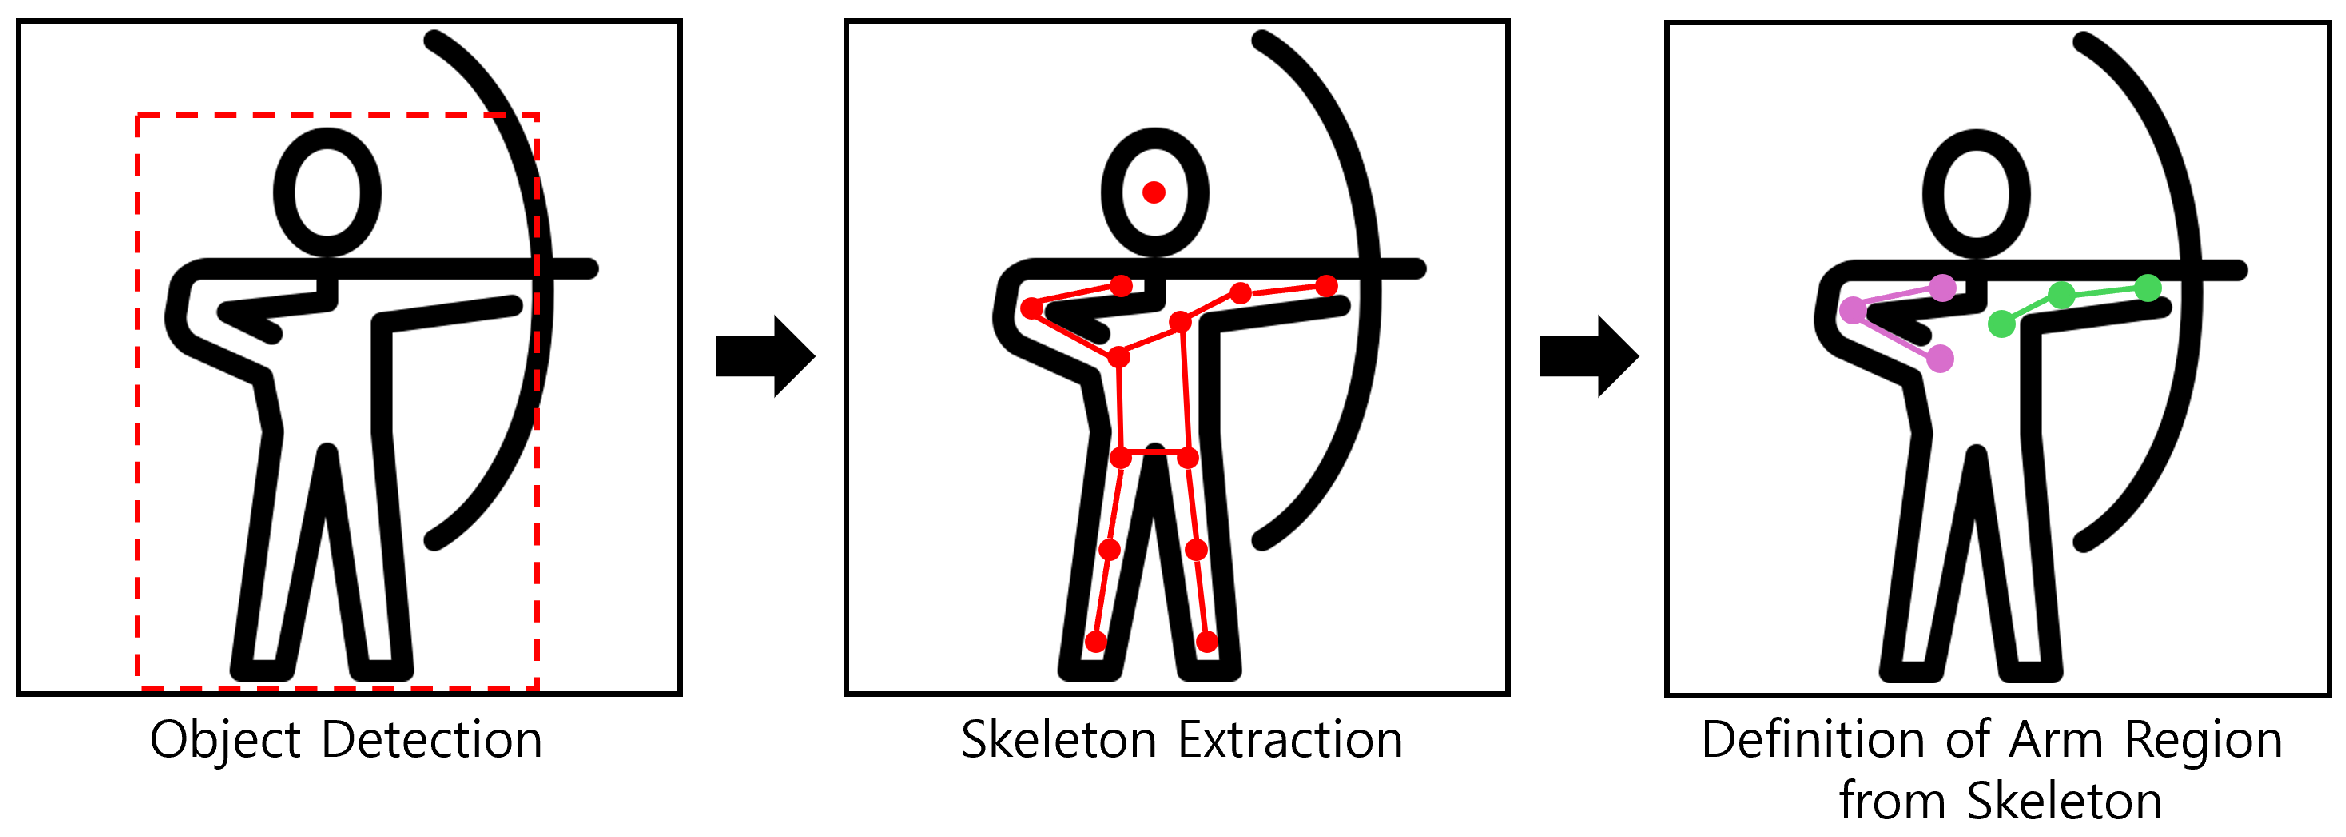
To extract feature points within the object, an object recognition process was first performed. For this, a deep learning-based model, YOLO v8, was utilized, enabling efficient detection of target objects for analysis [
19]. Once the object detection was complete, the skeleton of the detected object was extracted. The skeleton represented the primary body structure of the object and was used to define the regions of the left and right arms [
20].
Figure 4 illustrates the process for defining the arm areas in an image.
Once the skeleton extraction was completed, an automated feature extraction model was applied to detect and define various feature points on the object. Among these detected points, those closest to the defined body regions (left and right arms) were selectively filtered. These filtered feature points served as key reference points in the subsequent tracking process.
Feature point tracking was then performed to analyze the continuous movement of the object. The X and Y coordinates of the selected feature points were recorded for each frame, and their displacement was calculated based on the changes in coordinate values across consecutive frames. This process enabled the collection of detailed movement data specific to the object’s body parts. The detailed process is shown in
Figure 5.
This study effectively combined deep learning-based object detection technology, YOLO v8, with automated feature extraction methods to analyze body regions and movements of objects.
3.2.3. Statistical Analysis
Continuous variables were summarized as the mean ± standard deviation (SD) when normally distributed and as the median with the interquartile range (IQR) when non-normally distributed. Categorical variables were presented as counts and percentages.
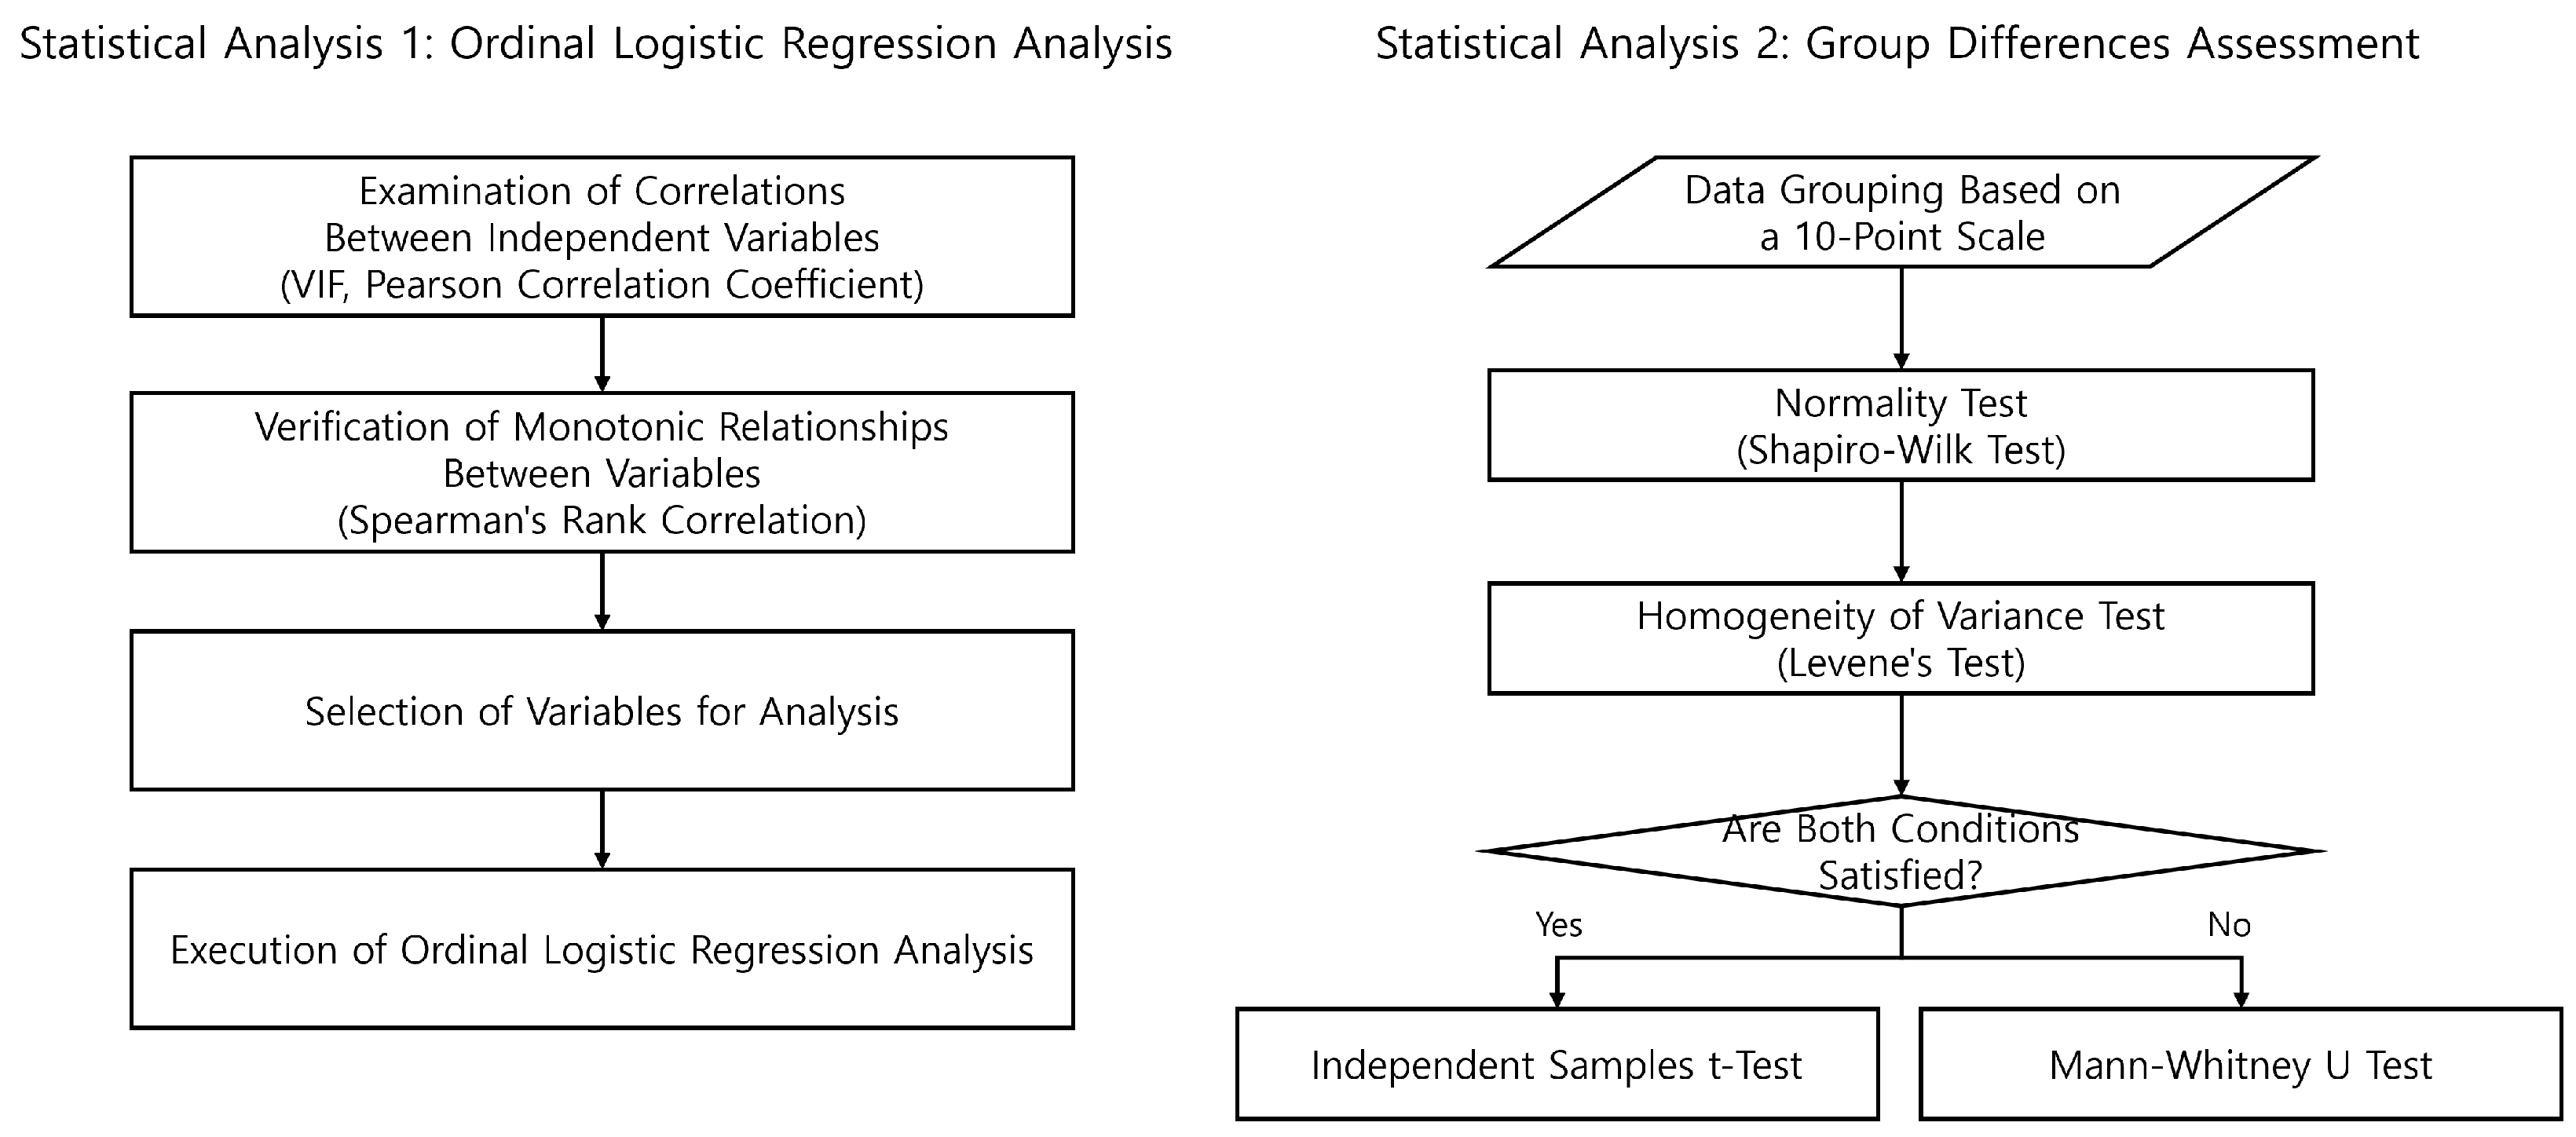
The normality of the continuous variables was assessed using the Shapiro–Wilk test, and the homogeneity of variances was examined with Levene’s test. For group comparisons between the 10-point group and the below-10-point group, an independent two-sample
t-test was conducted when assumptions of normality and homoscedasticity were satisfied. When these assumptions were violated, the Mann–Whitney U test was applied instead. A schematic overview of this statistical testing process is presented in
Figure 6.
Correlation analyses were performed to examine the relationships among independent variables and to prevent potential multicollinearity in the regression model. Specifically, the variance inflation factor (VIF) [
21] was calculated, as shown in Equation (
5), with values close to 1 indicating no multicollinearity. A threshold of 10 or higher was considered indicative of multicollinearity.
Since the VIF does not provide the direction or strength of associations, Pearson correlation coefficients [
22] were also computed, as defined in Equation (
6).
Pearson’s correlation quantifies the linear relationship between two variables, with values ranging from to 1. A value near 1 indicates a strong positive correlation, while a value near signifies a strong negative correlation.
In addition, Spearman correlation analysis [
23] was conducted to evaluate monotonic relationships, which was useful when the variables exhibited non-linear associations.
For regression modeling, ordinal logistic regression was employed to examine the effects of movement and heart rate on performance scores. The dependent variable, score, was defined as an ordinal outcome with three categories (10 points, 9 points, and 8 points or less). The independent variables, average heart rate and average movement values extracted from 10-s video segments, were treated as continuous predictors. Ordinal logistic regression was selected because it preserved the ordinal nature of the outcome variable while enabling an effective evaluation of the association between predictors and scores [
24]. All statistical analyses were performed using Python (version 3.7.12), with the SciPy and statsmodels packages.
4. Results
Before presenting the statistical analyses, the characteristics of the analyzed dataset are summarized. A total of 50 valid data points were extracted from international archery competition footage, including athletes of diverse genders and backgrounds. After preprocessing, the dataset comprised 10 entries for 8 points, 20 entries for 9 points, and 20 entries for 10 points. This distribution provided a heterogeneous and representative sample for subsequent analyses.
This study analyzed the effects of heart rate and movement variables on archery scores. To better understand the biometric data used in this study, an example image illustrating the process of extracting physiological signals is presented in
Figure 7. This example demonstrates the use of camera-based remote photoplethysmography (rPPG) technology to capture heart rate and variability, as well as the extraction of micro-movement feature points of archers during their performance. The visualized data illustrates the process of extracting biometric indicators from video.
Written informed consent was obtained from the individual depicted in
Figure 7 for the publication of their image in this manuscript.
The scores were categorized into three groups: 10 points, 9 points, and 8 points or lower. Scores below 8 points were preprocessed and grouped as 8 points. After preprocessing, the dataset consisted of 10 entries for 8 points, 20 entries for 9 points, and 20 entries for 10 points.
To assess multicollinearity, the VIF (variance inflation factor) values were calculated. The VIF for heart rate and total movement was 1.0313, that for heart rate and right-arm movement was 1.0471, and that for heart rate and left-arm movement was 1.0131. All VIF values were close to 1, indicating no multicollinearity issues. Pearson correlation coefficients were also analyzed, revealing a correlation of 0.1741 between heart rate and total movement, 0.2113 between heart rate and right-arm movement, and 0.1138 between heart rate and left-arm movement. These low correlation coefficients indicate weak linear relationships among the variables. Detailed analysis results are presented in
Table 2.
Spearman correlation analysis revealed a strong negative monotonic relationship between heart rate and scores, indicating that higher heart rates were associated with lower scores. Similarly, a statistically significant negative monotonic relationship was observed between movement and scores, except for left-arm movement, which showed no significant correlation. However, no statistically significant relationship was found between heart rate and movement. Based on these findings, heart rate and movement variables were independently included in the regression model. The Spearman correlations reported in
Table 3 were computed on the full dataset across all three score categories.
Figure 8 visualizes the Spearman correlation coefficients between biometric variables and archery scores. Heart rate showed the strongest negative correlation with score (
;
), followed by right-arm movement (
;
) and overall movement (
;
). In contrast, left-arm movement did not show a statistically significant relationship with score (
;
).
The results of the ordinal logistic regression analysis showed that the regression coefficient for heart rate was −0.1166, with a p-value of less than 0.05, indicating statistical significance. Similarly, the regression coefficient for total movement was −4.5968 (p = 0.033), and for right-arm movement, it was −6.1747 (p = 0.008), both of which were also statistically significant. However, the regression coefficient for left-arm movement was −1.7256, with a p-value of 0.364, indicating a lack of statistical significance. When movement and heart rate were simultaneously included as independent variables in the regression model, statistically significant outcomes were observed only when heart rate and right-arm movement were analyzed together (p = 0.031). In contrast, overall movement became less influential when considered alongside heart rate, and left-arm movement remained unrelated to performance.
Taken together, these results highlight that physiological arousal (heart rate) and fine motor control of the right arm are the primary determinants of shooting performance. The detailed regression results are summarized in
Table 4.
To analyze differences in movement and heart rate between the 10-point group and other groups, appropriate statistical tests, determined by normality and homoscedasticity assumptions, were conducted. The analysis revealed a significant difference in heart rate and right-arm movement between the groups, with the 10-point group showing lower values. In contrast, no significant differences were observed in overall or left-arm movement. Detailed statistical results, including test types and significance levels, are summarized in
Table 5. In the context of elite-level competition, achieving a perfect score of 10 is a critical indicator of performance; therefore, we dichotomized the scores into 10 and below 10 for analysis.
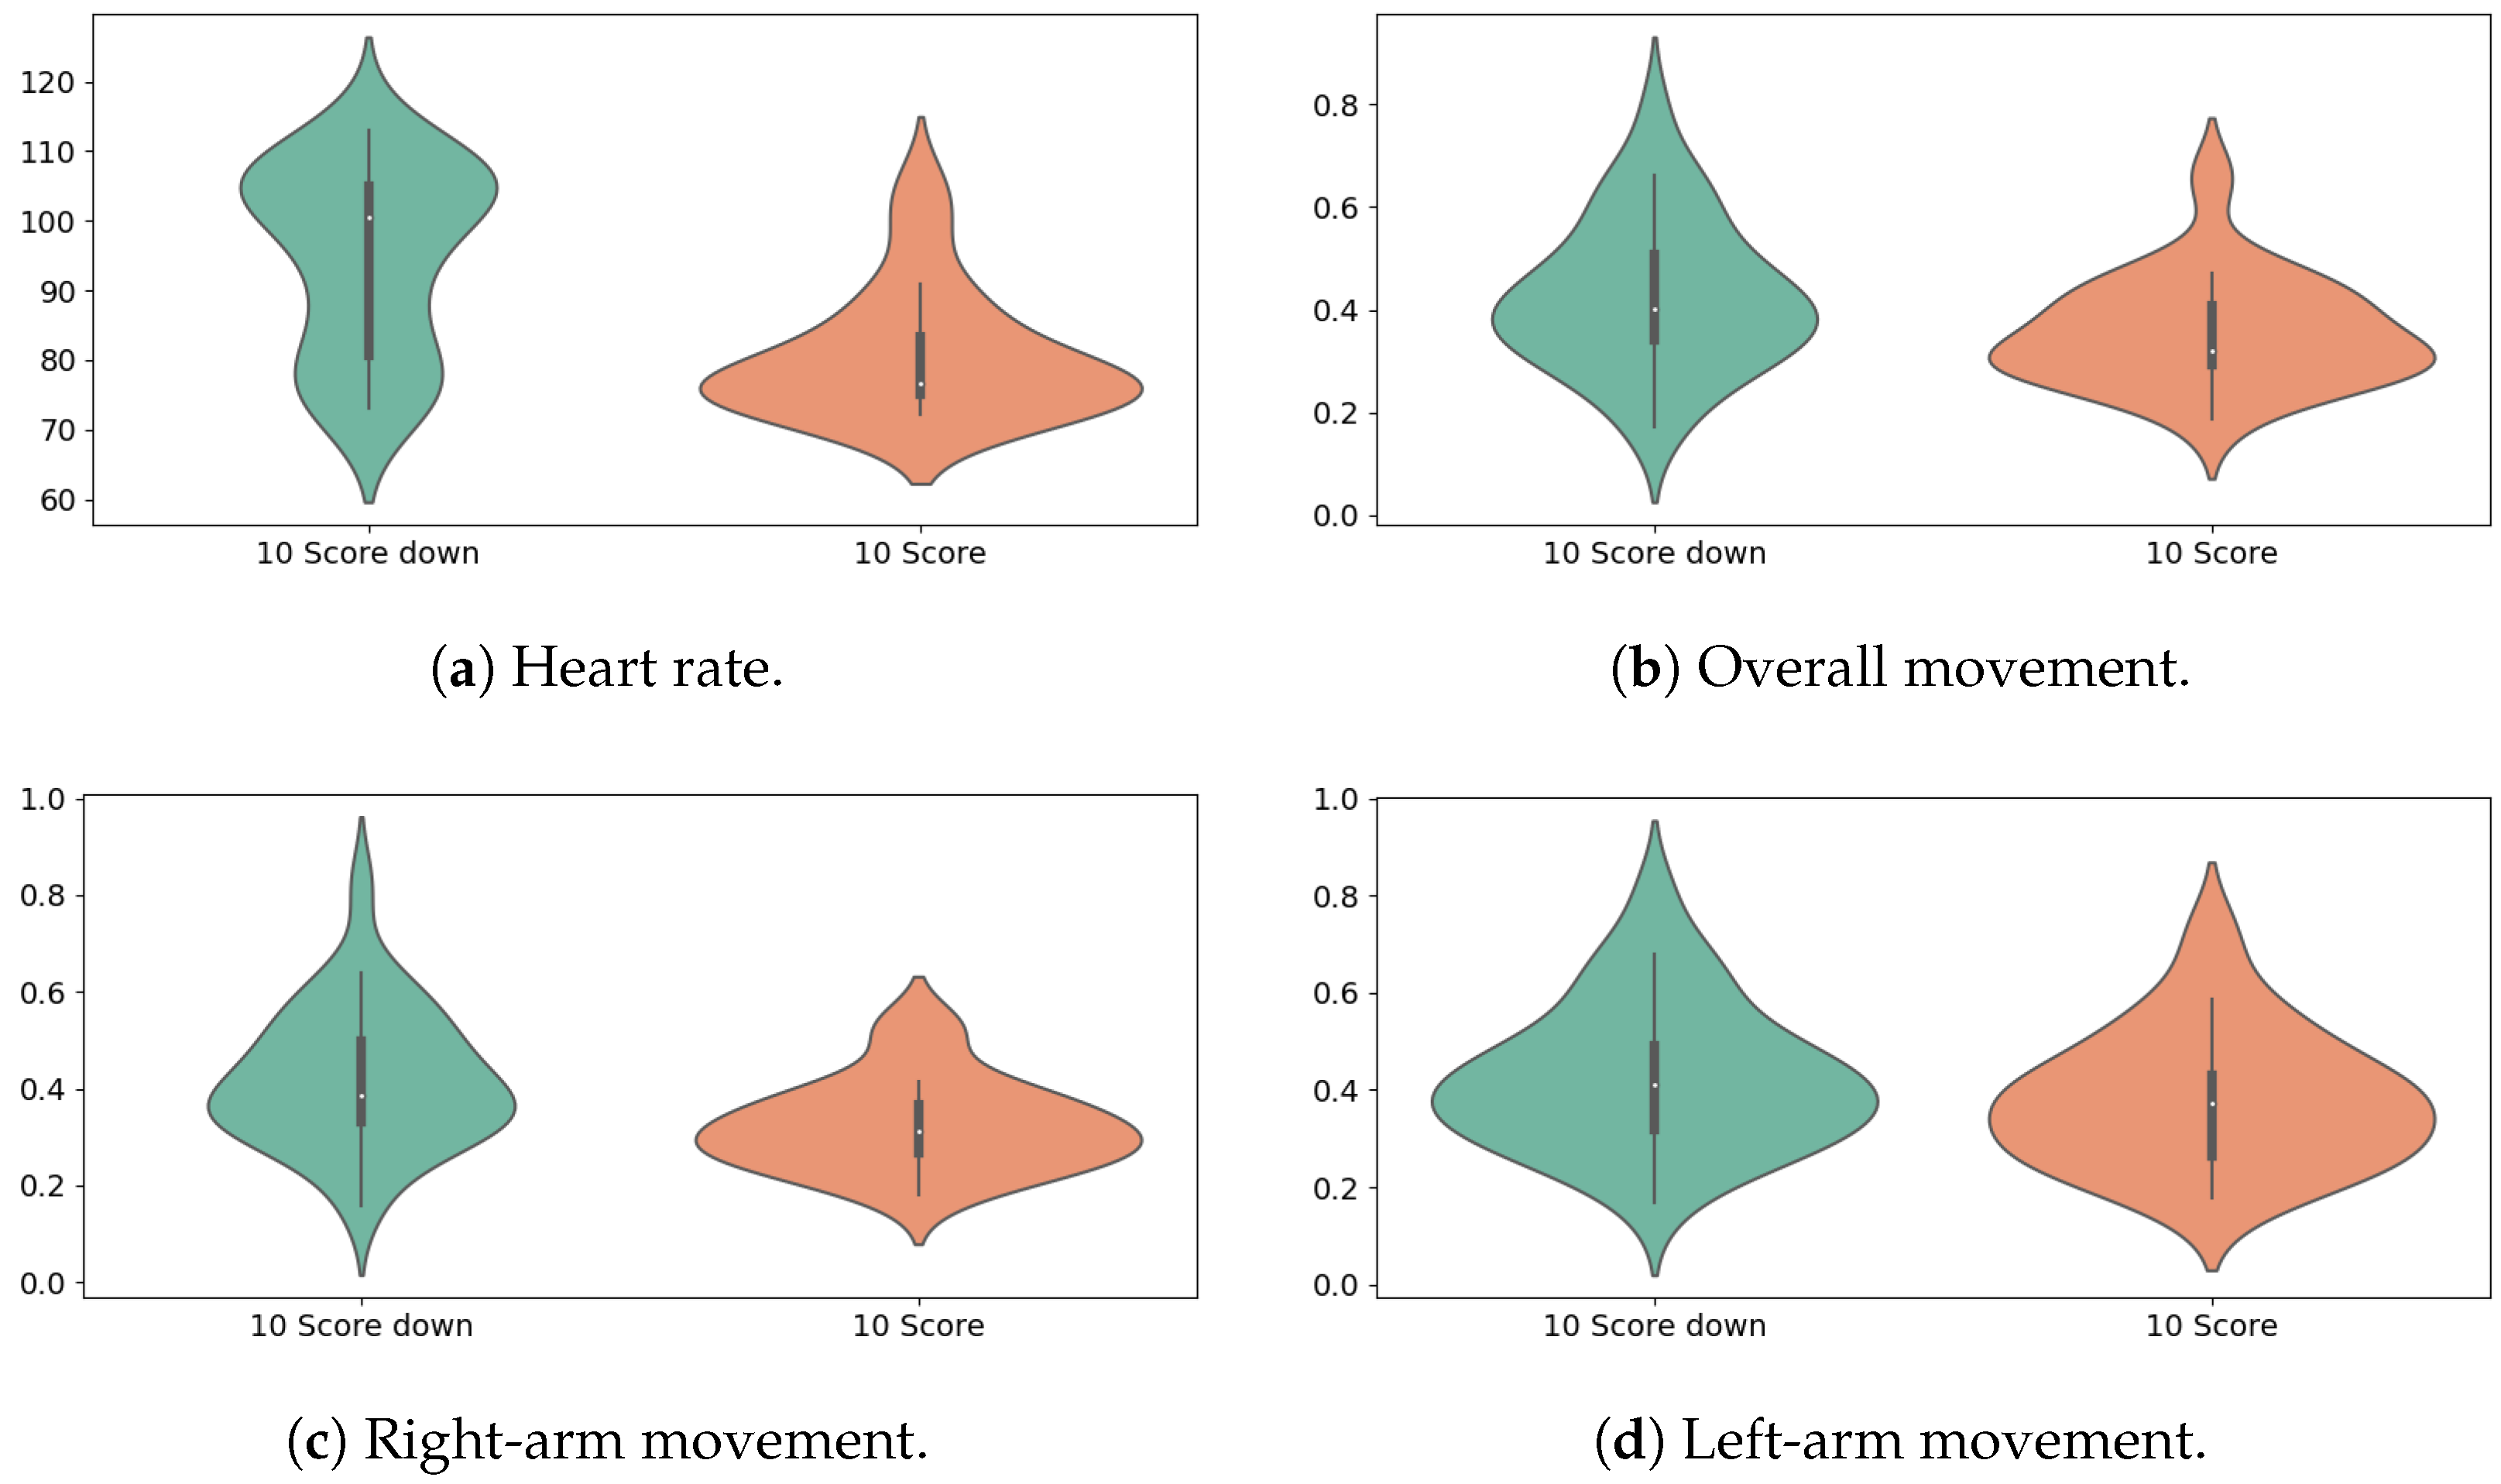
In addition to the statistical tests, graphical analyses were conducted to provide a more intuitive understanding of the differences between groups. Violin plots (
Figure 9) illustrate the distribution of heart rate and movement variables across the 10-point and non-10-point groups. Consistently with the statistical test results in
Table 5, the violin plots demonstrate that the 10-point group exhibited markedly lower heart rates and reduced right-arm movement, while distributions of total and left-arm movement showed considerable overlap between groups.
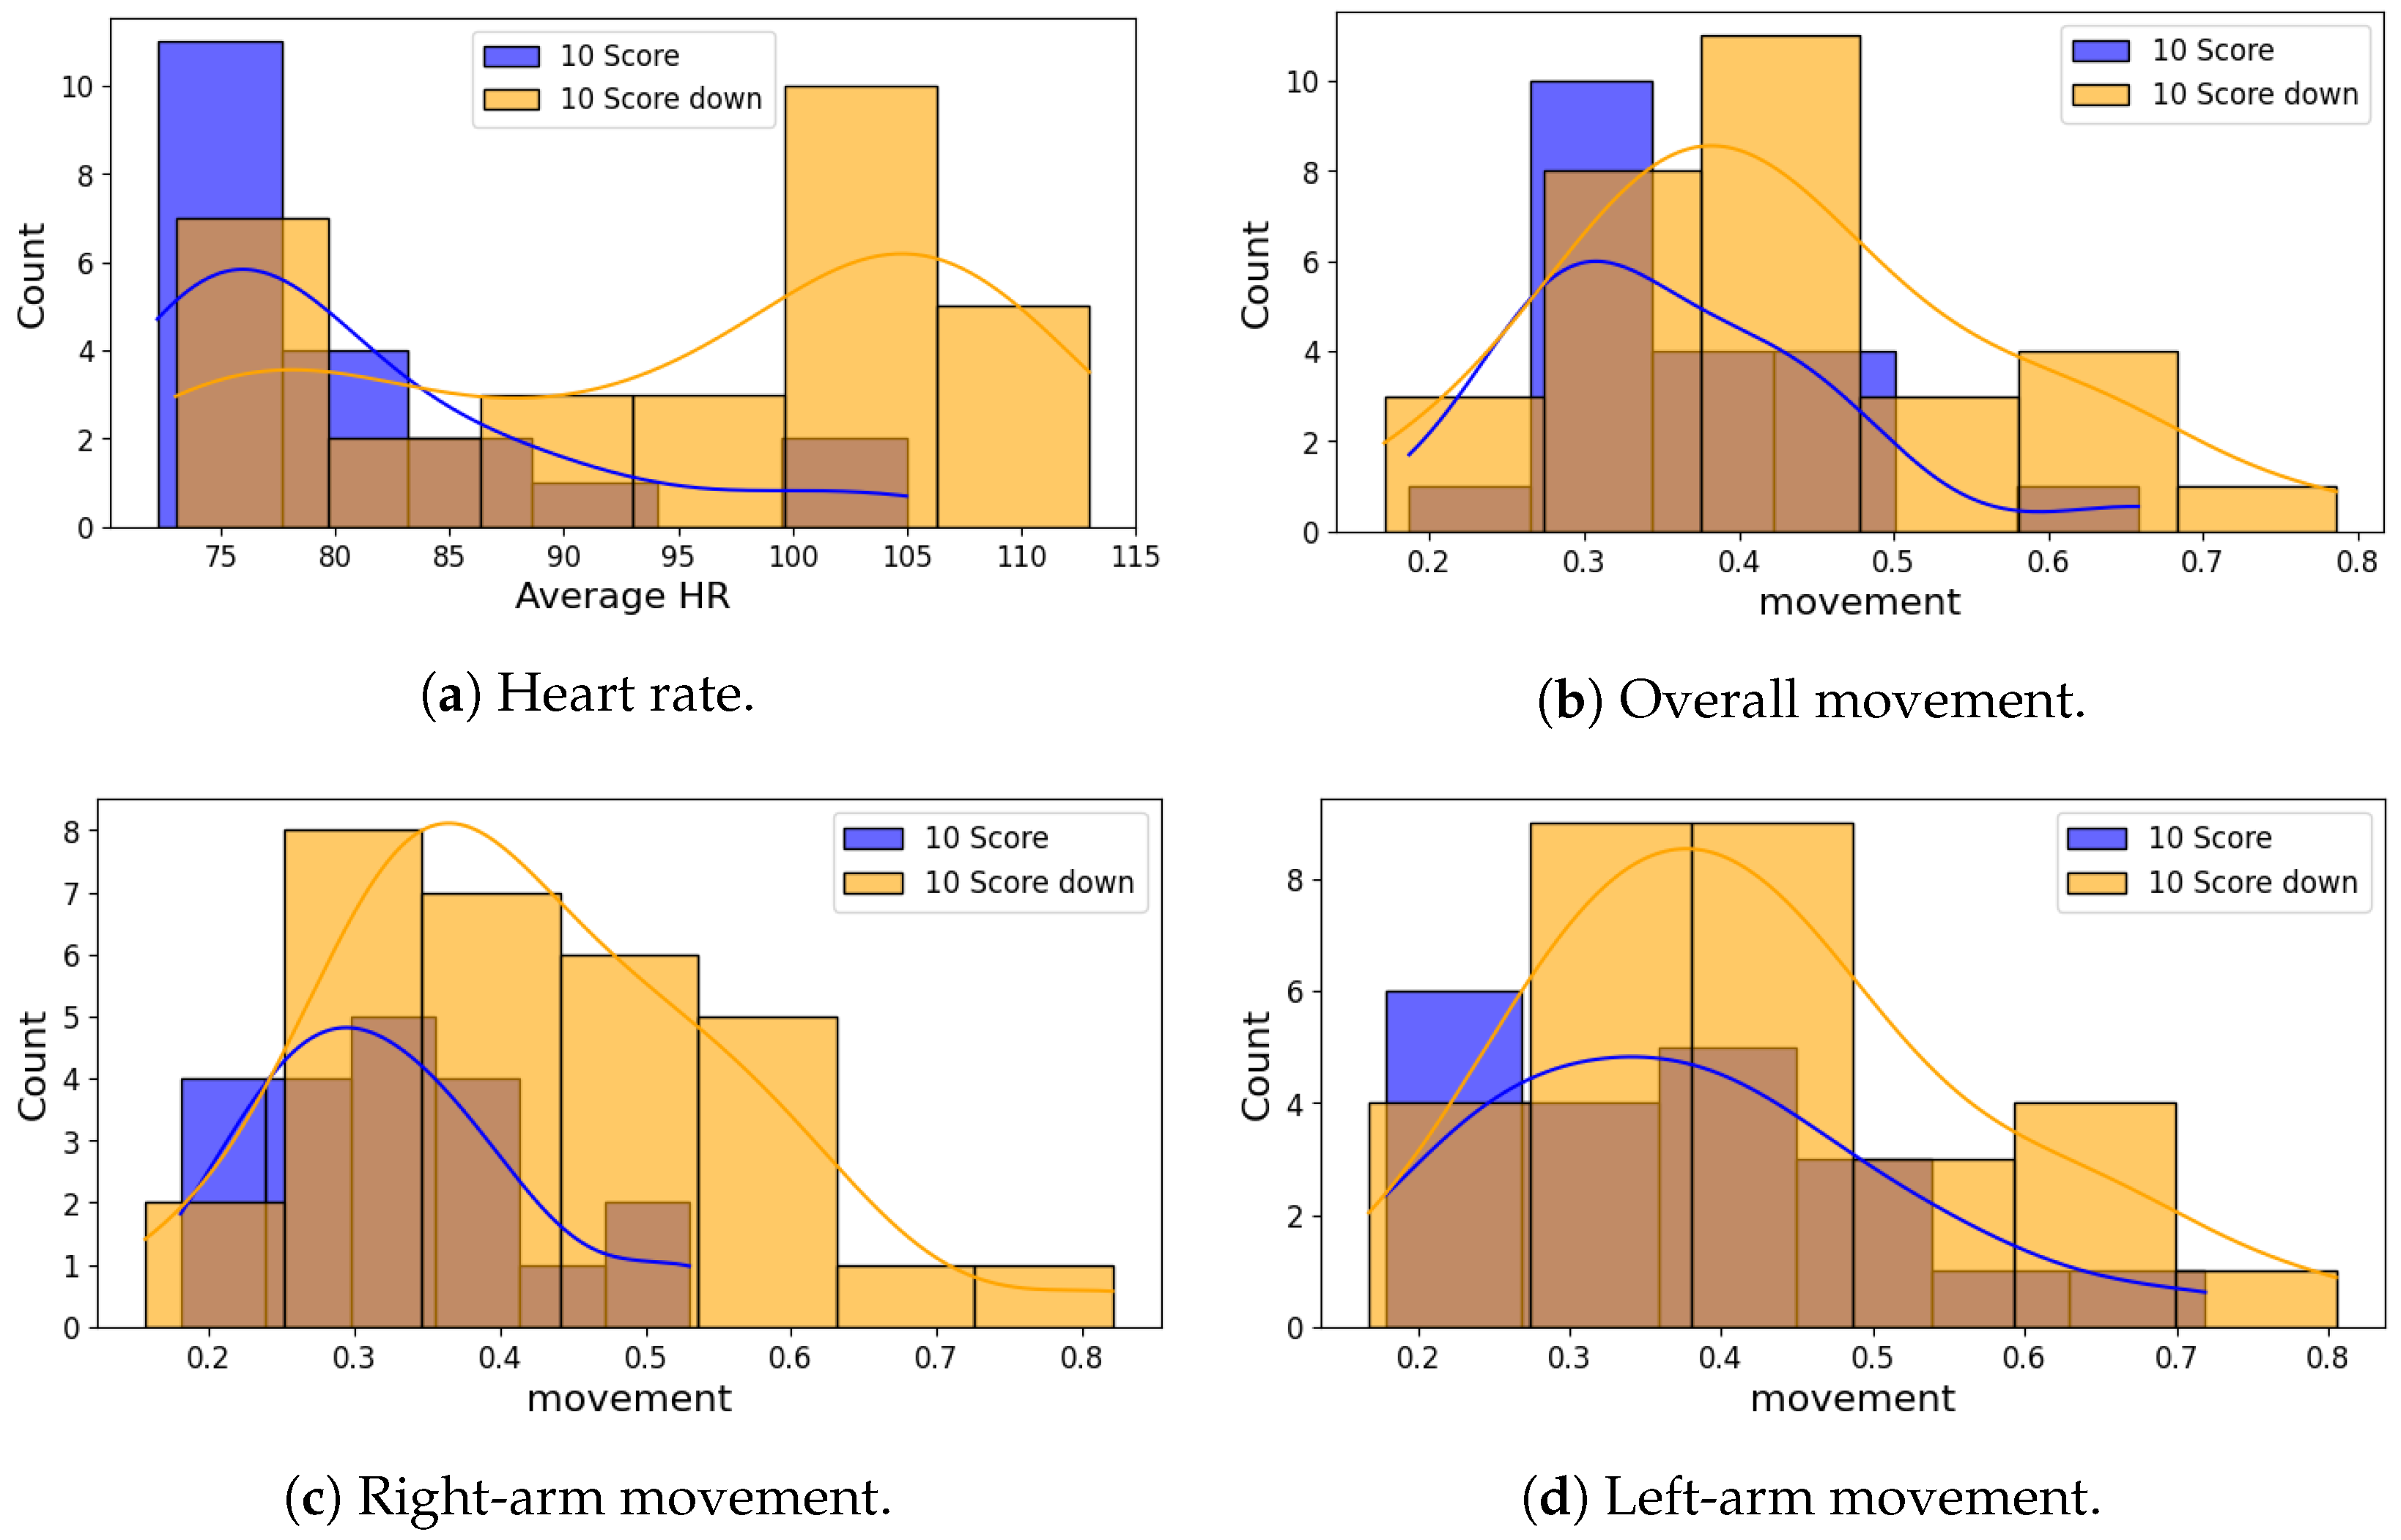
Histograms with kernel density estimation (
Figure 10) further highlight the differences in distribution. The heart rate distribution of the 10-point group was concentrated in the lower range (around 70–80 bpm), whereas the non-10-point group showed a broader distribution centered at higher values (90–110 bpm). A similar pattern was observed for right-arm movement, with the 10-point group clustered at lower values compared to the non-10-point group.
Finally, scatter plots (
Figure 11) depicting the joint relationship between heart rate and movement reveal that archers in the 10-point group are predominantly located in the lower-left quadrant, representing both lower heart rates and smaller movement values. This visualization supports the conclusion that reduced physiological arousal and motor instability are associated with higher performance in archery.
5. Discussion
This study provides important insights into how heart rate and movement variables influence archery performance. Multicollinearity evaluation confirmed that all VIF values were near 1, indicating low correlations among independent variables and no multicollinearity issues. This supports the reliability of the regression analysis and allows the independent effects of these variables on performance scores to be analyzed without redundancy.
These findings are consistent with Lu and Zhong [
4], who reported that lower heart rates predicted higher performance scores among Olympic-level archers. In contrast, Accardo et al. [
11] found no significant association between elevated heart rate and performance, suggesting that factors such as individual fitness or adaptation to pressure may moderate this relationship. Similarly, Keast et al. [
13] emphasized the role of postural sway in performance, but their reliance on contact-based sensors distinguishes their work from our contactless, video-based approach. By analyzing biometric data directly from real-world competition footage, our study offers an alternative methodology that complements and extends prior laboratory-based research. Correlation analyses further clarify these relationships. Pearson’s correlation revealed only weak linear associations between heart rate and movement variables, indicating limited predictive value. However, Spearman’s rank correlation identified a strong negative monotonic relationship between heart rate and performance scores, suggesting that elevated heart rate—often linked with tension or stress—may impair precision. This interpretation is consistent with prior studies highlighting the detrimental effects of heightened arousal on accuracy in precision-based sports. Finally, the increase in the second predictor’s
p-value when both variables were included in the regression model is best interpreted not as multicollinearity but as the result of larger standard errors caused by shared variance between predictors.
Ordinal regression analysis identified heart rate, total movement, and right-arm movement as significant predictors of performance scores. From a practical perspective, the regression coefficient for heart rate () indicates that a one-unit decrease in heart rate was associated with an increase of approximately 0.12 points in performance score. Similarly, the coefficient for right-arm movement () suggests that reducing tremor in the dominant arm by one unit could improve the score by more than six points. These effect sizes underscore the substantial influence of physiological and biomechanical control on archery outcomes, reinforcing their importance in athlete training and performance evaluation. In contrast, the non-significant coefficient for left-arm movement suggests its limited contribution to performance. Consistently with previous findings, movements of the non-dominant limb appear to play only a minor role in outcome variability, though further studies are needed to confirm this across different techniques and competition formats.
Group analysis further demonstrated that athletes scoring 10 points or higher exhibited significantly lower heart rates and reduced right-arm movement compared to those scoring below 10 points. Taken together, these findings underscore the critical role of physiological regulation and biomechanical precision in achieving elite performance. From both clinical and practical standpoints, they suggest that interventions targeting heart rate regulation—such as breathing techniques, meditation, and biofeedback—may directly enhance competitive outcomes by promoting physiological stability. Similarly, biomechanical training that reduces right-arm tremor can yield substantial performance gains. Notably, the adoption of non-contact, video-based monitoring enables such evaluations to be conducted seamlessly during both training and competition, without disrupting athlete performance. This approach paves the way for real-time, data-driven feedback systems that support individualized training strategies and optimize performance.
Importantly, this study not only validates the feasibility of non-contact physiological monitoring in real competitive settings but also demonstrates its practical applicability without interfering with athletes’ performance. By analyzing biometric data extracted from actual Olympic footage, the study overcomes the limitations of controlled laboratory environments and establishes a realistic, field-based evaluation framework. This approach holds strong potential for broader applications in other precision-demanding sports such as shooting and golf, where physiological stability and fine motor control are crucial. Ultimately, the proposed methodology offers a foundation for real-time, data-driven training strategies and performance optimization systems tailored to individual athletes.
The insignificant relationship for left-arm movement may indicate its lesser role in performance, though future research should investigate this across different techniques, competition formats, and experience levels. Real-time feedback systems, including wearable devices and motion capture technologies, could also enhance training by providing precise data for performance optimization.
Future research should investigate how heart rate and movement interact under varying conditions, such as elevated stress or environmental changes. Such analyses would offer deeper insights into the interplay between physiological and biomechanical factors, thereby broadening the understanding of archery performance. In addition, clarifying the neural and psychological mechanisms underlying heart rate regulation and movement stability may provide new directions for improving precision and consistency in archery.
6. Conclusions
This study analyzed the effects of heart rate and movement variables on archery performance using real-world data collected from actual competition footage. The findings highlight that heart rate and right arm movement significantly influence performance scores, with higher heart rates and excessive right arm movements being associated with lower scores. These results underline the critical importance of physiological stability and biomechanical precision for achieving success in precision-based sports like archery.
The multicollinearity analysis confirmed that the independent variables—heart rate, total movement, and right arm movement—could be analyzed independently without redundancy. Spearman’s rank correlation analysis showed a strong negative relationship between heart rate and performance scores, while ordinal regression analysis identified right arm movement as a key biomechanical factor affecting performance. Group analysis further revealed that athletes scoring 10 points or higher consistently exhibited lower heart rates and reduced right arm movements compared to those scoring below 10 points. This underscores the importance of physiological regulation and biomechanical precision in achieving elite performance.The results of this study support our hypothesis that elevated heart rate and excessive right-arm tremor negatively affect archery performance. These findings confirm that physiological stability and biomechanical control are critical determinants of success in precision-based sports.
This study also demonstrated the practicality of non-contact biometric data collection methods. By eliminating the need for intrusive equipment, this approach enables real-time monitoring and feedback during training and competition, overcoming the limitations of traditional contact-based methods.
Based on the statistical evidence, this study proposes heart rate and right-arm micro-movements as novel and objective indicators for athlete evaluation. These metrics provide quantifiable insight into an athlete’s physiological state and biomechanical control under pressure, making them suitable for integration into data-driven performance monitoring and personalized training systems.
The regression-based effect sizes also provide valuable insight into performance improvement strategies. Even small reductions in heart rate or right-arm tremor can yield measurable gains in scoring. These findings suggest that targeted physiological and biomechanical training may result in quantifiable performance benefits.
In conclusion, this research contributes to the growing field of sports science by providing empirical evidence on the relationship between heart rate, movement variables, and athletic performance. The findings not only inform tailored training programs in archery but also offer insights applicable to other precision-based sports. However, this study has several limitations, including the small sample size, variability in video quality, lack of athlete metadata, and influence of uncontrolled environmental factors, which should be addressed in future research. In particular, the imbalanced distribution of score categories (10 entries for 8 points, 20 for 9 points, and 20 for 10 points) introduces a moderate risk of selection bias, which may affect the representativeness and generalizability of the findings. Therefore, future studies should aim to include a larger and more balanced dataset. Furthermore, while this study does not involve direct clinical or training interventions, the proposed strategies may have indirect applications in athletic training. Pilot validation studies are recommended before large-scale implementation. Future studies should explore the interactions between physiological and biomechanical variables under diverse conditions and integrate advanced technologies to further enhance athletic success. Ultimately, this study fulfills its objective by demonstrating that heart rate and right-arm micro-movements are decisive factors in archery performance, validating the effectiveness of non-contact monitoring in real competitive settings.
