Abstract
While hierarchical subarray-based architectures are widely adopted for computational efficiency, the side effects of subarray management on the array factor and overall radiation behaviour remains insufficiently addressed. Array grid and perimeter misalignment with the subarrays can cause side effects such as increased sidelobe levels and distorted beam shapes. By implementing well-oriented, periodic subarray distributions, we show how one can achieve improved radiation performance, enhanced beam symmetry, and reduced sidelobe interference. We establish clear cause–effect relationships between subarray orientation, edge structure, and the resulting radiation patterns. Simulation results demonstrate that precise geometric alignment of subarrays leads to better energy concentration and consistent array factors. Our design approach is highly suitable for scalable, fully digital beamforming systems.
1. Introduction
Antenna arrays have become ubiquitous in modern wireless systems. Their topologies—such as linear, rectangular, triangular, and hexagonal—are extensively documented and analysed in the literature [1,2]. Alongside these structural configurations, beamforming techniques play a crucial role in shaping the radiation pattern of the array. Beamforming encompasses not only the directional steering of the main lobe, but also the adjustment of individual elements to synthesize desired radiation characteristics [3,4].
Although the experiments and conclusions of this paper can be extended for wideband systems, we focus on narrowband beam steering, where the required phase shift for each array element is governed by the standard expression
where k is the wavenumber, denotes the radio vector containing the coordinates of element n relative to the array centre, and û is the unit vector in the beam’s steering direction. Equation (1) establishes that, for arrays centred at the origin of the coordinate system, the phase shift required to steer the beam depends, among other factors, on the position of each element—specifically, its projection on the Z and Y planes relative to the array centre for a bidimensional array [5].
A widely recognized method to reduce the complexity of beamforming in large arrays comes from hierarchical subarrays [6]. This technique decomposes the total phase shift into two (or more) additive and subsequent stages. In the two-stage hierarchical model, the total phase shift for an element is obtained by summing (1) the phase shift corresponding to the element’s position relative to the centre of its subarray, and (2) the phase shift associated with the subarray centre relative to the global array centre. Specifically, if element n is in subarray s centred at , then
where û is the unit vector in the beam’s steering direction. The first term accounts for steering within the subarray, and the second term for steering the subarray as a whole [7]. By summing these contributions, one recovers the original full-array phase shift in Equation (1), while enabling a multi-stage beamforming architecture. At first glance, hierarchical beamforming may appear to offer no tangible benefit. However, by decomposing the global phase-shift calculation into two stages, it substantially lowers computational complexity and enables scalable weight computation—that is, the ability to maintain computational efficiency as the array size increases—an attribute that is especially valuable in large-scale or distributed antenna deployments [8].
Consider, for example, an array comprising 2002 elements partitioned into regular hexagonal subarrays of 7 elements each. This yields 286 subarrays in total. In the hierarchical scheme, one need only calculate the intra-subarray phase shifts for the seven positions within a single hexagon (a fixed set of seven values) plus the inter-subarray phase shifts for the 286 subarray centroids—293 computations in all. By contrast, a conventional (flat) beamforming approach requires 2002 unique phase-shift evaluations. Hence, hierarchical beamforming reduces the number of distinct phase calculations by 85%, dramatically improving computational efficiency without compromising beam-steering performance [9], as storage increases with the number of elements.
Despite these advantages, the influence of subarray geometry and orientation on the array factor with complex topologies—particularly in the context of increasingly prevalent fully digital antenna arrays—remains insufficiently explored in the literature [6,8,9]. While hierarchical beamforming offers clear computational benefits, its impact on key array performance metrics such as beamwidth, sidelobe levels, and steering accuracy can vary significantly depending on the spatial configuration of the subarrays [3,9]. This paper aims to address this gap by systematically investigating how different subarray topologies and orientations (but with the same geometry) affect the overall radiation characteristics, with a focus on their role within fully digital array architectures with a triangular grid, more precisely, with hexagons. Specifically, the main objectives of this work are as follows:
- To evaluate the impact of hierarchical digital beamforming on radiation performance by isolating and validating the phase decomposition process against traditional (non-hierarchical) implementations. We will focus on the array factor.
- To analyse how subarray orientation and perimeter alignment influence the array factor shape and orientation, identifying the origins of grating lobes and demonstrating how coherent geometric alignment enhances beam symmetry and sidelobe suppression.
- To propose and assess novel practical strategies for optimizing array manufacturability—such as subarrays geometries and selective element deactivation—while preserving the desired array factor characteristics in large-scale, fully digital architectures in economies of scale.
- To provide users with the code used in this paper, which is available in a public repository to ensure open access. Users will be able to download, test, and adapt the code freely, following a distribution model similar to platforms such as MathWorks 2025a.
The remainder of this paper is organized as follows. Section 2 discusses the subarray concept and the overall array structure. Section 3 introduces the hierarchical digital beamforming technique. Section 4 details the materials and methods used to evaluate the proposed array configuration. The experimental results are presented in Section 5. Our conclusions are summarized in Section 6.
2. Subarrays and Array Structure
Subarrays, as introduced in Section 1, have been extensively studied in the literature, particularly for phase shift decomposition across multiple stages [3,6]. They are commonly used in linear and rectangular array configurations due to the relative ease with which these topologies decompose into smaller subarrays [2,5]. However, applying a similar decomposition to arrays with a triangular grid presents significant challenges. Decomposition into smaller hexagonal subarrays is neither straightforward nor intuitive [9].
Despite the challenges, the adoption of hexagonal subarrays in hierarchical large-scale antenna arrays has become increasingly necessary. Traditional linear or rectangular subarrays are simpler to implement, but introduce limitations in spatial sampling efficiency and uniform coverage in the domain. Hexagonal subarrays offer denser and more uniform packing, improving angular resolution, reducing sidelobe levels, and offering higher degrees of freedom in direction-of-arrival estimation algorithms [10]. These advantages are particularly beneficial in hierarchical array structures, where scalability and consistent spatial frequency coverage are essential across multiple array levels. Hexagonal grids provide rotational symmetry and minimal baseline redundancy, making them well-suited for constructing virtual filled arrays from sparse configurations. For example, the use of hexagonal virtual subarrays in synthetic aperture interferometric radiometry systems significantly enhances the performance of covariance matrix-based algorithms, such as MUSIC. These achieve superior performance in radio frequency interference localization accuracy and spatial resolution without physical hardware expansion [11]. Adopting hexagonal subarray configurations for next-generation large-scale and hierarchical antenna systems is not only advantageous but increasingly imperative.
When maintaining the orientation of the triangular grid is mandatory, it becomes impossible to simultaneously preserve both the original orientation and the perimeter of the overall array. To address this limitation, we propose a novel solution in Figure 1 based on Equation (3), where a specific hexagonal array (Figure 1a) is restructured into a (Figure 1b) quasi-hexagonal array composed of hexagonal subarrays, each containing seven elements. This transformation allows us to retain the desired orientation while offering a practical compromise on the global structure.
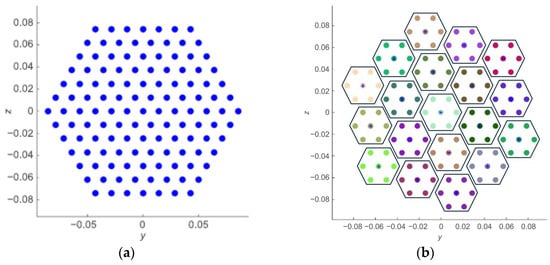
Figure 1.
(a) Hexagonal array; (b) hexagonal distribution of hexagonal subarrays preserving the same grid orientation but not the perimeter (note that the perimeter elements are not on a straight line). Elements are spaced λ/2 for λ = 0.033 m for this and all the following arrays. Dors are coloured to identify subarrays by simple inspection.
In this transformation, the orientation of the triangular grid is retained, ensuring that each hexagonal subarray aligns with the primitive orientation of the original array. However, the global structure of the array undergoes a clockwise rotation, denoted by , which depends on N, the number of elements along the edge of the subarray:
The purpose of this equation is to quantify the geometric rotation that appears when tiling identical hexagonal subarrays to form a larger quasi-hexagonal array on top of the underlying triangular lattice. The key ideas are as follows:
- In a pure triangular grid, every hexagonal subarray inherits the primitive 60° symmetry of the lattice. However, when we arrange multiple such subarrays to cover a large aperture, the perimeter of the resulting global array cannot simultaneously preserve both the triangular grid orientation and the global hexagonal outline.
- Equation (3) is derived from the slope of the perimeter edge line formed when the hexagonal subarrays are aligned along one side. The tangent term comes from the ratio between the number of vertical steps imposed by the triangular lattice and the number of horizontal steps, which is proportional to .
- The subtraction from 30° arises because in an ideal hexagon, the edge is tilted at 30° with respect to the horizontal axis. However, when the array is discretized into subarrays, the actual slope deviates slightly. Equation (3) compensates for this deviation by providing the correction angle.
- In practice, this rotation manifests as a slight clockwise rotation of the overall array aperture, depending on whether one prioritizes preserving the triangular grid orientation or the global perimeter. This, in turn, rotates the array factor pattern and can introduce spurious grating lobes, if uncorrected.
Thus, Equation (3) gives a simple closed-form expression for the angular correction needed to reconcile subarray orientation with the global array perimeter.
As an example, for the seven-element subarray in Figure 1, . Following Equation (3), larger subarrays necessitate a greater rotational adjustment to accommodate the subarrays within the overall quasi-hexagonal structure. Alternatively, if preserving the orientation of the overall array is prioritized, one must introduce a counterclockwise rotation to the triangular grid. In this scenario, each subarray—and the triangular grid—is rotated by an angle of , resulting in the same rotation of the array factor (AF). Henceforth, the analysis will be confined exclusively to the AF, with all subsequent experiments conducted using the previously defined structure and governing equation.
In Equation (3) we present a general formulation that applies to all possible sizes of hexagonal subarrays, where the variable N denotes the number of elements along the edge of the subarray. Although in most of our experiments, we adopt the case N = 2 (corresponding to a seven-element subarray), this choice is motivated by practical considerations that are further illustrated in the later experiments of the paper. Importantly, the approach is not restricted to 7-element subarrays, and larger configurations (e.g., 19 or 37 elements) are equally supported by the method, with their specific effects on performance analysed in Section 5D.
3. Hierarchical Digital Beamforming
We introduce the framework of hierarchical digital beamforming (DBF) [3,6]. Traditionally, the implementation of digital beamforming systems employing physical subarrays was constrained by the limitations of digital and computational processing technologies [1,2]. In such configurations, DBF was typically implemented through serial processing architectures. Each subarray independently processed its internal antenna coefficients, as well as the coefficients associated with its relative position within the larger array. However, all output data from the subarrays had to be transmitted via a serial bus to a central onboard processor. This single-layer architecture, illustrated in Figure 2a, resulted in a rigid and computationally inefficient system. The final beamforming coefficients could only be determined after the complete transmission and aggregation of data, thereby introducing latency and limiting flexibility [12].
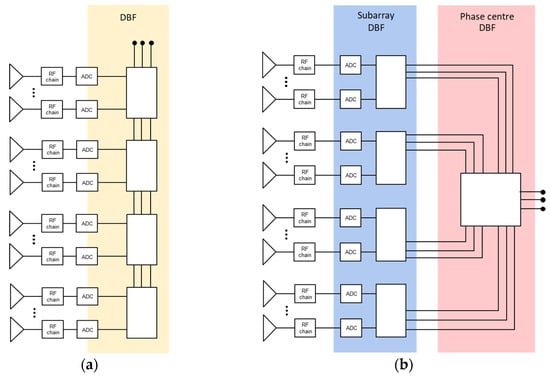
Figure 2.
(a) Serial (non-hierarchical) AESA structure for an antenna array; (b) hierarchical structure for a digital AESA subarray-based antenna array including parallel processing.
Recent advancements in digital processing technologies have enabled the development of more sophisticated and efficient hierarchical DBF architectures [6,9]. These novel approaches provide enhanced flexibility and significantly improved processing speed. In hierarchical DBF, the first processing layer is responsible for computing the internal coefficients of each subarray. The second layer focuses on phase and amplitude corrections across subarrays, leveraging the hierarchical structure to decompose total phase delays into contributions from individual antenna elements and the geometric centre of each subarray [3,9].
One of the key advantages of hierarchical architectures is their scalability and adaptability. They support the implementation of multiple processing stages, allowing arrays to be organized into clusters of subarrays. Moreover, these architectures can incorporate parallel processing units at the second layer, enabling simultaneous handling of different signal paths within the same subarray. This is particularly beneficial in multibeam systems, as it eliminates the need to physically partition antenna elements for separate beams, thereby maximizing array utilization and performance [6,8]. In Figure 2, we depict (a) traditional digital beamforming (DBF), and (b) hierarchical DBF.
An initial step in validating the hierarchical structure involves obtaining the array factor using both the serial and hierarchical methods, followed by a comparative analysis of the resulting differences considering the physical constrains. As illustrated in Figure 3(a1), and corresponding to the configuration presented in Figure 1, the plot depicts the array factor of a conventional hexagonal array. Conversely, the Figure 3(b1) plot presents the array factor of a hexagonal array composed of hexagonal subarrays, wherein the orientation of the underlying triangular lattice is preserved. Figure 3(c1) depicts the absolute value of the difference between both cases.
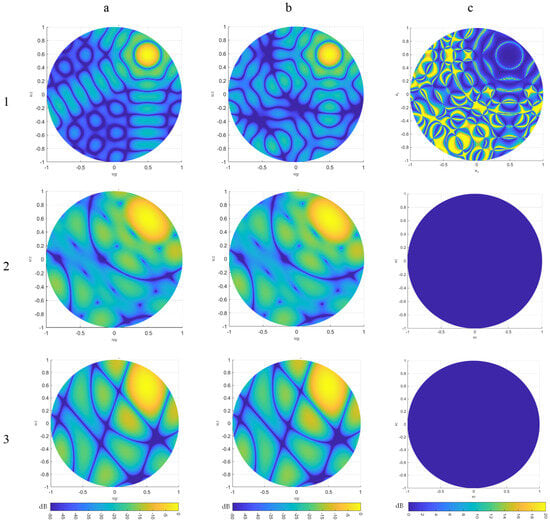
Figure 3.
Array factor computed for the different configurations in columns (a1–b3), and their differences in column (c1–c3) for the setup in experiment A. For each of them, we include the original (a) and corrected (b) array form factors, and the differences between the two (c).
The outcome of this preliminary validation, which motivates the present study, indicates that certain factors have not been adequately considered In our own research project, we encountered this phenomenon and found ourselves compelled to invest considerable time and resources to its explanation. No previous studies have addressed this issue, and it is our intention to fill this gap by providing a clear and comprehensive analysis. Through this article, we aim to offer a prompt explanation and practical guidance for future cases, enabling those affected to quickly understand and effectively resolve the hierarchization problem with triangular grid arrays, and more precisely, hexagonal subarrays. At first glance, it is not possible to conclusively determine whether the observed discrepancies originate from the hierarchical process itself due to the subarrays’ structure. Notably, the presence of apparent grating lobes (at the (uz, uy) positions: (−0.2, 0.5), (0.2,− 0.25), and (−0.75, −0.25)) in Figure 3(b1) suggests a potential influence of the subarray configuration, implying that the hierarchical processing and the decomposition of phase delays may not be functioning as expected under our understanding of the theoretical framework. Furthermore, given that the overall array configuration underwent a rotation of degrees, a corresponding rotation in the array factor was anticipated. However, the project results that were obtained did not demonstrate this expected rotation; in fact, no rotation was observed in the array factor. These unexpected results led us to study this phenomenon, and we share our conclusions in this paper.
Hereafter, we present a series of experiments, aimed first at qualifying the impact of the hierarchical processing and/or the subarray structure on the array factor, and second at characterizing the nature and extent of such effects.
4. Materials and Methods
To validate the performance and scalability of the proposed antenna subarrays, a series of simulations were conducted across multiple topologies. Unless otherwise stated, the configurations assessed comprised 169 hexagonal subarrays, for a total of 1183 antenna elements. In all array configurations, the elements are uniformly spaced at half the wavelength (λ/2), where λ = 0.033 m, corresponding to an operating frequency of 9 GHz. This frequency is commonly adopted in array antenna design for radar systems.
The design and simulation workflow were implemented using MATLAB 2025a, which facilitated the geometric construction of the subarray-based structure and the precise positioning of array elements. The array factor was computed based on the relative positions of the antenna elements, incorporating both the phase delay associated with the phase centre of the parent hexagonal subarray and the individual phase contributions from each antenna within the subarray.
To assess the influence of subarray geometry and orientation on overall array factor, and therefore, array performance, various activation patterns of subarrays were evaluated. These experiments were designed to analyse the sensitivity of the array factor to changes in spatial configuration and orientation, thereby providing insights into the role of physical layout in beamforming performance and radiation characteristics.
5. Experiments
Our five experiments evaluate the array factor form for diverse antenna array configurations to quantify the impact of the hierarchical processing and/or the subarray structure, i.e., in (A), the impact of hierarchical digital processing; in (B), the impact of mismatches among manufactured subarrays; in (C), the orientation of the subarrays relative to that of the overall array; in (D), the effect of subarray element count on array performance. Finally, in (E), we address resource optimization in the manufacturing process.
- A.
- Impact of Hierarchical Processing
The primary objective of this initial experiment is to evaluate the impact of hierarchical digital processing on the array factor. To isolate the effects of hierarchical processing from those arising due to the subarray configuration, we used an irregular array composed of hexagonal subarrays.
This approach ensures that the serial (non-hierarchical) and hierarchical simulations utilize identical elements positioned equivalently, thereby eliminating discrepancies attributable to the physical subarray structure. Any observed differences can be attributed solely to the hierarchical digital beamforming processing.
The first topology chosen for this experiment is illustrated in Figure 4. The distinct colour-coded hexagons emphasize the individual subarrays, which are not overlapped. In the serial processing scheme, the entire array is processed as a single entity, represented in Figure 3, column (b). In contrast, the hierarchical processing method decomposes the phase delay, represented in Figure 3, column (a), first, at the level of the subarray elements, and second, at the level of the subarray centres, enabling beam steering accordingly. In other words, we are validating the theoretical equations for the phase delay split in two stages for the hierarchical processing structure by looking for differences in the array factor, represented in Figure 3, column (c).
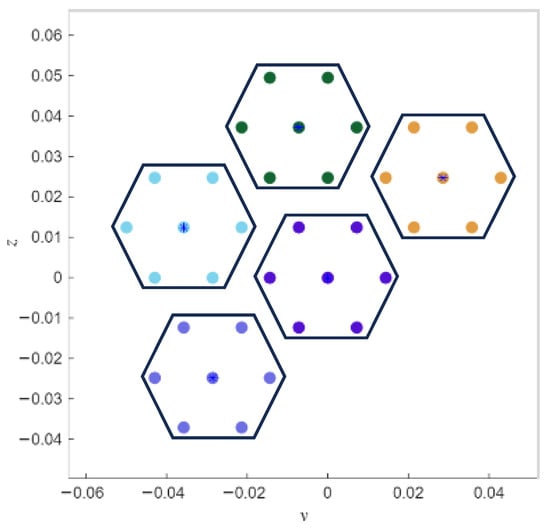
Figure 4.
Topology for the first experiment. The hexagonal subarrays are shown in groups of different colours, delimited with lines. The hierarchical and the non-hierarchical simulation addresses the illustrated positions for the array antennas.
The computed array factor from the simulation results for this initial experiment, presented in Figure 3 row 2, support the hypothesis that the theoretical foundation of hierarchical digital beamforming is valid. Both the hierarchical (Figure 3(a2)) and non-hierarchical, or serial (Figure 3(b2)) array factor simulations exhibit consistent behaviour in terms of beam steering direction, null positions, array orientation (no rotation observed), and sidelobe levels, with negligible numerical deviations. Figure 3(c2) depicts the absolute value of the difference between both former cases, which is negligible. Although the array factors appear nearly identical, the selected configuration does not provide an optimal scenario for a detailed comparative analysis. Therefore, a more representative and pronounced test case is required to perform a more rigorous evaluation.
Following multiple trials involving variations in the number, orientation, and positions of the subarrays, the configuration illustrated in Figure 5 was identified as the optimal array structure for this experiment. The array comprises four hexagonal subarrays (non-overlapped) arranged in a quasi-rhombic formation (dashed line), providing a clearer distinction in the resulting array factor for comparative analysis.
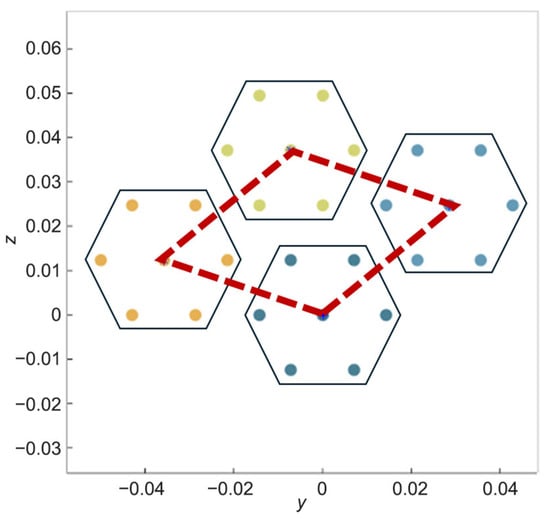
Figure 5.
Topology for the second experiment. The hexagonal subarrays are shown in groups of different colours. Both the hierarchical and the non-hierarchical simulations consider the illustrated positions for the array antennas. The dashed red line represents the quasi-rhombic formation of the subarrays.
This configuration induces a rhombic array factor characterized by well-defined, parallel null lines, which results in multiple regions with theoretically infinite attenuation (i.e., nulls of −∞ dB), many more than in the previous case. This makes it an optimal structure to validate, as any potential differences introduced by the hierarchical processing could be more easily detected. Specifically, if at a given point the conventional structure yields a null (−∞ dB), but the hierarchical implementation results in a very large but finite negative value, the difference would theoretically approach +∞ dB. Consequently, discrepancies would manifest more clearly and are expected to occur with higher probability in this scenario than in the previous example, which featured only a circular null region. This serves as an additional validation step and a double-check of our theoretical assumptions. As shown in Figure 3, row 3, the alignment and structure of these nulls (darker), with the sidelobes, allow for precise confirmation that both array factor results—hierarchical (Figure 3(a3)) and non-hierarchical (Figure 3(b3))—are identical in shape, orientation, and magnitude. Indeed, the sum of the differences between both diagrams is again negligible (Figure 3(c3)).
These results confirm that the hierarchical decomposition of the phase delay for digital beam steering introduces no distortion or deviation in the array factor pattern, in agreement with theoretical expectations, and thereby, the discrepancies (Figure 3(c1)) are attributable exclusively to the physical subarray structure discrepancies (Figure 1).
- B.
- Impact of Mismatches Among Manufactured Subarrays
In the context of hierarchical digital beamforming, where subarrays serve as fundamental building blocks of the overall array architecture, calibration is essential. It ensures optimal radiation performance and mitigates the adverse effects of amplitude and phase errors introduced during the manufacturing process—apart from those observed in column (a)—that are not considered in this experiment.
In large-scale digital phased array systems, manufacturing imperfections can introduce mismatches among subarrays. These discrepancies arise from variations in component characteristics and assembly tolerances, among other factors, leading to deviations in the beamforming performance. Such mismatches are especially expected in mass production scenarios, where economies of scale necessitate the fabrication of numerous subarrays. Recent studies have highlighted the significance of these imperfections. For instance, phase imbalances in active antennas could degrade beam steering capabilities, emphasizing the need for self-calibrating circuits to mitigate such effects as those in reference [13], where the focus is on wideband phased array feed design for radio astronomy. Similarly, gain-phase error pre-calibration methods for uniform linear arrays have been proposed, addressing the challenges posed by random gain-phase errors in large-scale arrays similar to those addressed in reference [14], but with the difference that hierarchical arrays require two-stage calibration strategies.
To assess the impact of these mismatches, we simulate the array factor, incorporating random amplitude and phase errors among subarrays. In our model, each subarray is assumed to exhibit ideal internal calibration, ensuring uniformity among its constituent elements. Discrepancies are introduced between subarrays. The chosen error ranges for amplitude and phase deviations reflect typical manufacturing tolerances and practical uncertainties observed in large-scale antenna array fabrication and calibration processes in line with reference [15], which highlights manufacturing and calibration challenges in massive MIMO; our Section 5E translates these into design rules for economies-of-scale production using identical hexagonal subarrays.
Amplitude deviations within ±15% and phase errors up to ±10% represent a standard worst-case scenario, accounting for component mismatches, imperfect element excitations, and variability in RF front-end hardware. Conversely, the best-case values—amplitude ±5% and phase ±2.5%—correspond to high-precision calibration and manufacturing standards achievable with advanced fabrication techniques and rigorous quality control. The simulated array factors in Figure 6(a1,b1) reveal noticeable deviations and distortions when compared, underscoring the critical impact of inter-subarray mismatches. Figure 6(c1) depicts the absolute value of the difference between both.
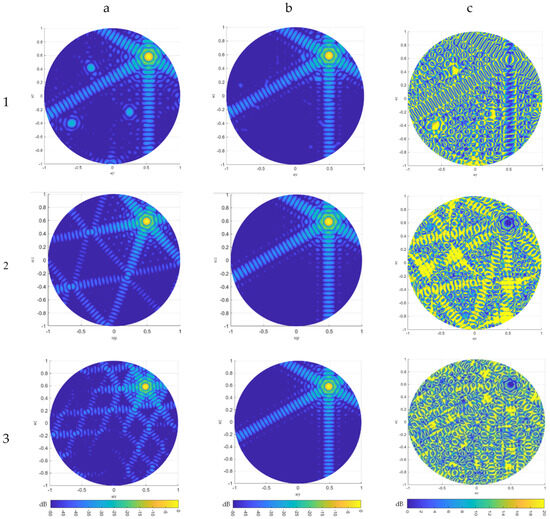
Figure 6.
Array factors and its differences (per row) for experiments B, C, and D. For each of them, we include the original (a1–a3) and corrected (b1–b3) array form factors, and the differences between the two (c1–c3).
The experiment allows a comprehensive evaluation of array performance under varying levels of hardware imperfections. This approach aligns with methodologies employed in recent calibration studies; as reference [16] proposes autocorrelation-based calibration, our work is complementary by showing that layout-level fixes (orientation and perimeter alignment) can reduce the calibration burden in hierarchical subarray arrays. These results highlight the necessity of implementing a calibration process tailored to the actual characteristics of the fabricated subarrays, but now considering two stages: first, among the elements of the subarray, and second, among the subarrays.
- C.
- Subarray Orientation Relative to Array
Having ruled out the hypothesis that hierarchical digital processing introduces distortion in the array factor, the analysis can now focus exclusively on the effects associated with the physical orientation and geometry of the subarrays.
To study the effects related solely to the orientation and geometry of the subarrays, we design an array consisting of 1183 elements, arranged into 169 hexagonal subarrays, each composed of 7 elements. Both the triangular lattice and the hexagonal subarrays are aligned with the coordinate axes, resulting—as in previous cases—in an overall array rotation of degrees. The subarrays never overlap.
From the solution, extracted through a series of iterative trials exploring different configurations, we conclude that the most suitable approach involves defining a perfect hexagonal array within the original quasi-hexagonal array formed by the subarrays. This concept is illustrated in Figure 7, column (a). In Figure 7(a1), the colour-coded dots represent the full quasi-hexagonal array comprising all subarrays. In Figure 7(a2), the elements, colour-coded by subarray, are the deactivated (turned-off) elements—those excluded to achieve the final regular hexagonal array configuration. Those turned-on are the elements inside the hexagon (in white).
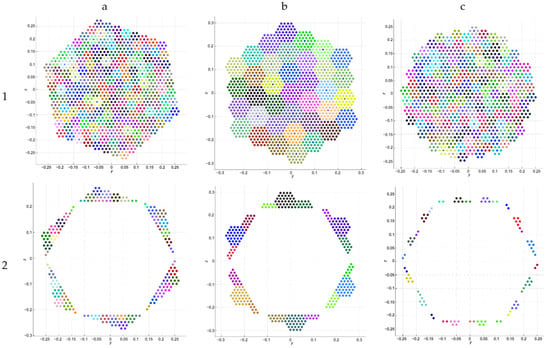
Figure 7.
Topologies for the experiments C, D, and E (in columns). Full manufactured array in row 1; deactivated (but manufactured) elements in row 2. For each of them, we include the 7-elements (a1,a2) and 37-elements (b1,b2) array form factors, and the optimized array (c1,c2). The dots correspond to elements of the array, colours represent the different subarrays.
In both structures, we can compute the array factors to highlight the impact of subarray orientation. In Figure 6(a2), the presence of grating lobes in the quasi-hexagonal configuration arises from the angular misalignment between the subarray lattice and the overall array geometry (from structure in Figure 7(a1)). In contrast, the refined hexagonal configuration in Figure 6(b2), exhibits coherent alignment across the array hierarchy. This effect demonstrates significantly improved compliance with the beamforming mask and enhanced suppression of unwanted angular components (from structure in Figure 7(a2)). Figure 6(c2) depicts the absolute value of the difference between both former cases. In some regions, values exceed 20 dB.
To rigorously assess beamforming performance across array configurations, we introduce an angular beamforming mask. This describes the desired high-gain angular sectors (e.g., main lobes) and regions where gain must be minimized (e.g., sidelobes or interference directions). The mask serves as a reference to evaluate the actual array factor. In our case, all undesired regions must remain below −50 dB (see Figure 6(b2)), regions in dark blue), a mask with which Figure 6(a2) does not comply, resulting in the error in Figure 6(c2). From the analysis of the results in Figure 6, the following conclusions can be drawn:
- Array factor orientation in large-scale arrays: For large-scale antenna arrays, the orientation of the array factor—understood as the rotation of the sidelobe structure (i.e., how the sidelobe lines are rotated clockwise)—is primarily determined by the physical perimeter’s orientation. This behaviour contrasts with that observed in smaller arrays, such as the one in Figure 1. There, the array factor orientation is more closely linked to the internal triangular lattice and subarray alignment. In the case of large arrays, such as those shown in Figure 7(a1,a2), the array factor consistently aligns with the geometric boundary of the overall array.
- Origin of grating lobes: The grating lobes observed in the quasi-hexagonal array (Figure 6(a2)) can be attributed to the misalignment between the orientation of the subarrays and that of the array’s perimeter. The rotational discrepancy between the global array layout and the internal subarray/lattice orientation introduces spatial aliasing, resulting in grating lobes. Unlike other configurations, the refined hexagonal layout (Figure 7(a2))—precisely aligned with both the lattice and subarrays—completely suppresses grating lobes, demonstrating the effectiveness of structural alignment in mitigating unwanted radiation (Figure 6(b2)).
In summary, these experiments clarify the sources of the previously observed anomalies. Both the effects of subarray orientation and geometry have been thoroughly analysed and explained, resolving the uncertainties that initially motivated this paper. But this is not enough, as this is the most basic case, and the real-world systems are more complex, systems that will be analysed in the following cases D and E.
- D.
- Effect of Subarray Element Count on Array Performance
As discussed in Section 2 and in accordance with Equation (3), the number of elements per subarray plays a key role in determining the rotational properties introduced to the overall array configuration. In the case of large antenna arrays, our analysis and simulations have demonstrated that the orientation of the overall array factor aligns with the physical orientation of the full array structure. Conversely, for smaller arrays, the orientation of the lattice and the subarrays themselves should predominantly govern the steering of the resulting array factor. We also observed that in large arrays, the elements’ position near the perimeter result in significant distortions in the array factor diagram. These distortions, as we explain in this experiment, result in more dense patterns (regarding the grating lobes regions) when the number of elements per subarray increases.
Figure 7(b1) presents a quasi-hexagonal array composed of hexagonal subarrays, each containing 37 elements and colour-coded for clarity, for a total of 1369 elements. Despite the increased edge irregularities introduced by larger subarrays, and as in former examples, it is still feasible to digitally deactivate specific elements at the perimeter (Figure 7(b2)). Given the digital nature of this control, such adjustments are straightforward to implement, but the portion of turned-off elements increases by 25% (in case C, it was 22.3%).
Regarding the simulations, as subarrays grow in size, the outer edge of the array becomes less regular and more discontinuous (Figure 7(b1)), which contributes to variations in the array factor, illustrated in Figure 6(a3). More grating lobes appear in comparison with Figure 6(a2), which corresponds to the corrected array. Figure 6(c3) depicts the absolute value of the difference between Figure 6(a3) and Figure 6(b3). One easily realizes that the higher density of grating lobes (compared to Figure 6(a2)), the smaller the errors.
To clarify, the seven-element hexagonal subarray was chosen as the simplest non-trivial configuration that preserves triangular-lattice symmetry while minimizing turned-off edge elements. It provides a practical balance between structural regularity and manufacturing feasibility. Larger subarrays were analysed, and they introduce greater edge irregularities, a higher fraction of turned-off elements, and more grating lobes. Thus, while not universally optimal, the seven-element structure is an efficient and practical baseline.
- E.
- Resource Optimization in the Manufacturing Process
Finally, regarding the economies of scale of the real-world, resource optimization exhibits significant industrially relevant utilization in the manufacturing of large-scale antenna arrays. We focus only on arrays composed of identical hexagonal subarrays, as examined in the preceding experiments.
Achieving the desired, ideal array factor in Figure 6(b2) requires the deactivation of approximately 22.3% of the antenna elements. Analysis of the inactive elements, as shown in Figure 7(a2), indicates that a subset of seven-element hexagonal subarrays—specifically those located along the perimeter of the array (4 subarrays per side, totalling 24)—are entirely deactivated.
Based on this observation, we propose that these fully inactive subarrays be excluded from the manufacturing process, thereby avoiding the production and installation of unnecessary components and reducing costs. This approach reduces the proportion of inactive elements from 22.3% to 8.1%, the latter corresponding to elements within partially active subarrays along the array edges, where some elements remain functional. The resulting optimized array configuration is depicted in Figure 7, column (c). Figure 7(c1) depicts the final array, with subarrays colour-coded, and Figure 7(c2) presents the inactive elements, grouped by subarray, which are considerably less than the number shown in Figure 7(a2).
In such scenarios, optimization is not always feasible. As illustrated by the deactivated elements in Figure 7(b2), one may not exclude any complete subarray. Consequently, unlike the case with smaller subarrays, it is no longer possible to omit certain components during manufacturing, which represents a limitation from an industrial standpoint. The subarray element count is again a critical point in the design of hierarchical large antenna arrays.
We acknowledge that it is technically feasible to manufacture custom subarrays for the edges of the array—thereby eliminating all deactivated elements. Nevertheless, although such an approach should drop the number of deactivated elements to zero, the development and fabrication of custom edge subarrays would require further studies, additional funding, and extended development time. These are three fundamental problems that are addressed by economies of scale, and our approach uses only hexagonal subarrays. This is also the rationale behind focusing exclusively on the manufacturing and study of hexagonal subarrays. We believe this approach represents a more practical and scalable solution for future communication systems.
As a conclusion to this experiment, we assessed the array factor of the optimized, manufactured array—where all the elements are active. The configuration forms a quasi-circular aperture, as illustrated in Figure 7(c1). The corresponding array factor in Figure 8 exhibits a structure characterized by concentric circular rings. This pattern aligns with the expected behaviour of circular arrays, confirming the consistency between the physical aperture geometry and its far-field radiation characteristics. Still, one can observe the grating lobes due to the irregular and non-perfectly circular perimeter of the array, as noted for the hexagonal case.
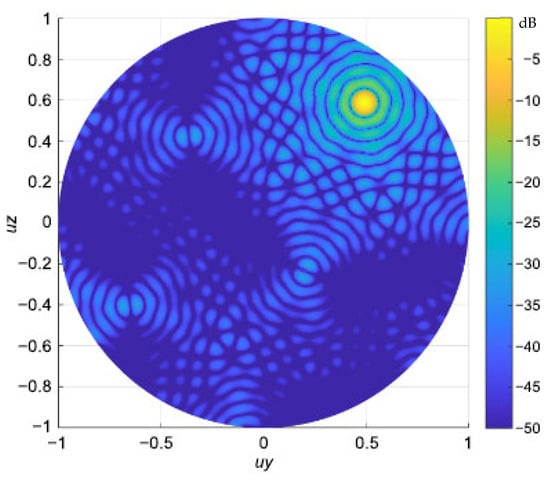
Figure 8.
Array factor corresponding to the Figure 7(c1) quasi-circular distribution made of hexagonal subarrays (all the elements on).
This observation confirms that selective excitation of specific elements within the manufactured array—configured on a triangular lattice—enables the synthesis of desired array factor geometries. By appropriately controlling the activation pattern of the subarray elements, the radiation pattern can be shaped to achieve desired performance characteristics, even in the presence of manufacturing-induced imperfections.
The triangular lattice remains a particularly attractive topology for large-scale antenna arrays due to its inherent advantages in terms of packing density, symmetry, and uniform angular sampling. However, its practical deployment at scale has been historically constrained by challenges related to the geometric compatibility between finite subarrays. The possibility of seamlessly tiling identical hexagonal subarrays while rigorously preserving the global triangular lattice opens new perspectives for the design and implementation of dense, high-performance arrays. This conceptual framework not only enables the exploitation of the triangular lattice’s electromagnetic advantages on a larger scale, but also aligns with the growing demand for efficient and scalable manufacturing solutions. In particular, the use of identical and repeatable subarrays facilitates the development of streamlined production chains, promoting cost-effective fabrication, ease of assembly, and standardization of components.
The proposed hexagonal subarrays for triangular grid architecture are compatible with hierarchical beamforming processing. They enable precise control over the excitation of individual elements at different levels of the structure. This paves the way for possibilities such as dynamically correcting the array factor and synthetising tailored radiation masks. The flexibility granted by this digital control extends the potential of triangular lattice arrays towards applications requiring optimal performance. The operational scenarios may include satellite communications, automotive radar, and next-generation wireless networks.
6. Conclusions
This study proposes a systematic methodology for the design of large-scale antenna arrays based on regular subarrays. It empathizes the collective side effects of subarray orientation and geometric configuration in the resulting array perimeter. The relevance of this work lies in its anticipation of emerging challenges associated with state-of-the-art digital beamforming architectures and array manufacturing processes affecting the array factor. As the industry moves toward fully digital beamforming solutions, issues related to scalability, cost-efficiency, and mass production are becoming increasingly critical. The proposed approach addresses critical issues in next-generation digital beamforming architectures and mass-production, specifically regarding the orientation of the components (Equation (3)) and the array factor. We leverage hierarchical subarray structures—found in modern mmWave DFRC systems, dynamic THz subarrays, XL-MIMO with TTD, and emerging holographic MIMO platforms—that promise scalable, cost-efficient, fully digital beamforming implementations.
In conclusion, our study provides practical insights that can serve as design guidelines for antenna engineers working with hierarchical large-scale arrays on triangular grids:
- Subarray Orientation and Perimeter Alignment: Misalignment between subarray orientation and the global array perimeter introduces grating lobes and degrades sidelobe suppression. Engineers should ensure coherent orientation across both levels of hierarchy to maintain beam symmetry.
- Use of Equation (3): The angular transformation defined in Equation (3) predicts the rotation needed to reconcile subarray orientation with the overall triangular lattice. This relationship can be directly applied to anticipate and control the rotation of the array factor in practical implementations.
- Choice of Subarray Size: Smaller subarrays, such as the seven-element configuration, minimize edge irregularities and deactivated elements, reducing the grating lobes and offering a robust baseline for scalable designs. Larger subarrays may improve local sampling but introduce increased perimeter distortions, manufacturing complexity, and grating lobes.
- Calibration Considerations: While the simulations assumed ideal calibration, Section 5B showed that realistic amplitude and phase mismatches degrade performance. A two-stage calibration strategy (within subarrays and across subarrays) is recommended for robust operation in hardware implementations.
- Scalability and Manufacturability: Using identical hexagonal subarrays across the array simplifies production and reduces costs. Selective deactivation of edge elements provides a practical way to adapt irregular boundaries without custom subarray fabrication.
These guidelines connect our theoretical findings with practical implementation considerations, enabling engineers to apply our results as design references in large-scale digital beamforming systems.
Future research will concentrate on the optimization of subarray configurations tailored to specific operational environments, as well as the implementation of advanced calibration techniques to address potential performance degradation effects at array edges. Additionally, high-fidelity electromagnetic simulations will be conducted using CST Studio Suite to further evaluate and enhance the electromagnetic behaviour of the proposed array structures. Finally, hardware constrains, and system capabilities will be simulated and evaluated. These efforts will improve the practical deployment and overall performance of the design in complex, real-world application scenarios.
Author Contributions
Conceptualization, S.L.-M.; methodology, S.L.-M.; software, S.L.-M.; validation, S.L.-M.; formal analysis, S.L.-M.; investigation, S.L.-M.; resources, S.L.-M.; writing—original draft preparation, S.L.-M.; writing—review and editing, J.L.B.-M.; supervision, J.L.B.-M.; project administration, J.L.B.-M.; funding acquisition, J.L.B.-M. All authors have read and agreed to the published version of the manuscript.
Funding
This work was supported by the EU Commission, under Grant No. EDF-2022-DA-AIR-AEW. Santiago Loza-Morcillo is the corresponding author.
Data Availability Statement
The code is available in the MATLAB 2025a repository will be added for the Camera-Ready version.
Conflicts of Interest
The authors declare no conflict of interest.
Abbreviations
The following abbreviations are used in this manuscript:
| LAA | Large Antenna Array |
| AF | Array Factor |
| TTD | True Time Delay |
| MIMO | Multiple-Input and Multiple-Output |
| DFRC | Dual-Function Radar-Communication |
| MUSIC | MUltiple SIgnal Classification |
| DBF | Digital Beam Forming |
| AESA | Active Electronically Scanned Array |
References
- Balanis, C.A. Antenna Theory: Analysis and Design, 4th ed.; Wiley: Hoboken, NJ, USA, 2016. [Google Scholar]
- Hansen, R.C. Phased Array Antennas, 2nd ed.; Wiley: Hoboken, NJ, USA, 2009. [Google Scholar]
- Van Trees, H.L. Optimum Array Processing, Part IV of Detection, Estimation, and Modulation Theory; Wiley: New York, NY, USA, 2002. [Google Scholar]
- Johnson, D.H.; Dudgeon, D.E. Array Signal Processing: Concepts and Techniques; Prentice-Hall: Upper Saddle River, NJ, USA, 1993. [Google Scholar]
- Friedlander, B.; Weiss, A.J. Direction finding using spatial smoothing with interpolated arrays. IEEE Trans. Aerosp. Electron. Syst. 1992, 28, 574–587. [Google Scholar] [CrossRef]
- Wang, Y.; Wei, Z.; Feng, Z. Beam Training and Tracking in MmWave Communication: A Survey. arXiv 2022, arXiv:2205.10169. [Google Scholar] [CrossRef]
- Li, J.; Stoica, P. MIMO Radar Signal Processing; Wiley: Hoboken, NJ, USA, 2009. [Google Scholar]
- Wang, S.; Li, S.; Hoorfar, A.; Miao, K.; Zhao, G.; Sun, H. Compressive Sensing-Based Sparse MIMO Array Synthesis for Wideband Near-Field Millimeter-Wave Imaging. IEEE Trans. Aerosp. Electron. Syst. 2023, 59, 7681–7697. [Google Scholar] [CrossRef]
- Iupikov, O.A.; Ivashina, M.V.; Skou, N.; Cappellin, C.; Pontoppidan, K.; van ’t Klooster, C.G.M. Multibeam Focal Plane Arrays With Digital Beamforming for High Precision Space-Borne Ocean Remote Sensing. IEEE Trans. Antennas Propag. 2018, 66, 737–748. [Google Scholar] [CrossRef]
- Ndiritu, G.W.; Kitavi, D.M.; Gitonga, C. Cramér-Rao Bound of Direction Finding Using a Uniform Hexagonal Array. J. Adv. Math. Comput. Sci. 2019, 32, 1–14. [Google Scholar] [CrossRef]
- Li, J.; Hu, F.; He, F.; Wu, L. High-resolution RFI localization using covariance matrix augmentation in synthetic aperture interferometric radiometry. IEEE Trans. Geosci. Remote Sens. 2018, 56, 1186–1198. [Google Scholar] [CrossRef]
- Haimovich, A.M.; Blum, R.S.; Cimini, L.J. MIMO radar with widely separated antennas. IEEE Signal Process. Mag. 2008, 25, 116–129. [Google Scholar] [CrossRef]
- Maxia, P.; Casula, G.A.; Navarrini, A.; Pisanu, T.; Valente, G.; Muntoni, G.; Montisci, G. Design of the new dual-polarized broadband phased array feed antenna for the Sardinia Radio Telescope. Electronics 2025, 14, 807. [Google Scholar] [CrossRef]
- Li, S.; Li, S.; Zhou, Y.; Zhang, C.; Kong, L.; Liu, K.; Xie, Y.; He, C. Phased array calibration based on rotating-element harmonic electric-field vector with time modulation. arXiv 2025. [Google Scholar] [CrossRef]
- Nokia Bell Labs. Challenges in massive MIMO antenna manufacturing and calibration. Nokia Bell Labs Tech. Rep. 2020. [Google Scholar]
- Nguyen, X.L.; Nhan, N.T.; Thi, T.T.D.; Van Thanh, T.; Nguyen, P.B.; Trien, N.D. Phased array antenna calibration based on autocorrelation algorithm. Sensors 2024, 24, 7496. [Google Scholar] [CrossRef] [PubMed]
Disclaimer/Publisher’s Note: The statements, opinions and data contained in all publications are solely those of the individual author(s) and contributor(s) and not of MDPI and/or the editor(s). MDPI and/or the editor(s) disclaim responsibility for any injury to people or property resulting from any ideas, methods, instructions or products referred to in the content. |
© 2025 by the authors. Licensee MDPI, Basel, Switzerland. This article is an open access article distributed under the terms and conditions of the Creative Commons Attribution (CC BY) license (https://creativecommons.org/licenses/by/4.0/).