Abstract
Motor imagery (MI) is a widely used paradigm in brain–computer interface (BCI) systems, with applications in rehabilitation and neuroscience. In this study, magnetoencephalography (MEG) signals were employed to analyze MI and other mental imagery tasks. MEG provides high spatial resolution, facilitating the classification of imagery-related signals. This study aims to enhance the classification of motor and cognitive imagery (CI) tasks using a public MEG dataset including four distinct tasks: imagining the movement of hands (H) or feet (F), performing arithmetic subtraction (S), and forming words (W). MEG signals were decomposed using five signal-decomposition methods: Empirical Wavelet Transform (EWT), Maximal Overlap Discrete Wavelet Transform (MODWT), Empirical Mode Decomposition (EMD), Variational Mode Decomposition (VMD), and Multivariate Variational Mode Decomposition (MVMD). Feature extraction was performed using the Common Spatial Patterns (CSP), with t-test-based feature selection. Subsequently, commonly used machine learning algorithms were employed to classify MI and CI tasks. The results indicate that MVMD and MODWT achieved the highest accuracies when combined with the Artificial Neural Networks. MVMD yielded superior performances in (H and W: 79.2%; F and S: 75.8%; and F and W: 73.8%) tasks. MODWT achieved high accuracies in the H and W (75.9%) and F and W (76.3%) tasks. Overall, motor and non-motor pairs (H and W, F and W) yielded higher accuracy than the cognitive pair (W and S).
1. Introduction
The brain–computer interface (BCI) is a promising form of technology used in various fields, analyzing the electrical activities of the human brain by utilizing neural response patterns associated with specific mental tasks []. BCI systems are capable of detecting and processing brain activities in different modes to determine the user’s intent. Among these modes, motor imagery (MI) refers to a process in which an individual imagines a specific body movement without physically performing it. Motor imagery-based BCI systems play a crucial role in facilitating the interactions between individuals with disabilities and their environment through brain signals, without necessitating physical movement. Such systems are constructed based on algorithms designed to directly interpret and extract patients’ intentions from brain signals. During the use of MI, oscillatory activities related to specific mental tasks emerge within the brain’s sensorimotor cortex. These activities are defined as “Event-Related Desynchronization” (ERD) and “Event-Related Synchronization” (ERS) []. ERD and ERS have been identified during open-hand movements using magnetoencephalography (MEG) []. Moreover, it has been documented in relevant studies that these dynamics are observable not only through MEG but also through electroencephalography (EEG) []. Since neural activation patterns during MI and motor movements are largely similar [], MI-based BCI systems are regarded as a potential alternative exercise method, particularly in cases where movement capacity is restricted, offering significant potential for reducing disability levels []. For instance, MI-BCI has been effectively applied in the development of supportive communication and control systems, such as 2D cursor control for disabled individuals [,], wheelchair control [], and robotic arm control []. Additionally, another critical application area of MI-BCI is the support of rehabilitation processes for individuals with motor function loss. In this context, it contributes to the recovery of motor functions by integrating advanced technologies such as Functional Electrical Stimulation (FES) [] and robotic exoskeletons []. With all these capabilities, MI-BCI emerges as a versatile technology aimed at both enhancing the quality of life of individuals with disabilities and compensating for motor skill losses.
In addition to MI-BCI, recent research has increasingly focused on the use of cognitive imagery (CI) tasks in BCI applications. Unlike motor imagery, CI tasks activate higher-order cognitive functions, such as memory, arithmetic, language processing, and visual imagination, rather than sensorimotor areas. Examples of imagery commonly used in the CI-based BCI paradigm include mental arithmetic operations, mental letter writing, geometric shape rotation, and mental word generation []. Moreover, the use of CI enables BCI systems to go beyond medical rehabilitation to offer personalized cognitive training and interaction in digital environments. A notable example in this context is the use of cognitive computing for BCI-based computational social digital-twins systems. In these systems, thanks to the dynamic interaction between neural data and intelligent systems, human-like adaptive digital beings can be created [].
This technology is gaining increasing popularity among both basic and clinical researchers in the field of neuroscience. It offers significant potential in the treatment of neurological disorders and the enhancement of mental performance. It has contributed to promising developments in various areas, especially in supporting memory in patients with impaired cognitive functions. Since CI-based BCI system control is achieved through specific neurons or cortical areas, these advancements also allow for a better understanding of brain physiology and learning mechanisms. Rehabilitative BCI, also known as biofeedback BCI, first drew attention as a theoretical concept proposed by Sterman in 1969. At the core of this approach lies the idea that conditioning neural activity without external stimuli can be effective in influencing behaviors []. For example, in severe epilepsy cases, it has been shown that the frequency of grand mal seizures can be reduced by conditioning sensorimotor rhythms without external stimulation [].
Recently, the MI/CI-BCI system has been attracting increasing attention, and alternative-communication-based studies have been aimed at improving functions such as memory, cognitive functions, mood, language, and motor control in individuals without diseases, as well as supporting their social participation and quality of life in language development; these are some examples that can be used to demonstrate the feasibility of MI/CI-BCI [,].
The essence of the MI-BCI system is the training of a model and, using certain training paradigms, the classification of brain signals into several primary movements []. In principle, any type of signal originating from the brain can be used for BCI systems. The signals to be used for a BCI can be obtained invasively by placing electrodes on the brain cortex or directly onto the cortex, or non-invasively using imaging devices. However, the most commonly used signals are the electrical signals produced by post-synaptic membranes through the activation of voltage-dependent or ion-dependent channels, and these signals are generally recorded using non-invasive neuroimaging techniques such as magnetoencephalography (MEG) and electroencephalography (EEG) from the location of the scalp. Almost all non-invasive BCIs use EEG to measure brain activity, typically via electroencephalogram (EEG) sensors that are placed on the scalp’s surface. These sensors enable the detection of the brain’s electrical activity by converting it into digital signals for further analysis. However, the low signal-to-noise ratio and limited spatial resolution of EEG make it difficult to use to analyze and resolve brain activity []. On the other hand, MEG uses highly sensitive sensors placed along the scalp to detect magnetic field fluctuations caused by small changes in the brain’s electrical activity. This allows it to provide a comprehensive view of the entire head, offer high spatial resolution, and capture brain activity with millisecond precision, thereby ensuring higher temporal resolution. Additionally, it eliminates the limitations of EEG due to the spatial distribution of the signal, which is not affected by changes in the internal mass distribution of the head []. MEG signals are recorded either using standard MEG methods with gradiometers and magnetometers that use superconducting quantum interference devices (SQUIDs) or with optically pumped magnetometers (OPM). The fundamental difference between these two methods is the way they detect magnetic fields. In the Elekta Neuromag 306-channel MEG system, there are 102 magnetometers and 204 planar gradiometers; while the magnetometers are sensitive to distant sources, the gradiometers are sensitive to sources close to the sensor array []. MEG, although a powerful method for studying brain activity, requires careful attention and expertise in signal processing and data interpretation due to the challenges encountered during the collection and processing of MEG signals. Since the magnetic fields produced by brain activity are extremely weak, it is necessary to reduce the impacts of strong interventions in order to measure these signals. Therefore, MEG data undergoes preprocessing stages to eliminate artifacts before analysis. Signal acquisition, signal preprocessing, feature extraction, and classification are the fundamental components of a BCI system. In many studies, numerous excellent theories and methods have been proposed in this field, achieving remarkable successes. Table 1 presents the MI-BCI studies conducted using MEG and EEG data.

Table 1.
Summary of recent studies on feature extraction and classification methods for motor/cognitive imagery tasks using EEG and MEG data.
This study presents the first systematic and comprehensive comparison of multiple signal-decomposition methods specifically applied to multichannel MEG data for both motor and cognitive imagery tasks. Our findings provide novel insights into the efficacy of different decomposition techniques, particularly highlighting the superior performance of MVMD and MODWT in classifying complex mental states using MEG signals. This study addresses a critical gap in the existing literature by offering a direct comparative analysis under consistent experimental conditions, thereby setting a new benchmark for future research on MEG-based BCI systems.
In our study, using the MEG data provided by [], binary class combinations were created for four different mental imagery tasks: imagined movement of both hands (H), imagined movement of both feet (F), subtraction of two numbers (S), and word formation using a clue from the English alphabet (W). The aim was to obtain high accuracy values for these binary classes, and in this regard, initially, 204-channel gradiometer signals were selected from the 306-channel MEG signals. Subsequently, the MEG signals were initially preprocessed with a band-pass filter and then five different signal-decomposition methods were employed to obtain sub-signals. The decomposition methods used were Empirical Wavelet Transform (EWT), Maximal Overlap Discrete Wavelet Transform (MODWT), Empirical Mode Decomposition (EMD), Variational Mode Decomposition (VMD), and Multivariate Variational Mode Decomposition (MVMD). By extracting different components within specific frequency bands of the signal and examining the behavior of each frequency band, both the temporal and frequency characteristics were obtained. Then, spatial filtering was applied, using the CSP method, to enhance the separation between classes, maximizing the variance differences associated with different signals (for example, the imagined movement of hands versus the imagined movement of feet) within the same projection matrix, resulting in higher discriminative feature vectors. The logarithmic variances of the obtained features were calculated and transformed into a suitable form for classification. In the next step, all the extracted features were combined to create a rich feature vector containing various information about the dataset. In the feature-selection phase, the best features were selected using a t-test based method. Finally, the selected features were trained using four different classifiers: Support Vector Machines (SVM), k-Nearest Neighbors (KNN), Artificial Neural Networks (ANN), and Naive Bayes (NB). Subsequently, their classification performances were compared.
2. Materials and Methods
2.1. The Framework
The block diagram shown in Figure 1 is presented to explain the proposed method. The method can be summarized in four main steps: Firstly, preprocessing is applied to the MEG signals. Next, based on the selected signal decomposition (SD) methods, the MEG signals are decomposed into sub-bands using EWT, MODWT, EMD, VMD, and MVMD, respectively. The number of sub-bands varies according to the decomposition method applied. Different components within specific frequency bands are extracted from the MI and cognitive imagery (CI) MEG signals, and the behavior of each frequency band is examined to obtain time–frequency characteristics. Then, the CSP method is applied to each sub-band to extract spatial features. Subsequently, the best features are selected, and finally, 4 different and common classifiers are employed to recognize the MI/CI-MEG signals. This process is described in detail in the following subsections.
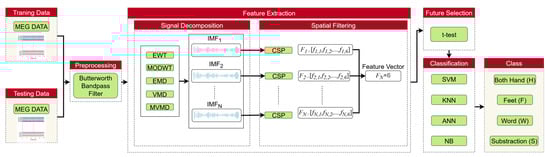
Figure 1.
Framework of the MI/CI-BCI system.
2.2. Dataset
The Elekta Neuromag™ system (Elekta Oy, Helsinki, Finland) located in Northern Ireland was utilized to record the MEG data used in this work. It has 306 channels (102 magnetometers and 204 planar gradiometers) with a sampling frequency of 1 kHz []. There are 17 participants in the dataset. In all, 200 trials of four distinct mental imagery tasks were completed by each participant (50 trials for each action). Participants were shown visual cues on the screen throughout the sessions. Participants were asked to envision moving both hands (H) or both feet (F) in two different tasks. The other two tasks involved creating words using hints from the English alphabet (W) and subtracting two provided numbers (S).
A 2 s rest interval and a 5 s task time made up each trial’s entire 7 s duration. For every trial, 7000 consecutive samples were generated from the data collected from 306 channels. Each participant in the dataset is associated with two distinct sessions, offering a thorough and varied data structure for study.
2.3. Signal Preprocessing
In this study, the MEG data obtained from the 204 channels were downsampled to 250 Hz. For each trial, a 3.5 s data segment starting 0.5 s after the cue and containing signals related to the imagined activity was used, resulting in a data matrix with a size of (channels, time, and total trials) for each participant’s MI and CI MEG signal trials. To eliminate the noise from each trial, the first step involved using a Butterworth band-pass filter with a wider frequency range of 7–45 Hz. Then, a Butterworth band-pass filter targeting the alpha and beta wave band range, which is generally important in MEG analyses, was applied in the 8–30 Hz range. All steps in both filtering ranges were calculated separately and compared.
2.4. Feature Extraction
Some feature extraction algorithms used in the MI-BCI studies are as follows: Power Spectral Density (PSD), Common Spatial Patterns (CSP), Short-Time Fourier Transform (STFT), Spatial–Spectral Decomposition (SSD), and Discrete Wavelet Transform (DWT), as well as their combinations [,,].
In this study, signal decomposition-based analyses of MEG signals were preferred for use in the feature extraction stage. Due to the wideband and noisy nature of MEG signals, direct analysis may fail to isolate task-relevant information. Therefore, time–frequency decomposition methods were adopted to segment the signals into meaningful sub-bands, enabling the extraction of a higher number of interpretable components. These methods are particularly suitable for identifying neural oscillations associated with motor and cognitive imagery tasks that often manifest within specific frequency ranges. By applying decomposition, low-frequency components relevant to the task can be more effectively separated from noise and unrelated activity.
Following decomposition, each sub-signal was independently processed using the Common Spatial Pattern (CSP) algorithm to extract spatially discriminative features specific to each task. This approach enhances the classification performance by capturing localized activity patterns. Additionally, advanced decomposition methods (such as MVMD) preserve inter-channel spatial alignment in multichannel MEG data, yielding features that are more robust and biologically meaningful.
Five signal-decomposition methods were employed in this study: Empirical Wavelet Transform (EWT), Maximal Overlap Discrete Wavelet Transform (MODWT), Empirical Mode Decomposition (EMD), Variational Mode Decomposition (VMD), and Multivariate Variational Mode Decomposition (MVMD). The CSP technique was applied separately to the output of each decomposition method. Subsequently, extracted features were classified, and classification performances were compared across methods. A brief description of the decomposition methods employed is provided below.
2.4.1. Empirical Wavelet Transform
EWT is an adaptive method that creates wavelet filter banks to analyze non-stationary signals. This method uses band-pass filters to separate the different frequency components of the signal and helps capture the time–frequency dynamics of the signal. The basic steps of EWT are the decomposition of the signal into frequency components, the use of wavelet filters to identify each component, and the calculation of high-order coefficients with modulus operators. EWT is particularly effective for non-stationary signals and offers a more dynamic analysis, compared to classical wavelet transform []. In this study, MaxNumPeaks = 7 was used to adaptively place spectral boundaries at dominant peaks, yielding seven sub-bands aligned with the energy distribution of the signal []. This arrangement balances the frequency resolution against the noise amplification that can arise from over-segmentation. Increasing the frequency transition point can allow more frequency components to be obtained, but excessive use of frequency transition points can also increase noise in the signal. Therefore, it is important to choose an appropriate number. The MEG signal-decomposition outputs obtained using EWT are shown in Figure 2.
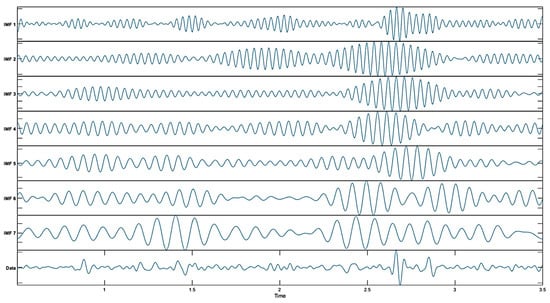
Figure 2.
Decomposed results obtained using EWT.
2.4.2. Maximal Overlap Discrete Wavelet Transform (MODWT)
MODWT is a mathematical model that scales a time-series signal and decomposes it into multi-level wavelet coefficients. This model enables detailed analysis of the time series by separating different frequency components of the signal at each level. The main advantage of MODWT is that it produces the same number of coefficients at each level of the signal while preserving the time-invariant property of the transformation. This feature allows for the analysis of the signal without the loss of its time-related characteristics. MODWT has some advantages compared to DWT. One of the main advantages of MODWT is its ability to process signals of any length. DWT is limited to signals for which the length is a power of 2. Additionally, the MODWT has a transformation invariance property, meaning that any shift in the input signal does not affect the pattern of the wavelet transformation [].
In the implementation of MODWT, given the DWT wavelet filter and the scaling filter, the MODWT wavelet filter is calculated as follows:
The MODWT scale filter j,l is calculated as follows:
Here, indicates the decomposition level and the time index.
MODWT wavelet coefficients and scale coefficients are calculated on the time series as follows:
These formulas describe the mathematical structure used by MODWT to decompose time series and obtain wavelet and scale coefficients []. In this study, eight decomposition levels were used to cover a wide MEG-relevant frequency range in the MODWT analysis. Because MODWT is undecimated (shift-invariant), the temporal alignment is preserved, allowing multiscale analysis without downsampling []. The decomposition results of the MEG signal using MODWT are shown in Figure 3.
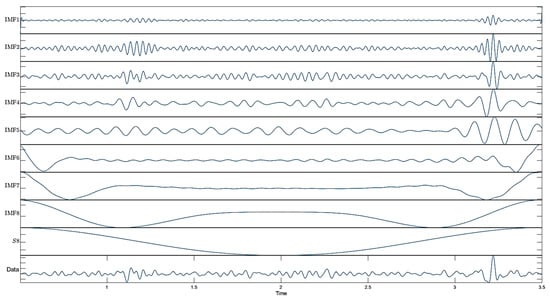
Figure 3.
Decomposed results obtained using MODWT.
2.4.3. Empirical Mode Decomposition (EMD)
The EMD method aims to model the input time series as the sum of various intrinsic mode functions (IMFs). In Equation (5), represents the measured data at time while n denotes the number of IMF components. Additionally, indicates the IMF function at time and corresponds to the residual component at time . This decomposition allows for a detailed analysis of non-linear and non-stationary signals by breaking them down into simpler oscillatory modes and isolating residual trends.
In the EMD method, the envelope of the signal is obtained by interpolating the points derived from the local minima and local maxima of the signal. By averaging the upper and lower curves created through interpolation, the expression is obtained. This expression is derived from the input data to obtain the oscillator mode. The oscillator thereby obtained is assigned as the final intrinsic mode if it meets the termination criterion of the algorithm; otherwise, the oscillator expression is used as input to continue the decomposition process []. EMD, to decompose a signal into its components, first removes the trend (long-term variation) component from the signal in order to obtain the high-frequency components from the original signal. This process eliminates the fundamental trend of the signal, allowing for the analysis of the finer details of the signal. Then, each IMF of the remaining signal is obtained with its own unique frequency band, and these modes represent the natural waveforms of the signal, breaking the signal into more meaningful parts.
The EMD process continues to iteratively separate the signal; each mode represents a component of the signal, and over time, higher frequency components are separated earlier, allowing the iterative analysis process to accurately isolate each component of the signal. As a result, the signal is divided into components, each with its own frequency band and varying over time. The signal was decomposed into, at most, four IMFs, consistent with the best practices utilized to avoid over-decomposition, and spurious modes with sifting stopped once the residual became monotonic []. The resulting IMFs were visually inspected, and candidate subsets were evaluated to identify the combination that yielded the best classification performance. The MEG signal-decomposition outputs using EMD are shown in Figure 4.
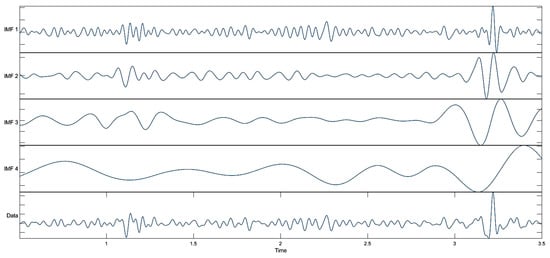
Figure 4.
Decomposed results obtained using EMD.
2.4.4. Variational Mode Decomposition (VMD)
VMD is a technique for EEG signal time–frequency decomposition. The following is the sequence of the VMD process []:
The Hilbert transform is used to compute the analytic signal of each mode, which allows the unilateral frequency spectrum (as ):
Here, * denotes the convolution operator.
The frequency spectrum of each mode is then shifted to the baseband by modulating it with a complex exponential function centered at the expected frequency:
The bandwidth of each mode is calculated based on the squared -norm of the time derivative (gradient) of the demodulated signal. Here, denotes the -norm, which is widely used in signal processing as a measure of energy.
In the VMD, the number of modes was set to ensure distinct spectral separation while maintaining physiologically interpretable bands, consistent with the recommendations for neural time-series analysis []. In this study, we set k = 4 in the VMD; consequently, the signal was decomposed into four band-limited modes. The separated outputs of the MEG signal obtained using VMD are shown in Figure 5.
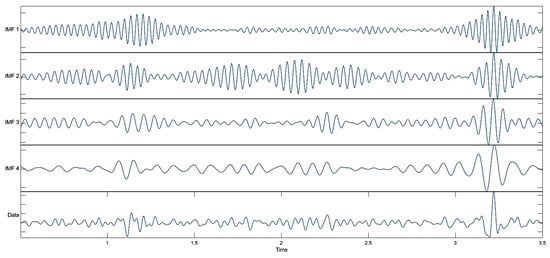
Figure 5.
Decomposed results obtained using VMD.
2.4.5. Multivariate Variational Mode Decomposition (MVMD)
MVMD is an extended version of the popular VMD algorithm; it can process multivariate signals containing a large number of channels. This extension allows MVMD to process data containing multiple channels, maintaining consistency among the frequencies of the channel components.
The main purpose of MVMD is to identify multivariate oscillatory components in multichannel signals. This method allows for the reconstruction of the input signal by the extraction of the central frequency and bandwidth of each channel, using the input data. Additionally, MVMD enables the alignment of similar frequency components between multiple channels thanks to its mode alignment feature. This feature cannot be obtained with the VMD method. Therefore, MVMD is particularly advantageous in the separation of non-stationary multivariate signals such as EEG and MEG [].
In the MVMD method, a multivariate MI-EEG time series with N channels is expressed as follows []:
MVMD extracts M number of multivariate modulated oscillations or modes from multivariate MI-EEG signals:
MVMD aims to obtain common multivariate modulated oscillations from input signals. The extracted multivariable modulated oscillations, or modes Om(t), are expressed as follows:
Here,
: The analytic signal obtained through the Hilbert transform;
: The Hilbert transform of ;
: For channel number N, the m-th mode component;
j: Virtual unit.
The success of the MVMD method depends on hyperparameters such as the number of modes, spectral bandwidth, time step, distribution of initial frequencies, and convergence tolerance. The correct selection of these parameters is critically important for effectively separating MEG signals and enhancing classification performance. In this study, the appropriate number of modes was determined to be six. This value ensured optimal separation by preserving the fundamental characteristics of the signal while avoiding unnecessary details. The spectral bandwidth was set at 2000, thereby enabling the detailed capture of different frequency components. The time step was set to zero (0), thereby increasing resistance to noise and ensuring the stability of the mode separation process. The initial frequencies were assigned using the equal distribution method to ensure that the separation was balanced and stable. Additionally, the convergence tolerance was set to to ensure that the algorithm would converge precisely and the accuracy of the results would be guaranteed. These settings were validated and, where necessary, minimally adjusted via visual inspection to preserve physiologically plausible oscillations while suppressing noise []. Sub-signals of the MEG signal obtained using MVMD are shown in Figure 6.
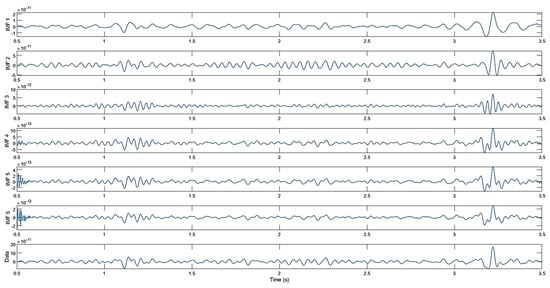
Figure 6.
Decomposed results obtained using MVMD.
In this study, a detailed comparison of the five signal-decomposition methods employed, namely, the Empirical Wavelet Transform (EWT), Maximal Overlap Discrete Wavelet Transform (MODWT), Empirical Mode Decomposition (EMD), Variational Mode Decomposition (VMD), and Multivariate VMD (MVMD), is presented in Table 2. As summarized in the table, MODWT, a shift-invariant wavelet transform operating within scales defined as powers of two, provides high time–frequency localization without the need for downsampling, making it well suited for fixed-band MEG spectral analysis.
Table 2.
Comparative summary of the five signal-decomposition methods (EWT, MODWT, EMD, VMD, and MVMD) in terms of their mathematical assumptions, strengths, limitations, and suitability for MEG data analysis [,].
EMD is a fully data-driven technique that decomposes signals into intrinsic mode functions without requiring predefined bases, which makes it advantageous for capturing transient event-related MEG dynamics, although it is more susceptible to mode-mixing and endpoint effects. VMD formulates decomposition as a constrained variational problem, producing noise-robust, band-limited modes that improve frequency separation, albeit at a higher computational cost. EWT adaptively determines spectral boundaries to construct wavelets, combining flexibility with computational efficiency, and performs well when MEG rhythms are spectrally distinct.
MVMD extends VMD to multichannel datasets, preserving spatial coherence and suppressing sensor-specific noise, aspects which are particularly beneficial for high-dimensional MEG recordings. Table 2 illustrates the trade-offs between adaptability, computational efficiency, and noise robustness, thereby providing a practical framework for selecting the most appropriate method according to specific MEG research objectives.
2.4.6. Common Spatial Pattern (CSP)
The Common Spatial Pattern method is used to extract features from data using various filters. The main objective of the CSP process is to maximize the variance of one class while minimizing that of the other. Thus, it performs a filtering process that can carry out the selection operation. It is generally used to separate two classes from each other. However, an extended version is available for multiple classes []. In the “one vs. one” (OVO) technique, the method remains same, but for a 4-class classification process, the feature extraction process is carried out for each pair of the 6 binary classes (H and F, H and S, H and W, F and S, F and W, and S and W) using the CSP. In this study, 6 projection matrices were created for a 4-class dataset generated from MI and CI tasks on signals reconstructed using decomposition methods. For each pair of binary classes, the CSP feature extraction process is carried out with the following steps []:
Step 1: For a specific class of the MI/CI-MEG trial sample matrix , compute the normalized average covariance matrix:
where , represents the i-th sample of a specific class task, with . denotes the average covariance matrix computed from all samples of that motor imagery task class.
Step 2: Determine the optimal solution for the ratio between the average covariance matrices of the two classes by solving the generalized eigenvalue problem.
where W denotes the spatial filter for the two MI tasks, and A and B represent two distinct task classes.
Following the one vs. one (OVO) strategy, each action is associated with six spatial filters, resulting in six feature vectors for each MI or CI sample. To enhance the distinctiveness of the MI and CI tasks, these six feature vectors are concatenated into a single joint vector: .
In this study, to ensure a coherent and comprehensible transition from the feature extraction process to the classification stage, a multiscale CSP-based framework was utilized, as conceptually described in the following. Initially, MEG signals were decomposed into several sub-bands using an appropriate signal-decomposition method (e.g., MODWT or MVMD). Then, the Common Spatial Pattern (CSP) algorithm was independently applied to each sub-band, yielding six spatial components per band. These components, which capture discriminative patterns between binary class pairs, were concatenated to form a feature vector for each trial. For instance, using MODWT with seven decomposition levels results in 42 features (7 bands × 6 CSP components), whereas MVMD with six modes produces 36 features in total. For each subject, the feature vectors obtained from all the trials and channels were concatenated into a single matrix for subsequent processing.
2.4.7. Feature Selection
After the feature extraction stage, the dataset still contains a large number of features, and some of these features may be ineffective or unnecessary for the results. In this case, it is necessary to reduce the number of features in order to identify those that have the greatest impact on the results and thereby to improve the model’s accuracy. A suitable subset of features can be successfully obtained using effective feature-selection algorithms. In this study, the statistical significance-based t-test method was used to determine the best features. This method has also been applied in other BCI studies [,].
The T-test method was applied in the classification of two MI or CI tasks to evaluate the discriminative power of features between the groups, testing whether each feature created a significant difference between the two groups. For each binary class, the statistical significance of the data is indicated, and the p-value (0.05) is calculated as the threshold. If the calculated p-value is greater than the threshold value, the feature determined for the binary class has statistical significance. A decrease in the p-value indicates that the difference between the two groups is more significant. All obtained p-values are ranked according to the statistical significance of the features, resulting in a feature vector ordered from the smallest to the largest p-value.
Each trial initially contained 6 CSP components per decomposition mode. Therefore, for the eight decomposition levels in MODWT, a total of 48 features (6 × 8) were obtained. Similarly, MVMD-based decomposition results in 36 features (6 × 6), depending on the number of modes generated. These full feature vectors are then ranked using an independent two-sample t-test, which evaluates the statistical significance (p-values) of each feature in distinguishing between the class labels.
Figure 7 illustrates the classification accuracy percentages obtained using the ANN classifier for different numbers of features in the 8–30 Hz frequency range. Figure 7a presents the results of the MODWT-based classification and subfigure Figure 7b presents the results of the MVMD-based classification.

Figure 7.
Accuracy variations according to feature selection for (a) MODWT and (b) MVMD in the 8–30 Hz frequency range.
To evaluate the impact of the number of selected features, we performed incremental feature selection using t-test rankings, starting from three features and increasing up to the maximum number available for each decomposition method (e.g., 36 for MVMD with six modes and 48 for MODWT with eight sub-bands). These feature counts correspond to the CSP-based features extracted per trial (six features per mode). The t-test was applied across all trials to rank the features based on their discriminative power. At each step, the top N-ranked features (N = 3, 4, …, full count) were selected and used to train the classifier. The resulting accuracies were then analyzed to determine the optimal number of features for each class pair.
In this study, for the 8–30 Hz frequency range, six features with the lowest p-values were selected from the feature vector for the MODWT method. The optimal number of features for the MVMD method was determined to be seven. Although only MODWT- and MVMD-based results are presented in Figure 7, which illustrates the effect of feature selection, the same t-test-based ranking method was applied consistently to all decomposition approaches evaluated in this study, including EMD, VMD, and EWT. For consistency and fairness in comparison, a fixed number of top-ranked features (e.g., six for all methods and seven for MODWT) were selected based on their p-values in the subsequent classification stages. This standardization ensures that the comparison reflects the discriminative power of the feature extraction method rather than variations in the feature count.
Each curve in the figure corresponds to a different binary classification task (H and F, H and W, H and S, F and W, F and S, and W and S), where the x-axis represents the number of selected features, and the y-axis indicates the average classification accuracy percentage for each task. It can be observed that accuracy tends to increase with the inclusion of additional features up to a certain threshold. After this, it stabilizes or exhibits a slight decline.
3. Classification Techniques
In this study, MEG data were collected in two sessions (conducted on different days), using the same BCI paradigm. The data from the first session is used to train the classifier, while the data from the second session is used as test data to evaluate the model’s accuracy. Normalization was applied to both the training and test data, thereby ensuring that the model learned more efficiently and its accuracy was improved. In the study, four different classifiers were tested: SVM, KNN, ANN, and NB.
The SVM classifier is a supervised classifier that examines training samples to discover hyperplanes or support vectors, with the aim of maximizing the margins between classes. In this study, the SVM model was trained with the default linear kernel to create a linear decision boundary.
The KNN classifier performs classification based on the nearest neighbors of the data. In this study, the Euclidean distance metric was preferred for the calculations of the distances between neighbors in the KNN model. The number of neighbors was set to , and all data were standardized to increase the model’s accuracy. In this way, each feature has been normalized to have a mean of zero and a variance of one.
The ANN classifier is a classification system developed based on the organization of biological neural networks. This system, consisting of input and output layers, may sometimes include one or more hidden layers in order to be able to find complex patterns. In this study, the neural network was designed to have 50 hidden layer neurons, and the sigmoid function was chosen as the activation function. Additionally, L2 regularization () was applied to prevent the model from overfitting by regulating the weights. The training process was limited to 1000 iterations, and each feature was standardized.
The Naive Bayes classifier, on the other hand, is a probabilistic machine learning classifier based on Bayes’ theorem. It creates probabilities by scanning the training examples only once and can easily handle missing feature values by not considering their probabilities. To create this classifier model, a dataset D with F number of features as input is required. When a new example is tested, the classifier calculates the posterior probability and assigns the class label with the highest probability. For this study, the probability distribution was rendered as a kernel distribution, which allows for more flexible modeling of complex relationships in the data. The parameters selected for the classification models have been carefully chosen to optimize the classification performance of the model [,,].
4. Computational Results
In this study, the classification performances of five different SD methods (MODWT, EMD, EWT, VMD, and MVMD) in different frequency ranges (7–45 Hz and 8–30 Hz) were evaluated using SVM, KNN, ANN, and NB classifiers.
4.1. Performance Analysis of SD Methods in Different Frequency Ranges
In this section, the performances of different signal decomposition (SD) methods in the 7–45 Hz and 8–30 Hz frequency bands are comparatively evaluated. In Figure 8 and Figure 9, the average accuracy rates (%) of the binary classification tasks obtained in the 8–30 Hz and 7–45 Hz frequency ranges, respectively, are graphically presented based on the method used. The bars shown in different colors in the graph represent the binary classes used (H and F, H and W, H and S, F and W, F and S, and W and S).
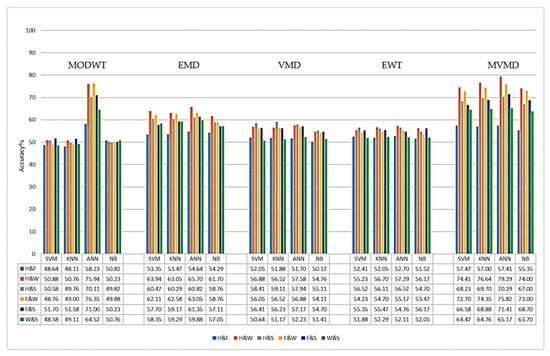
Figure 8.
Classification results for the SD methods in the 8–30 Hz frequency range.
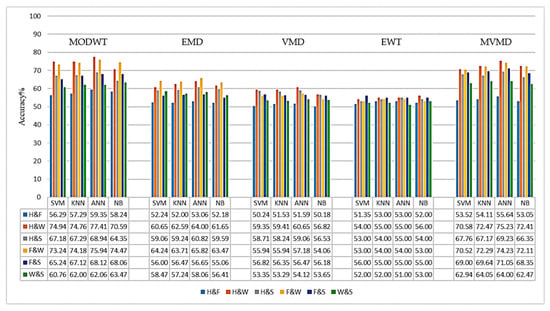
Figure 9.
Classification results of SD methods in the 7–45 Hz frequency range.
When the graphs are examined, it is observed that both the MODWT+CSP and the MVMD+CSP methods achieve the highest accuracy rates, especially with the ANN classifier, in both frequency ranges. In the 8–30 Hz frequency range (Figure 8), the MVMD method showed the best performance in the H and W (79.2%), F and S (75.8%), and F and W (73.8%) tasks. The MODWT method, on the other hand, achieved high accuracy rates, especially in the H and W (75.9%) and F and W (76.3%) tasks.
In the frequency range of 7–45 Hz (Figure 9), the MVMD method provided higher accuracy in the H and W (75.2%), F and S (74.1%), and F and W (74.2%) tasks, compared to the other four SD methods. The MODWT method, on the other hand, achieved an accuracy of 77.41% for the H and W task in the 7–45 Hz range and 75.94% for the 8–30 Hz range. Similarly, in the H and S task, it achieved an accuracy rate of 68.94% in the 7–45 Hz range and 70.11% in the 8–30 Hz range.
When other methods are evaluated, it is observed that the EMD method exhibits similar and consistent performance in both frequency ranges. In the 8–30 Hz frequency range, the accuracy rates generally varied between 57% and 66%, while in the 7–45 Hz frequency range, the accuracy rates were between 58% and 64%. When the EWT method is examined, it is observed that the accuracy rates are mostly in the range of 50–60%. The VMD method, on the other hand, has shown lower performance in both frequency ranges compared to other methods, with accuracy rates remaining in the 50–58% range.
When the classification results of all signal decomposition (SD) methods were examined, it was determined that the H and W as well as the F and W binary classification tasks generally had the highest accuracy rates. In contrast, the accuracy rates obtained in the H and F as well as the W and S classification tasks are lower. Considering the average accuracy values of the SD methods, it is observed that especially in multi-channel EEG and MEG data, the MVMD and MODWT methods, which can effectively identify multivariate oscillatory components, demonstrate higher performance compared to traditional SD methods such as EWT, EMD, and VMD. Therefore, MVMD and MODWT methods are widely preferred in the literature for the classification of multi-channel signals [,].
To enrich the accuracy-based assessment, we report additional performance metrics: Sensitivity (Recall), Specificity, Precision, and F1 for the 8–30 Hz band are reported in Table 3, and are computed per subject and averaged across subjects. Based on the class-wise metrics in Table 3, the methods can be ranked by macro-averaged F1 as MVMD ≈ MODWT > EMD > VMD ≳ EWT. Across the class pairs, H and W as well as F and W attained the highest F1 scores, whereas H and F (followed by W and S) was the most challenging. The close agreement between Precision and Recall indicates a balanced error profile with no evidence of pronounced class imbalance or threshold-induced bias.
Table 3.
Class–pair-wise performance metrics for each SD method with ANN classifier in the 8–30 Hz band.
4.2. Comparison of MODWT and MVMD Performances Across Subjects
Table 4 and Table 5 present the individual classification accuracy rates (ACC%) obtained with the ANN classifier for the MODWT and MVMD methods, respectively. The last columns in each table summarize the overall average accuracy rates, representing the general performance of each method.
Table 4.
Subject-based accuracy percentages (%) for MODWT+CSP+ANN in the 8–30 Hz and 7–45 Hz frequency ranges.
Table 5.
Subject-based accuracy percentages (%) for MVMD+CSP+ANN in the 8–30 Hz and 7–45 Hz frequency ranges.
When Table 4 and Table 5 are examined, it can be seen that the MVMD method generally provides higher accuracy rates for most individuals, compared to the MODWT method. For instance, as shown in Table 5, the MVMD method for the third subject achieves higher accuracy rates in different frequency ranges: specifically, 99% (H and S) and 86% (F and S) accuracy in the 7–45 Hz frequency range; and 96% (H and W), 97% (H and S), 90% (F and W), and 92% (F and S) accuracy in the 8–30 Hz range. Similarly, the fifth subject achieved notable accuracy rates using MVMD: 93% (H and W) and 74% (F and S) for 7–45 Hz; and 93% (H and W), 92% (F and W), and 76% (F and S) for 8–30 Hz. The seventh subject also achieved higher accuracies with MVMD at 7–45 Hz, specifically, 73% (H and W), 86% (H and S), and 76% (F and W); and at 8–30 Hz, 83% (H and W), 93% (H and S), and 75% (F and S). Finally, for the 17th subject, MVMD demonstrates notable accuracy rates in the 7–45 Hz frequency range, achieving 84% (H and S) and 93% (F and S). These findings indicate that MVMD consistently delivers strong performance across various frequencies and individual subject data.
On the other hand, Table 4 indicates that the MODWT method yielded better results for certain subjects. For example, in the case of the first subject, at the 7–45 Hz frequency range, MVMD provided accuracy rates of 60% (H and S) and 74% (F and W), whereas MODWT slightly outperformed in the F and S class with 68%. For the same subject, in the 8–30 Hz frequency range, MODWT notably achieved higher accuracies of 55% (H and F) and 68% (F and S), whereas MVMD underperformed with accuracies of 51% (H and W) and 62% (F and W).
Similarly, for the second subject, at the 7–45 Hz frequency range, MODWT was superior, with 76% (H and W) and 85% (F and W). However, at 8–30 Hz, while MVMD was distinctly better in the H and W (81%) and H and S (55%) classes, MODWT again showed stronger results in the H and W (78%) and F and W (84%) classes.
Furthermore, for some subjects, overall accuracy percentages remained relatively low, showing minimal differences between the methods. For example, the ninth subject, at 7–45 Hz, obtained similar results: MODWT yielded accuracies of 76% (H and W) and 73% (H and S), while MVMD provided comparable accuracies of 76% (H and W) and 65% (F and S). These findings suggest that individual differences significantly influence the effectiveness of the methods.
In addition to the subject-wise comparisons obtained with the ANN classifier, we formally tested whether accuracies differ across the six class–pair tasks. For each method × frequency band condition (MODWT+CSP+ANN and MVMD+CSP+ANN; 7–45 Hz and 8–30 Hz), we assessed H0 (no accuracy differences among the six class–pair tasks) versus H1 (at least two tasks differ) using the non-parametric Friedman test [], followed, when significant, by Wilcoxon signed-rank post hoc tests with Holm adjustment [,]. The overall Friedman p-values and the significant pairwise contrasts are summarized in Table 6.
Table 6.
Overall Friedman test p-values and significant pairwise comparisons (Wilcoxon signed-rank, Holm-adjusted p < 0.05) for each method × frequency band.
As shown in Table 6, the Friedman test yielded p < 0.001 for all four conditions (MODWT 7–45 Hz, MODWT 8–30 Hz, MVMD 7–45 Hz, and MVMD 8–30 Hz) with the ANN classifier, rejecting H0 and confirming that accuracy varies systematically across class–pair tasks. Post hoc Wilcoxon tests with Holm adjustment identify the specific contrasts driving these effects. Consistently, H and F differs from several tasks (e.g., F and W, as well as H and W; additionally, F and S as well as H and S at 8–30 Hz), while W and S frequently shows differences with H and W, as well as F and W. The 8–30 Hz band exhibits a richer pattern of significant pairs than 7–45 Hz, and MVMD shows the smallest overall p-values (strongest global effect), indicating more pronounced separations among tasks under MVMD. Together, these results show that the observed accuracy differences are statistically reliable and attributable to specific class–pair contrasts rather than random variation.
4.3. Comparison of Classifiers
In this section, the accuracy rates of the ANN, KNN, SVM, and Naive Bayes classifiers will be compared. In Figure 10, the horizontal axis represents the evaluated methods, while the vertical axis shows the performance values used for the evaluation. The red horizontal lines inside or at the borders of the boxes indicate the median values. The vertical lines extending from the boxes represent the lower and upper limits of the data distribution. The dashed lines (whiskers) above and below the boxes extend to the most extreme data points that the box plot algorithm does not consider to be outliers; outliers are separately indicated with red cross marks.
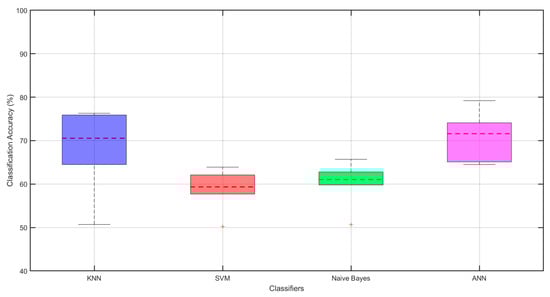
Figure 10.
Boxplots comparing classifiers in the 8–30 Hz band. Boxes show the interquartile range (Q1–Q3, IQR); the solid line inside each box is the median. Whiskers extend to 1.5 × IQR; points beyond are outliers (red ‘+’). The red dotted horizontal line indicates the mean accuracy (%) for each classifier. Colors identify classifiers: KNN (blue), SVM (red), Naïve Bayes (green), ANN (magenta).
According to Figure 10, the ANN classifier has the highest average accuracy percentage and stands out as the most successful method. After ANN, the KNN classifier offers the best accuracy rates, and can be considered a strong alternative.
SVM and Naive Bayes classifiers, on the other hand, exhibited lower accuracy rates and included outliers, indicating model failure for certain individuals. ANN and KNN each show a wider distribution in accuracy rates, while SVM and Naive Bayes each have a narrower distribution, offering consistent but lower accuracy. When examining the whisker lengths, it is observed that they are at acceptable levels for all classifiers, indicating that the models generally exhibit balanced performance.
In conclusion, the ANN classifier stands out as the most successful method, while KNN also offers a strong alternative with high accuracy rates. In contrast, the SVM and Naive Bayes methods exhibit weaker performance compared to the other methods due to their lower accuracy rates and inconsistent performance.
5. Discussion
The present study offers a unique contribution to the field of brain–computer interfaces by systematically evaluating and comparing five distinct signal-decomposition methods (EWT, MODWT, EMD, VMD, and MVMD) for the classification of motor and cognitive imagery tasks using a publicly available MEG dataset. Unlike previous studies, which often focused on a single decomposition method or different neuroimaging modalities, our comprehensive comparative analysis provides critical insights into the relative strengths and weaknesses of these techniques in the context of MEG-based BCI. Specifically, our results underscore the remarkable efficacy of MVMD and MODWT, demonstrating their superior ability in extracting discriminative features from MEG signals, leading to enhanced classification accuracy in various imagery tasks. These findings are particularly significant, as they identify optimal signal-processing strategies that can significantly advance the development of MEG-BCI systems that are more robust and reliable. Based on these findings, we propose a new approach that integrates optimal signal-decomposition methods with CSP-derived features to further improve the classification performance of multichannel MEG signals. These results are particularly significant, as they identify optimal signal-processing strategies that can advance the development of MEG-BCI systems that are more robust and reliable.
In Figure 11, the person-based accuracy rates of the MODWT and MVMD methods for different task pairs have been compared. In each subplot, the horizontal axis represents different individuals (subjects), while the vertical axis shows the accuracy rates. In the graphs, different symbols, such as squares, rhombuses, circles, and triangles, have been used to represent each task pair (H and F, H and W, H and S, F and W, F and S, and W and S). The MODWT method is represented by empty symbols, while the MVMD method is represented by filled symbols.
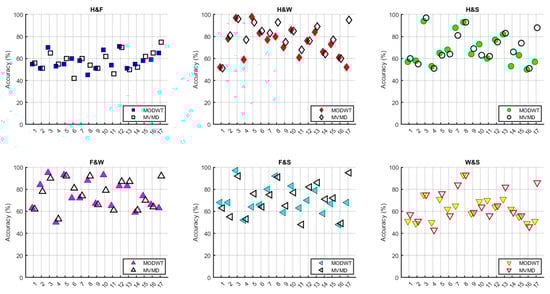
Figure 11.
Comparison graphs of subject-based accuracy for MODWT and MVMD at 8–30 Hz.
When Figure 11 is examined, it can be observed that the MVMD method generally provides higher accuracy for the third, fifth, seventh, and seventeenth subjects. On the other hand, for the ninth, eleventh, and sixteenth subjects, accuracy rates remained at lower levels, and no significant changes were observed relative to the method used.
Figure 12 and Figure 13 present a comparative analysis of the computational efficiency of the MODWT and MVMD methods, respectively. In Figure 12, subject-wise running times in minutes are illustrated, revealing that the MVMD method consistently required less computational time than the MODWT method, for all participants. Figure 13 summarizes the mean running times in minutes with standard deviation error bars and specifies the speed-up factors relative to MVMD. The analysis indicates that MVMD achieves a speed-up of approximately 43% compared with MODWT, and this improvement was statistically significant according to the Wilcoxon test (p < 0.001).
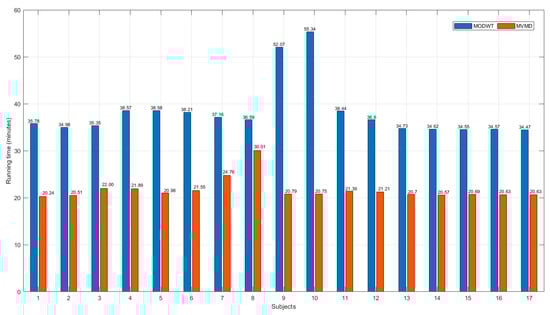
Figure 12.
Subject-wise comparison of the running times (in minutes) for the MODWT and MVMD methods.
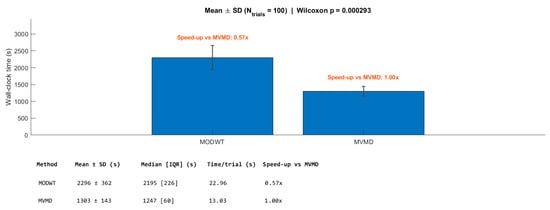
Figure 13.
Mean running times (in seconds) with standard deviation error bars for the MODWT and MVMD methods. The speed-up factor with respect to MVMD is indicated above each bar.
The average classification accuracy rates obtained in the 8–30 Hz frequency range using the proposed MODWT+ANN and MVMD+ANN methods have been compared with existing studies in the literature. Table 7 presents the binary classification accuracy rates for six different tasks from studies [,,], which used the same dataset, and compares them with the proposed methods.
Table 7.
Comparison of average accuracy rates of studies conducted on the same MEG dataset.
When Table 7 is examined, it can be observed that the accuracy rates obtained in this study for the H and W, H and S, F and W, F and S, and W and S classes are higher compared to the findings in studies [,]. In the H and F class, it was observed that study [] offered slightly higher accuracy, but the use of the methods proposed in this study resulted in an overall improvement in performance.
In the comparison with study [], it can be observed that while the H and F, H and S, F and W, and W and S tasks achieved higher accuracy in [], the proposed methods performed better in the H and W task, as well as the F and S task. These findings indicate that the MODWT+ANN and MVMD+ANN methods provide successful results in classifying multichannel MEG data. Additionally, compared to existing studies in the literature, these methods demonstrate the potential to achieve higher accuracy in binary classification for certain tasks.
Taken together (i.e., class–pair metrics; cross-study comparisons; and runtime analysis), these findings have practical implications for BCI. The enhanced classification accuracies achieved through our signal-decomposition-based approach have significant practical implications for the advancement of BCI systems. In neurorehabilitation, improved multichannel MEG classification can lead to more precise and reliable control signals for assistive devices, such as robotic prosthetics or communication aids, thereby facilitating faster and more effective recovery in individuals with motor impairments. Our findings will contribute to the development of more robust and user-friendly systems that can be deployed in clinical or home environments without the need for invasive procedures. Furthermore, the insights gained from this study can inform the creation of more sophisticated subject-independent BCI models, thereby reducing the need for extensive calibration for each new user. The computational efficiencies demonstrated by some of our methods also suggest their potential for real-time BCI applications, enabling immediate feedback and user control. These advancements have paved the way for a new generation of BCI technologies that are more accurate, adaptable, and accessible, ultimately improving the quality of life of individuals with neurological conditions.
Although the proposed methods have shown promising results in the classification of MI/CI-MEG signals, there are some limitations that need to be addressed. Overcoming these challenges will not only enhance the performance of the methods but also open new avenues for future research.
One of the primary limitations is the dataset and its generalizability. The MEG dataset used in this study was obtained under a specific experimental setup, which may limit the applicability of the method to different datasets. Furthermore, the scarcity of publicly available MI/CI-MEG datasets makes it difficult to directly compare the methods used in different studies. Future research should focus on enhancing generalizability by testing the proposed methods on diverse datasets.
Another important limitation is hyperparameter sensitivity. The signal-decomposition methods employed (MODWT, MVMD, etc.) require specific hyperparameters, such as the number of modes, frequency bands, and window lengths. While these parameters were determined empirically in this study, more optimized results could be achieved through automatic or adaptive hyperparameter selection techniques, such as Bayesian optimization or grid search. Additionally, computational cost remains a crucial factor, especially for real-time applications. The use of multiple signal-decomposition and spatial filtering techniques increases processing time, which may hinder real-time performance. Future studies should explore optimization strategies to improve efficiency, making these methods more suitable for real-time BCI applications.
Inter-individual variability also plays a key role in classification performance. In MI-based BCI systems, brain activity patterns differ across individuals, impacting classification accuracy. Although this study applied individual-specific training, the incorporation of adaptive models or transfer learning techniques could further improve classification performance across groups of individuals. Investigating approaches that enhance user-independent classification remains a valuable direction for future research.
The integration of deep learning-based approaches holds significant potential for improving MI/CI-MEG classification. The application of models such as Convolutional Neural Networks (CNNs) or Long Short-Term Memory (LSTM) networks could enhance classification accuracy by capturing both temporal and spatial dependencies more effectively.
In summary, the MODWT+ANN and MVMD+ANN methods proposed in this study have demonstrated notable advantages in MI/CI-MEG signal classification. However, addressing key limitations including dataset constraints, inter-individual variability, hyperparameter sensitivity, and computational cost will be essential for further improvement. Future research should focus on deep learning integration, hybrid signal-processing approaches, real-time applications, and personalized BCI systems, all of which could significantly advance the development of MI/CI-BCI technologies.
6. Conclusions
The brain–computer interface is a rapidly developing research topic in the fields of health and neurotechnology. Among BCI methods, motor imagery-based BCI is of great interest, as it allows individuals to control brain activities by merely imagining motor movements, and without performing any physical actions. The non-invasive nature of this method and its ability to provide direct control without relying on the peripheral nervous system of the brain have encouraged research in MI-based BCI systems. Similarly, detection of cognitive imagery–based signals is becoming a more popular research area. Classification of MI and CI signals still poses significant challenges. Low spatial resolution can cause signals obtained from the motor cortex to mix with signals from other regions of the brain, reducing classification accuracy. In addition, the significant variability of MI and CI signals among individuals necessitates the development of automatic classification algorithms.
In this study, five different signal-decomposition methods (MODWT, MVMD, EMD, EWT, and VMD) were applied in two different frequency ranges (7–45 Hz and 8–30 Hz) to classify MEG-based MI and CI signals using four different classifiers (ANN, SVM, KNN, and NB). The main objective of the study was to determine the most suitable method by comparing the binary classification success rates of different SD methods and the performances of classifier combinations. For the obtained results, the EMD, EWT, and VMD methods were tested with different combinations. Although the EMD method effectively extracts features within the signal, this method makes it difficult to determine the appropriate number of modes, due to the variability of intrinsic mode function modes in the multi-channel data. Although the EWT method is effective in identifying adaptive frequency components in the signal, it has not performed as well as MODWT, due to the variability of the modes determined by the channel and the complexity of the appropriate-mode selection process. Although the VMD method makes the features in specific frequency bands more distinct, the necessity of optimizing the number of modes differently for each channel has made it difficult to determine the appropriate number of modes and has increased computational costs. This situation has posed limitations for real-time applications.
The results show that the MODWT and MVMD methods offer higher accuracy rates compared to the traditional methods used in the literature. The MODWT method has demonstrated high classification performance by effectively preserving time–frequency resolution through maximum overlapping wavelet filters that eliminate time shifting. The MVMD method, on the other hand, has reduced inter-individual variability and improved classification performance by consistently separating frequency components in multi-channel data. When different classifier combinations were evaluated, it was determined that the ANN classifier achieved the highest accuracy rates. However, the classification of MI/CI-MEG signals is influenced by various factors, such as inter-individual variability, dataset diversity, and processing costs. It is recommended that, in the future, this method be tested with different datasets to increase its generalizability and to examine transfer learning approaches that enhance individual-independent classification performance.
Additionally, increasing computational efficiency for real-time applications and further improving classification success with deep learning-based approaches are among the important research topics. In conclusion, this study has made a significant contribution to enhancing the classification performance of MI/CI-MEG-based BCI systems by presenting a comparative analysis of five different signal-decomposition methods across two different frequency ranges. In line with the advantages of the MODWT and MVMD methods, focusing future studies on these approaches will enhance the applicability of the method to a broader user base, thereby providing more effective solutions in the fields of assistive technologies and neurorehabilitation.
Author Contributions
Conceptualization, G.K. and M.A.A.Y.; methodology, G.K. and M.A.A.Y.; software, G.K., M.A.A.Y., and M.O.; validation, M.O.; formal analysis, M.O.; investigation, G.K. and M.A.A.Y.; visualization, M.A.A.Y.; writing—original draft preparation, G.K.; writing—review and editing, M.O.; supervision, M.O. All authors have read and agreed to the published version of the manuscript.
Funding
This publication was supported by the Scientific Research Projects Coordination Unit of Istanbul Yeni Yüzyıl University.
Institutional Review Board Statement
Not applicable.
Informed Consent Statement
Not applicable.
Data Availability Statement
The MEG dataset used in this study was recorded using the 306-channel Elekta Neuromag™ system (Elekta Oy, Helsinki, Finland), which includes 102 magnetometers and 204 planar gradiometers. The recordings were conducted in Northern Ireland. The dataset is publicly available at https://doi.org/10.6084/m9.figshare.c.5101544.
Conflicts of Interest
The authors declare no conflicts of interest.
Abbreviations
The following abbreviations are used in this manuscript:
| ADCFNN | Adaptive Deep Convolutional Fuzzy Neural Network |
| BCI | Brain–Computer Interface |
| MEG | Magnetoencephalography |
| EEG | Electroencephalography |
| MI | Motor Imagery |
| CI | Cognitive Imagery |
| ERD | Event-Related Desynchronization |
| ERS | Event-Related Synchronization |
| CSP | Common Spatial Pattern |
| SD | Signal Decomposition |
| STFT | Short-Time Fourier Transform |
| EWT | Empirical Wavelet Transform |
| MKELM | Multi-Kernel Extreme Learning Machine |
| MODWT | Maximal Overlap Discrete Wavelet Transform |
| EMD | Empirical Mode Decomposition |
| VMD | Variational Mode Decomposition |
| MVMD | Multivariate Variational Mode Decomposition |
| ANN | Artificial Neural Network |
| SVM | Support Vector Machine |
| KNN | k-Nearest Neighbors |
| NB | Naive Bayes |
| IMF | Intrinsic Mode Function |
| OVO | One vs. One |
| FES | Functional Electrical Stimulation |
| OPM | Optically Pumped Magnetometer |
| SQUID | Superconducting Quantum Interference Device |
| Hz | Hertz |
References
- Jiao, Y.; Zhang, Y.; Chen, X.; Yin, E.; Jin, J.; Wang, X.Y.; Cichocki, A. Sparse group representation model for motor imagery EEG classification. IEEE J. Biomed. Health Inf. 2018, 22, 631–641. [Google Scholar] [CrossRef]
- Hu, H.; Zhou, Z.; Zhang, Z.; Yuan, W. Dual-Branch Spatio-Temporal-Frequency Fusion Convolutional Network with Transformer for EEG-Based Motor Imagery Classification. Electronics 2025, 14, 2853. [Google Scholar] [CrossRef]
- Salmelin, R.; Hari, R. Spatiotemporal characteristics of sensorimotor neuromagnetic rhythms related to thumb movement. Neuroscience 1994, 60, 537–550. [Google Scholar] [CrossRef]
- Pfurtscheller, G.; Neuper, C. Motor imagery activates primary sensorimotor area in humans. Neurosci. Lett. 1997, 239, 65–68. [Google Scholar] [CrossRef]
- Miller, K.J.; Schalk, G.; Fetz, E.E.; den Nijs, M.; Ojemann, J.G.; Rao, R.P.N. Cortical activity during motor execution, motor imagery, and imagery-based online feedback. Proc. Natl. Acad. Sci. USA 2010, 107, 4430–4435. [Google Scholar] [CrossRef] [PubMed]
- Schwemmer, M.A.; Skomrock, N.D.; Sederberg, P.B.; Ting, J.E.; Sharma, G.; Bockbrader, M.A.; Friedenberg, D.A. Meeting brain–computer interface user performance expectations using a deep neural network decoding framework. Nat. Med. 2018, 24, 1669–1676. [Google Scholar] [CrossRef]
- Long, J.; Li, Y.; Yu, T.; Gu, Z. Target selection with hybrid feature for BCI-based 2-D cursor control. IEEE Trans. Biomed. Eng. 2012, 59, 132–140. [Google Scholar] [CrossRef]
- Wolpaw, J.R.; McFarland, D.J. Control of a two-dimensional movement signal by a noninvasive brain-computer interface in humans. Proc. Natl. Acad. Sci. USA 2004, 101, 17849–17854. [Google Scholar] [CrossRef] [PubMed]
- Long, J.; Li, Y.; Wang, H.; Yu, T.; Pan, J.; Li, F. A hybrid brain–computer interface to control the direction and speed of a simulated or real wheelchair. IEEE Trans. Neural Syst. Rehabil. Eng. 2012, 20, 720–729. [Google Scholar] [CrossRef] [PubMed]
- Meng, J.; Zhang, S.; Bekyo, A.; Olsoe, J.; Baxter, B.; He, B. Noninvasive electroencephalogram based control of a robotic arm for reach and grasp tasks. Sci. Rep. 2016, 6, 38565. [Google Scholar] [CrossRef]
- Biasiucci, A.; Leeb, R.; Iturrate, I.; Perdikis, S.; Al-Khodairy, A.; Corbet, T.; Schnider, A.; Schmidlin, T.; Zhang, H.; Bassolino, M.; et al. Brain-actuated functional electrical stimulation elicits lasting arm motor recovery after stroke. Nat. Commun. 2018, 9, 2421. [Google Scholar] [CrossRef]
- Wang, C.; Wu, X.; Wang, Z.; Ma, Y. Implementation of a brain–computer interface on a lower-limb exoskeleton. IEEE Access 2018, 6, 38524–38534. [Google Scholar] [CrossRef]
- Sakkaff, Z.S. Brain Computer Interface (BCI) based on Electroencephalographic (EEG) patterns due to new cognitive tasks. arXiv 2023, arXiv:2307.02780. [Google Scholar] [CrossRef]
- Lv, Z.; Qiao, L.; Lv, H. Cognitive computing for brain–computer interface-based computational social digital twins systems. IEEE Trans. Comput. Soc. Syst. 2022, 9, 1635–1643. [Google Scholar] [CrossRef]
- Sterman, M.B.; Wyrwicka, W.; Howe, R. Behavioral and neurophysiological studies of the sensorimotor rhythm in the cat. Electroencephalogr. Clin. Neurophysiol. 1969, 27, 678–679. [Google Scholar] [CrossRef]
- Sterman, M.B.; Macdonald, L.R. Effects of central cortical EEG feedback training on incidence of poorly controlled seizures. Epilepsia 1978, 19, 207–222. [Google Scholar] [CrossRef]
- Samal, P.; Hashmi, M.F. Role of machine learning and deep learning techniques in EEG-based BCI emotion recognition system: A review. Artif. Intell. Rev. 2024, 57, 50. [Google Scholar] [CrossRef]
- Pitt, K.M.; Spoor, A.; Zosky, J. Considering preferences, speed and the animation of multiple symbols in developing P300 brain–computer interface for children. Disabil. Rehabil. Assist. Technol. 2025, 20, 171–183. [Google Scholar] [CrossRef]
- Razi, S.; Karami Mollaei, M.R.; Ghasemi, J. A novel method for classification of BCI multi-class motor imagery task based on Dempster–Shafer theory. Inf. Sci. 2019, 484, 14–26. [Google Scholar] [CrossRef]
- Altuwaijri, G.A.; Muhammad, G. A multibranch of convolutional neural network models for electroencephalo-gram-based motor imagery classification. Biosensors 2022, 12, 22. [Google Scholar] [CrossRef]
- Braeutigam, S. Magnetoencephalography: Fundamentals and established and emerging clinical applications in radiology. ISRN Radiol. 2013, 2013, 529463. [Google Scholar] [CrossRef] [PubMed]
- Philip, B.S.; Prasad, G.; Hemanth, D.J. A systematic review on artifact removal and classification techniques for enhanced MEG-based BCI systems. Brain-Comput. Interfaces 2023, 10, 99–113. [Google Scholar] [CrossRef]
- Roy, S.; Rathee, D.; Chowdhury, A.; McCreadie, K.; Prasad, G. Assessing impact of channel selection on decoding of motor and cognitive imagery from MEG data. J. Neural Eng. 2020, 17, 056037. [Google Scholar] [CrossRef] [PubMed]
- Rathee, D.; Raza, H.; Roy, S.; Prasad, G. A magnetoencephalography dataset for motor and cognitive imagery-based brain–computer interface. Sci. Data 2021, 8, 121. [Google Scholar] [CrossRef]
- Youssofzadeh, V.; Roy, S.; Chowdhury, A.; Izadysadr, A.; Parkkonen, L.; Raghavan, M.; Prasad, G. Mapping and decoding cortical engagement during motor imagery, mental arithmetic, and silent word generation using MEG. Hum. Brain Mapp. 2023, 44, 3324–3342. [Google Scholar] [CrossRef] [PubMed]
- Guan, S.; Cong, L.; Wang, F.; Dong, T. A single-joint multi-task motor imagery EEG signal recognition method based on Empirical Wavelet and Multi-Kernel Extreme Learning Machine. J. Neurosci. Methods 2024, 407, 110136. [Google Scholar] [CrossRef]
- Velasco, I.; Sipols, A.; De Blas, C.S.; Pastor, L.; Bayona, S. Motor imagery EEG signal classification with a multivariate time series approach. Biomed. Eng. Online 2023, 22, 29. [Google Scholar] [CrossRef]
- Al-Saegh, A. Identifying a suitable signal processing technique for MI EEG data. Tikrit J. Eng. Sci. 2023, 30, 140–147. [Google Scholar] [CrossRef]
- Krishnan, K.K.; Soman, K.P. CNN based classification of motor imagery using variational mode decomposed EEG-spectrum image. Biomed. Eng. Lett. 2021, 11, 235–247. [Google Scholar] [CrossRef]
- Halme, H.-L.; Parkkonen, L. Across-subject offline decoding of motor imagery from MEG and EEG. Sci. Rep. 2018, 8, 10087. [Google Scholar] [CrossRef]
- Geng, X.; Wang, L.; Yu, P.; Hu, W.; Liang, Q.; Zhang, X.; Chen, C.; Zhang, X. A method of EEG signal feature extraction based on hybrid DWT and EMD. Alex. Eng. J. 2025, 113, 195–204. [Google Scholar] [CrossRef]
- Bouchane, M.; Guo, W.; Yang, S. High-Resolution Time-Frequency Feature Selection and EEG Augmented Deep Learning for Motor Imagery Recognition. Electronics 2025, 14, 2827. [Google Scholar] [CrossRef]
- Sadiq, M.T.; Yu, X.; Yuan, Z.; Aziz, M.Z.; ur Rehman, N.; Ding, W.; Xiao, G. Motor imagery BCI classification based on multivariate variational mode decomposition. IEEE Trans. Emerg. Top. Comput. Intell. 2022, 6, 1177–1189. [Google Scholar] [CrossRef]
- Gilles, J. Empirical wavelet transform. IEEE Trans. Signal Process. 2013, 61, 3999–4010. [Google Scholar] [CrossRef]
- Patnaik, B.; Mishra, M.; Bansal, R.C.; Jena, R.K. MODWT-XGBoost based smart energy solution for fault detection and classification in a smart microgrid. Appl. Energy 2021, 285, 116457. [Google Scholar] [CrossRef]
- Percival, D.B.; Walden, A.T. Wavelet Methods for Time Series Analysis; Cambridge University Press: Cambridge, UK, 2000. [Google Scholar]
- Duru, A.D. Çokdeğişkenli Ampirik Mod Ayrıştırımı ile İçsel Bağlantı Ağları Kestirimi. Acad. Platf.-J. Eng. Sci. 2019, 7, 155–161. [Google Scholar]
- Huang, N.E.; Shen, Z.; Long, S.R.; Wu, M.C.; Shih, H.H.; Zheng, Q.; Yen, N.C.; Tung, C.C.; Liu, H.H. The empirical mode decomposition and the Hilbert spectrum for nonlinear and non-stationary time series analysis. Proc. R. Soc. Lond. A 1998, 454, 903–995. [Google Scholar] [CrossRef]
- Elshekhidris, I.H.; MohamedAmien, M.B.; Fragoon, A. Wavelet transforms for EEG signal denoising and decomposition. Int. J. Adv. Signal Image Sci. 2023, 9, 11–28. [Google Scholar] [CrossRef]
- Dragomiretskiy, K.; Zosso, D. Variational mode decomposition. IEEE Trans. Signal Process. 2014, 62, 531–544. [Google Scholar] [CrossRef]
- Fu, R.; Niu, S.; Feng, X.; Shi, Y.; Jia, C.; Zhao, J.; Wen, G. Performance investigation of MVMD-MSI algorithm in frequency recognition for SSVEP-based brain–computer interface and its application in robotic arm control. Med. Biol. Eng. Comput. 2024, 62, 1–15. [Google Scholar] [CrossRef]
- Dovedi, T.; Upadhyay, R.; Kumar, V. Multivariate variational mode decomposition & phase space reconstruction based motor imagery EEG classification. Comput. Electr. Eng. 2023, 108, 108737. [Google Scholar] [CrossRef]
- Rehman, N.U.; Mandic, D.P. Multivariate empirical mode decomposition. Proc. R. Soc. A Math. Phys. Eng. Sci. 2010, 466, 1291–1302. [Google Scholar] [CrossRef]
- Wardana, N.I. A comparative study of EMD, EWT and VMD for detecting the oscillation in control loop. J. Phys. Conf. Ser. 2016, 776, 012087. [Google Scholar] [CrossRef]
- Porwal, A.; Kumar, S.; Verma, P. Comparative analysis of filtering noise from voice signal by different decomposition methods. J. Phys. Conf. Ser. 2023, 2425, 012007. [Google Scholar] [CrossRef]
- Wang, J.; Chen, Y.H.; Yang, J.; Sawan, M. Intelligent classification technique of hand motor imagery using EEG beta rebound follow-up pattern. Biosensors 2022, 12, 384. [Google Scholar] [CrossRef]
- Degirmenci, M.; Yuce, Y.K.; Isler, Y. Motor imaginary task classification using statistically significant time-domain EEG features. In Proceedings of the 30th Signal Processing and Communications Applications Conference (SIU), Antalya, Türkiye, 18–20 May 2022; pp. 1–4. [Google Scholar]
- Kısa, D.H.; Özdemir, M.A.; Güren, O.; Alaybeyoğlu, A. A decision-making mechanism based on EMG signals and adaptive neural fuzzy inference system (ANFIS) for hand gesture prediction. J. Fac. Eng. Archit. Gazi Univ. 2023, 38, 1417–1430. [Google Scholar]
- Liu, L. Recognition and analysis of motor imagery EEG signal based on improved BP neural network. IEEE Access 2019, 7, 47794–47803. [Google Scholar] [CrossRef]
- Miah, M.O.; Rahman, M.M.; Muhammod, R.; Farid, D.M. Prediction of motor imagery tasks from multi-channel EEG data for brain–computer interface applications. bioRxiv 2020. bioRxiv:2020.04.01.020220. [Google Scholar] [CrossRef]
- Martinez-Peon, D.; Garcia-Hernandez, N.V.; Benavides-Bravo, F.G.; Parra-Vega, V. Characterization and classification of kinesthetic motor imagery levels. J. Neural Eng. 2024, 21, 014001. [Google Scholar] [CrossRef]
- Friedman, M. The use of ranks to avoid the assumption of normality implicit in the analysis of variance. J. Am. Stat. Assoc. 1937, 32, 675–701. [Google Scholar] [CrossRef]
- Wilcoxon, F. Individual comparisons by ranking methods. Biom. Bull. 1945, 1, 80–83. [Google Scholar] [CrossRef]
- Holm, S. A simple sequentially rejective multiple test procedure. Scand. J. Stat. 1979, 6, 65–70. [Google Scholar]
Disclaimer/Publisher’s Note: The statements, opinions and data contained in all publications are solely those of the individual author(s) and contributor(s) and not of MDPI and/or the editor(s). MDPI and/or the editor(s) disclaim responsibility for any injury to people or property resulting from any ideas, methods, instructions or products referred to in the content. |
© 2025 by the authors. Licensee MDPI, Basel, Switzerland. This article is an open access article distributed under the terms and conditions of the Creative Commons Attribution (CC BY) license (https://creativecommons.org/licenses/by/4.0/).