Abstract
Cloud Data Centers (CDCs) are the foundation of the digital economy, enabling data storage, processing, and connectivity for different academia/industry/commerce activities and digital services worldwide. As a result, their consistent power supply and reliable performance are critical factors; however, few works have considered power consumption optimization based on intelligent workload allocation. To this end, the proposed paper presents a Federated Learning (FL)-based server workload allocation model for optimal power optimization. In this strategy, the servers are modeled based on their Central Processing Unit (CPU), memory, storage, and network usage. A global server is considered as the global model responsible for final workload allocation decisions. Each server acts as a client in the federated learning framework, sharing its derived parameters with the global model securely and federatedly. Finally, after ten epochs of the system running, the model could optimize the system, decrease the overall power consumption, and reduce the workload pressure in each server by distributing it to other servers. The model is evaluated using different Key Performance Indicators (KPIs), and an appendix is provided, including the full performance results, workload shifting logs, and server resource status. Overall, the suggested FL allocator model shows promise in significantly lowering power consumption and alleviating server workload efficiently.
1. Introduction
Cloud Data Centers (CDCs) are considered fundamental infrastructure globally, with reliable performance being the top priority, relying on their role in the digital economy [1,2,3,4,5,6,7], as well as the Artificial Intelligence (AI) applications [8,9,10,11,12,13,14]. Based on a report by Goldman Sachs, a banking investment corporation, about trillion will be invested in AI, chips, and a CDC power supply [15]. Given their significance, CDCs consume considerable electricity, highlighting the necessity for more efficient, clean, and sustainable power sources, making them ideal candidates for power-efficient designs [16]. To this end, several works have been conducted to pave the way for developing efficient and clean CDC power optimization [17]. Chidolue et al. [18] introduced the concept of green CDCs. These centers concentrate on power-efficient hardware, as well as renewable power utilization, advanced cooling, and resource optimization with sustainability. Despite their higher upfront costs and technical complexity, these technologies promise lower operational costs and less environmental impact. The rise of server workload analytics can significantly affect CDC power consumption and resource utilization. The dynamics of server operations, including task scheduling and resource allocation, directly impact different parts, such as cooling systems [19]. Optimizing workloads through intelligent management strategies, such as load balancing, spatio-temporal flexibility [20,21,22,23], and virtualization, can reduce power demands and improve sustainability in CDC operations. For instance, GreenGLB, an online algorithm, is presented in [24] utilizing a greedy approach for distributing interactive, indivisible workloads across geo-distributed CDCs. Indivisible workloads, sequential tasks assigned to a single CDC, are allocated based on current electricity prices, renewable energy availability, and predefined constraints. Following this concept, a game theory-based workload management framework was designed, in [25], to minimize cloud operating costs through intelligent scheduling. The framework accounts for data transfer costs, CDC queueing delays, and factors such as heterogeneous compute capabilities, cooling power, task co-location interference, time-of-use electricity pricing, renewable energy, net metering, peak demand pricing, and network pricing. Additionally, the work [26] presented a hierarchical workload management approach for geographically distributed CDCs, considering two algorithms for workload assignment and migration. These algorithms calculate a cost function to determine the optimal site for running workloads across CDCs, requiring minimal state information exchange while preserving CDC autonomy and enabling integrated management of heterogeneous platforms. Moreover, a review of optimization-based workload distribution strategies is conducted by [27], for geographically distributed CDCs, focusing on recent research. It examined optimization factors, including workload type, load balancer, renewable energy availability, energy storage, and server specifications.
The study [28] proposed an energy and workload management framework for sustainable CDCs, using stochastic optimization to adapt to variable renewable energy availability, cooling efficiency, Information Technology (IT) workload shifts, and energy price fluctuations while meeting long-term quality-of-service requirements.
Additionally, The review conducted in [29] highlighted the importance of energy efficiency in CDCs in reducing operational costs, minimizing carbon footprints, and promoting sustainable growth. Over 25 energy efficiency metrics and 250 literature references were considered, analyzing various energy-consuming components and configurations in CDCs. Through real-world case studies, the review evaluated how corporations implement these metrics, while also considering their challenges and limitations.
In addition to the significance of power consumption, the model designed to optimize power is also important. Accordingly, a FL-based workload allocation model is presented in this paper. Besides other previously published models, the proposed strategy models the CDC servers by their Central Processing Unit (CPU), network, memory, and storage devices. Next, it considers a global server as the global model and the other servers as the clients. Each client is analyzed using the local 3rd-degree polynomial regressor model, and the results are then federatively transferred to the global server to make the final evaluation and decision. Then, the proposed model is evaluated against several Key Performance Indicators (KPIs), and shifting results are derived. Moreover, the contributions of the proposed model are summarized as follows:
- a FL-based intelligent model is developed to allocate the workload quickly, efficiently, and securely with the least errors;
- the distribution process is conducted in just 10 intervals, tending Mean Square Error (MSE) to zero;
- an appendix is provided, including the workload shift logs, full global/local KPIs, and server status, demonstrating the low error rates in the presented KPIs.
The paper is structured as follows: the proposed system and the FL strategy are presented in Section 2. The results and conclusion are drawn in Section 3 and Section 4, respectively. Finally, the details of log shifts, server status, and KPIs are available in Appendix A.
2. Proposed Workload Shifting Strategy
2.1. Preliminary Statement
The workload shift, in this paper, is conducted on CDC servers. In each server (Figure 1), the power consumption is mainly from the CPU, memory, storage, and network devices.
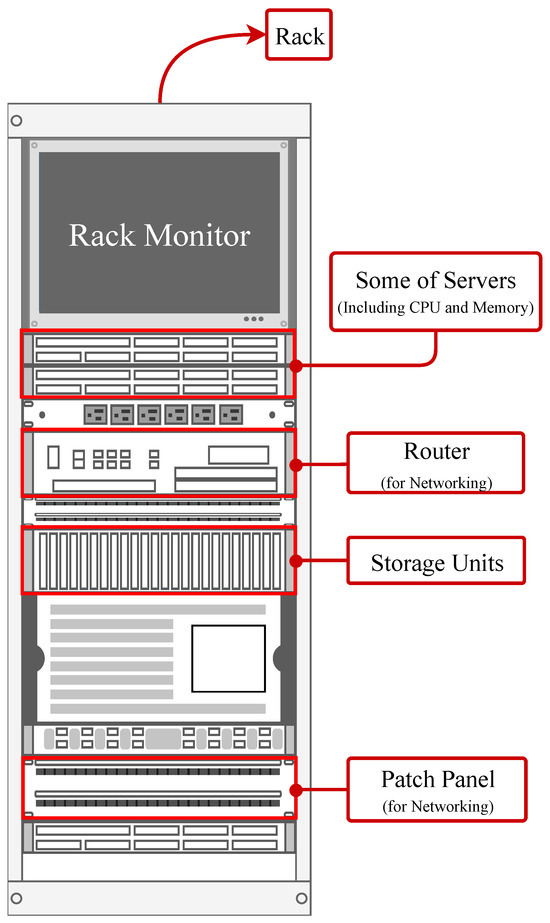
Figure 1.
A server rack schematic, including servers themselves, storage, and networking units.
In a CDC server, the CPU is among the main components responsible for executing instructions and performing calculations, directly impacting the server’s processing power and power consumption [30]. The memory, including Random Accessible Memory (RAM), stores data that is actively used by the CPU, with higher memory usage leading [31] to increased power consumption due to the need for faster data retrieval/processing. Storage devices, typically consisting of Hard-Disk Drive (HDD) or Solid-State Drive (SSD), store large volumes of data and increase power consumption, particularly during read/write operations [32]. Finally, network devices, such as the Network Interface Card (NIC) [33] and switches [34], handle data communication between servers, often influencing power use as network traffic increases, particularly in high-throughput or low-latency environments.
2.2. Intelligent Shifting Strategy
Federated Learning (FL), firstly introduced in [35], is a decentralized approach to Machine Learning (ML), where multiple devices or data sources work together to train a global model, all while keeping their data private and secure [36]. In a typical FL setup, data resides on distributed devices, such as smartphones, Internet-of-Things (IoT) sensors, or edge servers, where each device locally processes its data to generate model updates. Instead of transmitting raw data, these updates are sent to a central server, where they are aggregated to improve the global model. This process is repeated, with the central server sending the updated model back to the devices for further training. It also solves issues related to data access by allowing data from different devices or locations to contribute to training without needing to store it all in one place. Additionally, FL reduces communication overhead compared to traditional distributed learning, as only model parameters or gradients are transferred, not entire datasets of each server. To this end, the overall structure of the developed FL model for the server’s workload allocation is shown in Figure 2.
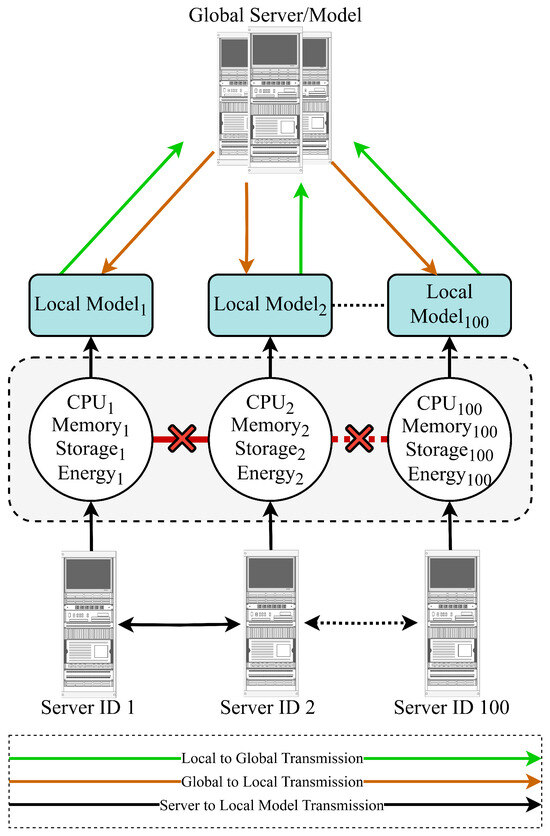
Figure 2.
Overall workload shifting process using FL, considering a global server and local servers.
The proposed FL-based model optimizes power consumption across a distributed system of 100 servers, each acting as a client. Each server trains a local -degree polynomial regression model to predict power consumption based on workload characteristics, specifically CPU, memory, storage, and network usage.
These models are aggregated into a global model to guide dynamic workload redistribution, minimizing total power consumption while considering server capacity constraints and a power threshold. The proposed strategy is conceptualized in Figure 3 and presented in Algorithm 1 and Figure 4.
| Algorithm 1 Proposed strategy. |
|
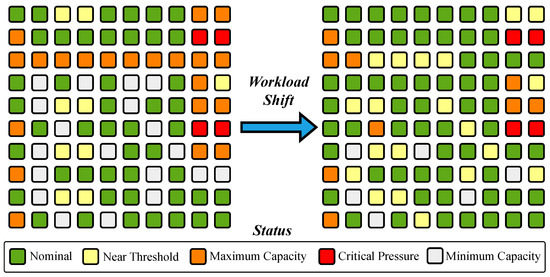
Figure 3.
Visualization of workload shifting for servers.
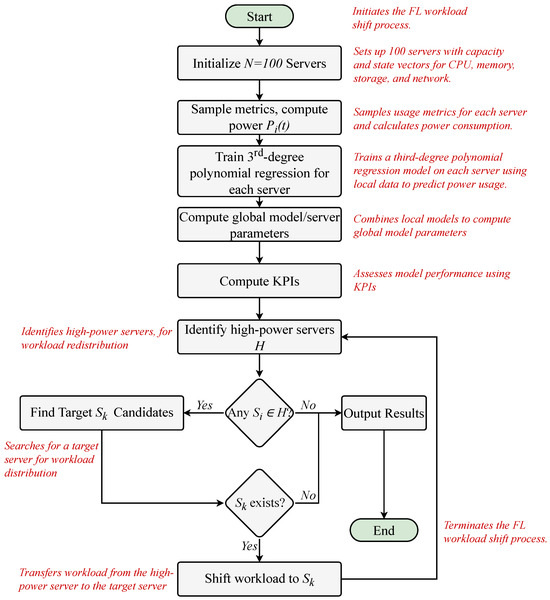
Figure 4.
Flowchart of the overall process to distribute workload by the proposed FL strategy.
The process, as outlined in Figure 4 and Algorithm 1, manages a system of 100 servers to optimize resource usage and minimize power consumption through a FL-driven approach. Each server is initialized with a capacity vector ():
representing its CPU (), memory (), storage (), and network (()) capabilities. Then, a dynamic state vector () is considered as
capturing real-time resource usage (, for CPU, memory, storage, and the network) at time t.
The strategy proceeds by updating each server’s usage metrics through sampling from uniform distributions: , , , and . Power consumption is calculated based on
incorporating contributions from all resources with an additional noise, which is Gaussian.
Next, each server trains a local -degree polynomial regression model on its dataset by
where represents resource usage, and is the power consumption. Features are standardized using
In Equation (5), is the workload feature vector for server i, containing a CPU, memory, network, and storage usage. The symbol denotes the mean of the feature vectors in the local dataset of server i. Additionally, is considered as the standard deviation of the feature vectors in . A small constant is added to to prevent division by zero.
Then, the outputs are scaled: . The data is split into 80% training and 20% validation sets, and the model minimizes the MSE ():
Performance is evaluated on the validation set using KPIs (MSE, Root Mean Square Error (RMSE), Mean Absolute Error (MAE), Mean Absolute Percentage Error (MAPE), Max Error).
Local models are aggregated by pooling all datasets as in
standardizing features and scaling outputs similarly, and training a global ()-degree polynomial regression model to minimize global MSE ():
The global model’s performance is assessed using the same KPIs.
Workload optimization identifies high-power servers () in a set . For each , a workload of Equation (9) is defined for transfer:
The proposed FL-driven strategy searches for a target server subject to the properties defined in
The feasibility function for the system at time t, denoted , is defined as 1 if the presented conditions are satisfied. In this sequence, are the incremental resource demands, and are the capacity limits for Memory, Network, and Storage; otherwise, .
Power predictions from the global model are used to compute savings as
selecting the with maximum savings (). If a valid is found, workloads are updated, power is recomputed, and the shift is logged. If no valid target exists, the failure is logged.
Finally, the global model is finalized. Then, performance metrics and workload shift logs are logged, showing balancing resource usage and minimizing power consumption through FL-driven optimization.
As a result, each server will require fewer resources to handle the workload, leading to reduced power consumption while all dedicated workloads will be completed as intended.
Performance is evaluated using KPIs [37], such as MSE, MAE, MAPE, RMSE, and maximum error, summarized in Table 1.

Table 1.
Considered KPIs in this work.
The Mean Square Error measures the average of the squared differences between predicted and actual values, emphasizing larger errors due to the squaring operation [37]. On the other side, the MAE quantifies the average magnitude of errors in a set of predictions, calculated as the average of the absolute differences between predicted and actual values [38]. Following this concept, the MAPE expresses the average absolute error as a percentage of the actual values, calculated by taking the absolute difference between predicted and actual values, dividing by the actual value, and averaging these percentages [39]. Additionally, the RMSE is considered a measure of the average magnitude of prediction errors in the same units as the original data [40,41]. Finally, maximum error represents the largest single deviation between a predicted and actual value in a dataset, capturing the worst-case scenario of a model’s predictions.
3. Results and Discussion
The proposed 100 servers are modeled in this section, and the FL strategy, with simultaneous training across all servers, is applied in the platform. For the evaluation, the KPIs are calculated for the global model and each local model of servers. For the final phase, a log file is considered for the workload shift, including the initial and final servers. The results are shown in Figure 5, Figure 6, Figure 7 and Figure 8.
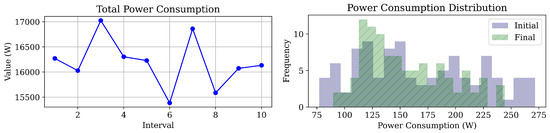
Figure 5.
Final results: Power consumption, and Power distribution in the servers.
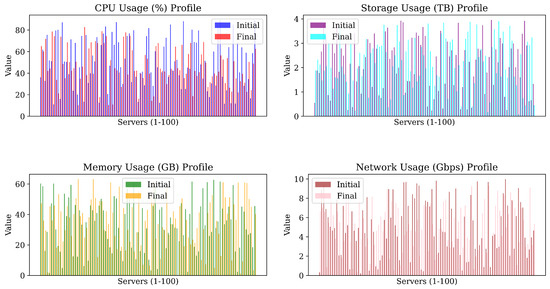
Figure 6.
Usage Results: the CPU, Storage, Memory, and Network in the servers.
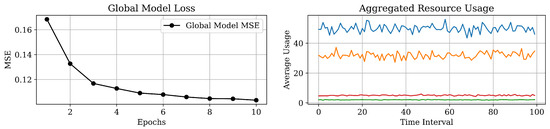
Figure 7.
Results of global model loss and aggregated resource usage (the CPU, memory, storage, and network).
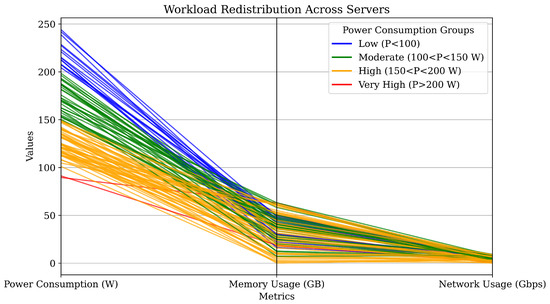
Figure 8.
Workload distribution results, by clustering the servers.
The proposed model reduced total power consumption across intervals, defined by workload distribution cycles, as shown in Figure 5. Power distribution became more consistent, demonstrating the model’s effectiveness in optimizing power efficiency and minimizing consumption disparities. Also, the term frequency, here means the repetitive number of servers over an identical power consumption. For example, there are about five servers that their final consumption is 150 W. As shown in Figure 6, the model balanced resource metrics, including CPU, memory, network, and storage, resulting in more uniform and optimized usage profiles. This highlights the model’s effectiveness in workload allocation, reducing bottlenecks and improving system performance.
The reduction in global model loss over successive epochs, shown in Figure 7, presents the learning convergence, confirming the effectiveness of the FL approach in adapting to server conditions and optimizing workload distribution. As depicted in Figure 6 the global model MSE decreases from approximately 2.5 to 1.0 across 10 epochs, demonstrating a steady improvement in model accuracy. This trend is complemented by the aggregated resource usage data in Figure 6 which manifests the stable average utilization of the CPU, memory, storage, and network resources over time intervals. The consistent resource usage, with the CPU and memory peaking around 40 units and storage and network remaining low, presents the efficient workload distribution and minimal overhead. Consequently, aggregated resource usage metrics remained stable over time, as shown in the results.
This observed stability, achieved through dynamic workload adjustments, underscores the robustness of the model in sustaining consistent performance even when server capacities fluctuate. Following implementation, server statuses were systematically categorized into four distinct power consumption levels—Low, Moderate, High, and Very High—as illustrated in Figure 8, providing a clear framework for monitoring and comparison. Notably, higher initial consumption levels were closely linked to increased memory and network activity, reflecting the greater strain placed on resources during peak demand. However, by intelligently redistributing workloads across servers, the system effectively alleviated these imbalances, mitigating excessive resource usage on heavily burdened nodes and narrowing disparities in utilization.
The proposed FL model reduced discrepancies in resource utilization by aligning workloads, ensuring balanced computational demands, and promoting equitable resource usage.
The model achieved the defined KPIs, with the least errors, as detailed in the Appendix A, demonstrating the precision and efficiency of the approach in optimizing workload allocation and enhancing system performance.
4. Conclusions
This study presented a novel FL-based intelligent workload allocation model designed to optimize server utilization. The approach treats each server as a client and utilizes a global model for dynamic workload distribution. Servers were categorized into five clusters, enabling targeted workload management. The FL model decentralized data processing, ensuring privacy and scalability. The global model aggregated local server data to dynamically balance workloads, minimizing bottlenecks and enhancing efficiency. The model’s effectiveness was assessed using KPIs, including resource utilization, load balancing, scalability, and power efficiency. Logs and detailed KPI analytics are provided in the appendix. By addressing critical demands for power-efficient and reliable CDCs, the proposed model presents a scalable solution to workload management. The challenges in this field involve ensuring secure and efficient communication between distributed servers acting as clients, handling heterogeneous server resources with varying CPU, memory, storage, and network capabilities. Additionally, managing the complexity of synchronizing model updates in a federated environment, addressing potential latency issues, safeguarding data privacy, and defending against cyber attacks during the FL process, such as model poisoning or data inference attacks, are critical concerns. Future work could focus on enhancing the scalability of the model to accommodate larger and more diverse CDC infrastructures, integrating adaptive learning mechanisms to respond to dynamic workload patterns in real time, exploring hybrid optimization approaches combining FL with other AI techniques, and implementing robust fault tolerance to ensure continuous operation despite server failures or communication disruptions. Moreover, extending the framework to consider renewable energy sources and considering environmental impacts, such as footprint, could further optimize sustainability in CDC operations, while developing advanced security protocols to detect and mitigate cyber threats would strengthen the resilience of the system.
Author Contributions
A.S.: Conceptualization, Software, Validation, Visualization, Original Writing; Review/Editing; Formal Analysis, Investigation. A.R.: Supervision, Project Management, Formal Analysis, Software, Validation, Visualization, Review/Editing, Funding Acquisition. All authors have read and agreed to the published version of the manuscript.
Funding
This work is supported by the Natural Sciences and Engineering Research Council of Canada (NSERC) Discovery Grant stream with the grant identification number RGPIN-2020-05513.
Data Availability Statement
The data of the study can be made available from the corresponding author (A.S.) upon reasonable request.
Conflicts of Interest
The authors declare no conflicts of interest.
Abbreviations
| AI | Artificial Intelligence |
| CDC | Cloud Data Center |
| CPU | Central Processing Unit |
| FL | Federated Learning |
| HDD | Hard-Disk Drive |
| IoT | Internet-of-Things |
| IT | Information Technology |
| KPI | Key Performance Indicator |
| MAE | Mean Absolute Error |
| MAPE | Mean Absolute Percentage Error |
| ML | Machine Learning |
| MSE | Mean Square Error |
| NIC | Network Interface Card |
| NSERC | Natural Sciences and Engineering Research Council of Canada |
| RAM | Random Accessible Memory |
| RMSE | Root Mean Square Error |
| SSD | Solid-State Drive |
Appendix A
Appendix A.1. Shift Logs
The workload shift logs by the proposed FL are available in Table A1.
Table A1.
Server workload shift logs with predicted savings.
Appendix A.2. Servers Status
Table A2.
Initial status of the servers (before FL).
Table A3.
Final status of the servers (after FL).
Appendix A.3. Key Performance Indicators (KPIs) Results
The KPIs results, derived by the proposed FL strategy, are manifested in Table A4.
Table A4.
Results of KPIs by the FL model.
References
- Xu, D.; Qu, M. Energy, environmental, and economic evaluation of a CCHP system for a data center based on operational data. Energy Build. 2013, 67, 176–186. [Google Scholar] [CrossRef]
- Cho, K.; Chang, H.; Jung, Y.; Yoon, Y. Economic analysis of data center cooling strategies. Sustain. Cities Soc. 2017, 31, 234–243. [Google Scholar] [CrossRef]
- Xie, Y.; Cui, Y.; Wu, D.; Zeng, Y.; Sun, L. Economic analysis of hydrogen-powered data center. Int. J. Hydrogen Energy 2021, 46, 27841–27850. [Google Scholar] [CrossRef]
- Li, C.; He, W.; Cao, E. Impact of green data center pilots on the digital economy development: An empirical study based on dual machine learning methods. Comput. Ind. Eng. 2025, 201, 110914. [Google Scholar] [CrossRef]
- Shehabi, A.; Smith, S.J.; Masanet, E.; Koomey, J. Data center growth in the United States: Decoupling the demand for services from electricity use. Environ. Res. Lett. 2018, 13, 124030. [Google Scholar] [CrossRef]
- Ebrahimi, K.; Jones, G.F.; Fleischer, A.S. Thermo-economic analysis of steady state waste heat recovery in data centers using absorption refrigeration. Appl. Energy 2015, 139, 384–397. [Google Scholar] [CrossRef]
- Lykou, G.; Mentzelioti, D.; Gritzalis, D. A new methodology toward effectively assessing data center sustainability. Comput. Secur. 2018, 76, 327–340. [Google Scholar] [CrossRef]
- Sermet, Y.; Demir, I. A semantic web framework for automated smart assistants: A case study for public health. Big Data Cogn. Comput. 2021, 5, 57. [Google Scholar] [CrossRef]
- Yang, J.; Xiao, W.; Jiang, C.; Hossain, M.S.; Muhammad, G.; Amin, S.U. Ai-powered green cloud and data center. IEEE Access 2018, 7, 4195–4203. [Google Scholar] [CrossRef]
- Richins, D.; Doshi, D.; Blackmore, M.; Nair, A.T.; Pathapati, N.; Patel, A.; Daguman, B.; Dobrijalowski, D.; Illikkal, R.; Long, K.; et al. Ai tax: The hidden cost of ai data center applications. ACM Trans. Comput. Syst. (TOCS) 2021, 37, 1–32. [Google Scholar] [CrossRef]
- Lu, W.; Liang, L.; Kong, B.; Li, B.; Zhu, Z. AI-assisted knowledge-defined network orchestration for energy-efficient data center networks. IEEE Commun. Mag. 2020, 58, 86–92. [Google Scholar] [CrossRef]
- Liu, Y.; Du, H.; Niyato, D.; Kang, J.; Xiong, Z.; Wen, Y.; Kim, D.I. Generative AI in data center networking: Fundamentals, perspectives, and case study. IEEE Netw. 2025. [Google Scholar] [CrossRef]
- Marahatta, A.; Xin, Q.; Chi, C.; Zhang, F.; Liu, Z. PEFS: AI-driven prediction based energy-aware fault-tolerant scheduling scheme for cloud data center. IEEE Trans. Sustain. Comput. 2020, 6, 655–666. [Google Scholar] [CrossRef]
- Davenport, C.; Singer, B.; Mehta, N.; Lee, B.; Mackay, J.; Modak, A.; Corbett, B.; Miller, J.; Hari, T.; Ritchie, J.; et al. AI, Data Centers and the Coming US Power Demand Surge. Goldman Sachs. 2024. Available online: https://www.spirepointpc.com/documents/FG/spirepoint/resource-center/629373_Generational_Growth__AI_data_centers_and_the_coming_US_power_demand_surge.pdf (accessed on 28 April 2024).
- Moss, S.; Trueman, C. Goldman Sachs: $1tn to Be Spent on AI Data Centers, Chips, and Utility Upgrades, with “Little to Show for It So Far”; Data Center Dynamics: London, UK, 2024. [Google Scholar]
- Van Geet, O.; Sickinger, D. Best Practices Guide for Energy-Efficient Data Center Design; Technical Report; National Renewable Energy Laboratory (NREL): Golden, CO, USA, 2024.
- del Rio, A.; Conti, G.; Castano-Solis, S.; Serrano, J.; Jimenez, D.; Fraile-Ardanuy, J. A guide to data collection for computation and monitoring of node energy consumption. Big Data Cogn. Comput. 2023, 7, 130. [Google Scholar] [CrossRef]
- Chidolue, O.; Ohenhen, P.E.; Umoh, A.A.; Ngozichukwu, B.; Fafure, A.V.; Ibekwe, K.I. Green data centers: Sustainable practices for energy-efficient it infrastructure. Eng. Sci. Technol. J. 2024, 5, 99–114. [Google Scholar] [CrossRef]
- Rostami, S.; Down, D.G.; Karakostas, G. Linearized Data Center Workload and Cooling Management. IEEE Trans. Autom. Sci. Eng. 2024, 22, 3502–3514. [Google Scholar] [CrossRef]
- Ali, A.; Özkasap, Ö. Spatial and thermal aware methods for efficient workload management in distributed data centers. Future Gener. Comput. Syst. 2024, 153, 360–374. [Google Scholar] [CrossRef]
- Cao, Y.; Cao, F.; Wang, Y.; Wang, J.; Wu, L.; Ding, Z. Managing data center cluster as non-wire alternative: A case in balancing market. Appl. Energy 2024, 360, 122769. [Google Scholar] [CrossRef]
- Chen, D.; Ma, Y.; Wang, L.; Yao, M. Spatio-temporal management of renewable energy consumption, carbon emissions, and cost in data centers. Sustain. Comput. Inform. Syst. 2024, 41, 100950. [Google Scholar] [CrossRef]
- Su, C.; Wang, L.; Sui, Q.; Wu, H. Optimal scheduling of a cascade hydro-thermal-wind power system integrating data centers and considering the spatiotemporal asynchronous transfer of energy resources. Appl. Energy 2025, 377, 124360. [Google Scholar] [CrossRef]
- Khalil, M.I.K.; Ahmad, I.; Almazroi, A.A. Energy Efficient Indivisible Workload Distribution in Geographically Distributed Data Centers. IEEE Access 2019, 7, 82672–82680. [Google Scholar] [CrossRef]
- Hogade, N.; Pasricha, S.; Siegel, H.J. Energy and Network Aware Workload Management for Geographically Distributed Data Centers. IEEE Trans. Sustain. Comput. 2022, 7, 400–413. [Google Scholar] [CrossRef]
- Forestiero, A.; Mastroianni, C.; Meo, M.; Papuzzo, G.; Sheikhalishahi, M. Hierarchical Approach for Efficient Workload Management in Geo-Distributed Data Centers. IEEE Trans. Green Commun. Netw. 2017, 1, 97–111. [Google Scholar] [CrossRef]
- Ahmad, I.; Khalil, M.I.K.; Shah, S.A.A. Optimization-based workload distribution in geographically distributed data centers: A survey. Int. J. Commun. Syst. 2020, 33, e4453. [Google Scholar] [CrossRef]
- Chen, T.; Wang, X.; Giannakis, G.B. Cooling-Aware Energy and Workload Management in Data Centers via Stochastic Optimization. IEEE J. Sel. Top. Signal Process. 2016, 10, 402–415. [Google Scholar] [CrossRef]
- Safari, A.; Sorouri, H.; Rahimi, A.; Oshnoei, A. A Systematic Review of Energy Efficiency Metrics for Optimizing Cloud Data Center Operations and Management. Electronics 2025, 14, 2214. [Google Scholar] [CrossRef]
- Möbius, C.; Dargie, W.; Schill, A. Power consumption estimation models for processors, virtual machines, and servers. IEEE Trans. Parallel Distrib. Syst. 2013, 25, 1600–1614. [Google Scholar] [CrossRef]
- Salmanian, Z.; Izadkhah, H.; Isazadeh, A. Optimizing web server RAM performance using birth–death process queuing system: Scalable memory issue. J. Supercomput. 2017, 73, 5221–5238. [Google Scholar] [CrossRef]
- Wang, S.; Lu, Z.; Cao, Q.; Jiang, H.; Yao, J.; Dong, Y.; Yang, P. BCW: Buffer-Controlled Writes to HDDs for SSD-HDD Hybrid Storage Server. In Proceedings of the USENIX Conference on File and Storage Technologies, Santa Clara, CA, USA, 24–27 February 2020. [Google Scholar]
- Zhan, J.; Jiang, W.; Li, Y.; Wu, J.; Zhu, J.; Yu, J. NIC-QF: A design of FPGA based Network Interface Card with Query Filter for big data systems. Future Gener. Comput. Syst. 2022, 136, 153–169. [Google Scholar] [CrossRef]
- Kim, D.; Liu, Z.; Zhu, Y.; Kim, C.; Lee, J.; Sekar, V.; Seshan, S. TEA: Enabling State-Intensive Network Functions on Programmable Switches. In Proceedings of the Annual Conference of the ACM Special Interest Group on Data Communication on the Applications, Technologies, Architectures, and Protocols for Computer Communication, Virtual Event USA, 10–14 August 2020. [Google Scholar]
- McMahan, B.; Moore, E.; Ramage, D.; Hampson, S.; y Arcas, B.A. Communication-efficient learning of deep networks from decentralized data. In Proceedings of the Artificial Intelligence and Statistics, PMLR, Fort Lauderdale, FL, USA, 20–22 April 2017; pp. 1273–1282. [Google Scholar]
- Zhang, C.; Xie, Y.; Bai, H.; Yu, B.; Li, W.; Gao, Y. A survey on federated learning. Knowl.-Based Syst. 2021, 216, 106775. [Google Scholar] [CrossRef]
- Safari, A.; Daneshvar, M.; Anvari-Moghaddam, A. Energy Intelligence: A Systematic Review of Artificial Intelligence for Energy Management. Appl. Sci. 2024, 14, 11112. [Google Scholar] [CrossRef]
- Dasi, H.; Ying, Z.; Ashab, M.F.B. Proposing hybrid prediction approaches with the integration of machine learning models and metaheuristic algorithms to forecast the cooling and heating load of buildings. Energy 2024, 291, 130297. [Google Scholar] [CrossRef]
- Indira, G.; Bhavani, M.; Brinda, R.; Zahira, R. Electricity load demand prediction for microgrid energy management system using hybrid adaptive barnacle-mating optimizer with artificial neural network algorithm. Energy Technol. 2024, 12, 2301091. [Google Scholar] [CrossRef]
- Hodson, T.O. Root mean square error (RMSE) or mean absolute error (MAE): When to use them or not. Geosci. Model Dev. Discuss. 2022, 2022, 5481–5487. [Google Scholar] [CrossRef]
- Tayalati, F.; Azmani, A.; Azmani, M. Application of supervised machine learning methods in injection molding process for initial parameters setting: Prediction of the cooling time parameter. Prog. Artif. Intell. 2024, 1–17, Erratum in Prog. Artif. Intell. 2024. [Google Scholar] [CrossRef] [PubMed]


Disclaimer/Publisher’s Note: The statements, opinions and data contained in all publications are solely those of the individual author(s) and contributor(s) and not of MDPI and/or the editor(s). MDPI and/or the editor(s) disclaim responsibility for any injury to people or property resulting from any ideas, methods, instructions or products referred to in the content. |
© 2025 by the authors. Licensee MDPI, Basel, Switzerland. This article is an open access article distributed under the terms and conditions of the Creative Commons Attribution (CC BY) license (https://creativecommons.org/licenses/by/4.0/).