Abstract
Detecting power transformer winding degradations at an early stage is very important for the safe operation of nuclear power plants. Most transformer failures are caused by insulation breakdown; the winding turn-to-turn short circuit fault is frequently encountered. Experience has shown that routine testing techniques, e.g., winding resistance, leakage inductance, and sweep frequency response analysis (SFRA), are not sensitive enough to identify minor turn-to-turn short defects. The SFRA technique is effective only if the fault is in such a condition that the flux distribution in the core is prominently distorted. This paper proposes the frequency domain reflectometry (FDR) technique for detecting and locating transformer winding defects. FDR measures the wave impedance and its change along the measured windings. The wire over a plane model is selected as the transmission line model for the transformer winding. The effectiveness is verified through lab experiments on a twist pair cable simulating the transformer winding and field testing on a real transformer. The FDR technique successfully identified and located the turn-to-turn short fault that was not detected by other testing techniques. Using FDR as a complementary tool for winding condition assessment will be beneficial.
1. Introduction
The safe operation of high voltage power transformers is one of the most mission-critical tasks in the nuclear industry and power grid. Unexpected transformer failures can cause the interruption of electricity supply and catastrophic failures of other apparatus. Detecting the incipient defects allows operators to take corrective action, thus reducing the failure risk. Several off-line testing techniques are often used in routine maintenance activity for transformer mechanical and insulation condition assessment, including winding resistance testing (WR), transformer turn ratio (TTR) testing, dissipation/power factor () testing, short circuit impedance testing and sweep frequency response analysis (SFRA). The SFRA method is well-accepted for transformer mechanical deformation detection [1,2,3] and core permeability and insulation condition characterization [4,5]. Interpreting the results of the frequency responses has posed many challenges in recent years. Many methods, such as electric circuit model-based techniques [6,7], statistical approaches [8,9], and the finite element method (FEM) [10], have been suggested for interpreting SFRA results. The advanced analysis approaches for SFRA results require complex mathematical calculations and experienced people.
Time domain reflectometry (TDR) is the most widely used technique for evaluating discontinuity problems within medium voltage cables [11]. There are two types of TDR instruments, i.e., the impulse and step type, as shown in Figure 1. Impulse type TDR sends a voltage pulse with an adjustable width into the test object, while step TDR injects a voltage step with a fast rise time. A reflection will be seen if there is any impedance change within the test object. Impulse type TDR instruments are more frequently used in field applications. Commercial TDR instruments can output a voltage pulse with ca. 100 V magnitude and 20 ps–10 ns pulse width. Previous research has investigated transformer winding fault evaluation using the TDR technique. The effectiveness of the winding fault located using a fast-rising step voltage has been successfully verified by the simulation [12]. The voltage pulse method also worked well for locating the inter-turn fault in a simple winding sample [13]. There was an attempt to combine the advantages of SFRA and TDR methods for easier and more reliable detection and localization of the faults in transformer windings [14]. The TDR result was more intuitive but could be disturbed by the inhomogeneity winding structure and strong signal distortion. However, the authors still believed that certain approaches could solve these problems.
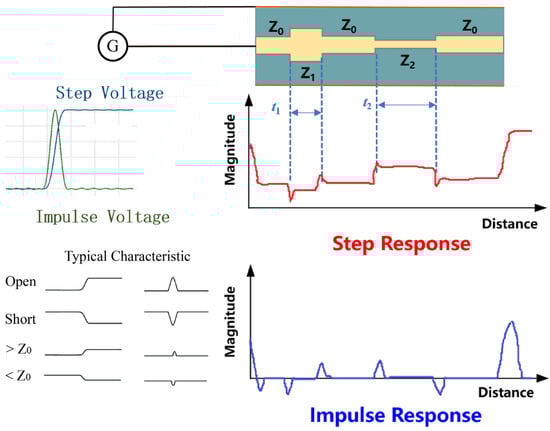
Figure 1.
Principle of TDR and the typical fault characteristics.
There are three major problems that undermine the TDR effectiveness in power transformer fault locating. Firstly, the reflected voltage signal is subject to distortion and attenuation during propagation since the winding consists of inductive loops capacitively coupled to each other and to the ground. It is hard to accurately measure the reflected signal due to the signal–to–noise limitation of the TDR instrument [15]. Secondly, the spatial resolution and the blind spot problem reduce the locating accuracy [16,17]. Thirdly, the TDR technique is considered to be relatively insensitive to subtle changes in insulation properties [18]. It is mostly used to locate open circuits, connectors, and low resistance faults (less than 100 Ω) rather than condition diagnosis.
Due to those limitations of the TDR technique, the SFRA technique becomes the prevailing technique for transformer winding deformation diagnosis. However, interpreting the SFRA results is usually complex nd controversial [19,20,21]. As SFRA measures the average transformer condition, characteristics of deteriorations at an early stage might be ignored after averaging with the healthy bulk. Moreover, the characteristic changes may also be caused by other factors that are not related to any fault, such as measurement setup, grounding practice, residual flux, or construction difference [22].
The FDR became more refined and accessible with advances in electronics and signal processing in subsequent decades, which led to its broader application. In 2004, researchers from the nuclear industry started to explore a new technology, line impedance resonance analysis (LIRA), for cable local degradation locating and aging evaluation. The principal improvement was the signal analysis algorithm, converting the frequency domain measurement results into the time domain. It makes the LIRA technology superior to TDR in cable fault detection sensitivity and spatial resolution [23]. Both FDR and LIRA techniques perform measurements in the frequency domain and then convert the results into the time domain. The sensitivity in subtle impedance change detection is thus considerably enhanced [18,24]. The frequency range of the hardware used in this project reaches 9 kHz–4.5 GHz with a maximum dynamic range of −140 dB. This makes the FDR technology not only suited for cables but also for transformers, generators, and those unshielded objects. The sweep point reaches 100,000, which gives a spatial resolution better than 0.1 m for most test objects. All the testing techniques discussed in this paper are off-line testing techniques. The transformer needs to be shut down and isolated from the power network.
2. Theory and Modeling
FDR measures the wave impedance of the transformer winding in frequency domain and then converts the result into time domain for analysis. The principle is described in the first section of this chapter. The transformer winding structure is much more complicated than that of the coaxial cable. The equivalent circuit and transmission line model are analyzed in the second section to understand winding characteristics at high frequencies better.
2.1. Measurement and Conversion
The FDR instrument essentially consists of a vector network analyzer (VNA) modular combined with data analysis software. As the remote end of the test object in the field is often not available, the single-end parameter, , is selected. is defined as the ratio of the voltage coming out of port 1 to the voltage going into port 1. It is also known as the reflection coefficient written as Γ. The testing procedure is illustrated in Figure 2. The VNA injects a series of broadband sinusoidal voltages Figure 2a into one terminal of the test object and records the values over the swept frequency range. The deterioration of the test object changes the frequency domain results, as indicated by Figure 2c,d but the location information is not available yet. The time–magnitude data in Figure 2b is obtained after performing the frequency-to-time domain conversion. The TDR-like result provides a more intuitive representation of the discontinuities along the test object. The severity of deterioration and its location can be identified by either investigating the reflection characteristic or comparing it with the baseline. The x-axis changes to distance by multiplying the time data by half of the wave propagation speed.
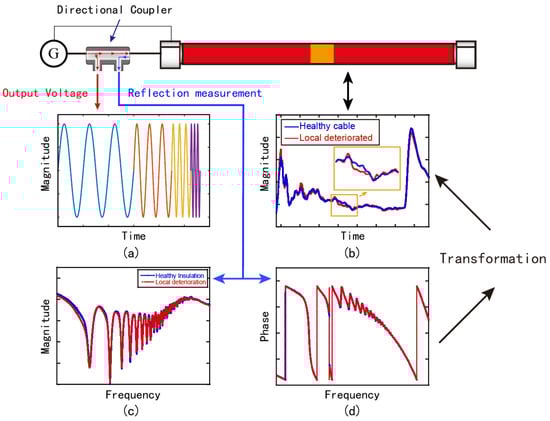
Figure 2.
FDR principle: (a) VNA output—a series of sinusoidal voltages at various frequencies; (b) final results—time–magnitude trace; (c) reflection coefficient—magnitude; (d) reflection coefficient phase.
There are several alternatives to achieving frequency-to-time domain conversion. Most algorithms, e.g., LIRA, are protected by patents. Keysight VNA software integrates the inverse Fourier transformation given by Equation (1) to calculate the reflection parameter in the time domain. The chirp–Z algorithm is based on the fast Fourier transformation (FFT); the derivation is given in [25]. One research work uses the FFT with window functions such as Kaiser, Hanning, and Chebyshev windows to improve the fault characteristics display quality [26].
The TDR-like display provides a more intuitive representation of the discontinuities in the test object. The distance is calculated by multiplying the time (x-axis after transformation) by half of the wave propagation speed. The FDR resolution and range are given by the following equations [27]:
where is the propagation speed for the test object (expressed as a faction of the light speed ), is the bandwidth of the measurement, and is the number of sweep points. The spectrums of the FDR output and two TDR pulses with a pulse width of 20 and 10 , respectively, are shown in Figure 3. The equivalent voltage magnitude and energy of the FDR output are much higher.
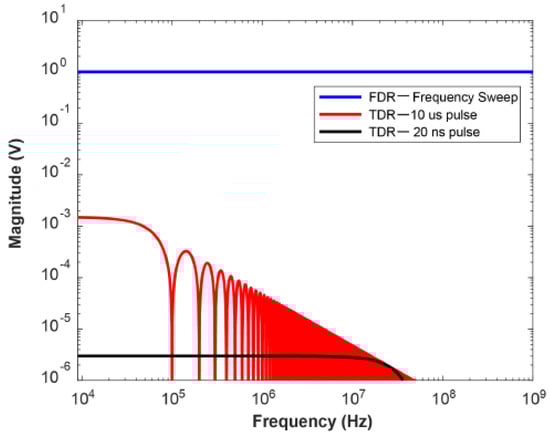
Figure 3.
The spectrums of three output signals: FDR frequency sweep signal with a magnitude of 1 V; two TDR pulses with the magnitude of 150 V, and pulse widths of 20 and 10 , respectively.
2.2. Transmission Line Model
The key difference between the lumped-element model and the transmission line model is the electrical size. The lumped-element model is a simplified representation of a physical system or circuit that assumes all components are concentrated at a single point, and idealized mathematical models can describe their behavior. The transmission line model is a distributed-element model, where voltages and currents vary in magnitude and phase over the object length.
The transformer winding structure is illustrated in Figure 4. Each disk contains a number of turns. An infinitesimal length can be modeled as a lumped-element circuit, which is then cascaded to the actual winding length, as shown in Figure 5. The winding conductor has a weak coupling with the tank/ground. So, the circuit elements are determined by the wire over a ground plane model [28].
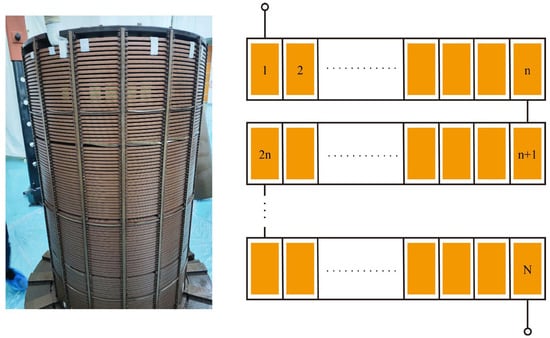
Figure 4.
Transformer winding structure.
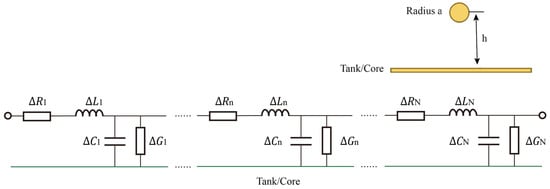
Figure 5.
Transformer winding transmission line model—wire over a plane model.
- Inductance : determined by the geometry (conductor radius and height );
- Resistance : determined by the winding conductivity;
- Capacitance : determined by the geometry and insulation property ;
- Loss: determined by the insulation loss.
In the radio frequency range, the core permeability decays to a low level that is close to that of air [5], and the insulation loss () of the oil–paper system is less than [29]. The wave impedance is thus approximated by a lossless model as follows:
A periodic change in the conductor to tank/core distance, i.e., turn-to-ground capacitance, is presented due to the winding arrangement.
The change in local wave impedance due to deterioration or aging causes a reflection at the interface. The reflection coefficient is the ratio of reflected wave magnitude to the incident, which is equivalent to in frequency domain. It is a more frequently used parameter in the time domain to express the step response. The relationship between the wave impedance mismatching and reflection coefficient is given by the following:
The wave propagation speed is determined by the permittivity and permeability, which is given by the following:
3. Results
This section includes the experiment results of a twist pair cable in the lab and practical measurement results in the field. A twist pair cable is used to study the property of the wire over a plane model. A 110 kV transformer tripped due to a short circuit fault in the power system. Various tests, including FDR, were performed before scraping for visual inspection.
The display of the FDR result consists of three traces, i.e., the step response, the impulse response, and the magnitude (dB). The step response represents the wave impedance along the object length, as expressed by Equation (5). The impulse response represents the wave impedance change. These two presentations are equivalent to the TDR display format. The magnitude (dB) is the specific result presentation method for the FDR technique [30].
3.1. Twist Pair Cable
A twist pair cable was used to simulate the multi-strand winding conductor. The aluminum foil was placed under the cable and grounded, acting as the transformer tank/core. The proposed transmission line model only takes the turn-to-ground capacitance into consideration but omits the turn-to-turn capacitance. To study the impact of the turn-to-turn capacitance, the cable was laid in three ways as shown in Figure 6: (a) placed above the foil, straightly laid; (b) placed above the foil, circularly laid. The impact of the turn-to-turn capacitance increases gradually. The circularly laid case approximates the real transformer winding arrangement, where the turn-to-turn capacitance is not negligible.
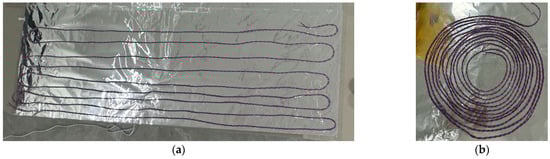
Figure 6.
Cable laid in two different ways to study the impact of the turn-to-turn capacitance: (a) placed above the foil, straightly laid; (b) placed above the foil, circularly laid.
The FDR results of the core-to-ground measurements are shown in Figure 7. The wave propagation speed was set to 195 m/μs so that the measured length was equal to 16 m (physical length) when the cable was floating. The reflections at the start and end terminal are easy to distinguish. When the cable is straightly laid on the foil, the turn-to-ground capacitance increases and the wave impedance is reduced. The reflection magnitude differences between the terminals and cable body become more prominent. The circularly laid cable was measured twice with the end terminal open and short to ground, respectively, so that the end could be better presented. The pattern changed considerably compared to the prior cases. The good news is that the wave propagation speed was consistent in three setups, as the measured lengths were almost identical. As a result, condition evaluation can be achieved by comparing over time or with a similar object. Fault locating accuracy is not affected by the turn-to-turn capacitance.
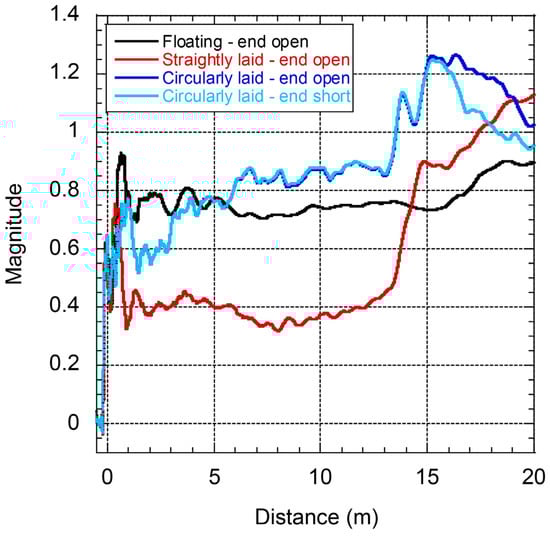
Figure 7.
Single core to ground FDR results of the cable with different laying conditions—step response.
The high and low resistance to ground faults were created to study their impacts on FDR results: the step response, impulse response, and magnitude (dB). The magnitude of the step response shown in Figure 8a dropped dramatically when the low resistance to ground fault was present. The high resistance to the ground fault introduced a slight but consistent magnitude drop from the fault point to the end. The patterns of the impulse response in Figure 8b were quite difficult to observe. The fluctuation of the healthy part could be more than the pattern change caused by faults. For the magnitude (dB) results in Figure 8c, the low resistance fault increased the magnitude and changed the pattern in the fault area. The high resistance fault does not change the magnitude much but causes the distance shift in peaks and valleys. One can observe the high resistance fault by zooming in on the adjacent fault area, as shown in Figure 8d. The lab experiments have shown that the magnitude (dB) trace is able to present a 2 MΩ resistive fault. The detection sensitivity is better if a fault causes the local capacitance or inductance change.
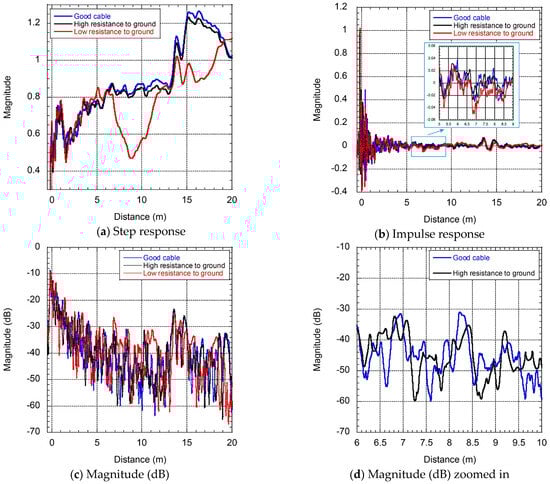
Figure 8.
FDR results of the circularly laid cable with different fault conditions.
3.2. Power Transformer
A 110 kV, 50 MW transformer was tripped by the gas and differential relays due to the A-to-B-to-ground short circuit fault in the power system. The fault introduced a peak current of 39.58 kA on phase ab of the LV side, which was three times the nominal current. A short-to-ground current was also detected on the HV side Phase B, and the current reached 9762 A, which was 10 times the nominal. The transformer was first tested using routine testing techniques after the power outage. The results are listed in Appendix A, and the summary is as follows:
- The dissipation factor testing indicated the short circuit of the LV winding to the ground. The HV winding to LV winding and ground was good;
- The winding resistance results of the HV windings were good, with a maximum phase difference of 1.96%. The maximum difference between the LV windings was 69.9%, which indicated the existence of faults;
- The SFRA testing suggested that both windings were slightly distorted (suspected distortion). The deviation of the three phase responses started from 550 kHz.
The FDR instrument for field measurement and result analysis is the FDR−2000 Broadband Impedance Local Fault Locator developed by Suzhou Antai. It integrates a high-performance VNA modular with the best dynamic range of 140 dB and maximum sweep points of 100,000. The software used for results presentation and analysis is the Frequency Domain Reflectometry Analyzer version 2.3, which is installed in the embedded computer of the instrument.
The connection of the HV winding (star-connected), Phase A, is shown in Figure 9. The instrument injected a series of sinusoidal voltages (3–5 Vpp) to the test object. The test signal was applied to the phase winding conductor and tank (ground). The incident wave first passed through the Phase A winding conductor, then to the parallel windings of Phase B and C that were connected with the neutral (N). The other two phases were tested by connecting the red clip to the corresponding winding terminal.
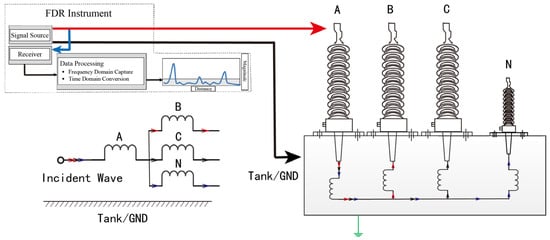
Figure 9.
Connection to the Phase A winding on the HV side and the corresponding wave propagation path.
The frequency domain data are the magnitude and phase of the scattering parameter over the measured frequencies. The results of the HV winding are shown in Figure 10. Apparent deviation of the Phase B response was observed starting from 1 MHz. The frequency domain results did not provide any fault location information.
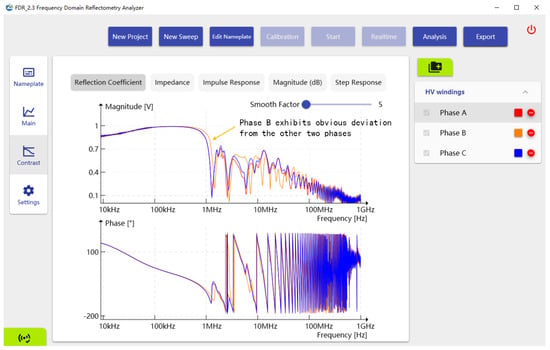
Figure 10.
Frequency domain results of the HV winding—magnitude and phase of the scatter parameter vs. frequency.
The FDR results obtained after the frequency to time domain conversion are shown in Figure 11 and Figure 12. The step response result shows that the Phase B trace started to deviate from the other two phases at 16 m, and the conductor length became shorter. This was a clear indication of the turn-to-turn short. A prominent localized reflection peak could be observed from the magnitude response of Phase B.
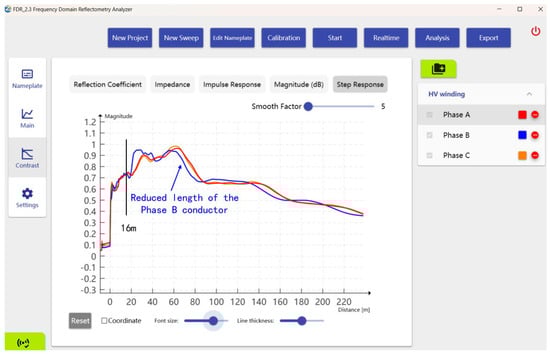
Figure 11.
Step response of the HV winding.
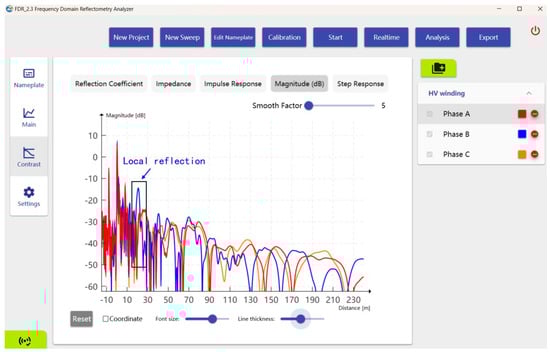
Figure 12.
Magnitude (dB) response of the HV winding.
The LV winding is delta-connected. The connection for phase ab FDR testing is shown in Figure 13. For this specific transformer, each measurement on the low voltage side contained the reflections from two parallel windings. Without comparison, one cannot determine which winding causes the reflection.
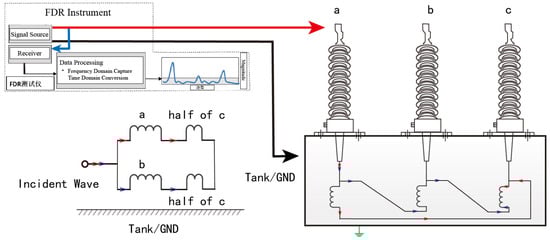
Figure 13.
Connection to the LV winding and the wave propagation path.
The frequency domain data of the LV winding is shown in Figure 14. Very slight disagreements between the three phases were observed in the frequency range of 60–100 MHz.
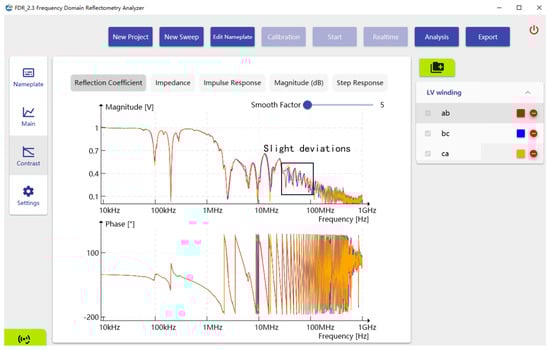
Figure 14.
Frequency domain results of the LV winding—magnitude and phase of the scatter parameter vs. frequency.
The FDR results are shown in Figure 15 and Figure 16. Only two traces were selected for comparison: connecting to the phase b terminal gave the response of the phase b winding in parallel with the phase c winding; connecting to the phase c terminal gave the response of the phase c winding in parallel with the phase a winding. The comparison of the two selected traces was equivalent to comparing phase a and b windings.
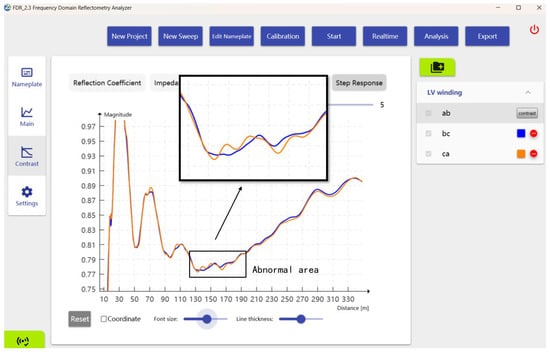
Figure 15.
Step response of the LV winding—phase b and phase a are compared.
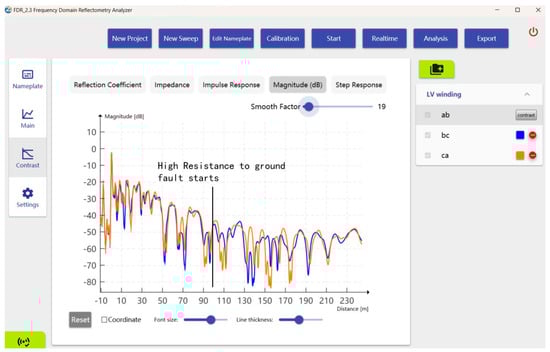
Figure 16.
Magnitude response of the LV winding—phase b and phase a are compared.
The responses of the two phases were almost identical, except for some fluctuations in a small area from 90 m to 180 m. The magnitude showed high resistance to the ground fault characteristic (shift in peaks and valleys in the x-axis) at 90 m. The traces match again after 180 m.
The transformer was designated for scrapping, which provides a good opportunity to verify the effectiveness of various testing techniques. After completing all the routine testing, the transformer tank was removed to visually inspect the winding condition. The Phase A and C windings of the HV side were intact, while flashover marks were found in the Phase B winding, as shown in Figure 17. The flashover location was on the first winding disk, physically about 15 m from the terminal. The turn-to-turn short fault was confirmed.
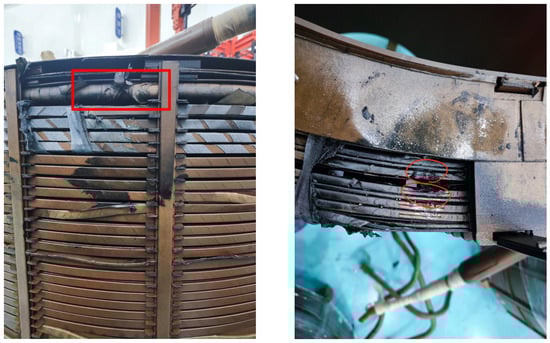
Figure 17.
Flashover marks were found in the Phase B winding located 15 m from the terminal.
The phase b winding of the LV side was also partially damaged by the external fault. The burning and displacement occurred between the 4th and 5th disk, as shown in Figure 18. The fault was severe, but the damaged area was not significant. The fault phase gave the highest DC resistance readings, which indicated a poor contact problem rather than a turn-to-turn short fault.
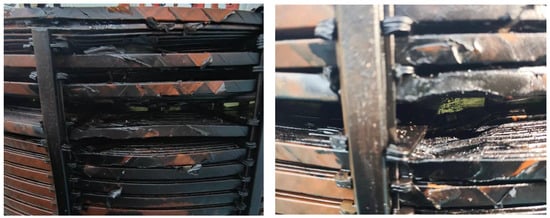
Figure 18.
Local deformation of the phase b winding.
4. Discussion
The interpretation of the results in this case study was achieved by comparing the responses of three phases—the location where the deviation between the three phases started indicated the fault location. The actual fault distance (15 m) and measurement result (16 m) were not exactly equal. The errors might have been caused by the high voltage leads, the uncertainty of the wave propagation speed, etc. The wave propagation speed was not constant due to the complex winding structure. The locating accuracy was acceptable in this case, as the faults were quite close to the measurement terminal. It might be better to express the fault location using a relative parameter, e.g., the percentage of the total winding conductor length. To achieve that, the HV winding end needs to be confirmed by comparing two measurements with the neutral terminal open and shorted to ground, respectively. The LV winding end can be shorted to the ground by connecting the adjacent terminal to the transformer tank.
The proposed transmission line model is a simplification as the capacitive and inductive coupling between adjacent unshielded winding conductors was not considered. For a better prediction of the wave impedance characteristics, the accurate high frequency model [31] shall be applied.
The repeatability problem at the high frequencies encountered in the SFRA applications also existed in the FDR measurements. The frequency domain results were affected by the test setup and grounding practice. However, after conversion, the impact of the connection only changed the time domain results near the starting point. The deviation decayed quickly as the distance increased, which did not introduce much difficulty in the result interpretation.
5. Conclusions
FDR is an extension of the SFRA technique with the upper frequency limit enhanced to the GHz range. By converting the frequency domain data into the time domain, the defect location can be obtained either through trending or comparing three phases. The experiment on a twist pair cable simulating the transformer winding suggests that the cable transmission line models are unsuitable for the transformer winding. The capacitance between the conductor turns and winding disks led to a complicated wave propagation mode. However, the geometry only caused a minor propagation speed variation. The defect could be identified and located via comparison to the baseline.
A transformer tripped due to an external short circuit fault was thoroughly investigated using various testing techniques, including FDR. The FDR results clearly identified the turn-to-turn short fault of the Phase B winding on the HV side, which was not detected by other testing techniques. The high resistance fault to the ground of the phase b winding on the LV side was also located by FDR. The diagnosis of high resistance fault needs experience as the characteristic is not as prominent as the turn-to-turn short fault. The FDR technique was a low voltage (3–5 Vpp) testing technique, which meant breakdown would not happen during the measurement. The short-to-ground fault might have been restored to a high resistance nature after the power was cut off.
More research on the wave propagation mode in the complex transformer winding circuit is needed. The propagation speed was set as 200 m/μs for the investigated transformer. The accurate wave propagation speed in the transformer winding could be determined by measuring a winding with a known length. The impact of transformer geometry also needs to be studied in the future.
Author Contributions
Conceptualization, Y.Z. and D.Z.; methodology, H.Y., Y.S. and L.W.; software and instrument, J.C.; validation, Y.Z. and L.W.; formal analysis, L.X. and J.C.; investigation, H.Y. and Y.S.; writing, H.Y.; review and editing, J.C. and D.Z. All authors have read and agreed to the published version of the manuscript.
Funding
This research received no external funding.
Data Availability Statement
Data are contained within the article.
Conflicts of Interest
Authors Hao Yun, Yizhou Zhang, Yufei Sun and Liang Wang were employed by the company China Nuclear Power Operation Technology Co., Ltd. Author Jialu Cheng was employed by the company Suzhou Antai Electric Power Technology Co., Ltd. The remaining authors declare that the research was conducted in the absence of any commercial or financial relationships that could be construed as a potential conflict of interest.
Appendix A
This part summarizes the routine testing results of the fault transformer.

Table A1.
HV winding DC resistance results.
Table A1.
HV winding DC resistance results.
| Tap No./Resistance () | A-N | B-N | C-N | Difference (%) |
|---|---|---|---|---|
| 1 | 480.1 | 477.1 | 484.2 | 1.41 |
| 9 (Nominal) | 428.4 | 430.1 | 434.7 | 1.40 |
| 17 | 479.1 | 481.4 | 480.2 | 0.42 |
Table A2.
LV winding DC resistance results.
Table A2.
LV winding DC resistance results.
| Tap No./Resistance () | A-N | B-N | C-N | Difference (%) |
|---|---|---|---|---|
| 1 | 8.928 | 17.04 | 8.912 | 69.9 |
Table A3.
HV winding leakage impedance results.
Table A3.
HV winding leakage impedance results.
| Tap No./Resistance () | A-N | B-N | C-N | Difference (%) |
|---|---|---|---|---|
| 9 (Nominal) | 27.611 | 28.30 | 27.568 | 1.90 |
Table A4.
Dissipation factor () testing results.
Table A4.
Dissipation factor () testing results.
| Capacitance | ||
|---|---|---|
| CHL + CHG | 10,120 | 0.241 |
| CLH + CLG | / 1 | / 1 |
1 Not measured due to low resistance to ground.

Figure A1.
SFRA results of the HV windings: suspected (light) distortion.

Figure A2.
SFRA results of the LV windings: suspected (light) distortion.
References
- Dick, E.P.; Erven, C.C. Transformer diagnostic testing by frequency response analysis. IEEE Trans. Power Syst. 1978, 97, 2144–2150. [Google Scholar] [CrossRef]
- Bagheri, M.; Naderi, M.S.; Blackburn, T.; Phung, T. FRA vs. short circuit impedance measurement in detection of mechanical defects within large power transformer. In Proceedings of the IEEE International Symposium on Electrical Insulation, San Juan, PR, USA, 10–13 June 2012; pp. 301–305. [Google Scholar]
- Moradzadeh, A.; Pourhossein, K.; Mohammadi-Ivatloo, B.; Mohammadi, F. Locating inter-turn faults in transformer windings using isometric feature mapping of frequency response traces. IEEE Trans. Ind. Inform. 2021, 17, 6962–6970. [Google Scholar] [CrossRef]
- Abeywickrama, K.G.N.B.; Serdyuk, Y.V.; Gubanski, S.M. Exploring possibilities for characterization of power transformer insulation by frequency response analysis (FRA). IEEE Trans. Power Deliv. 2006, 21, 1375–1382. [Google Scholar] [CrossRef]
- Abeywickrama, K.G.N.B.; Daszczynski, T.; Serdyuk, Y.V.; Gubanski, S.M. Determination of Complex Permeability of Silicon Steel for Use in High-Frequency Modeling of Power Transformers. IEEE Trans. Magn. 2008, 44, 438–444. [Google Scholar] [CrossRef]
- Miyazaki, S.; Mizutani, Y.; Okamoto, T.; Wada, Y.; Hayashida, C. Abnormality diagnosis of transformer winding by frequency response analysis (FRA) using circuit model. In Proceedings of the IEEE International Conference on Condition Monitoring and Diagnosis, Bali, Indonesia, 23–27 September 2012; pp. 273–276. [Google Scholar]
- Gonzales, J.C.; Mombello, E.E. Diagnosis of power transformers through frequency response analysis by poles and zeros shifts identification. In Proceedings of the Sixth IEEE/PES Transmission and Distribution: Latin America Conference and Exposition (T&D-LA), Montevideo, Uruguay, 3–5 September 2012; pp. 1–8. [Google Scholar]
- Bigdeli, M.; Azizian, D.; Gharehpetian, G.B. Detection of probability of occurrence, type and severity of faults in transformer using frequency response analysis based numerical indices. Measurement 2021, 168, 108322. [Google Scholar] [CrossRef]
- Abbasi, A.R.; Mahmoudi, M.R.; Avazzadeh, Z. Diagnosis and clustering of power transformer winding fault types by crosscorrelation and clustering analysis of FRA results. IET Gener. Transm. Distrib. 2018, 12, 4301–4309. [Google Scholar] [CrossRef]
- Shamlou, A.; Feyzi, M.R.; Behjat, V. Interpretation of frequency response analysis of power transformer based on evidence theory. IET Gener. Transm. Distrib. 2019, 13, 3879–3887. [Google Scholar] [CrossRef]
- Eriksson, R.; Papazyan, R.; Mugala, G. Localization of Insulation Degradation in Medium Voltage Distribution Cables. In Proceedings of the 1st International Conference on Industrial and Information Systems ICIIS, Tirtayasa, Indonesia, 8–11 August 2006; pp. 167–172. [Google Scholar]
- Alzekri, S.Y.A. Internal Fault Location in Transformer Windings. Master’s Thesis, Western Michigan University, Kalamazoo, MI, USA, 2015. [Google Scholar]
- Rathod, V.B.; Kumbhar, G.B.; Bhalja, B.R. Inter-Turn Fault Localization in Transformer Winding based on Nanosecond Pulse Method. In Proceedings of the IEEE 6th International Conference on Condition Assessment Techniques in Electrical Systems (CATCON), Durgapur, India, 17–19 December 2022; pp. 254–257. [Google Scholar]
- Tavakoli, H.; Bormann, D.; Engdahl, G. Localization of mechanical deformations in transformer windings using time-domain representation of response functions. Int. Trans. Electr. Energy Syst. 2014, 24, 16–29. [Google Scholar] [CrossRef]
- Keysight Technologies Application Note: Time Domain Analysis Using a Network Analyzer. Available online: https://www.keysight.com/us/en/assets/7018-01451/application-notes/5989-5723.pdf (accessed on 22 September 2024).
- Glass, S.W.; Jones, A.M.; Fifield, L.S.; Hartman, T.S. Frequency domain reflectometry NDE for aging cables in nuclear power plants. AIP Conf. Proc. 2017, 1806, 080015. [Google Scholar]
- Lee, C.K.; Chang, S.J. A Method of Fault Localization Within the Blind Spot Using the Hybridization Between TDR and Wavelet Transform. IEEE Sens. J. 2021, 21, 5102–5110. [Google Scholar] [CrossRef]
- Glass, S.W.; Jones, A.M.; Fifield, L.S.; Hartman, T.S. Bulk and Distributed Electrical Cable Non–Destructive Examination Methods for Nuclear Power Plant Cable Aging Management Programs; Pacific Northwest National Laboratory: Richland, WA, USA, 2016; pp. 27–30. [Google Scholar]
- Satish, L.; Sahoo, S.K. An Effort to Understand What Factors Affect the Transfer Function of a Two-Winding Transformer. IEEE Trans. Power Deliv. 2005, 20, 1430–1440. [Google Scholar] [CrossRef]
- Wang, Z.D.; Li, J.; Sofian, D.M. Interpretation of Transformer FRA Responses—Part I: Influence of Winding Structure. IEEE Trans. Power Deliv. 2009, 24, 703–710. [Google Scholar] [CrossRef]
- Sofian, D.M.; Wang, Z.D.; Li, J. Interpretation of Transformer FRA Responses—Part II: Influence of Transformer Structure. IEEE Trans. Power Deliv. 2010, 25, 2582–2589. [Google Scholar] [CrossRef]
- The International Electrotechnical Commission (IEC). IEC 60076-18 Power transformers—Part 18: Measurement of Frequency Response, Edition 1.0; The International Electrotechnical Commission (IEC): Geneva, Switzerland, 2012. [Google Scholar]
- Fantoni, P.F. NPP Wire System Aging Assessment and Condition Monitoring: State-of-the-Art Report; Institutt for energiteknikk, OECD Halden Reactor Project: Halden, Norway, 2004. [Google Scholar]
- Chen, L.; Zhou, Y.; Zhang, W.; Ye, T.; Hu, Y.; Xu, Y. Comparison of Location Accuracy between Frequency Domain Reflectometry and Line Resonance Analysis for Power Cables. In Proceedings of the IEEE International Conference on High Voltage Engineering and Application (ICHVE), Beijing, China, 6–10 September 2020; pp. 1–4. [Google Scholar]
- Maier, T.; Leibfried, T.; Elcheroth, E. Mathematical–detection-algorithms for cable diagnostics and investigations with Line–Resonance–Analysis. In Proceedings of the International Conference on Condition Assessment Techniques in Electrical Systems (CATCON), Bangalore, India, 10–12 December 2015; pp. 40–45. [Google Scholar]
- Mu, H.B.; Zhang, H.T.; Zou, X.Y.; Zhang, D.N.; Lu, X.; Zhang, G.J. Sensitivity improvement in cable faults location by using broadband impedance spectroscopy with Dolph-Chebyshev window. IEEE Trans. Power Deliv. 2022, 37, 3846–3854. [Google Scholar] [CrossRef]
- MOHR Test and Measurement LLC Application Note: TDR vs. FDR: Distance to Fault. Available online: https://www.mohr-engineering.com/TDR_vs_FDR_Distance_to_Fault-A.php (accessed on 8 December 2024).
- Paul, R.C. Introduction to Electromagnetic Compatibility, 2nd ed.; John Wiley & Sons Inc.: Hoboken, NJ, USA, 2006; pp. 192–198. [Google Scholar]
- Cheng, J. Broadband Dielectric Properties of Impregnated Transformer Paper Insulation at Various Moisture Contents. Master’s Thesis, KTH Royal Institute of Technology, Stockholm, Sweden, 2011. [Google Scholar]
- Cheng, J.; Zhang, Y.; Yun, H.; Wang, L. A Study of Frequency Domain Reflectometry Technique for High-Voltage Rotating Machine Winding Condition Assessment. Machines 2023, 11, 883. [Google Scholar] [CrossRef]
- Abeywickrama, K.G.N.B.; Serdyuk, Y.V.; Gubanski, S.M. High-Frequency Modeling of Power Transformers for Use in Frequency Response Analysis (FRA). IEEE Trans. Power Deliv. 2008, 23, 2042–2049. [Google Scholar] [CrossRef]
Disclaimer/Publisher’s Note: The statements, opinions and data contained in all publications are solely those of the individual author(s) and contributor(s) and not of MDPI and/or the editor(s). MDPI and/or the editor(s) disclaim responsibility for any injury to people or property resulting from any ideas, methods, instructions or products referred to in the content. |
© 2025 by the authors. Licensee MDPI, Basel, Switzerland. This article is an open access article distributed under the terms and conditions of the Creative Commons Attribution (CC BY) license (https://creativecommons.org/licenses/by/4.0/).