Article

GreenRP: Task-Aware Discharge-Resilient Routing for Sustainable Edge AI in Satellite Optical Networks

by
Huibin Zhang
1,*,
Dandan Du
1,
Kunpeng Zheng
1,
Yuan Cao
2,
Lihan Zhao
1,
Yongli Zhao
1 and
Jie Zhang
1
1
State Key Laboratory of Information Photonics and Optical Communications, Beijing University of Posts and Telecommunications, Beijing 100876, China
2
School of Communications and Information Engineering, Nanjing University of Posts and Telecommunications, Nanjing 210003, China
*
Author to whom correspondence should be addressed.
Electronics 2025, 14(15), 3075; https://doi.org/10.3390/electronics14153075
Submission received: 30 June 2025 / Revised: 27 July 2025 / Accepted: 28 July 2025 / Published: 31 July 2025
(This article belongs to the Special Issue Security and Privacy in Emerging Edge AI Systems and Applications)

Abstract

Research in on-orbit processing enables edge AI deployment over satellite optical networks. However, these operations induce frequent battery discharge cycles, particularly depth-of-discharge (DoD) events, which accelerate degradation and curtail satellite longevity. To address this, we propose green task-aware routing planning (GreenRP), a task-aware routing framework that achieves sustainable edge AI through dynamic task offloading and discharge-resilient path orchestration. GreenRP employs a novel battery aging model explicitly coupling DoD effects with laser inter-satellite link dynamics under AI workloads, enhancing system sustainability. Comprehensive evaluation on a 1152-satellite constellation demonstrates that GreenRP extends network lifetime by 176% over shortest-path routing while meeting latency and completion rate targets. This work enables reliable edge AI via sustainable satellite resource utilization.

1. Introduction

Satellite optical networks (SONs) constitute critical infrastructure for global connectivity in the globalization era [1,2], addressing escalating demands through large-scale deployment. Unlike bandwidth-limited microwave-based systems, SONs leverage laser communication for high-capacity, low-latency transmission with inherent atmospheric interference resistance [3,4]. A pivotal transformation is underway as edge artificial intelligence (AI) evolves from terrestrial applications to space-based deployments, fundamentally redefining SON operational paradigms [5]. This transition is driven by two critical factors. First, mega-constellations are increasingly leveraging machine learning. They rely on it for dynamic resource allocation and interference management [6]. Second, multi-access edge computing platforms have been deployed on orbital nodes. These platforms enable the operation of latency-sensitive applications. Such applications include real-time Earth observation and distributed learning frameworks [7,8].
This computational migration introduces profound energy challenges. Satellite systems operate within stringent power constraints, alternating between solar-charging phases and battery-dependent eclipse periods [9]. Edge-AI workloads, and particularly compute-intensive operations like adaptive beamforming and channel prediction, generate stochastic power demands. These power demands induce deep discharge cycles during eclipse operations [10]. Frequent high-depth discharges accelerate lithium-ion battery degradation through irreversible electrochemical mechanisms, including cathode lattice destabilization and solid-electrolyte interphase growth [11]. The number of charge and discharge cycles of a battery is limited and is referred to as the cycle life. As the cycle life is consumed, the reliability of the power supply diminishes progressively. Once the reliability of a battery falls below a certain threshold, the satellite fails to operate correctly, thus jeopardizing the stability of the network. Therefore, minimizing the consumption of battery cycle life is crucial for extending the operational lifespan of satellite networks [12,13,14,15,16]. Consequently, exploring the balance between communication efficiency and energy efficiency for sustainable edge AI in SONs represents a significant scientific challenge.
Current energy optimization approaches exhibit fundamental limitations in addressing edge AI workloads. Device-level schemes successfully reduce computation energy but disregard LISL power dynamics during AI data exchange [17,18,19]. Network-level routing protocols effectively balance battery usage yet remain oblivious to task criticality distinctions—failing to differentiate between latency-sensitive operations like disaster response and delay-tolerant activities like model training [20,21,22,23,24]. Topology control mechanisms lack computation-aware dormancy strategies, deactivating links without consideration for AI workflow phases. This landscape reveals a critical research gap: the absence of integrated solutions that jointly optimize computation offloading, DoD-resilient routing, and battery-aging-aware topology control specifically for edge AI sustainability.
To address these challenges, we propose green task-aware routing planning (GreenRP), a task-aware routing plan designed to enable sustainable edge AI through synergistic mechanisms. The framework dynamically offloads computation-intensive tasks from energy-constrained satellites to resource-rich neighbors, strategically redistributing workloads. A classic validated battery aging model is also employed to enhance the credibility of the proposed scheme, given its capability to accurately capture the dynamic degradation characteristics of satellite batteries under varying operational conditions [21]. Simultaneously, it orchestrates discharge-resilient paths that prioritize latency-sensitive AI flows along shallow-discharge routes while implementing payload-aware topology pruning to deactivate non-critical LISLs during computation lulls. Central to this approach is a novel battery aging model that explicitly couples DoD stress profiles with LISL power transients under characteristic AI workloads. The main contributions of this work are as follows:
  • Development of a comprehensive energy-efficient routing model that integrates satellite energy dynamics with operational strategies to optimize network longevity and performance in edge-AI-driven SONs;
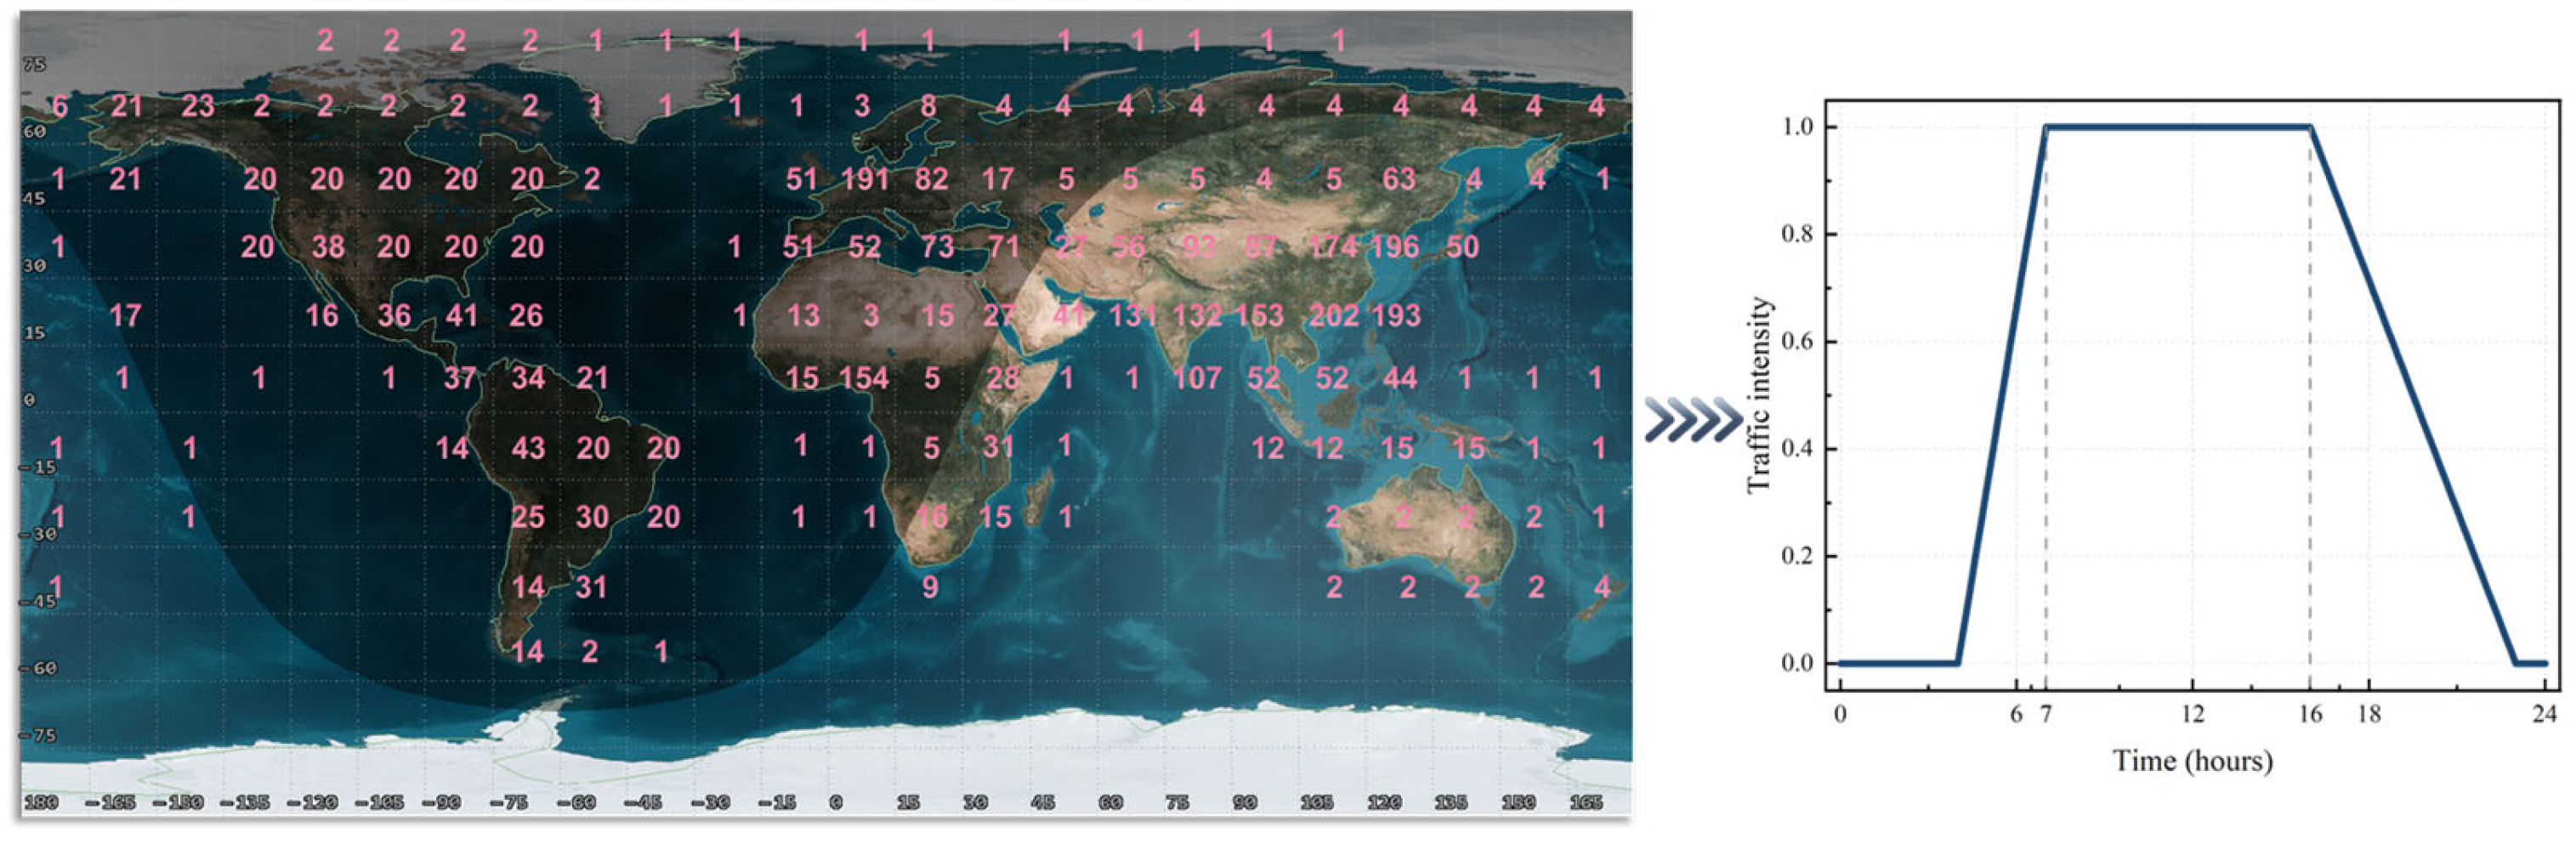
  • Introduction of a global traffic model that addresses spatial and temporal imbalances in traffic demands, incorporating load dormancy strategies to enhance edge AI sustainability;
  • Proposal of a novel topology planning scheme leveraging payload dormancy to minimize energy consumption in large-scale satellite constellations;
  • Design of the green task-aware routing planning (GreenRP) algorithm, validated through extensive simulations to optimize network performance and energy utilization.
The organization of the remainder of this paper is as follows: Section 2 analyzes energy bottlenecks in edge-AI-driven SONs, examining operational constraints and battery degradation mechanisms. Section 3 details GreenRP’s architectural design, including its task-offloading engine and aging-aware routing protocols. Performance evaluation and analysis are presented in Section 4. Finally, Section 5 concludes the study.

2. Energy Efficiency Landscape

This section explores the energy efficiency landscape in edge-AI-driven SONs by examining the core elements of power management—from energy acquisition and consumption patterns to battery life calculation and, ultimately, the principles underpinning energy-efficient network models.

2.1. Energy Acquisition

Solar panels are equipped on satellites to harness renewable energy. As they orbit Earth, exposure to sunlight is not always possible for satellites due to Earth’s shadow, necessitating the use of rechargeable batteries for power in unlit areas. In sunlight, solar energy is converted into electrical energy by solar panels for satellite operations and battery charging. In shadow, reliance on stored battery power is necessary for satellites. Periodic variations in solar energy acquisition are caused by the regular orbital movements of satellites around Earth and Earth around the sun. Figure 1 illustrates this scenario, depicting satellites in varying illumination conditions across the globe, their inter-satellite links, and indicative power levels. The output power of solar panels can be expressed as [25]
P S = γ η S cos θ
where S is the area of the solar panels, γ is the solar radiation power per unit area, η is the photoelectric conversion efficiency, and θ is the angle between the solar panels and the sunlight.

2.2. Energy Consumption

The power consumption of communication satellites primarily includes fixed and variable power usage. The fixed power encompasses the operating system power consumption P O S , the basic operational power consumption P b a s e , and the laser alignment platform power T a , which are considered constants over the long term. Variable power consumption is associated with the satellite’s role as a routing node in data processing and transmission tasks, varying with the node’s throughput. The total traffic F i through the satellite includes all inter-satellite and ground-to-satellite link traffic, represented by S i for the inter-satellite links and G i for the ground links. The total traffic passing through the satellite can be expressed as follows:
F i = ( i , j ) S i F ( i , j ) I S L + ( i , j ) G i F ( i , j ) U D L
The forwarding of satellite data involves accessing routing tables, sending data to buffer areas, and modulating the data onto transmission links, with power consumption linearly related to data volume, denoted as P s & r [26]. The directional links are represented by S i + and S i , indicating the flow of data. The power consumption coefficients, ρ I S L s for laser link transmission and ρ I S L r for reception, along with ρ U D L s and ρ U D L r for ground-to-satellite links, are determined by factors such as link length, bit error rate, and signal frequency and are considered constants.
P s & r = ( i , j ) S i + ρ I S L s F ( i , j ) I S L + ( i , j ) S i ρ I S L r F ( i , j ) I S L + ( i , j ) S i + ρ U D L s F ( i , j ) U D L + ( i , j ) S i ρ U D L r F ( i , j ) I S L
The power consumption for processing data streams by the processor is denoted by ξ i ( F i ) α , where ξ i and α are constants dependent on the processor model [27]. The operational power consumption of the satellite is given in Equation (4). The variable x i j represents the operational mode of the optical terminal j on satellite i , with 1 indicating normal mode and 0 indicating sleep mode. N i represents the number of optical terminals on satellite i , and the sum j = 1 N i x i j T a represents the total fixed power consumption of the optical terminals. During sleep mode, the power consumption reduces to φ times (φ < 1), maintaining only the basic power consumption, as shown in Equation (5).
P i w o r k = P c o n s t + P a v r i a b l e = P O S + j = 1 N i x i j T a + P b a s e + P s & r + ξ i ( F i ) α
P i s l e e p = φ P O S + P b a s e

2.3. Battery Life Calculation

Lithium-ion batteries are widely used in satellite energy storage due to their high energy density. This paper establishes a battery life model specifically for lithium-ion batteries, taking into account factors such as the discharge rate, operating environment, and depth of discharge (DoD). The DoD, being easily manageable, is the primary focus of this study. Equation (6) defines the DoD at time t , D ( t ) , where C max is the maximum battery capacity, and C ( t ) is the remaining battery capacity at time t , with a higher DoD indicating greater energy consumption.
D ( t ) = C m a x C ( t ) C m a x
The cycle life of lithium-ion batteries is limited, and their depth of discharge (DoD), denoted by D , directly affects lifespan consumption, as shown in Equation (7), where f ( D ) describes the consumption rate at DoD D , and A is a constant characteristic of the battery [28].
f ( D ) = 10 A ( D 1 ) ( 1 + A l n ( 10 ) D ) )
When discharging between times [ t 1 , t 2 ] , the life consumed can be calculated by integrating f ( D ) , represented by the integral of g ( D ) , as in Equations (8) and (9) [21].
g ( D ) = D 10 A ( D 1 )
L t 1 t 2 = g ( D t 1 ) g ( D t 2 ) , D t 1 D t 2
The decay in battery life reduces its reliability, defined as the probability of failure-free operation over a specified period, related to the battery’s life probability density function f ( t ) , with R ( t ) indicating the reliability of the battery at time t , as depicted in Equation (10).
R ( t ) = 1 0 t f ( t ) d t ( 1 x 2 ) 5

2.4. Energy-Efficient Network Model

This study abstracts and introduces a model for energy-efficient routing in edge-AI-driven SONs. Considering the high dynamics of satellite network topologies, the network is segmented using equidistant time snapshots, with topological connections assumed static within each snapshot to facilitate the analysis of network states in specific intervals [ t 1 , t 2 ] .
The input conditions include G ( V , E ) , which captures all node and link information within the snapshot; V includes all network nodes such as satellites and ground gateways, with noted remaining battery capacities, while E encompasses all inter-satellite and ground-to-satellite link details, including bandwidth usage. T , the traffic matrix, shows the volume of network flows between any two global regions, with Equations (1)–(10) detailing the changes in power levels and lifespan loss during the snapshot.
Constraints include the fact that total data flow on a link must not exceed its capacity, as defined in Equation (11), where F l and C l represent the total bandwidth of data flow and maximum capacity for link l , respectively; satellite battery levels must remain above zero and not exceed maximum capacity, as shown in Equation (12), where C ( t 1 ) and C ( t 2 ) represent the battery levels at the start and end, and P s ( t ) and P i ( t ) represent charging and consumption power, respectively.
F l C l
C ( t 2 ) = C ( t 1 ) + t 1 t 2 P s ( t ) P i ( t ) d t , 0 C ( t 2 ) C m a x
Performance metrics include network throughput and average service delay to measure network performance, with the goal of energy-efficient routing to optimize network lifespan consumption, service blockage rate, and average delay ( L E E , B E E , D E E ) , as specified in Equation (13).
M i n ( L E E , B E E , D E E )
Outputs include the set of service paths and corresponding network performance indicators ( L E E , B E E , D E E ) , along with a set of dormant payloads as part of the topology planning scheme.

3. Energy Efficiency Problem Model for SONs

To address the issue of energy efficiency in edge-AI-driven SONs, this section begins with an analysis of the global traffic model based on the gravity model. It proceeds to explore the energy efficiency problem model and concludes with the GreenRP algorithm design. The primary objective of this section is to propose and establish the designed energy-efficient algorithm model, aimed at optimizing the energy efficiency and operational costs of SONs for edge AI sustainability.

3.1. Global Traffic Model

A realistic global user traffic model is crucial for optimizing satellite optical network energy efficiency, especially for strategies like payload dormancy, because spatiotemporal traffic unevenness significantly impacts resource use and energy consumption. This unevenness, stemming from varied regional request intensities (due to population and development differences) and tidal network access across time zones, informs our spatial traffic distribution model. To create this model, Earth’s surface was divided into 288 equal areas. Traffic intensity in each area was primarily set using 2023 Internet user data [29]: one intensity unit per million users, with a one-unit baseline for areas with fewer users. Figure 1 shows this global traffic demand, marking intensities for 155 identified service-generating regions, where higher values mean more frequent network demands.
To simulate the active periods of Internet users throughout a day, we referred to urban traffic flow models, setting the maximum intensity coefficient to 1, as depicted in Figure 2, which illustrates the daily variations.
The global traffic demand intensity has been quantitatively analyzed, and the direction of flow still needs to be determined. The gravity model, based on the concept of physical gravitation, was employed to describe the demand for interactions between regions influenced by geographic distance and population density. In satellite optical networks, areas with a higher number of users and shorter distances generate more traffic. The data service density between regions i and j , denoted by T i j in Equation (14), depends on the local time-based traffic intensity coefficient B i ; the Internet user density U i , similarly for B j and U j ; and the physical distance L i j .
T i j = B i U i B j U j L i j
Equation (15) calculates the traffic matrix among the 155 global traffic regions; intra-region traffic, which does not pass through the satellite network, has a matrix diagonal value of 0.
T = T 1 , 1 T 1 , 2 T 1 , 155 T 2 , 1 T 2 , 2 T 2 , 155 T 155 , 1 T 155 , 2 T 155 , 155

3.2. Energy-Efficient Problem Model

This section presents how energy-efficient routing problems in edge-AI-driven SONs are solved through topology planning. The input consists of pairs ( G , T ) S p k , with the network’s state over a period described by a series of snapshots S p 1 ~ S p N . Each snapshot S p k captures a fixed topology within a specific time interval [ t 1 , t 2 ] . The pair G includes comprehensive topology information and satellite power status, while T represents the network’s traffic matrix, calculated at time t = ( t 1 + t 2 ) / 2 according to Equation (11), depicting the network’s continuous state over time.
When satellites enter dormancy, they maintain operations at a fixed low power, as analyzed in Section 2.2, composed of a baseline power consumption and variable consumption based on node throughput. As satellites go dormant, they cease communications tasks, directly shutting down ground links, and all optical terminals for inter-satellite links are also shut, due to the requirement for simultaneous activation with neighbor satellites for laser link establishment. This results in a network-wide deactivation of optical terminals during the snapshot, represented by S k c l o s e , transforming the original topology to G k ( V k , E k ) . If satellite i enters dormancy, and O T ( i , j ) denotes its optical terminal for the link to satellite j , then j belongs to the neighbors of satellite i , O T ( i , j ) S k c l o s e , and O T ( j , i ) S k c l o s e .
However, due to the challenge of aligning lasers, switching an optical terminal from standby to active mode requires a time t ' to align the laser. Therefore, if an optical terminal is in standby during S p k but active in S p k + 1 , it needs to be activated before t 2 t ' to ensure proper function in the next period, indicating that longer dormancy periods can enhance energy savings. Equations (16)–(18) describe the power consumption variations of optical terminals during S p k . S k o p e n represents the collection of optical terminals active network-wide during S p k , S O T i denotes the set of optical terminals owned by satellite i , and S i o p e n 1 represents those active during [ t 1 , t 2 t ' ] . Given some optical terminals reverse status in S p k + 1 , the set S i o p e n 2 represents those active during [ t 2 t ' , t 2 ] , with S i o p e n 1 S i o p e n 2 . The fixed power consumption P c o n s t O T ( t ) of satellite i’s optical terminals is proportional to the number of active terminals S i . Finally, Equation (19) expresses the satellite’s power consumption.
S i o p e n 1 = S O T i S k o p e n
S i o p e n 2 = S O T i S k + 1 o p e n
P c o n s t O T ( t ) = T a S i o p e n 1 , t [ t 1 , t 2 t ] T a S i o p e n 2 , t [ t 2 t , t 2 ]
P i = P O S + P c o n s t O T ( t ) + P a v a r i a b l e + P b a s e ( w o r k m o d e ) φ P O S + P b a s e ( s l e e p m o d e )
The problem is formulated by considering a series of consecutive operational snapshots, labeled S p 1 ~ S p N . Each snapshot, S p i , encapsulates the network’s physical connectivity, G ( V , E ) , and documents the unique residual battery levels for all satellites at that specific moment. Associated with each snapshot is a traffic matrix, T , which remains consistent throughout its duration. The analysis further incorporates quantitative formulas to define satellite power consumption (Equations (2)–(5) and (16)–(19)) and battery life degradation (Equations (6)–(8)). This formulation is subject to several critical constraints: the total data flow on any link must not surpass its designated capacity (bandwidth limitation); the volume of traffic entering any satellite must equal the volume exiting, ensuring flow conservation; and the remaining battery capacity, C ( t ) , of any satellite must consistently stay within operational bounds ( 0 C ( t ) C max ). The desired outputs of this problem are twofold: firstly, an energy-efficient network topology ( G S p k ( V S p k , E S p k ) ) for each snapshot, where V S p k represents the active network nodes and E S p k denotes the active links during snapshot k , and secondly, a corresponding set of optimized service paths ( P a t h ( G S p k ) ) for routing traffic within this energy-efficient topology. The overarching solution objective is to optimize key performance metrics across all snapshots. Specifically, for each snapshot period, the aim is to minimize the network’s overall life consumption ( L i ), packet loss rate ( B i ), and average service delay ( D i ), as collectively represented by the objective function in Equation (20), which seeks to minimize the sum of these metrics over all N snapshots.
M i n i = 1 N L i , i = 1 N B i , i = 1 N D i

3.3. GreenRP Algorithm

In this section, we aim to explore a satellite dormancy strategy with the goal of maximizing the lifespan of edge-AI-driven SONs while minimizing average service latency and packet loss over a specified period. Given this objective, the energy-efficient routing problem in SONs is defined as a multi-objective optimization problem. This type of problem has been classified as NP-complete, implying a vast and diverse solution space. Therefore, heuristic algorithms are considered an ideal choice for addressing such problems.
GreenRP is implemented based on genetic algorithms. Genetic algorithms are heuristic search techniques inspired by the principles of biological evolution. The implementation of genetic algorithms involves several key steps: selection (a natural selection process based on individual fitness), crossover (the pairing of selected individuals to exchange certain genetic information to produce offspring), and mutation (introducing random changes to certain parts of an individual to increase genetic diversity). The cyclical execution of these steps not only enhances diversity within the population but also facilitates the evolution of the entire population towards more optimal solutions, providing an effective means to address multi-objective optimization problems. With carefully designed genetic operations and parameter adjustments, genetic algorithms can effectively address the complexity of solving energy-efficient routing problems based on topology planning, yielding solutions within an acceptable timeframe.
The GreenRP algorithm, detailed in Algorithm 1, begins by initializing key parameters such as Population_Size, Gene_Length, Best_Fitness, and No_Improve_Count and then creates an initial population based partly on a Previous_Best_Topology, if available (lines 1–4). The core of the algorithm is an iterative loop (lines 5–24) where, in each generation, the Fitness of each Gene (a weighted sum of normalized energy, packet loss, and delay) is calculated. The Best_Fitness is updated, and if no improvement is seen for a set number of iterations, the loop may terminate early. A new population is then generated through parent selection, crossover or copying, and mutation. Once the iteration is complete, the Best_Gene is selected from the final population (line 25). A Path_Set is determined for this Best_Gene using a shortest path (SP) algorithm, and the corresponding links are marked as active (lines 26–29). Finally, this refined Best_Gene is set as the Final_Topology and returned as the algorithm’s output (lines 30–31).
Algorithm 1: Green Routing Planning (GreenRP) algorithm
Input: Satellite_Network_Topology, Previous_Best_Topology
Output: Final_Energy_Saving_Topology
1:initialize Population_Size, Gene_Length, Best_Fitness ← ∞, No_Improve_Count ← 0;
2:Mean ← Previous_Best_Topology ? Count_Off_Links(Previous_Best_Topology): Gene_Length/2;
3:Population ← [GenerateGene(Gene_Length, NormalDistribution(Mean, σ)) for i in
4:  1..(0.75*Population_Size)] + [Copy(Previous_Best_Topology) for i in 1..(0.25*Population_Size)];
5:for Iteration from 1 to Max_Iterations do
6:for each Gene IN Population do
7:  Gene.Fitness ← w1 * Norm_Energy + w2 * Norm_Packet_Loss + w3 * Norm_Avg_Delay;
8:end for
9: Current_Best_Fitness ← Population.Best.Fitness;
10:if Current_Best_Fitness < Best_Fitness then
11:  Best_Fitness ← Current_Best_Fitness;
12:  No_Improve_Count ← 0;
13:else
14:  No_Improve_Count ← No_Improve_Count + 1;
15:  if No_Improve_Count ≥ 3 then break;
16:end if
17:while New_Population.SIZE < Population_Size do
18:  Parent1, Parent2 ← SelectParents(Population);
19:  Child1, Child2 ← (Random() < CrossoverProb) ? SinglePointCrossover: Copy;
20:  New_Population.ADD(Mutate(Child1, MutationProb));
21:  New_Population.ADD(Mutate(Child2, MutationProb));
22:end while
23: Population ← New_Population;
24:end for
25:Best_Gene ← Population.Best;
26:Path_Set ← { ShortestPathAlgorithm(Best_Gene, Pair).Links for Pair in Satellite_Regions.Pairs };
27:for each Link in Path_Set do
28: Best_Gene[Link] ← 1;
29:end for
30:Final_Topology ← Best_Gen;
31:return Final_Topology.
In the GreenRP algorithm, the gene represents a complete solution to the problem, encapsulating all necessary information to describe that solution, and the choice of encoding method directly influences the efficiency of problem resolution. Satellites powered by solar energy typically operate in a normal working mode when illuminated by sunlight, as energy consumption is less of a concern under such conditions. Consequently, GreenRP primarily focuses on optimizing satellites situated in Earth’s shadow regions. Within these shadow regions, inter-satellite laser links may enter a dormant state to conserve energy; these are visually represented by the dashed lines in Figure 3. The operational status of each such link (i.e., whether it is open or closed) is encoded within the gene chain, with its length corresponding directly to the total number of links. Each unit, or locus, within the gene chain signifies the operational status of a specific inter-satellite link, thereby describing the current network topology. If all inter-satellite links connected to a particular satellite are encoded as closed, it implies that this satellite likely has low remaining energy reserves and is not critical for servicing current traffic demands. In such instances, the satellite transitions into a complete dormancy mode, which further reduces its fixed operational power consumption.
The algorithm commences with the generation of an initial set of these encoded genes, which constitutes the starting population. To prevent extremes in the initial solution set and to foster a balanced exploration of the solution space, the number of initially removed (or dormant) links in each gene is determined by a normal distribution, with its mean initially set to half the gene length. Recognizing the regular, predictable motion of satellite networks and the consequent topological similarity often observed between consecutive operational snapshots, the GreenRP algorithm incorporates a mechanism to leverage solutions from previous states. Specifically, the optimal energy-efficient topology derived from the preceding snapshot is integrated into the initialization of the new solution space. This is achieved by adjusting the mean of the normal distribution to match the number of dormant links present in the last known optimal topology. Following this adjusted distribution, 75% of the genes in the initial population are generated. The remaining 25% of the population consists of direct copies of the energy-efficient topology from the immediately preceding solution, thereby ensuring that valuable prior knowledge is carried forward.
Fitness calculation in GreenRP involves the careful normalization of interdependent optimization objectives, such as packet loss rate and average service delay, to ensure that all objectives are equated on the same scale for fair assessments. The strategy includes creating an energy-efficient topology through hibernating links and nodes and planning service paths using a shortest path strategy, aiming for performance close to that of regular load conditions after energy savings. L, B, and D represent the network-wide life consumption, packet loss rate, and average service delay when using this algorithm, respectively. L S P , B S P , and D S P serve as benchmark indicators under the SP strategy. The fitness function is defined in Equation (21). Weight coefficients X, Y, and Z influence the prioritization of these objectives. Normalization issues are addressed by using positive benchmarks, L S P and D S P , as denominators, while packet loss B S P , which may be zero under light loads, is handled through an exponential form to highlight the optimization goal and prevent excessive hibernation from causing network congestion.
s c o r e = X L L S P + Y B B S P + Z D D S P , B S P > 0 X L L S P + Y e B + Z D D S P , B S P = 0         L S P , D S P > 0
During the population evolution process, the algorithm treats lower fitness scores as indicative of superior genetic traits, ensuring that such individuals have a higher likelihood of reproducing. Crossover is performed using a single-point method, where a gene index is randomly selected and genes are swapped to simulate chromosome crossover. Mutation consists of randomly toggling link states. Fitness influences genetic inheritance, with crossover and mutation probabilities adaptively adjusted according to the iteration count, as detailed in Equations (22) and (23). The iteration count iter and the maximum limit i t e r max influence these probabilities; higher crossover probabilities early in the iterations facilitate global search, while increased mutation probabilities later enhance local search. To ensure stable convergence of the algorithm and protect superior genes from premature elimination, an elite preservation strategy is implemented. An elitism retention strategy is implemented to stabilize the algorithm and prevent premature loss of superior genes. By preserving the top-performing individuals before each generation’s operations, this strategy not only maintains population diversity but also ensures that high-fitness genes are retained, promoting convergence to optimal solutions.
P c = 0.5 cos i t e r i t e r m a x π 2 + 0.1
P m = 0.03 sin i t e r i t e r m a x π 2 + 0.02
Traditional genetic algorithms typically terminate once performance metrics meet a predetermined threshold, outputting the best gene found to that point. Due to the NP-hard nature of the problem, convergence thresholds are inestimable; setting too high a target value may prevent the algorithm from stopping, while too low a value may terminate iterations prematurely. Consequently, this study employs a dynamic termination criterion based on the gradient change of performance metrics. We focus on the best gene and its score produced in each iteration, comparing these with the historically best solution. If the newly obtained best solution does not surpass the historical best in three consecutive iterations, it is considered unlikely that further iterations will converge to a better solution, prompting termination of the algorithm. This strategy, based on gradient changes and comparisons with historical bests, allows the algorithm to flexibly determine and find the appropriate time to terminate without a clear threshold.
Finally, to ensure the network connectivity of the final energy-efficient topology, we implemented a supplementary strategy: upon establishing the energy-efficient topology, we applied the shortest path algorithm pairwise to the 155 terrestrial regions. All links that appeared in the path set were activated to ensure that any terrestrial area could communicate via the satellite network. This approach guarantees comprehensive connectivity across all regions, maintaining robust network performance within the energy-efficient framework.

4. Performance Evaluation and Analysis

4.1. Simulation Setup

To construct a highly realistic simulation environment for more accurately evaluating the performance of energy-efficient routing strategies, we developed a dual-layer inclined orbital constellation model with 1152 satellites, based on the Starlink project’s publicly available constellation parameters [30]. These satellites are distributed over various orbits to simulate the actual satellite layout of Starlink, thus ensuring the practical application value of our simulation results. The deployment of ground stations is a crucial component of this simulation. We established 155 ground stations worldwide, considering a wide geographical distribution and actual communication demands to capture regional disparities in satellite communication system performance. The simulation process utilizes a fixed-duration snapshot method, with each snapshot lasting five minutes, covering a full 24 h day and generating a total of 1440 snapshots. An example diagram of snapshot transition states is shown in Figure 1. This approach enables us to meticulously document the satellite network’s performance variations throughout the day, providing substantial data for analysis. Static services are employed in this simulation. Such services persist continuously from the simulation initiation, and the number of concurrent services running in each snapshot remains stable. This setup enables observation of network performance under varying load conditions. For energy consumption simulation, emphasis is placed on the energy consumption status of satellite nodes when they are in the shadow zone. In contrast, when nodes are in the sunlight zone, solar power supply is adopted by default, and the battery-powered mode is not activated. All pertinent parameters, including satellite orbits, ground station locations, and other essential settings, are detailed in Table 1 of the paper.
The simulation was conducted in a C++ environment, utilizing the boost library and the NS-3 tool to simulate satellite communication. Service source nodes generate data packets at a fixed rate, representing the service bandwidth. Static service models were used, ensuring that services persisted from the start of the simulation, maintaining a stable number of concurrent services in each snapshot to analyze network performance under various loads. Initial values for the weight coefficients to X:Y:Z = 1:1:1 (corresponding to the importance ratios of network lifetime, packet loss rate, and delay in solving the ultimate objectives), primarily based on the following considerations: In the initial research stage of satellite optical networks, network lifetime, packet loss rate, and delay are all core indicators for evaluating the performance of routing schemes. Network lifetime is directly related to the sustainable operation capability of satellite systems, while packet loss rate and delay affect the reliability and real-time performance of data transmission. The three hold equal foundational significance in the scenario of “energy-efficient routing in edge AI-driven satellite networks” focused on in this study. Given the current lack of an established quantitative standard for the relative importance of these three factors in this specific scenario, and considering that the core objective of this research is to validate the effectiveness of the “GreenRP in balancing multi-objective performance” rather than comparing the priority rankings of individual indicators, we chose the equal weight setting as a baseline.
Four different routing algorithms were compared to evaluate their performance in terms of energy efficiency and network performance. The first, the shortest path algorithm, does not consider energy savings and makes no modifications to the topology, focusing solely on shortest path routing. Second is the GreenRP algorithm introduced in this paper, which aims to balance energy consumption and service quality by optimizing the network topology. Next is the traditional energy-saving routing (GreenSR) algorithm, which conserves energy by optimizing topology and considering satellite battery levels. It initializes a subgraph containing links with non-zero demand, calculating the shortest paths and costs. For nodes outside the subgraph, it determines their activation status based on cost impact, forming an energy-efficient topology that prioritizes nodes with higher battery levels. Finally, the simple genetic algorithm (SGA) is used to optimize the topology and select dormant satellites for energy conservation of satellite batteries by means of the conventional genetic algorithm. In contrast, the GreenRP algorithm not only considers the formation of energy-saving topologies but also introduces a link-level dormancy mechanism, differing from GreenSR’s focus on satellite unit dormancy and GreenLP’s emphasis on inter-satellite links. Additionally, GreenRP also considers both the network’s lifespan and service quality, whereas GreenSR focuses only on the network’s lifespan. The simulation results are analyzed in detail below.

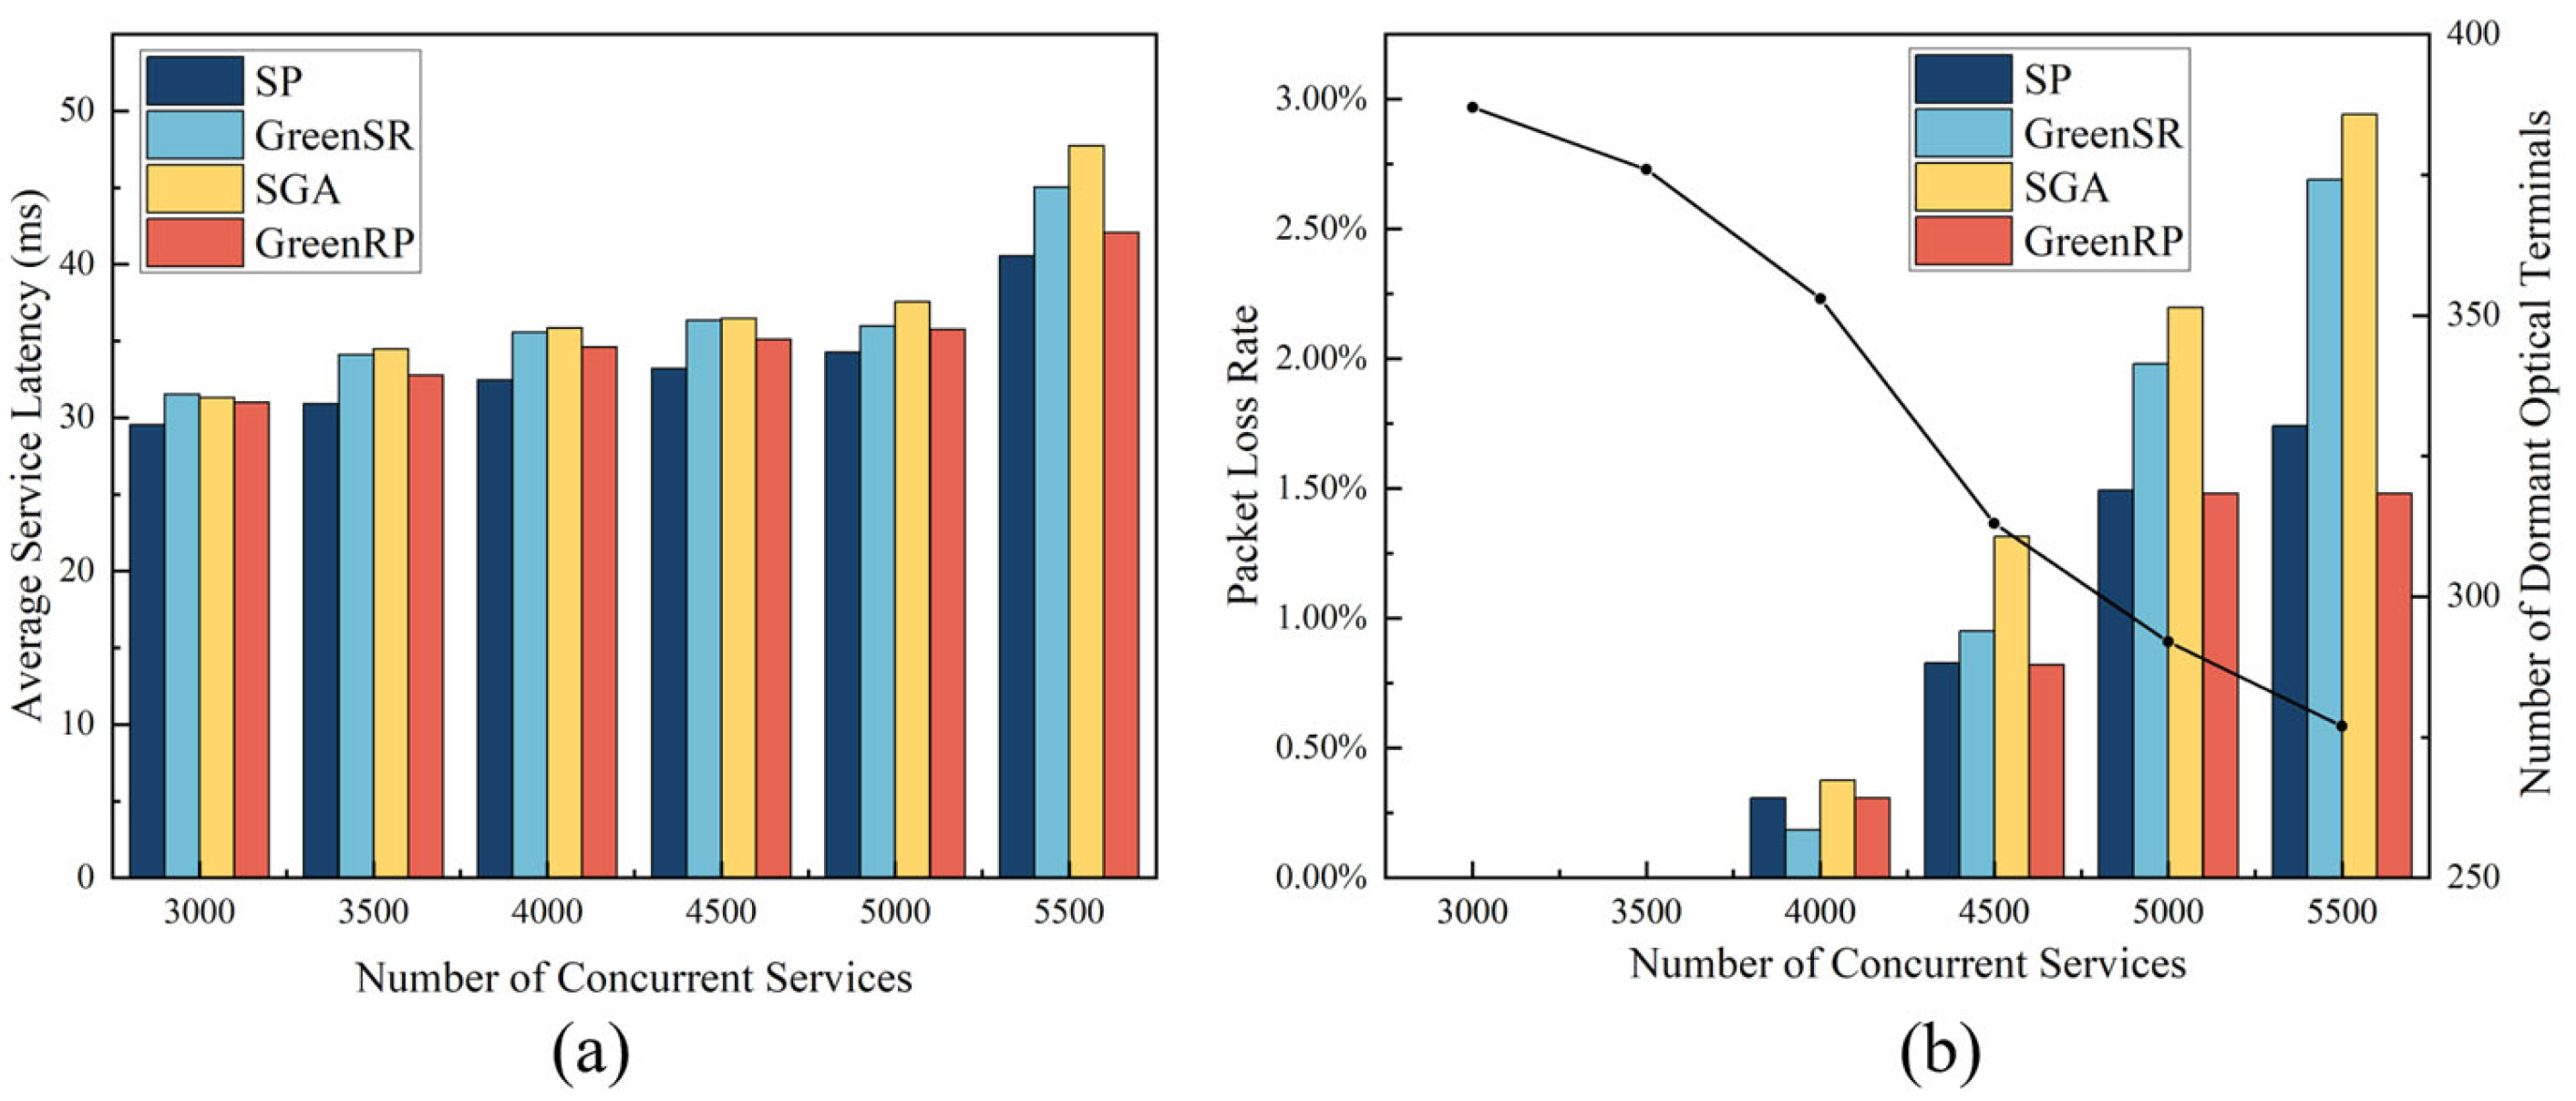
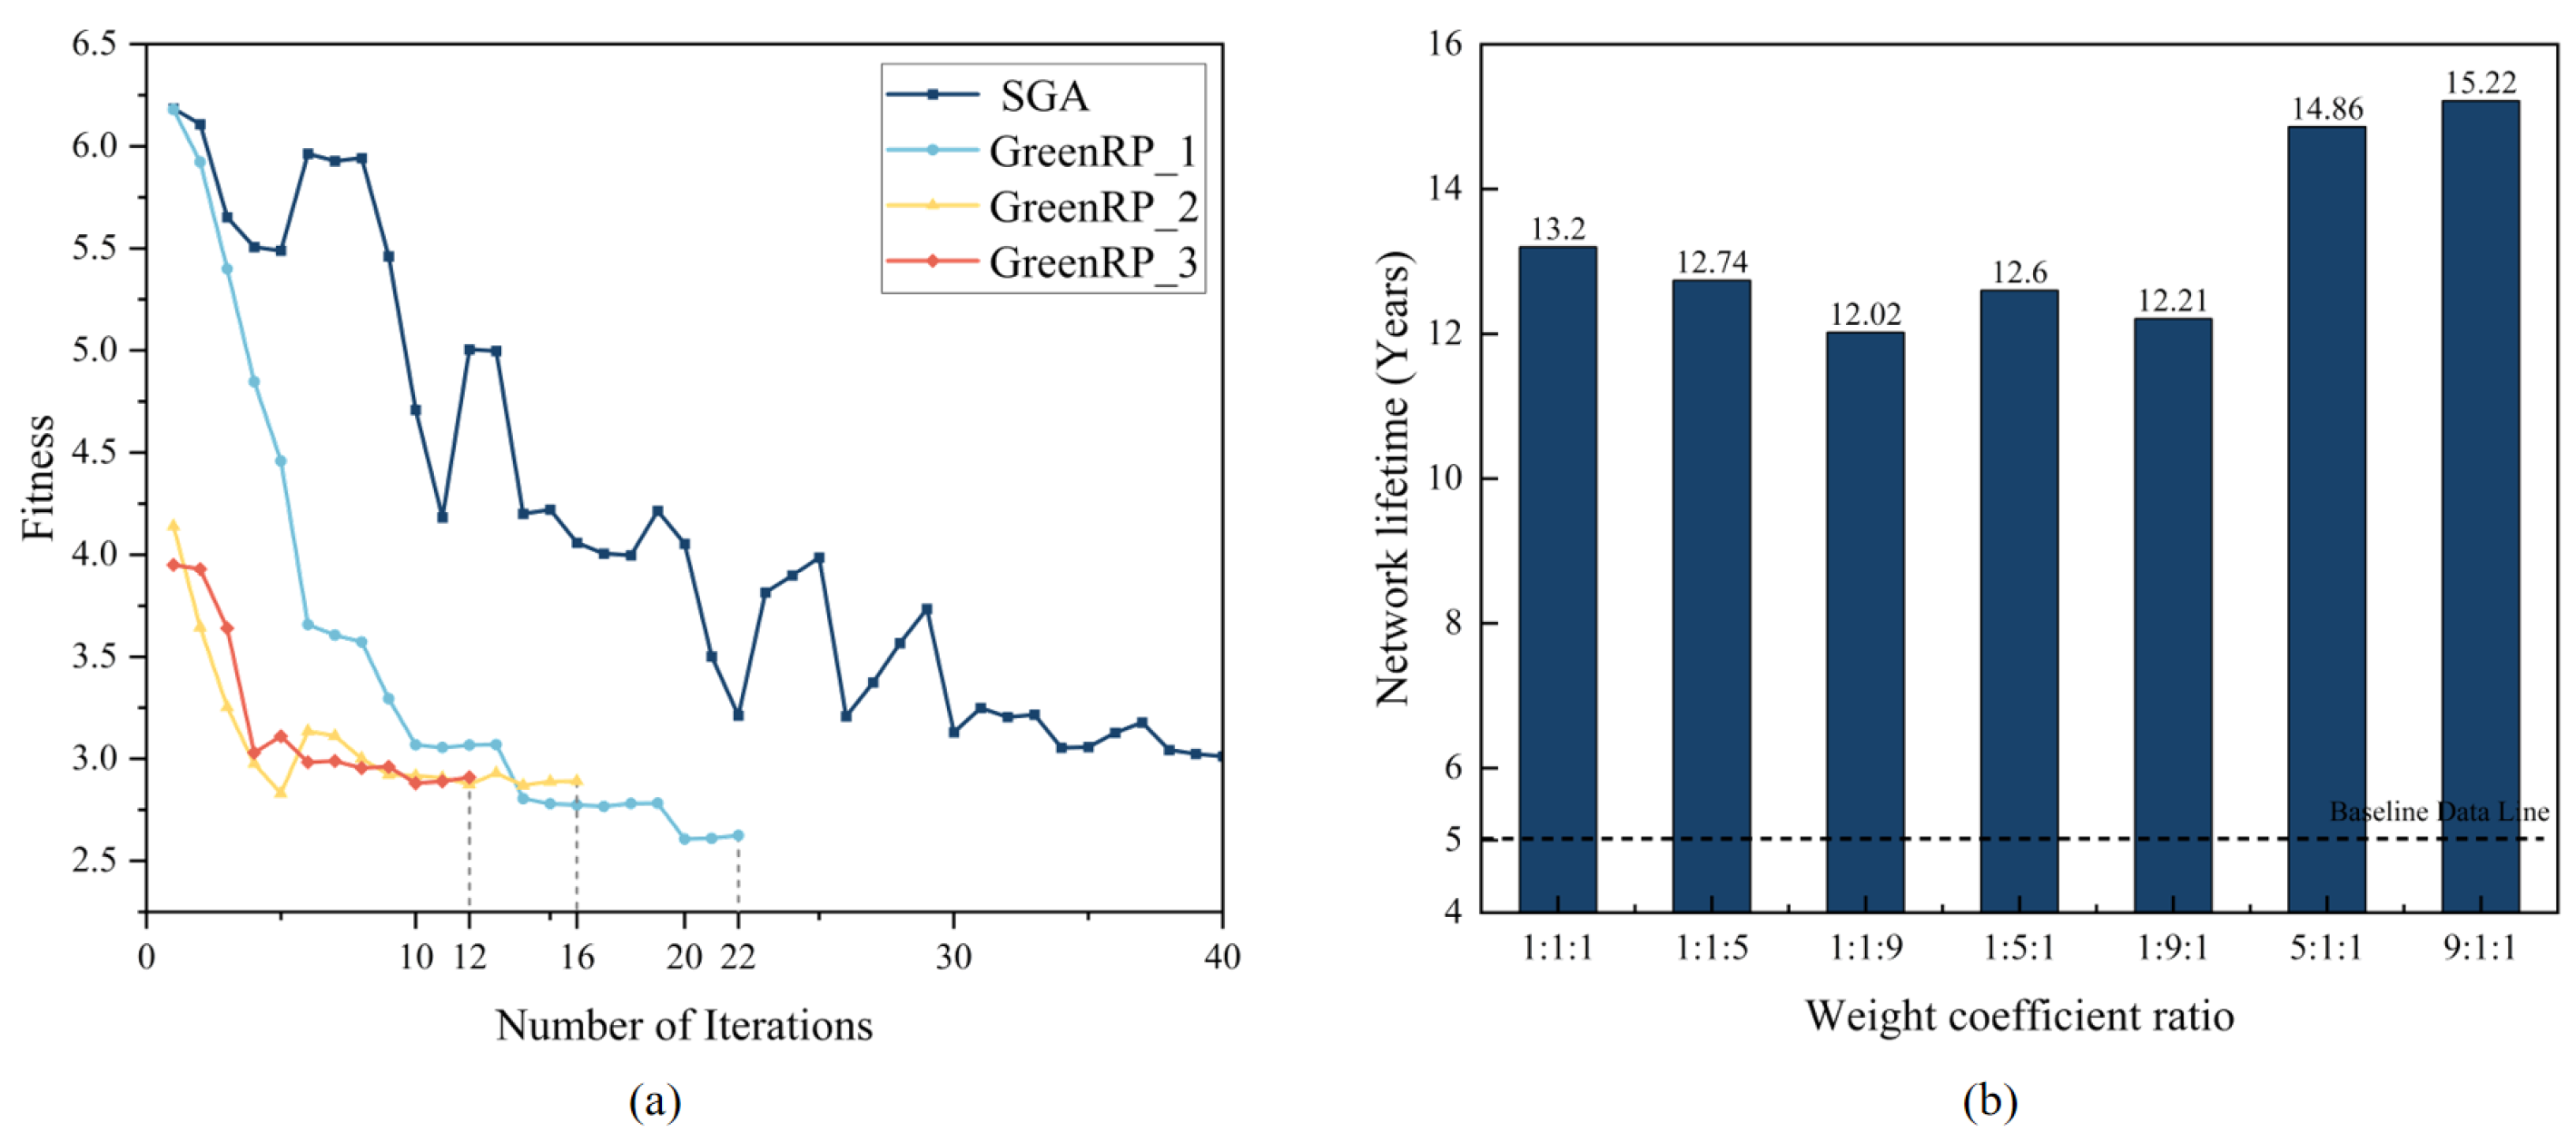
4.2. Comparison of Algorithm Performance Under Different Loads

Figure 4a displays the average service latency caused by each algorithm under different numbers of concurrent services. The results indicate that the SP strategy generally exhibits the lowest average latency, as it consistently selects the path with the minimal propagation delay. However, as the number of concurrent services increases, the queuing delay caused by the SP strategy gradually rises, progressively diminishing its latency performance advantage relative to other algorithms. The GreenSR algorithm consistently shows higher latency in all tests, primarily because it does not fully consider network performance in topology planning, preferentially routing traffic to satellites with higher remaining battery, often resulting in detours that increase both propagation and queuing delays. The SGA achieves energy savings by optimizing network topology but does not consistently outperform SP and GreenRP across all service concurrency scenarios, revealing its latency performance shortcomings under high loads.
In contrast, the GreenRP algorithm proposed in this paper not only considers the construction of energy-saving topologies during the iterative process but also the impact of topology on latency performance, putting only those payloads minimally affecting current service transmission to sleep, thereby outperforming GreenSR and SGA in latency efficiency. With the increase in the number of concurrent services, the incremental delay for all strategies gradually decreases, indicating that as the network reaches its capacity limit, the increase in the packet loss rate of additional services causes the variation in average latency to stabilize. Overall, while ensuring network performance, GreenRP performs better in reducing latency compared to GreenSR and SGA, with an average reduction of about 3%.
Figure 4b shows the packet loss rate performance of different algorithms. SP generally offers the lowest packet loss due to its preference for the shortest pathways, minimizing delays. GreenSR, while initially effective at lower service levels due to its traffic distribution strategy, suffers at higher loads due to its prioritization of battery life over traffic demands, leading to increased losses. SGA optimizes topology but does not surpass SP or GreenRP. SGA usually requires a relatively large number of iterations to converge, especially when dealing with complex combinatorial optimization problems. Moreover, it may perform poorly under resource constraints, resulting in the failure to achieve optimal performance such as latency. In contrast, GreenRP dynamically adjusts dormant terminals to ensure ample communication resources, effectively managing packet loss and significantly outperforming GreenSR by about 0.25% in high-load environments, showcasing its robustness in maintaining network performance while optimizing energy use.

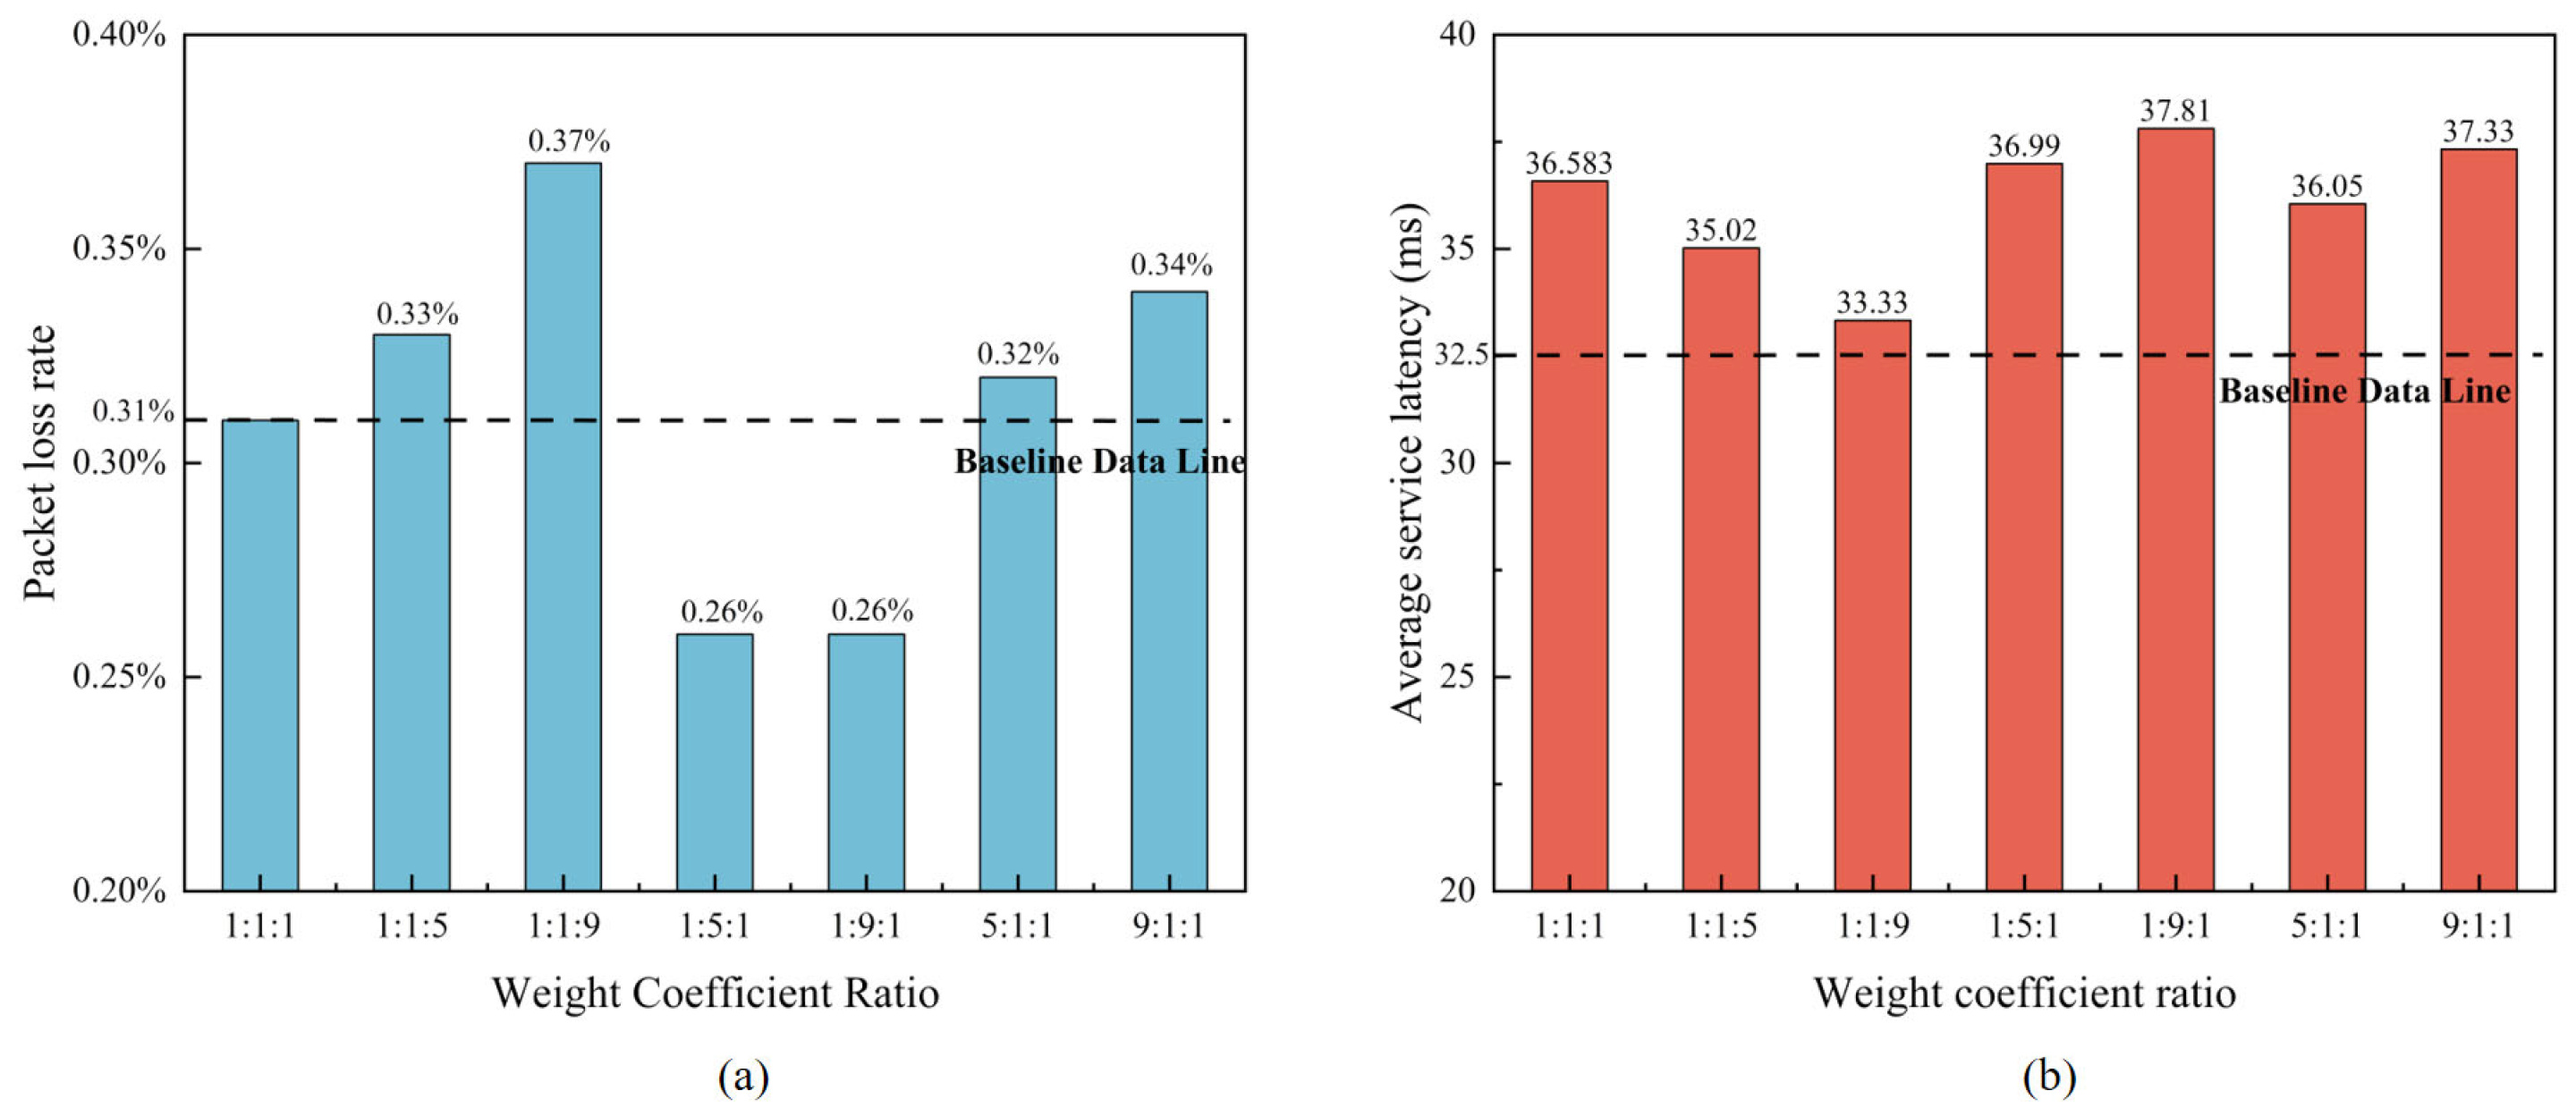
4.3. Comparison of Algorithm Performance Under Fixed Loads

The above simulation results validate that GreenRP is capable of sustaining satisfactory network performance across diverse network loads. The forthcoming analysis aims to assess the performance of various algorithms under a constant service concurrency, highlighting the complex challenge of balancing energy efficiency with network performance. This will particularly involve scenarios exhibiting packet loss, specifically those with a service concurrency of 4000, to provide focused insights into how each algorithm performs under stressed network conditions.
By calculating the average inter-satellite link utilization for each snapshot duration, data corresponding to 1440 snapshots were plotted as a probability density graph. Figure 5 illustrates the distribution of network-wide inter-satellite link utilization across various snapshot periods. With 24% as the baseline for link utilization, GreenRP’s rates were always above this level, whereas SP’s rates fell below this baseline about 52% of the time, and GreenSR’s about 38% of the time. The average link utilization for the SP strategy peaked at only 40% throughout the simulation period, primarily due to uneven traffic distribution with many links carrying low traffic volumes, resulting in low overall bandwidth utilization. GreenSR’s link utilization improved relative to SP, as dormant links were excluded from the utilization calculations, with fewer links handling communications. Additionally, GreenSR’s longer average service paths and the additional hops consumed more bandwidth resources. SGA generally exhibited higher link utilization than SP but did not consistently surpass GreenRP, particularly under high traffic conditions. GreenRP consistently demonstrated high link utilization rates. This indicates that by deactivating some links, GreenRP maintained high network-wide link utilization, thus efficiently utilizing communication resources.
Figure 6 illustrates the distribution of the remaining battery percentage of satellites network-wide at the end of the simulation under various algorithms. Since some satellites were continuously exposed to sunlight, maintaining full battery levels, such data were excluded from the analysis. The graph reveals that the lowest remaining battery percentage network-wide under the four algorithms was 25% for SP, 43% for GreenSR, 49% for SGA, and 58% for GreenRP. This indicates that GreenRP performed best in maintaining higher battery levels across the network, effectively preventing excessive discharge of satellites. The steep curve of SP’s power distribution indicates uneven energy consumption among satellites in shaded areas, with some experiencing rapid battery depletion due to overuse, while others remain idle. In contrast, the smoother curves under the energy-efficient routing algorithms GreenSR, SGA, and GreenRP suggest a more balanced power consumption among satellites. This balance is achieved primarily by alternating the workload among different satellites. What is noteworthy about GreenRP is its optimized power management and load distribution. It ensures communication quality in shadowed areas while minimizing the number of operational satellites, thereby significantly improving satellite energy utilization.
Figure 7 illustrates the network lifetime consumption produced by different algorithms. Every 100 min, data on network lifetime consumption by each algorithm were recorded, with the x-axis representing the time segment number and the y-axis the total network lifetime consumption for that period. Using 24 h simulation data, we estimated network lifetime, considering the lifetime of the entire constellation as a whole, with a fixed amount of life consumed every 24 h. It is assumed that the service life of the satellite network under SP is five years, and its reliability is calculated based on the simulation results. GreenRP could extend the lifetime to 13.8 years. The enhancement in network lifetime by GreenRP was substantial, showing an increase of 176% over SP, 80% over GreenSR, and 33% over SGA, and the improvement of this indicator is based on the premise that the network quality has not declined significantly. This further proves that when designing and operating satellite networks, the SP strategy consistently shows a higher network lifecycle consumption rate in all periods compared with energy-saving strategies. It further indicates that the temporal variation in traffic distribution is crucial for optimizing network lifespan and efficiency. Otherwise, just like the SP strategy, the consumption rate of network lifespan will remain at a high level regardless of changes in traffic demand, leading to unnecessary loss of network lifespan.

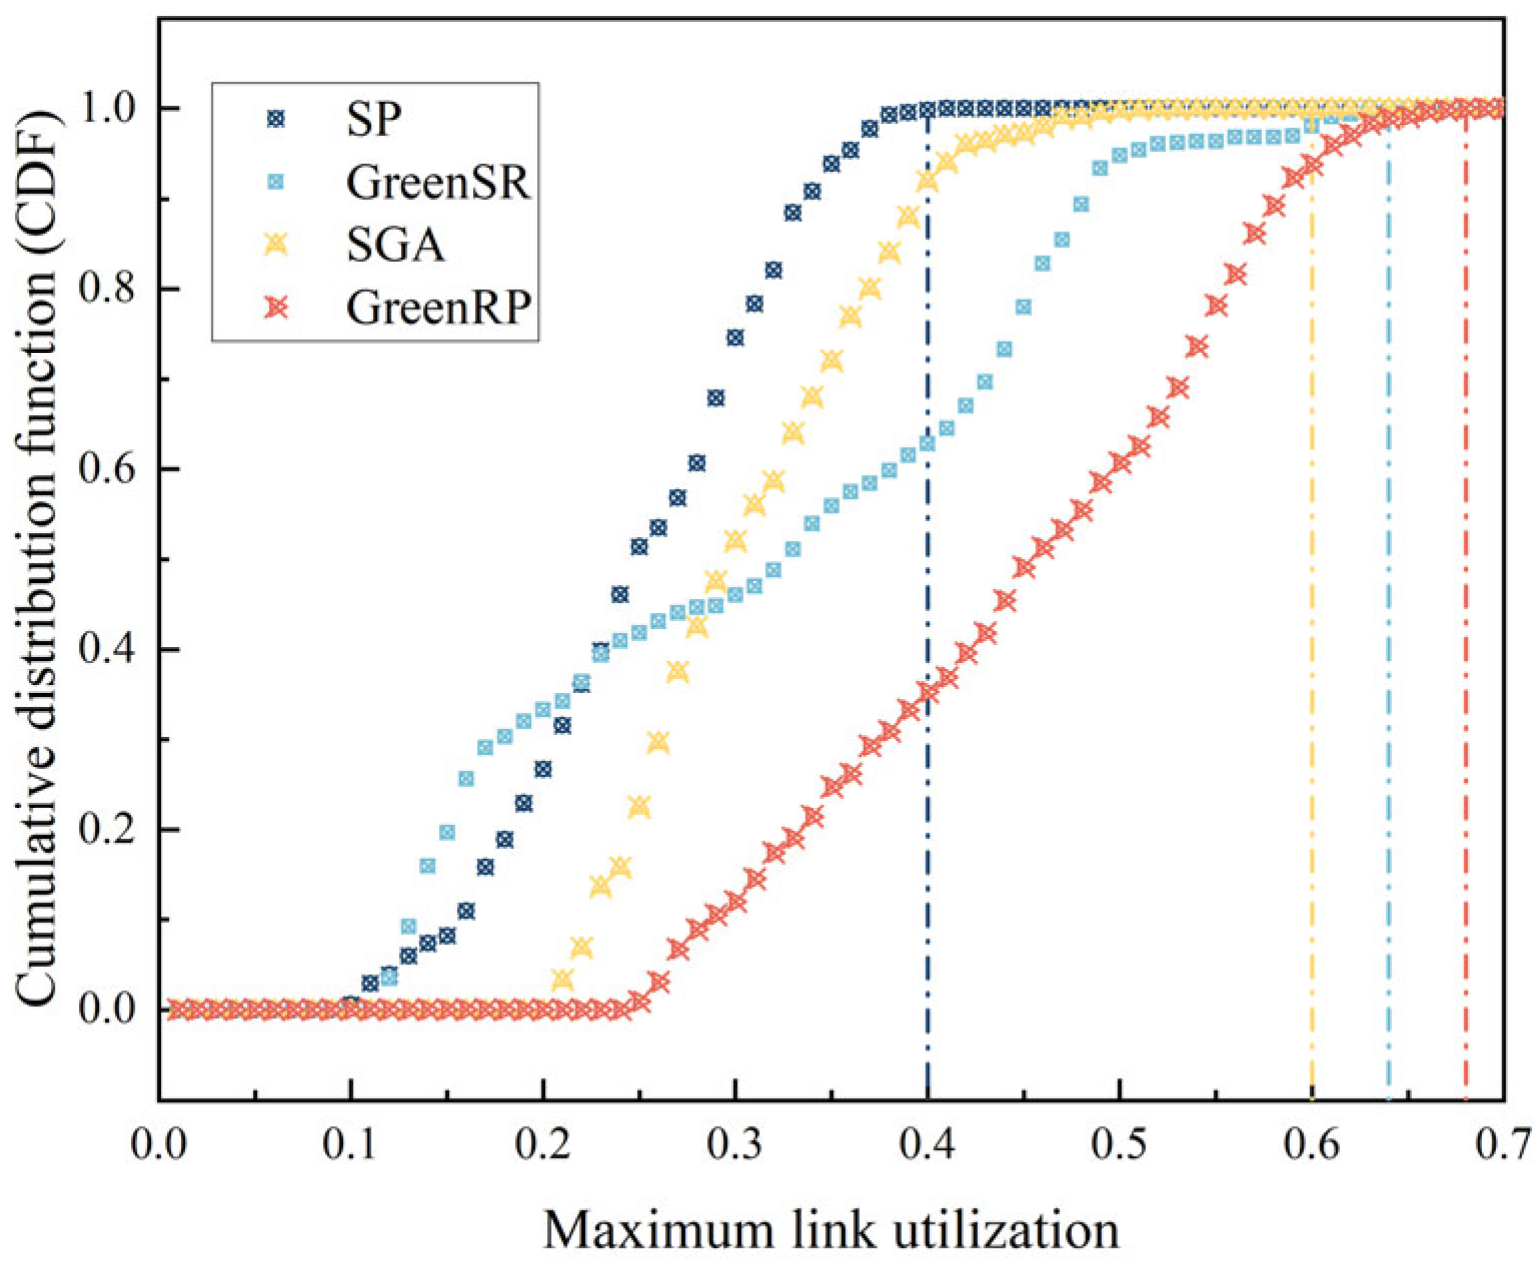
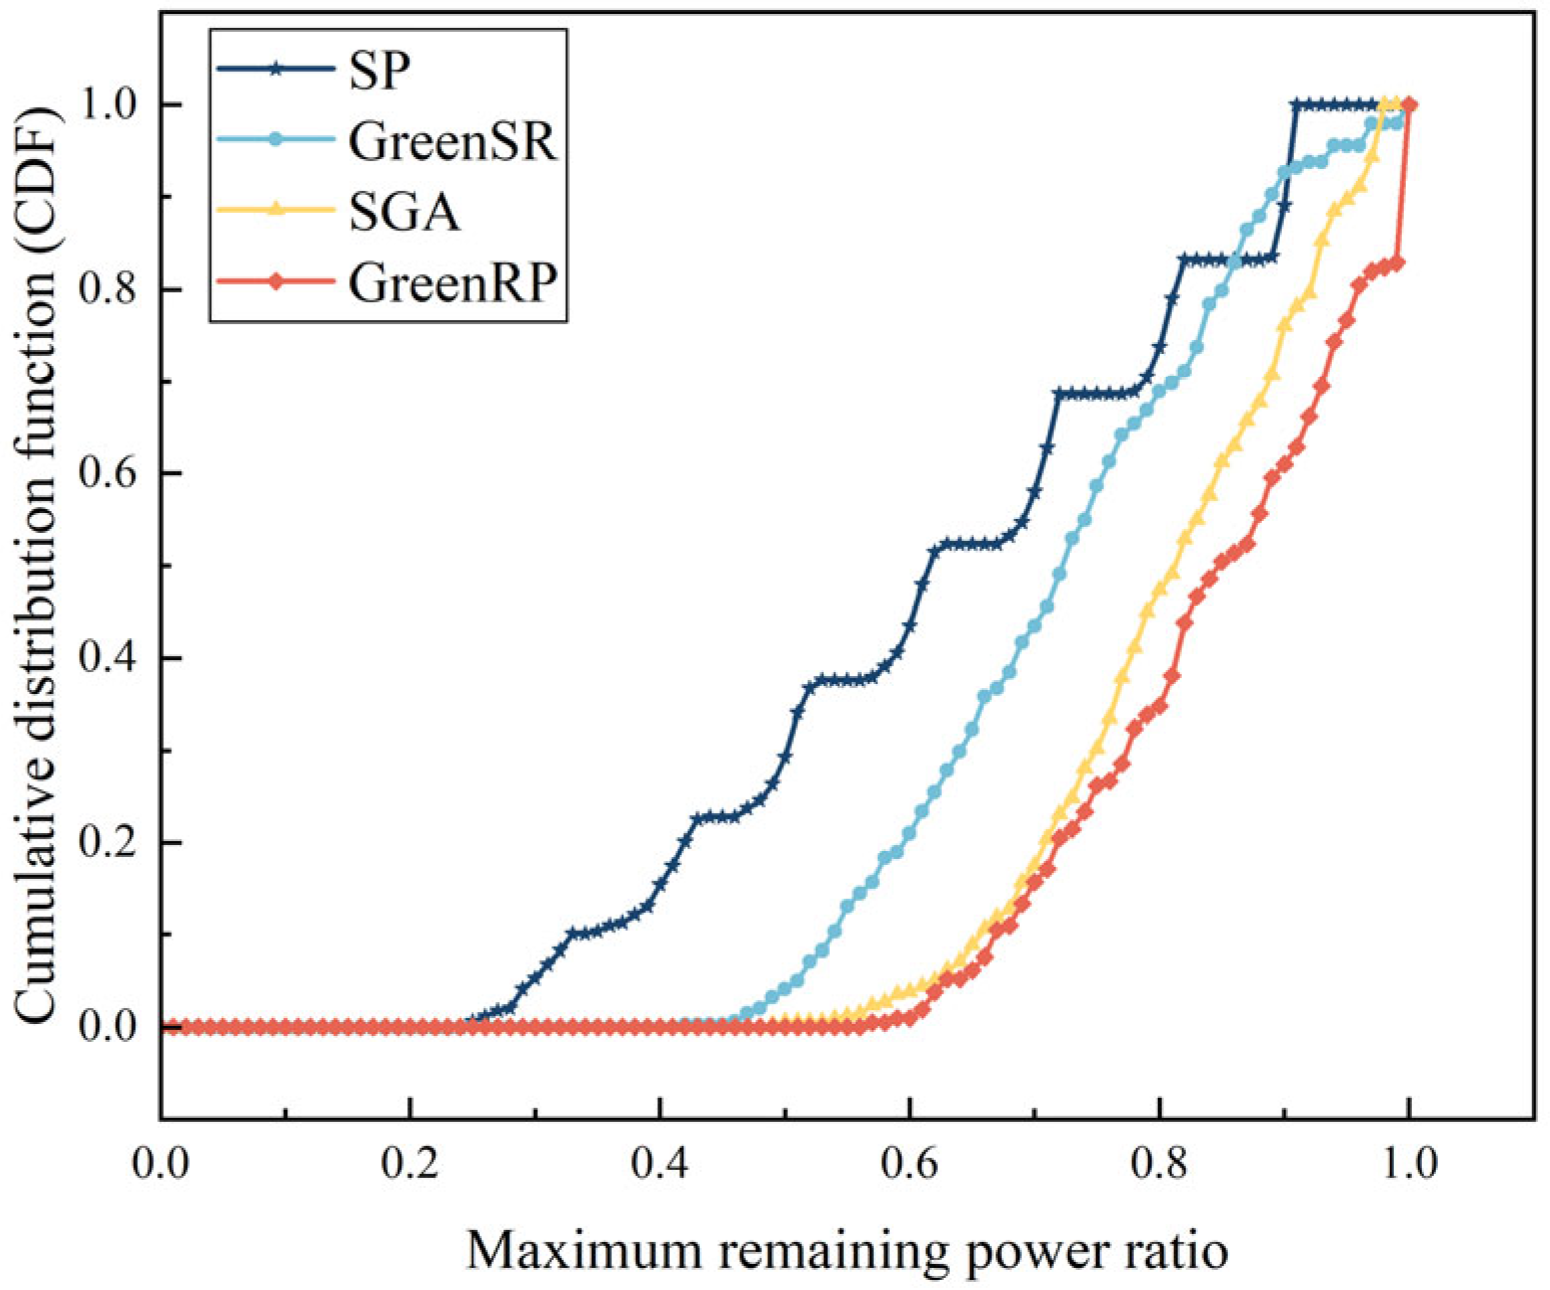
4.4. Performance Analysis of GreenRP

Figure 8a illustrates the iterative performance of the GreenRP algorithm, with the x-axis representing the number of iterations and the y-axis depicting the fitness of the best individual in the current generation, indicating the level of convergence. To evaluate its convergence performance, the original genetic algorithm (using fixed crossover and mutation probabilities and a completely random initial population) was compared with GreenRP through three rounds of solution, ensuring fairness by using the same initial population samples for both algorithms in the first round. The SGA curve represents the iterative performance of the standard genetic algorithm, with the average of the evaluation metrics taken over three rounds of solving. GreenRP_x denotes the iterative performance of GreenRP in the x-th round of solving, illustrating GreenRP’s self-learning capabilities with iteration curves corresponding to three rounds of solving.
The simulation work was conducted under the condition of weight coefficients X:Y:Z = 1:1:1, where the three values represent the significance of network lifetime, packet loss rate, and delay in solving the ultimate objectives. It is observable from the figure that the iteration curves of the original genetic algorithm show significant fluctuations, occasionally exhibiting reverse growth, and tend to stabilize only in the later stages of iteration. GreenRP employs dynamic crossover and mutation probabilities, resulting in a pronounced decline in fitness trends and a smooth convergence process due to the implementation of an elitism preservation strategy. As the number of solving rounds increases, the starting point of the iteration curves significantly decreases, facilitating GreenRP’s search for quality solutions and, thus, quicker termination of iterations. In this manner, the algorithm not only enhances the quality of solutions but also optimizes the use of computational resources, offering an effective strategy for solving complex optimization problems. In terms of algorithm complexity, GreenRP resolves 1440 snapshots corresponding to energy-saving topologies in a total of 7 h. Although the algorithm is complex, it is used for offline pre-computation, and the lengthy computation time does not affect its application.
To investigate the impact of different weight ratios on algorithm performance, various weight ratios were selected for simulation testing. Additionally, to better understand the algorithm’s convergence characteristics, performance data under the SP strategy was introduced in the figure as a baseline reference line. The SP algorithm does not take any energy-saving requirements into account and makes no changes to the topology. It only performs routing selection based on the shortest path. Moreover, the SP algorithm is widely accepted by the public and used in real-world scenarios. Figure 8b and Figure 9, respectively, display the data on network lifetime, packet loss rate, and average service delay under different weight ratios.
Increasing a single coefficient improves the corresponding performance metric, while other metrics decline. For instance, increasing the delay weight coefficient (e.g., 1:1:9) or the packet loss weight coefficient (e.g., 9:1:1) results in a reduction in network lifetime compared to the baseline ratio of 1:1:1. Conversely, when the network lifetime coefficient is increased (e.g., 9:1:1), the enhancement in network lifetime is significantly pronounced. This is because the satellite optical network’s energy-saving routing problem is a multi-objective optimization issue where different goals influence each other. Adjustments to the weight coefficients directly determine the algorithm’s focus, with an increase in a particular metric’s weight leading to prioritized improvements in that area, potentially at the expense of other metrics. Hence, the GreenRP algorithm can meet specific performance demands by adjusting the weight ratios.
From the perspective of network lifetime (Figure 8b), GreenRP shows significant improvements across all weight configurations compared to SP, indicating that extending network lifetime by putting satellite payloads to sleep is a relatively achievable goal, consistently attainable under various weight configurations. In the packet loss analysis (Figure 9a), we observe that increasing the weight on network lifetime significantly raises the packet loss rate compared to other weight distribution schemes. This is due to the reduction in network capacity from more payloads being put to sleep, consequently increasing packet loss rates. However, increasing the weight on average service delay slightly raises the packet loss rate, reflecting the network’s congestion state where shorter paths facilitate successful transmissions, and longer paths tend to drop data. Nevertheless, the packet loss rate remains close to SP’s baseline in most cases, demonstrating that optimizing network topology and payload sleeping strategies effectively supports current service demands while extending network life. When the weight corresponding to packet loss increases, packet loss can be lower than SP, suggesting that trimming the topology might better adapt to traffic demands, reducing packet loss compared to earlier configurations. Finally, regarding average service delay (Figure 9b), increasing the delay weight coefficient significantly reduces delays. However, increasing weights for packet loss and network lifetime results in higher delays, indicating that reducing service delays under a topology planning scheme requires careful consideration of weight ratios.
Collectively, these analyses necessitate a comprehensive consideration of the weight configurations across various performance metrics to achieve an energy-saving topology plan best suited for current network operations.

5. Conclusions

In this paper, we investigate the critical challenge of energy-efficient routing in edge-AI-driven satellite optical networks (SONs), where intensive on-orbit computation and laser inter-satellite communications exacerbate battery degradation through frequent depth-of-discharge (DoD) events. We proposed GreenRP, a task-aware routing framework that strategically optimizes network topology through payload dormancy and discharge-resilient path selection, explicitly addressing the spatial-temporal imbalances in AI workloads. Addressing the challenge posed by uneven global traffic distribution, which leads to idle energy consumption in some satellites, the algorithm optimizes the original network topology based on satellite traffic demands. It strategically places less critical communication payloads in dormancy, thereby reducing unnecessary lifetime consumption and enhancing the overall efficiency of the network. The simulation results show that, compared with the conventional methods, GreenRP not only extends the network’s lifetime by up to 176% but also ensures that the increase in operational duration does not come at the cost of reduced performance. These attributes make GreenRP a promising solution for future satellite network operations, offering a balanced approach between energy efficiency and reliable service delivery. With the development of edge AI and the increasing complexity and scale of satellite networks, the principles of GreenRP will play an invaluable role in guiding the development of sustainable, efficient, and high-performance network architectures.
However, GreenRP could be further optimized by edge AI and integrating real-time traffic prediction models. This would enable the framework to more accurately anticipate traffic changes, adjust network topology and payload dormancy status in advance, and further improve energy efficiency. Regarding practical deployment issues, it is necessary to consider the ability of satellite hardware to support frequent dormancy and wake-up operations, as well as the impact of differences in communication environments of satellites in different orbits on path selection. Subsequent research can carry out adaptability optimization for these practical problems.

Author Contributions

Conceptualization, H.Z. and Y.Z.; methodology, H.Z.; software, K.Z.; validation, H.Z., D.D. and K.Z.; formal analysis, H.Z.; investigation, D.D.; resources, J.Z.; data curation, L.Z.; writing—original draft preparation, H.Z.; writing—review and editing, Y.Z.; visualization, Y.C.; supervision, Y.Z.; project administration, H.Z.; funding acquisition, Y.Z. All authors have read and agreed to the published version of the manuscript.

Funding

This research was funded by the NSFC project, grant number 62425105, 62350001, 62021005, and 62201276; the Shenzhen Science and Technology Program, grant number KJZD20240903100009013; and the Fundamental Research Funds for the Central Universities, grant number 530424001.

Data Availability Statement

The data are contained within the article.

Conflicts of Interest

The authors declare no conflicts of interest.

References

  1. Saeed, N.; Almorad, H.; Dahrouj, H.; Al-Naffouri, T.Y.; Shamma, J.S.; Alouini, M.-S. Point-to-Point Communication in Integrated Satellite-Aerial 6G Networks: State-of-the-Art and Future Challenges. IEEE Open J. Commun. Soc. 2021, 2, 1505–1525. [Google Scholar] [CrossRef]
  2. Zhang, Y.; Jiang, W.; Wan, P.; Liu, A.; Han, H.; Mu, J.; Liu, S.; Gu, W.; Huang, S.; Feng, Z. Building an Efficient Satellite Network Routing Scheme: Challenges and Opportunities. IEEE Commun. Stand. Mag. 2025, 9, 30–38. [Google Scholar] [CrossRef]
  3. Kaushal, H.; Kaddoum, G. Optical Communication in Space: Challenges and Mitigation Techniques. IEEE Commun. Surv. Tutor. 2017, 19, 57–96. [Google Scholar] [CrossRef]
  4. Ahmed, S.A.; Mohsin, M.; Ali, S.M.Z. Survey and technological analysis of laser and its defense applications. Def. Technol. 2021, 17, 583–592. [Google Scholar] [CrossRef]
  5. Kota, S.; Giambene, G. 6G Integrated Non-Terrestrial Networks: Emerging Technologies and Challenges. In Proceedings of the 2021 IEEE International Conference on Communications Workshops (ICC Workshops), Montreal, QC, Canada, 14–23 June 2021; pp. 1–6. [Google Scholar]
  6. Shaengchart, Y.; Kraiwanit, T. The Spacex Starlink Satellite Project: Business Strategies and Perspectives. Corp. Bus. Strategy Rev. 2024, 5, 30–37. [Google Scholar] [CrossRef]
  7. Ntontin, K.; Lagunas, E.; Querol, J.; ur Rehman, J.; Grotz, J.; Chatzinotas, S.; Ottersten, B. A vision, survey, and roadmap toward space communications in the 6G and beyond era. Proc. IEEE 2025, 1–37. [Google Scholar] [CrossRef]
  8. De Gaudenzi, R.; Ottersten, B.; Perez-Neira, A.; Yanikomeroglu, H.; Heyn, T.; Lichten, S.M. Guest Editorial Space Communications New Frontiers: From Near Earth to Deep Space. IEEE J. Sel. Areas Commun. 2024, 42, 1023–1028. [Google Scholar] [CrossRef]
  9. Zheng, Y.; Zhang, G.; Huan, Z.; Zhang, Y.; Yuan, G.; Li, Q.; Ding, G.; Lv, Z.; Ni, W.; Shao, Y.; et al. Wireless laser power transmission: Recent progress and future challenges. Space Sol. Power Wirel. Transm. 2024, 1, 17–26. [Google Scholar] [CrossRef]
  10. Mao, Y.; Yu, X.; Huang, K.; Zhang, Y.J.A.; Zhang, J. Green edge AI: A contemporary survey. Proc. IEEE 2024, 112, 880–911. [Google Scholar] [CrossRef]
  11. Yu, B.; Zhang, T.; Liu, T.; Yao, L. Reliability Evaluation and In-Orbit Residual Life Prediction for Satellite Lithium-Ion Batteries. Math. Probl. Eng. 2018, 2018, 5918068. [Google Scholar] [CrossRef]
  12. Liu, Y.; Li, X.; Li, D.; Huang, S. Energy-efficient regeneration routing in satellite optical networks under translucent optical payload architectures. Opt. Express 2024, 32, 12368–12393. [Google Scholar] [CrossRef]
  13. Jing, Y.; Yang, Z.; Zhao, Y.; Wang, H.; Wang, W.; Rahman, S.; Zhang, J. Energy-efficient routing based on a genetic algorithm for satellite laser communication. Opt. Express 2023, 31, 8682–8695. [Google Scholar] [CrossRef]
  14. Chen, F.; Wang, Q.; Ran, Y. Dynamic routing algorithm for maximizing battery life in LEO satellite networks. In Proceedings of the 2022 IEEE 8th International Conference on Computer and Communications (ICCC), Chengdu, China, 9–12 December 2022; pp. 671–676. [Google Scholar]
  15. Shi, K.; Li, H.; Suo, L. Temporal graph based energy-limited max-flow routing over satellite networks. In Proceedings of the 2021 IFIP Networking Conference (IFIP Networking), Espoo and Helsinki, Finland, 21–24 June 2021; pp. 1–3. [Google Scholar]
  16. Liu, J.; Zhao, B.; Xin, Q.; Su, J.; Ou, W. DRL-ER: An intelligent energy-aware routing protocol with guaranteed delay bounds in satellite mega-constellations. IEEE Trans. Netw. Sci. Eng. 2020, 8, 2872–2884. [Google Scholar] [CrossRef]
  17. Gupta, N.; Bitragunta, S. Green satellite communication link design, optimization, and performance analysis. In Proceedings of the 2020 IEEE 7th Uttar Pradesh Section International Conference on Electrical, Electronics and Computer Engineering (UPCON), Prayagraj, India, 27–29 November 2020; pp. 1–5. [Google Scholar]
  18. Tu, Z.; Zhou, H.; Li, K.; Li, M.; Tian, A. An energy-efficient topology design and DDoS attacks mitigation for green software-defined satellite network. IEEE Access 2020, 8, 211434–211450. [Google Scholar] [CrossRef]
  19. Tsuchida, H.; Kawamoto, Y.; Kato, N.; Kaneko, K.; Tani, S.; Hangai, M.; Aruga, H. Improvement of Battery Lifetime Based on Communication Resource Control in Low-Earth-Orbit Satellite Constellations. IEEE Trans. Emerg. Top. Comput. 2021, 10, 1388–1398. [Google Scholar] [CrossRef]
  20. Hussein, M.; Jakllari, G.; Paillassa, B. On routing for extending satellite service life in leo satellite networks. In Proceedings of the 2014 IEEE Global Communications Conference, Austin, TX, USA, 8–12 December 2014; pp. 2832–2837. [Google Scholar]
  21. Yang, Y.; Xu, M.; Wang, D.; Wang, Y. Towards energy-efficient routing in satellite networks. IEEE J. Sel. Areas Commun. 2016, 34, 3869–3886. [Google Scholar] [CrossRef]
  22. Chou, Y.C.; Ma, X.; Wang, F.; Ma, S.; Wong, S.H.; Liu, J. Towards Sustainable Multi-Tier Space Networking for LEO Satellite Constellations. In Proceedings of the 2022 IEEE/ACM 30th International Symposium on Quality of Service (IWQoS), Oslo, Norway, 10–12 June 2022; pp. 1–11. [Google Scholar]
  23. Yang, L.; Zhang, H.; Qi, Y.; Huang, Q. Available energy routing algorithm considering QoS requirements for LEO satellite network. Comput. Commun. 2024, 217, 87–96. [Google Scholar] [CrossRef]
  24. Liu, Y.; Li, X.; Li, D.; Zhao, C.; Huang, S. Green laser inter-satellite link planning in satellite optical networks: Trading off the battery lifetime and network throughput using numerical quantization. J. Opt. Commun. Netw. 2024, 16, 868–880. [Google Scholar] [CrossRef]
  25. Taherbaneh, M.; Ghafooifard, H.; Rezaie, A.H.; Rahimi, K. Evaluation end-of-life power generation of a satellite solar array. Energy Convers. Manag. 2011, 52, 2518–2525. [Google Scholar] [CrossRef]
  26. Liu, Z.; Tan, C.M.; Leng, F. A reliability-based design concept for lithium-ion battery pack in electric vehicles. Reliab. Eng. Syst. Saf. 2015, 134, 169–177. [Google Scholar] [CrossRef]
  27. Wierman, A.; Andrew, L.L.; Tang, A. Power-aware speed scaling in processor sharing systems: Optimality and robustness. Perform. Eval. 2012, 69, 601–622. [Google Scholar] [CrossRef]
  28. Zhu, Y. An analysis of influence of satellite design lifetime. Spacecr. Eng. 2007, 16, 9–18. [Google Scholar]
  29. INTERNET USAGE STATISTICS. The Internet Big Picture World Internet Users and 2023 Population Stats. Available online: https://www.internetworldstats.com/stats.htm (accessed on 1 December 2023).
  30. Liang, J.; Chaudhry, A.U.; Yanikomeroglu, H. Phasing Parameter Analysis for Satellite Collision Avoidance in Starlink and Kuiper Constellations. In Proceedings of the 2021 IEEE 4th 5G World Forum (5GWF), Montreal, QC, Canada, 13–15 October 2021; pp. 493–498. [Google Scholar]
Figure 1. Illumination energy effects on satellite constellation.
Electronics 14 03075 g001
Figure 2. The global traffic demand.
Electronics 14 03075 g002
Figure 3. Energy-efficient topology planning principles.
Electronics 14 03075 g003
Figure 4. Comparison of algorithm performance under different loads: (a) latency performance; (b) packet loss rate and load sleep variation.
Electronics 14 03075 g004
Figure 5. Link utilization cumulative distribution function (CDF).
Electronics 14 03075 g005
Figure 6. Comparative chart of satellite residual energy.
Electronics 14 03075 g006
Figure 7. Lifecycle consumption curve of different algorithms.
Electronics 14 03075 g007
Figure 8. (a) Fitness iteration curve; (b) network lifetime metrics in relation to weight coefficients.
Electronics 14 03075 g008
Figure 9. (a) Packet loss rate metrics in relation to weight coefficients; (b) average service delay metrics in relation to weight coefficients.
Electronics 14 03075 g009
Table 1. Simulation settings.
ParameterValue
Orbital Altitude550 km, 570 km
Number of Orbits36, 18
Satellites per Orbit22, 20
Orbital Inclination53°, 70°
RAAN180°
Inter-Satellite Laser Link Bandwidth10 Gbps
Ground-to-Satellite Link Bandwidth8 Gbps
P O S 100 W
P o t h e r 150 W
η / ξ / ρ g 1/1/1.5 W/Gbps
φ 0.1
λ 1.4
A 0.6
i t e r max 40
Service Bandwidth50 MB
Disclaimer/Publisher’s Note: The statements, opinions and data contained in all publications are solely those of the individual author(s) and contributor(s) and not of MDPI and/or the editor(s). MDPI and/or the editor(s) disclaim responsibility for any injury to people or property resulting from any ideas, methods, instructions or products referred to in the content.

