1. Introduction
The issue of voltage regulation associated with peak loads and reverse power flow periods is one of the main power quality challenges confronting distribution network service providers (DNSPs) as the electricity supply grid integrates large volumes of solar PV generation both in terms of numbers and capacity [
1]. As of 31 March 2025, more than 4.09 million PV systems have been installed in Australia, with a total installed capacity exceeding 40.6 GW, making it one of the most solar-saturated grids globally [
2]. This makes it important to investigate how future grids need to operate to ensure that voltage levels remain within required parameters. For example, the Australian Standard AS 61000.3.100 requires the voltage at the consumer point of supply to be within ±10% of the nominal 230 V for single-phase LV customers (207–253 V) [
3]. In this environment of rapidly increasing distributed generation, the devices traditionally used in distribution networks to manage voltage regulation, such as on-load tap changers (OLTCs) at zone substations, line voltage regulators, and capacitor banks, are often unable to maintain voltage magnitudes in LV networks within the prescribed limits [
4,
5,
6]. These devices were designed based on the assumption of unidirectional power flow from large centralized sources to downstream distribution networks. Bidirectional power flow resulting from distributed generation limits the ability of these devices to maintain voltage regulation.
To mitigate long-term voltage regulation problems, common practice by DNSPs includes shortening LV networks by installing new distribution transformers and replacing transformers and cables with equipment of higher rated capacity and/or lower impedance (i.e., reconductoring). These solutions are generally expensive and require scheduled power outages. In recent times, researchers have proposed the use of energy storage devices (typically batteries) to regulate the flow of real power and ensure reduced reverse power flow and peak load shaving during evening peaks [
7,
8,
9,
10,
11]. However, even though prices are on the decline, wide adoption of battery energy storage for this application is still not economically feasible in practice. In addition to managing the dynamic nature of loads and maintaining the state of charge (SoC) of energy storage systems, power balancing algorithms are required, which involve sophisticated communication infrastructure that is not available in most electricity networks.
A STATCOM is a voltage source converter historically utilized in MV and HV networks for voltage stability and for mitigating voltage fluctuations. The application of STATCOMs at the distribution network level is considered feasible due to advancements in modern power electronic technology and their reduced costs, where they may be extended to mitigate multiple power quality disturbances. This paper focuses on low-voltage networks in the Australian context, where the deployment of STATCOMs is particularly relevant. Australia is widely recognised as having the highest levels of rooftop PV penetration globally, especially in residential areas. The LV distribution networks in Australia typically include long overhead four-wire feeders with multiple earthed neutral (MEN) grounding and uneven single-phase loading. These characteristics lead to heightened sensitivity to voltage rise, drop, and unbalance, particularly in rural and suburban feeders. Such conditions differ markedly from LV systems in other regions—such as the shorter underground three-wire networks common in Europe or North America—and make Australian LV feeders a strong candidate for evaluating LV STATCOM-based voltage regulation strategies.
The ability of a STATCOM to mitigate voltage disturbances caused by varying load dynamics in distribution networks is considered in refs. [
12,
13]. The studies are supported by time domain simulations that show improvements in the voltage at the PCC through reactive power regulation. However, the study does not include distributed generation and system performance considerations or analyses of the change in system losses. In ref. [
14], a combined voltage regulation method using both OLTCs and distribution system STATCOMs to maintain the radial MV network voltage levels is investigated, with the STATCOM placed at the end of the MV feeder. The placement of STATCOMs in the network also plays a key role in its efficacy in voltage regulation. The authors of [
15] investigate the application of STATCOMs to improve the voltage profile in distribution systems and propose an algorithm to identify the best location for the placement of the STATCOM to minimize line losses in the system. Although the improvement in voltage levels is investigated, the study omits the time-varying nature of loads, which requires the STATCOM to operate at different output levels. A similar approach is presented in ref. [
16], where stability issues are also introduced and taken into account for finding the optimum location for placement of the STATCOMs.
However, the majority of the literature discussed above focuses on medium-voltage (MV) or transmission-level systems, with little to no attention given to their application in low-voltage (LV) networks. In particular, very few studies examine the specific characteristics of LV feeders in the Australian context, such as long four-wire configurations, MEN grounding, and extremely high levels of rooftop solar PV penetration. As a result, the relevance of these existing methods to the Australian LV environment is limited. This paper aims to fill this gap by focusing specifically on STATCOM deployment strategies for Australian-style LV feeders under high-DER penetration.
It is evident that STATCOMs are effective in improving voltage regulation; however, the main thrust of the work to date concentrates on control and the internal operation of the device’s power electronics. There exist gaps in the literature with respect to the long-term performance of STATCOMs when deployed in electricity supply networks, especially their application within LV networks. The main contributions of this paper are related to the application of STATCOMs in radial four-wire LV feeders and can be summarised as follows:
A design guide to determine the size of the STATCOM for a general LV feeder is provided, depending on the loading and penetration level of rooftop solar generation.
The optimum location of the STATCOM and the optimum droop control curve are obtained to identify the levels of reactive power injection required for voltage support, considering the stochastic nature of power flow in future power grids. For the purposes of this study, a four-wire modelling approach is used, and the neutral conductor is modelled explicitly [
17]. Both voltage unbalance and current unbalance in the system are considered.
Detailed analysis of the impact of using the STATCOM on neutral conductor potentials and currents, considering the importance of the neutral or stray voltage analysis, is provided, as identified in refs. [
18,
19,
20].
Field measurements from actual LV feeder deployments are presented to validate the simulation results and demonstrate the real-world applicability of the proposed approach.
The remainder of the paper is divided into four sections:
Section 2 introduces the problem of voltage drop and voltage rise in distribution networks and how high penetration levels of solar PV generation may exacerbate the situation.
Section 3 discusses how STATCOMs may be used to improve voltage regulation and the design process used to determine the rating and location of STATCOMs in a four-wire LV feeder.
Section 4 summarizes the results from a case study undertaken on a typical four-wire LV feeder, which includes distributed solar PV generation, and investigates the efficacy of STATCOMs for the improvement of voltage regulation.
Section 5 concludes this paper, summarizing the key findings.
All simulations presented in this paper were performed using the OpenDSS simulation platform and time-series simulations using 1 min interval data.
2. Voltage Profiles in Future LV Feeders
In traditional LV electricity supply networks, voltage magnitudes were predictable due to the fact that LV networks could be considered as a load only. However, the recent rapid uptake of rooftop PV systems in LV networks has altered this behaviour, making understanding of the performance of LV distribution networks essential for effective future grid planning. The nature of two-way power flow in LV networks requires enhanced considerations of voltage regulation within LV distribution systems as being dependent on control devices from upstream HV and MV networks that may no longer be viable. The LV distribution network’s design considered in this paper is a radial four-wire feeder (400 VLL nominal voltage) supplied by a delta-wye transformer connected to a three-wire MV network (11 kVLL nominal voltage). This section of the paper formulates the voltage deviations of an LV distribution network, considering high penetration of distributed generation (solar PV).
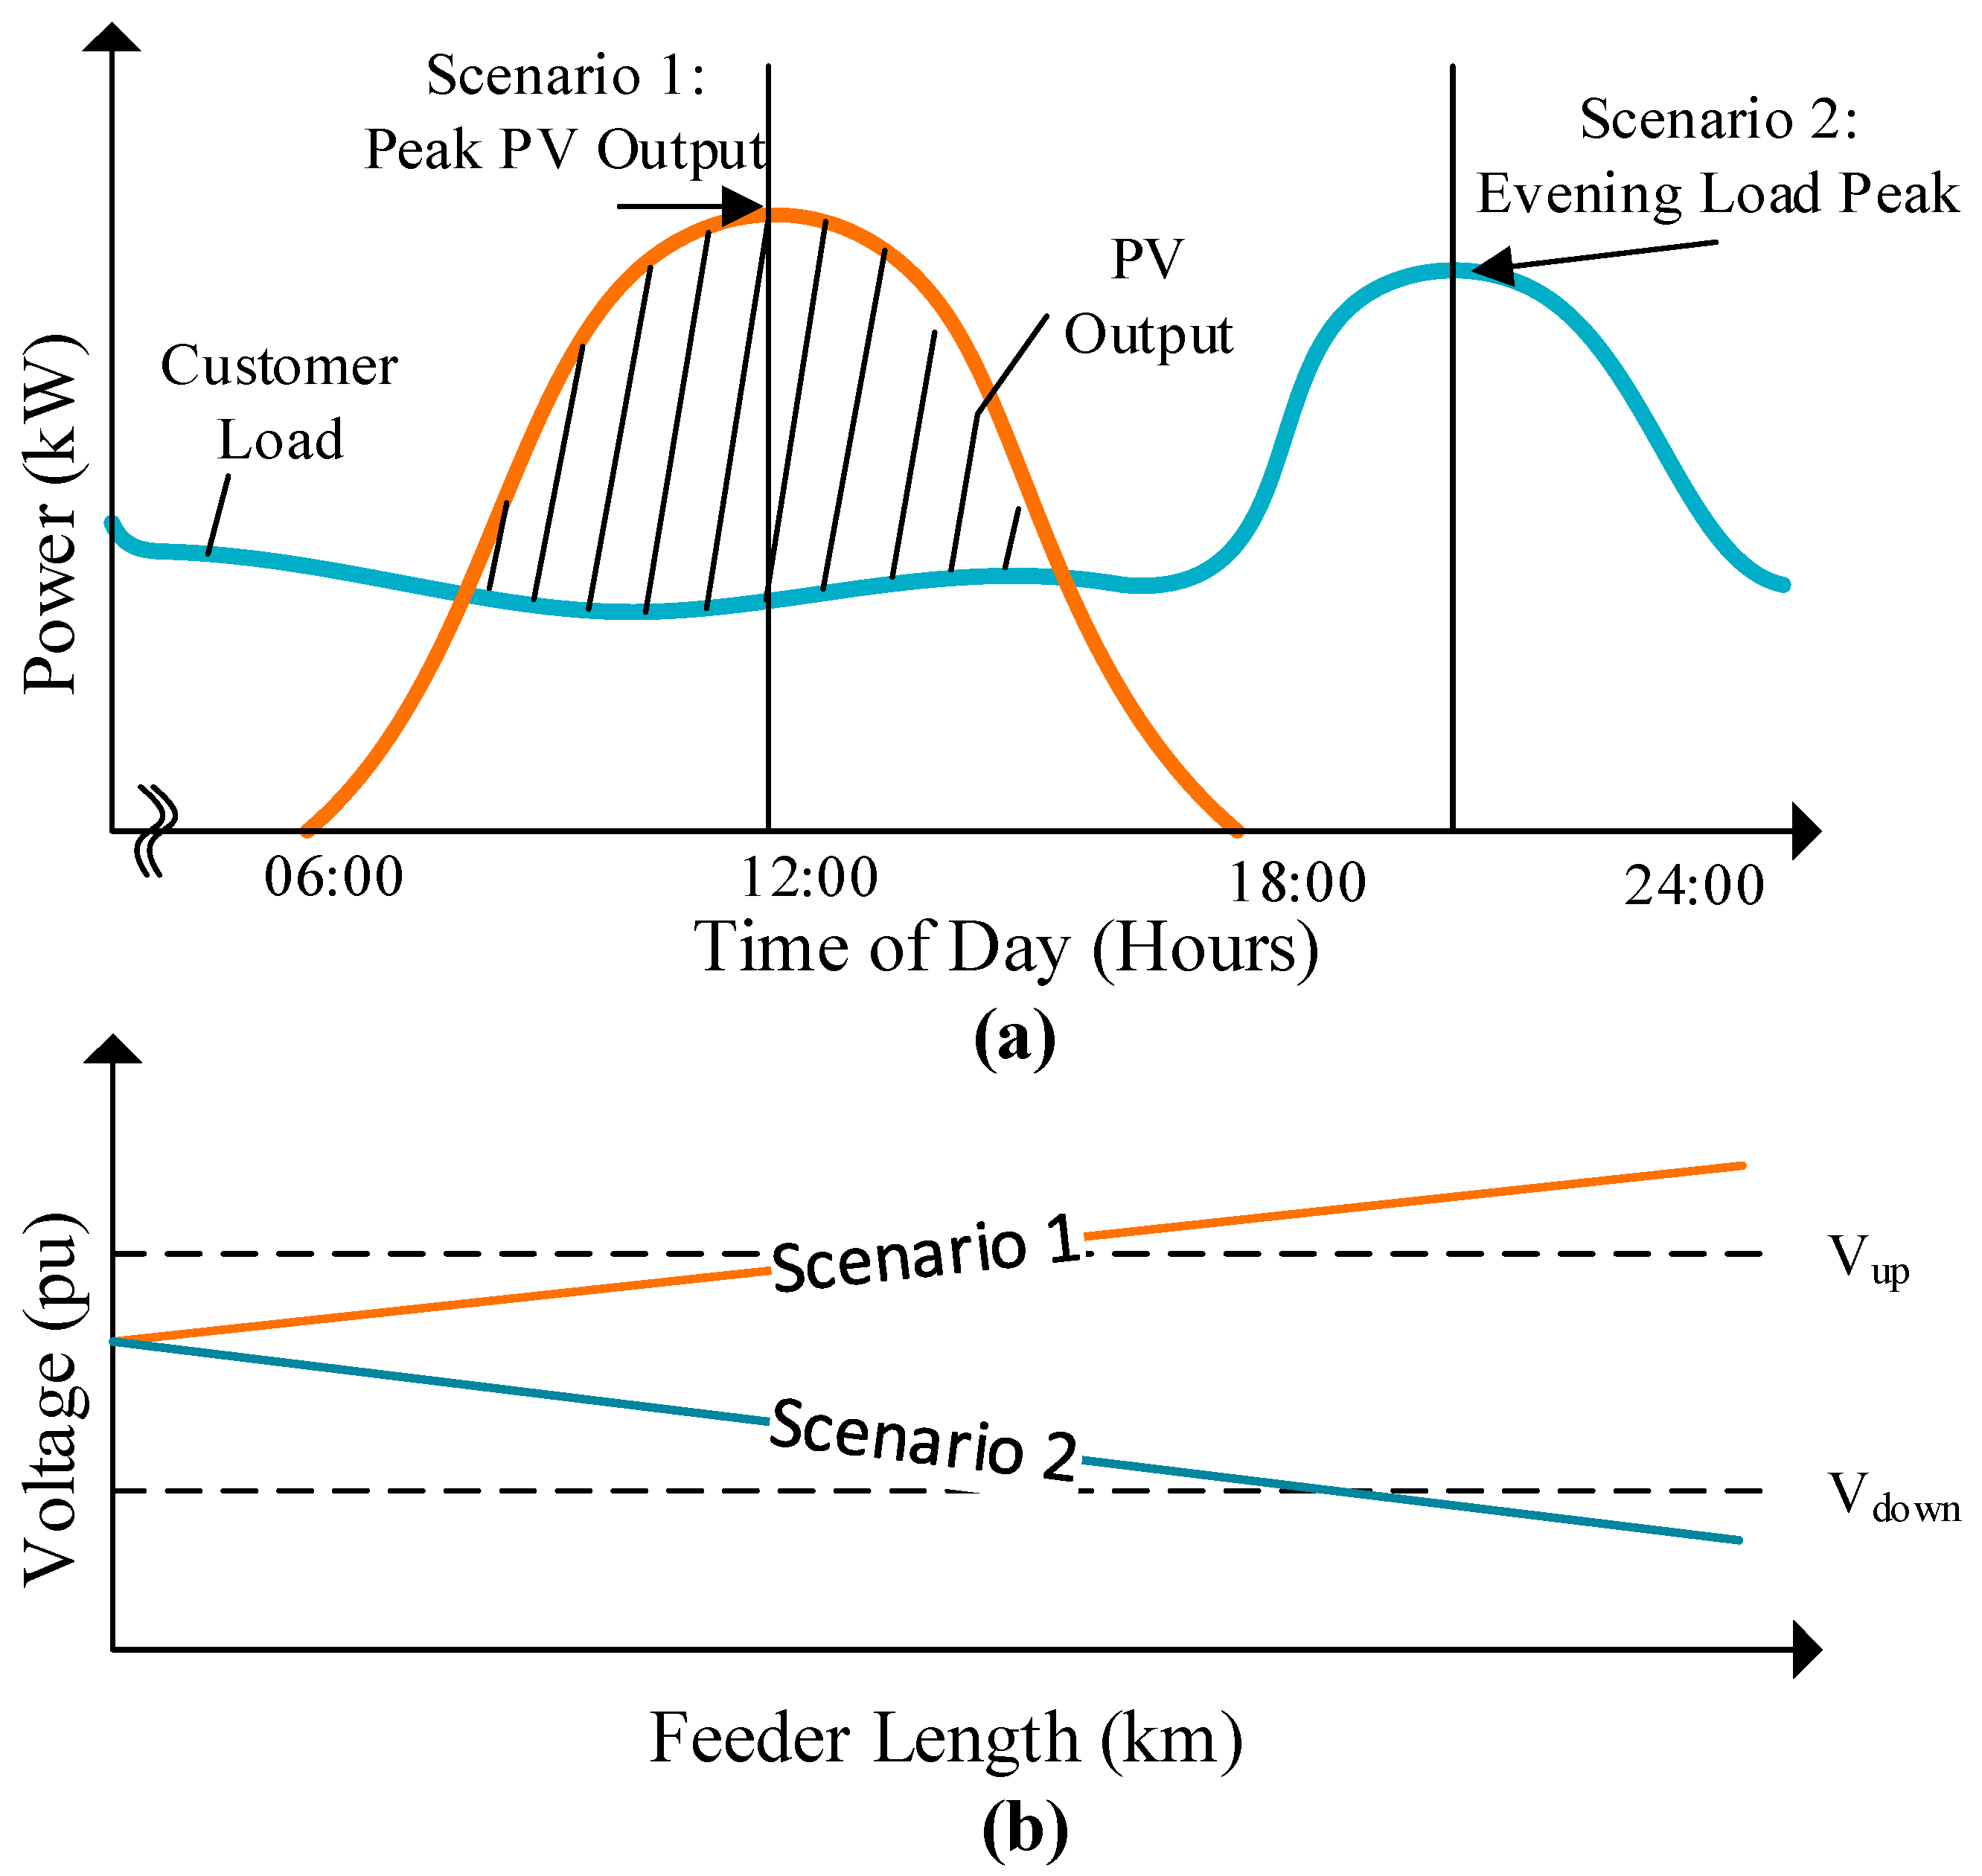
Figure 1a depicts the active power variations of the load and PV output for a typical clear sunny day. Considering a future network scenario where all residential connections incorporate a rooftop solar PV generation system, it is evident that LV feeders will experience the maximum voltage increase for Scenario 1, and a maximum voltage decrease is observed for Scenario 2.
Figure 1b shows the voltage profiles along a typical LV feeder for the above two scenarios. Depending on the impedance of the conductor and the loading level, the voltage towards the feeder end may fall outside the allowable voltage limits.
LV feeders vary greatly in length, loading, and topology, including underground (dense urban loads and newer developments) and overhead (most existing residential loads) systems. No prescriptive classification of LV feeders can be found in the literature. To derive a generalized equation to calculate the total voltage deviations, a feeder with resistance
R Ω/km, reactance
X Ω/km, and total length of
l km is considered. It is assumed that loads are uniformly distributed, as per the standard design practice. At a particular time (
t) of the day, the total feeder complex power (
S) can be expressed as follows:
where
PLoad,
PPV, and
QLoad represent the total real and reactive power, respectively. The common convention of modelling generation as a negative load is used. Although modern inverters have reactive power control capabilities, for the purposes of this study, it is assumed that the PV generators operate with respect to the unity power factor to ensure that there is no active power curtailment from the renewable generation source.
For the formulation of measuring the level of deviation in voltage levels along a feeder, an “exact” lumped load model is used ref. [
21]. Assuming that loads are uniformly distributed, this model lumps the load into two segments, simplifying the network to calculate the approximate voltage deviation in the feeder.
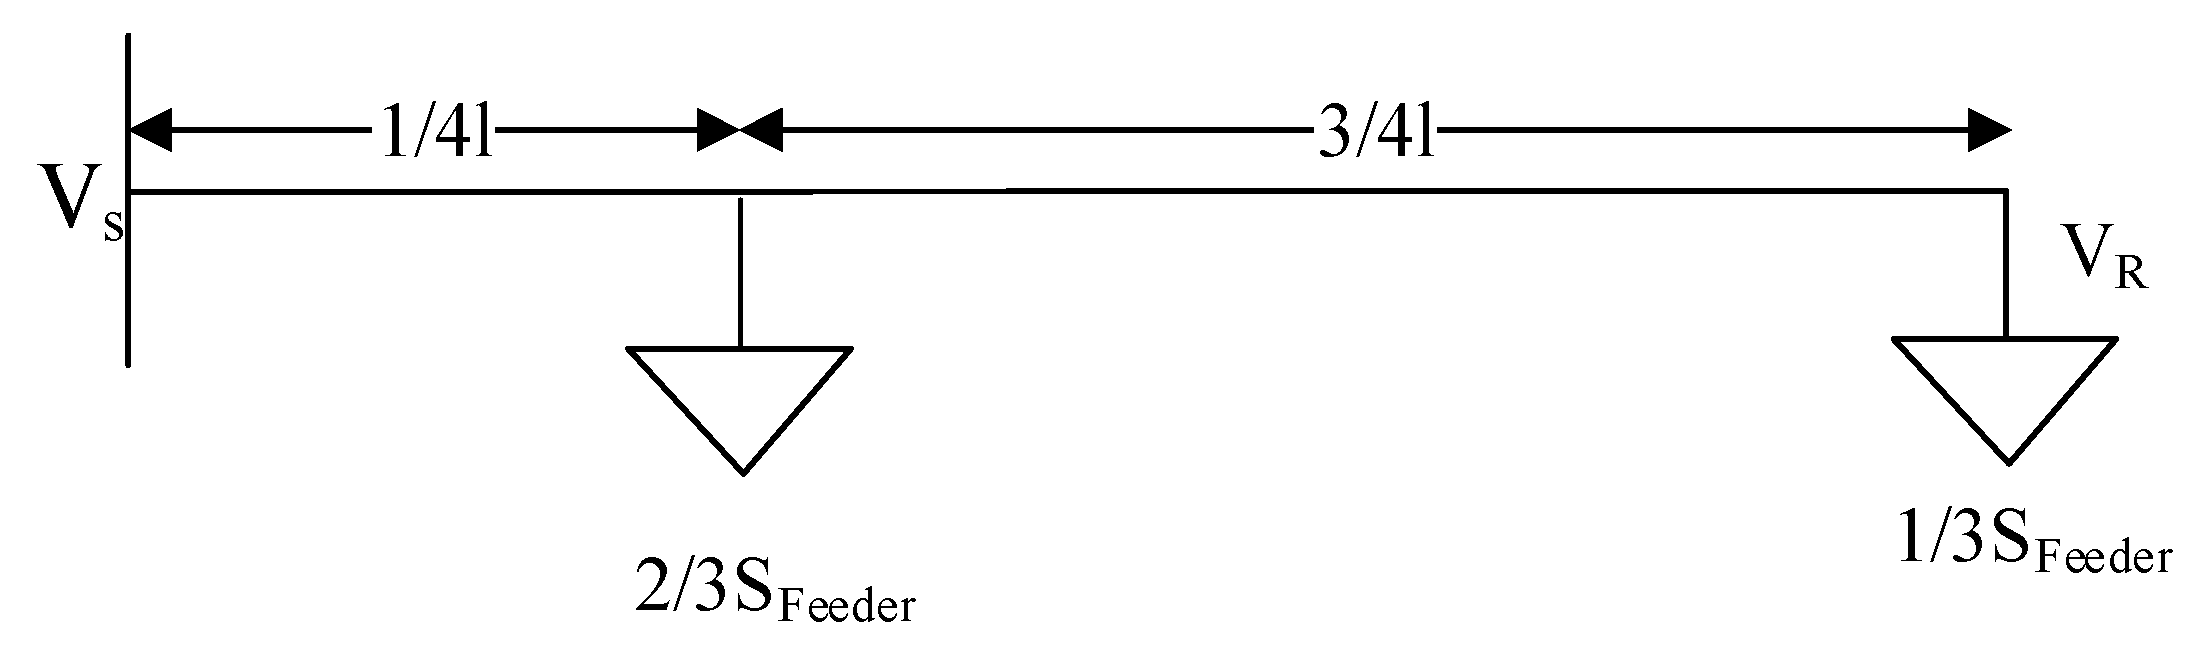
Figure 2 depicts the single-line diagram of a model described in ref. [
22], where a distribution network feeder with multiple nodes can be modelled by placing two-thirds of the total apparent power (measured at the LV transformer) at 0.25
l, where
l is the total length of the feeder, and the remainder is placed at the end of the feeder. Here, vs. and
VR are the sending and receiving end voltages of the feeder, respectively.
Assuming a constant current model for both the PV and loads, the voltage drop along the total feeder can be defined as follows:
where
In (2),
Zline (R +
jX) is the impedance of the line per unit length, and
Vnom represents the nominal voltage supply. For an Australian LV distribution network,
VNom is 230 V. According to ref. [
21], in distribution network studies, the phase difference between
Vs and
VR is negligible, which means that the voltage drop Δ
VFeeder can be approximated by the real component of Equation (2). Hence, the difference between the voltage magnitudes of the sending end and far end of the feeder can be represented as follows:
It can be seen that (3) provides a simple method for calculating the total voltage drop experienced in a general LV feeder with uniform loading. A positive value of VFeeder in Equation (3) indicates the voltage drop as power flows downstream. The above single-phase equivalent model outcomes of the feeder can be easily modified to cover three-phase unbalanced circuits.
3. Application of STATCOMs in LV Feeders to Improve the Voltage Profile
3.1. Basic Working Principle of STATCOMs
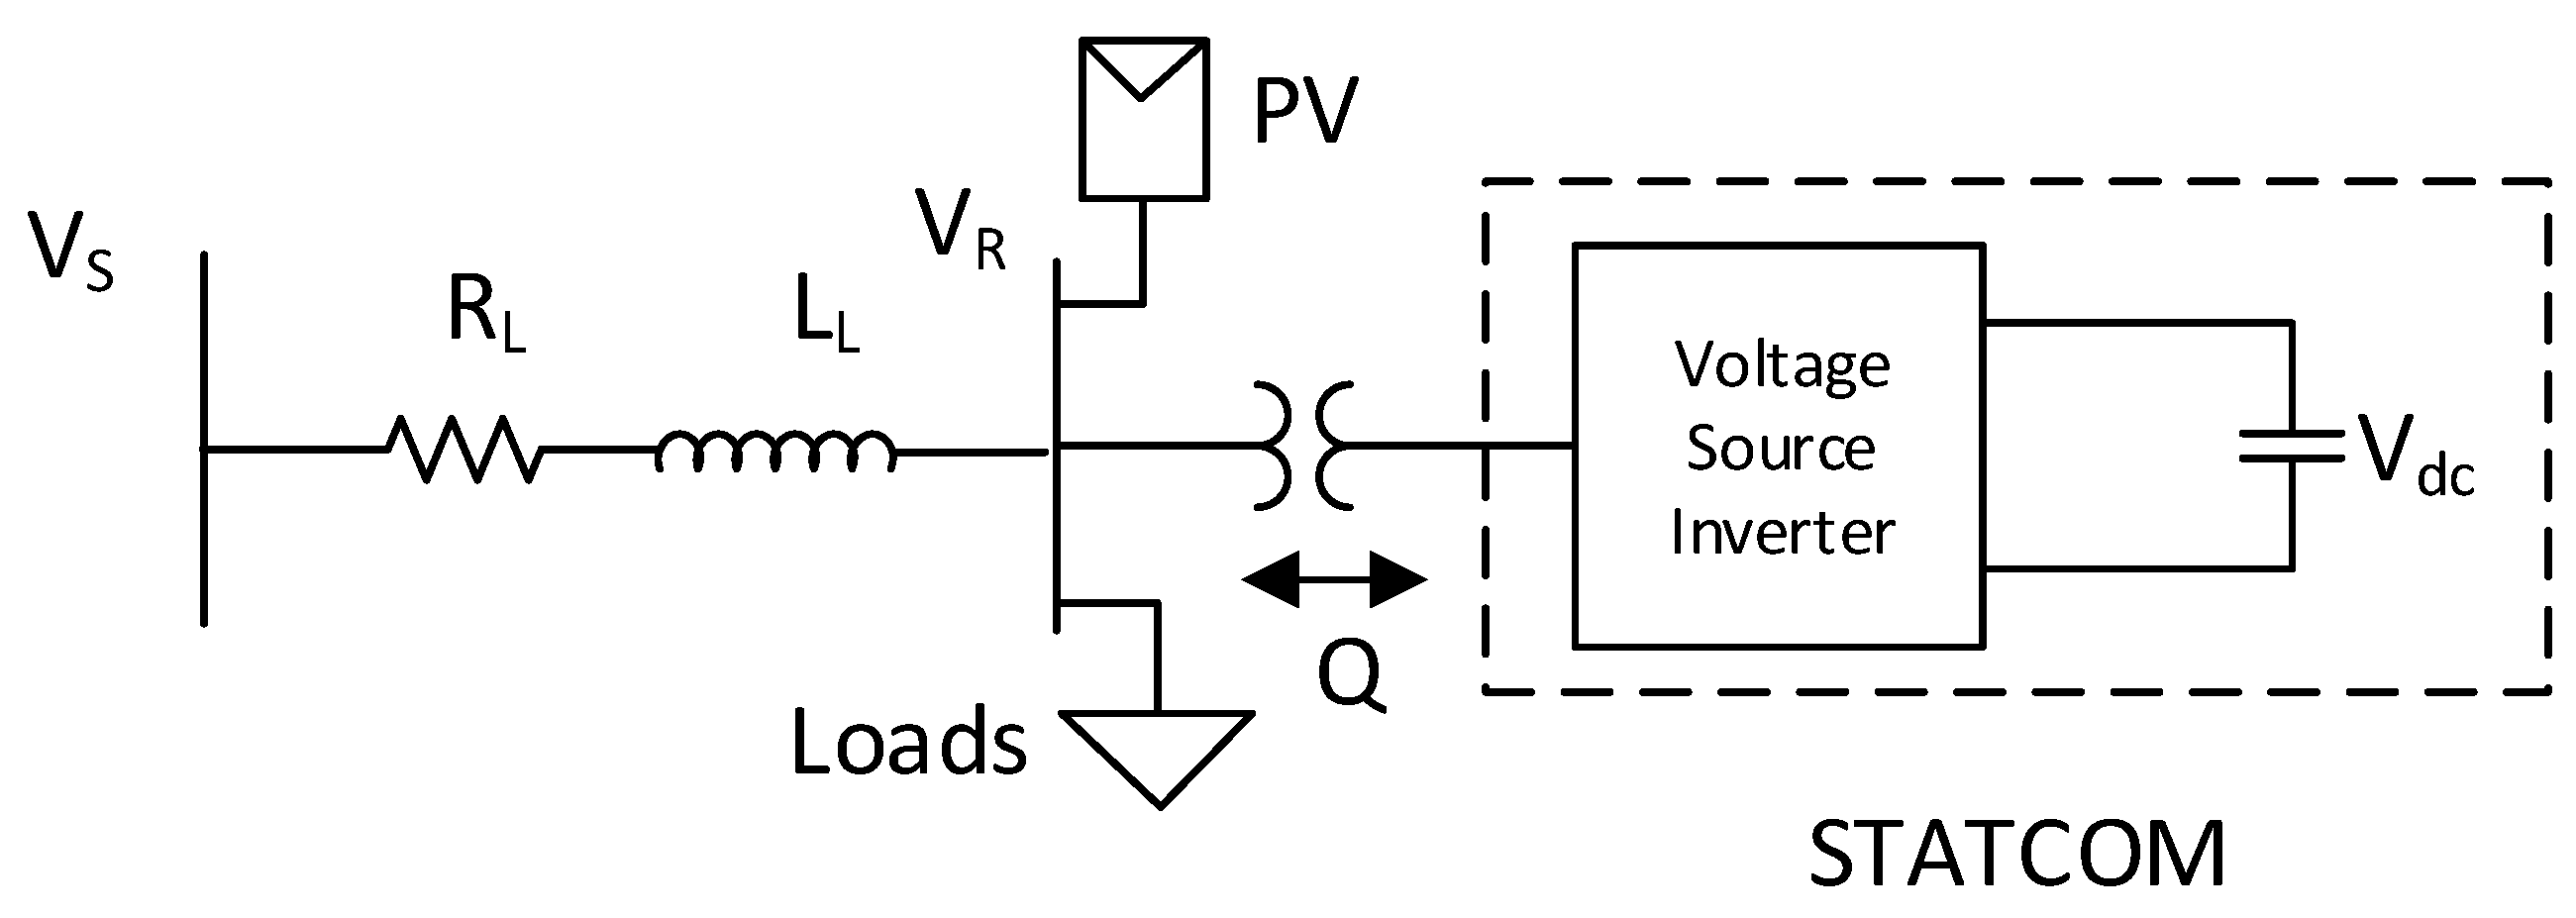
Figure 3 illustrates the equivalent connection of STATCOM to a simple two-bus LV distribution network. The basic structure of the device includes a voltage source inverter that is connected to the network by means of a coupling transformer. The STATCOM includes a capacitor to maintain the DC side voltage and to provide a mechanism for reactive power transfer. The inverter for a single-phase STATCOM can either be a two-level H-Bridge connection or a multilevel converter that can help reduce injected harmonics.
Neglecting any impact of harmonics associated with the switching of the STATCOM, the inverter side voltage in
Figure 3 can be represented as follows:
where
k represents the factor relating the DC voltage to the line-neutral voltage of the grid, and
α is the phase shift between the inverter voltage and grid voltage in the
d-
q frame.
In terms of reactive power regulation, the control variables
k and
α can be adjusted by controlling the switching signals of the inverter. However, based on the results presented in ref. [
23], it is evident that controlling both parameters is not economical due to the low efficiency achieved and high harmonic content in the inverter-side voltage. Hence, in practice, only the angle
α is controlled.
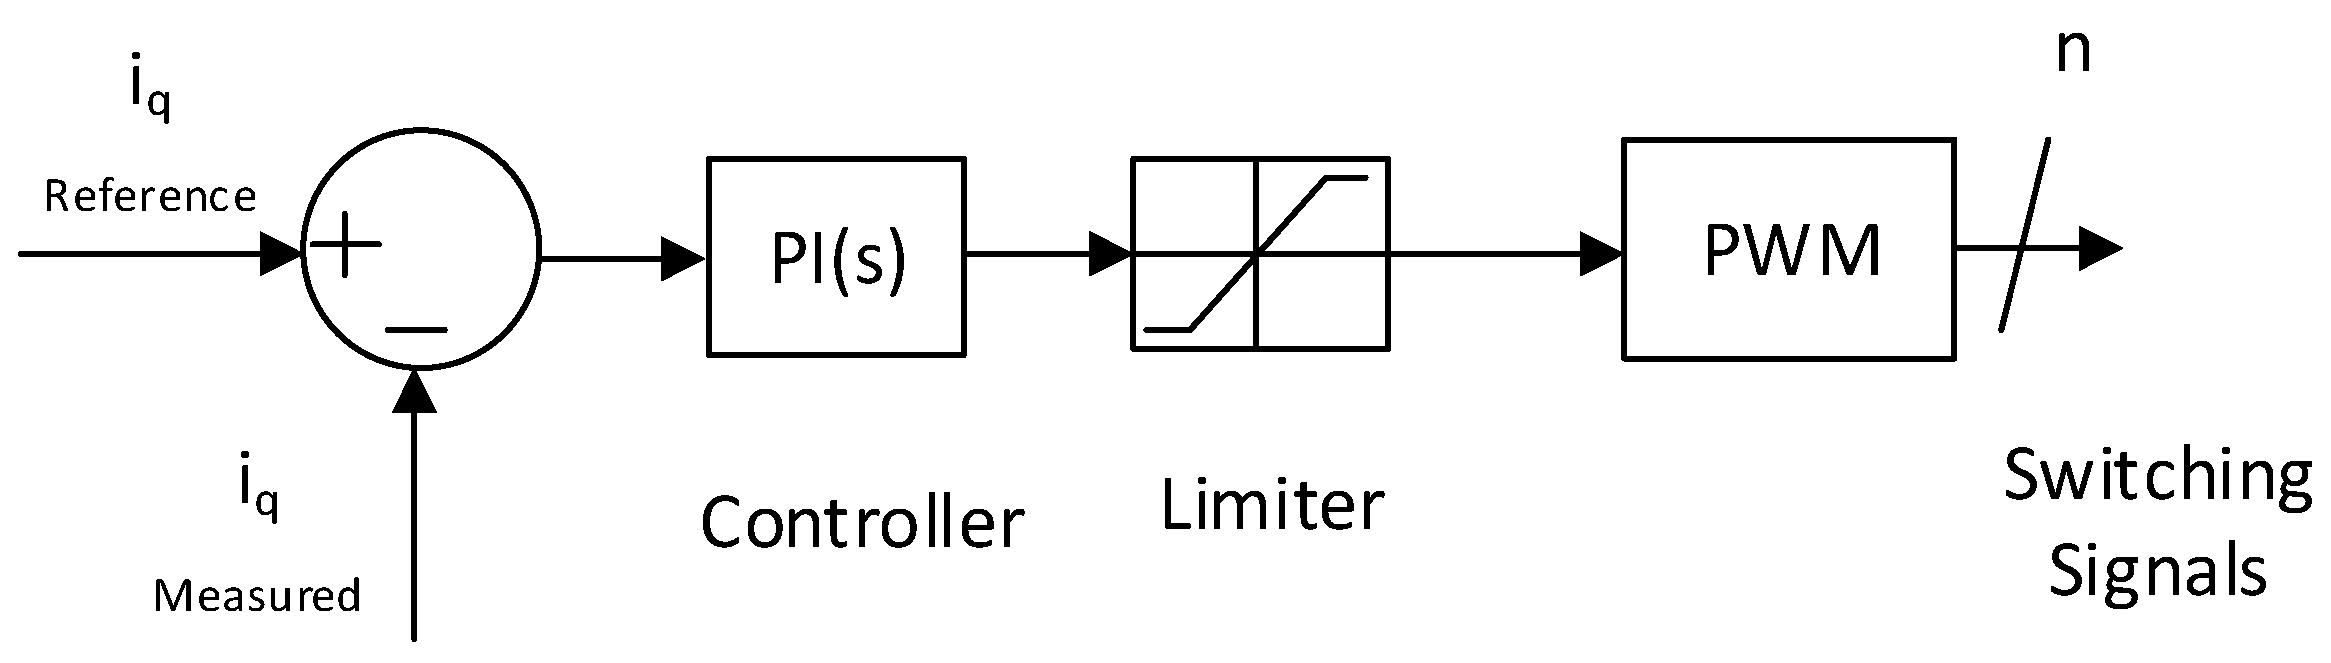
Figure 4 illustrates how a proportional integral (PI) controller can be applied to regulate the reactive component of the current (
iq) [
24], where
n is the number of switches depending on the STATCOM’s design.
A key advantage of Q-V droop-based STATCOMs is their independence from communication networks, which are often unavailable in existing LV feeders. While centralized control schemes require real-time measurements and communication links to coordinate multiple devices, the STATCOM’s local voltage sensing and autonomous droop control allow it to react instantly to voltage deviations. In contrast, Volt–VAr strategies in PV inverters are typically limited in reactive power capability and may require firmware or network upgrades to achieve similar performance. STATCOMs thus provide a “plug-and-play” solution that avoids costly infrastructure upgrades.
3.2. Placement of STATCOM in LV Feeders Based on Sensitivity Analysis
The primary objective of the application of STATCOMs, as addressed in this paper, is to mitigate the effects of steady-state voltage deviations due to solar PV generation. The placement of STATCOMs in the LV distribution network is determined based on voltage sensitivity analysis performed using the Newton–Raphson (NR) load flow technique [
25]. For this technique, the bus voltage magnitude and the corresponding angle sensitivities
and
relative to real and reactive power can be established using the elements of the inverse Jacobian matrix associated with the following converged solution:
where the sub matrices [
Sδp] and [
Sδq] are the bus angle sensitivities with respect to active and reactive powers, respectively, and [
Svp] and [
Svq] are the corresponding sensitivities associated with bus voltage magnitudes. The well-known sparse-matrix optimizations can be used in the simplification of calculations. From Equation (6), the elements of [
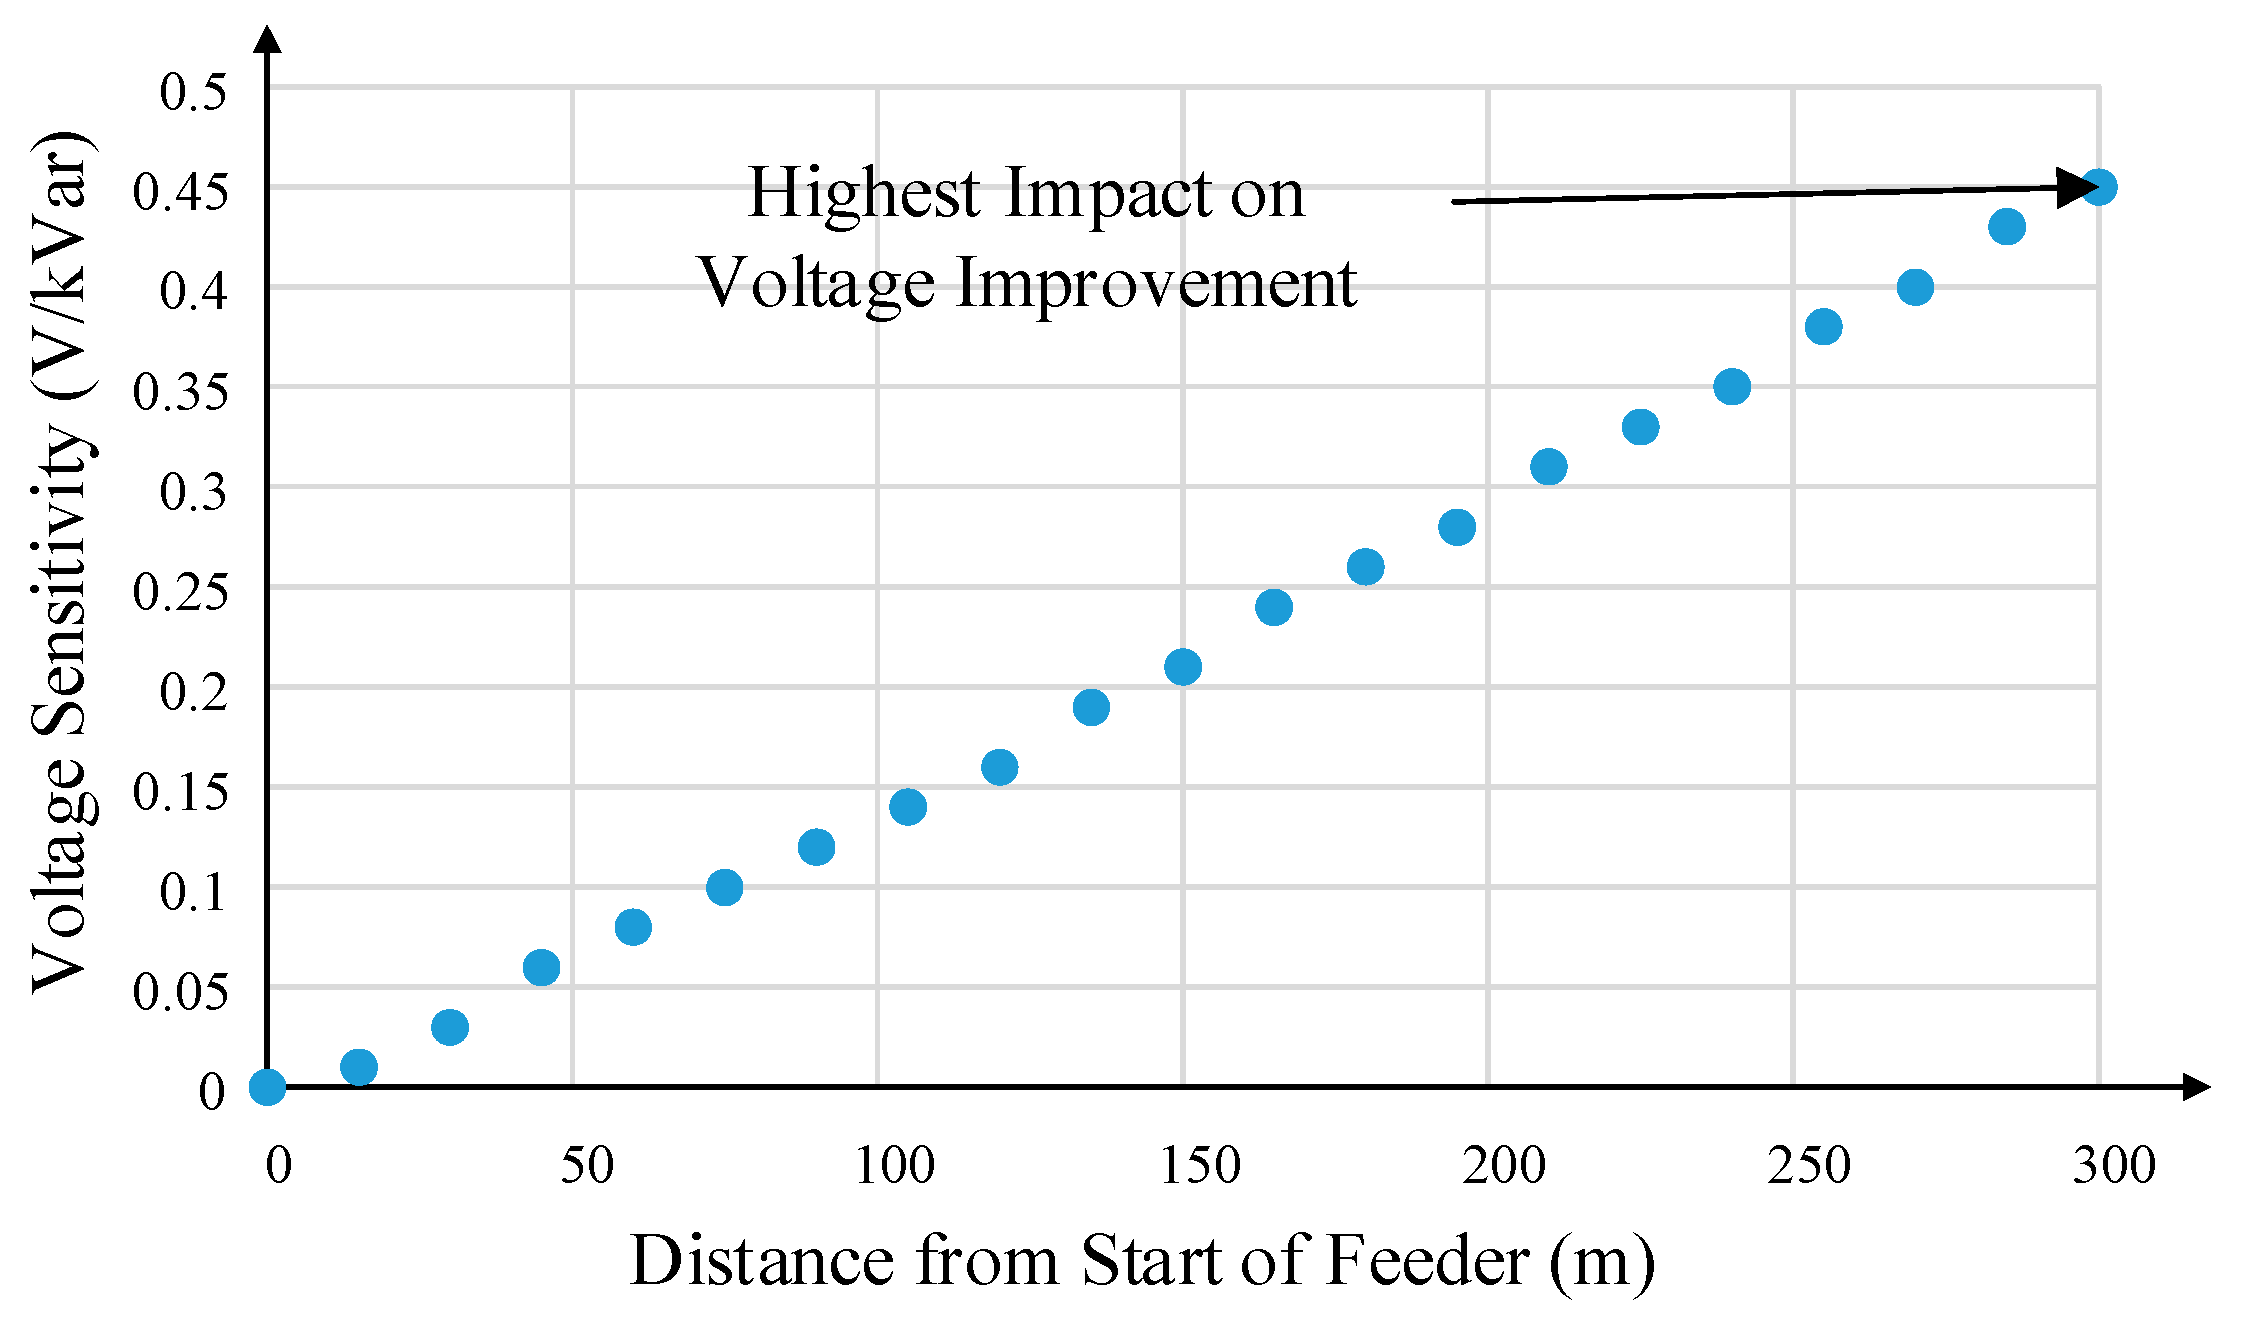
Svq], which can be interpreted as the magnitude of voltage change for the particular node per unit change in reactive power, are the key parameters in terms of the placement of the STATCOM.
Figure 5 shows the sensitivity of voltage magnitudes to reactive power for the 300 m long LV feeder (introduced in
Section 4), which is used in the case study presented in this paper. The conductor used for forming the network had a positive sequence resistance and reactance of 0.583 Ω/km and 0.352 Ω/km, respectively. The voltage sensitivity magnitudes were obtained via the Perturb and Observe method proposed in ref. [
24]. A small
Q was injected at each bus, and the ratio of the Δ
VFeeder and
Q injected was calculated.
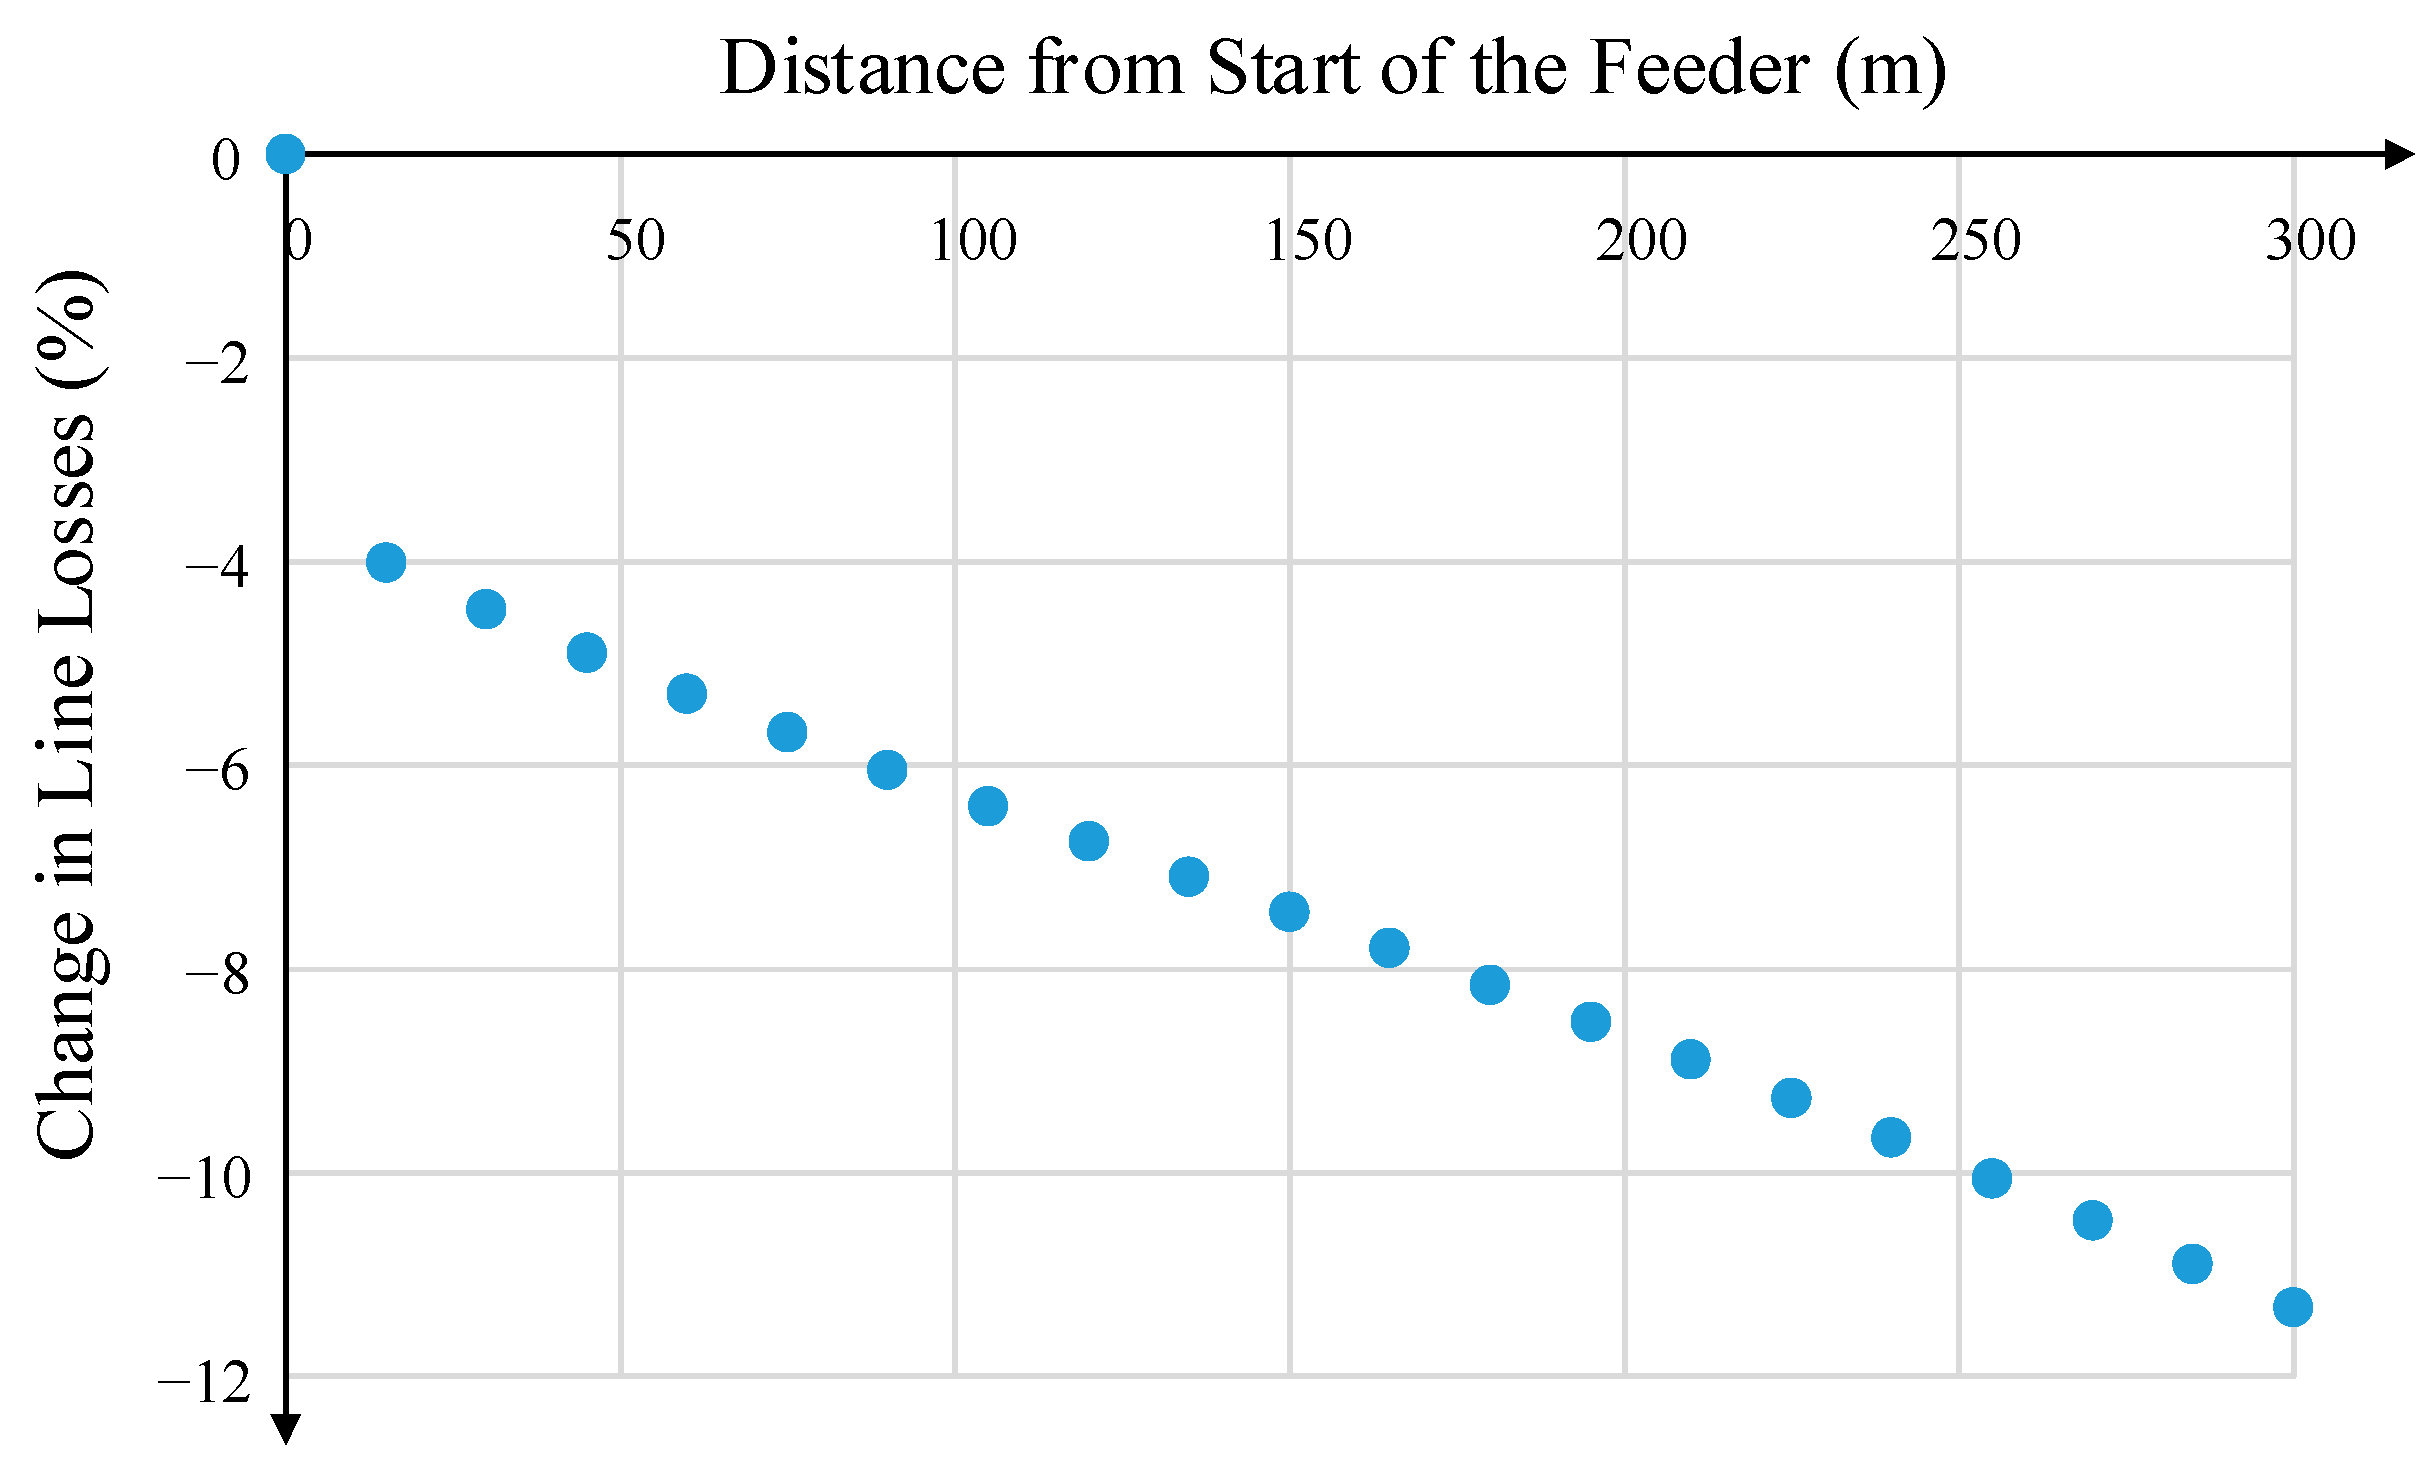
If voltage sensitivity is considered as the main factor in the determination of the placement of the STATCOM, the optimum location is the end of the feeder. However, in terms of minimizing line losses, the optimum placement is not at the end of the feeder. The study presented in ref. [
26] determined that the optimal location for a capacitor bank to reduce line losses in a radial distribution network would be at a position that is two-thirds from the sending end of a feeder. However, ref. [
26] does not consider voltage improvement as a factor when placing the capacitor banks.
To investigate the variation in feeder line losses depending on the location of the STATCOM, a 24 h time series simulation with varying loads and PV output was undertaken. The details of the simulation parameters are presented in
Section 4.
Figure 6 shows the overall percentage change in line losses (I
2R) for the time series simulation as the STATCOM is placed in different positions along the feeder. In
Figure 6, a negative value corresponds to an overall increase in losses. The placement of the reactive power device at the end of the feeder increases line losses by 11% compared to not using a STATCOM. Considering that the main purpose of the STATCOM in LV distribution networks is to improve the voltage levels, it was decided to place the STATCOM at the end of the test feeder.
3.3. Sizing of the STATCOM
Assuming that there is no change in active power in the distribution network under study, in theory, the voltage change due to the change in reactive power can be calculated as the product of
Svq and Δ
Q from Equation (6). However, this cannot be applied in the case of STATCOMs as the reactive power from the device will be significant and the sensitivity analysis-based sizing requires Δ
Q to be less than 2% in order to apply Equation (6) (according to ref. [
6]). This is because the calculated
Svq is for the current state of the system and significant changes in either
P or
Q can change the overall sensitivity of the system.
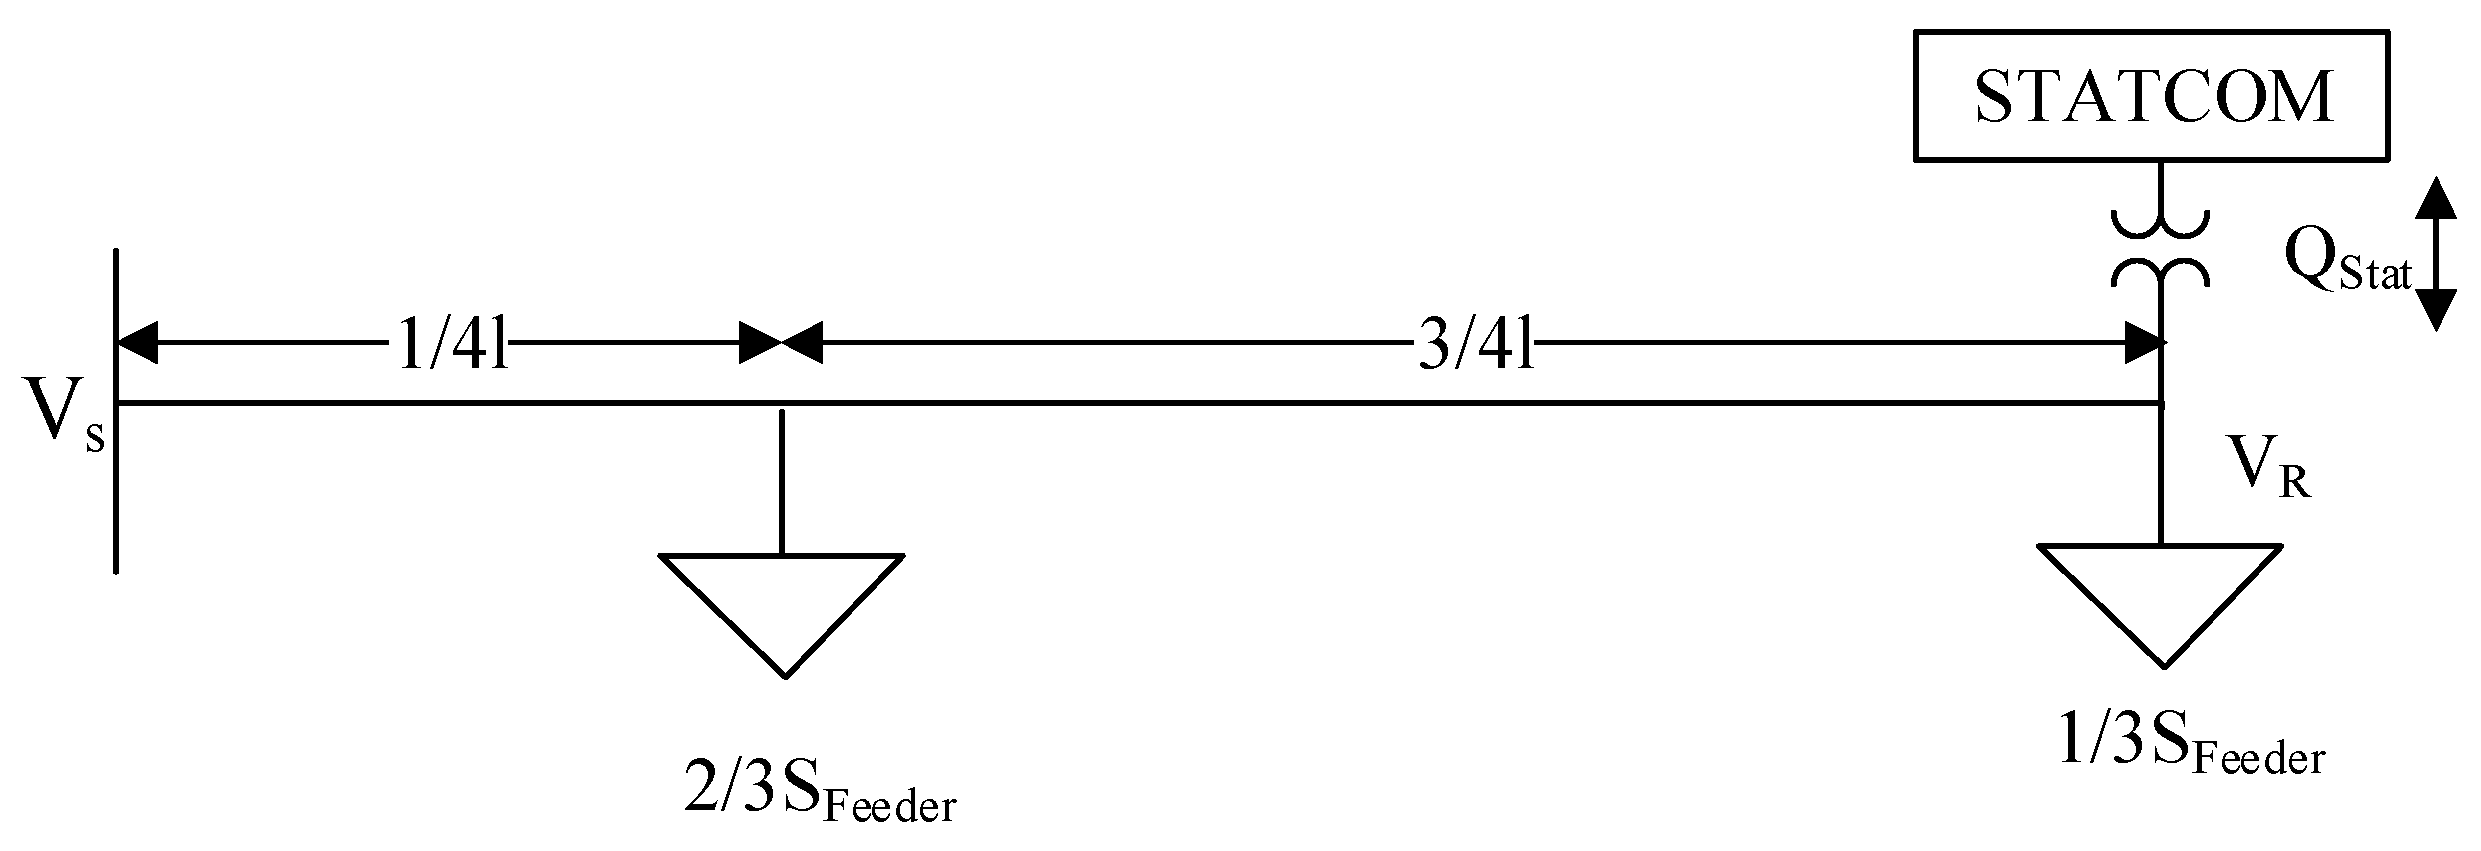
To calculate the correct sizing of the STATCOM, Equation (3) derived for
VFeeder in
Section 2 can be applied. With the STATCOM placed at the end of the feeder, the updated model of the feeder is shown in
Figure 7.
By observing the power flows separately in the two segments of the lumped model, the maximum voltage change in the feeder is given by the following:
where
QStat is the reactive power from the STATCOM.
QStat is modelled as a load where a positive value indicates the STATCOM consuming reactive power to reduce the voltage, whereas a negative value of
QStat indicates reactive power injected by the STATCOM to increase the voltage. Comparing Equation (7) with Equation (3), the contribution to the change in the voltage drop of the feeder due to the STATCOM (Δ
VStat) can be given as follows:
which forms the basis for the level of
Q required to manage the voltage. Equation (8) is an extension of the base voltage deviation model in Equation (3), with the STATCOM reactive power (
) treated as a controllable term that offsets the net feeder reactive power. By observing the feeder as two segments in the lumped load model (
Figure 7), the contribution of the STATCOM to voltage drop is calculated using the same impedance–voltage relationship as Equation (3). This approach is consistent with methods outlined in ref. [
21], where reactive power devices are incorporated as equivalent loads or generators in voltage drop calculations.
For reactive power regulation, with varying loads and PV output, only the voltage at the end of the feeder needs to be measured to design the reactive power control droop curve for a specific feeder. For the sizing of the STATCOM, the maximum and minimum voltages need to be calculated at the end of the feeder for the maximum reverse power flow and peak load scenarios. Equation (8) can be used to determine the rating of the STATCOM depending on the maximum voltage improvement (ΔVStat) required. Moreover, Equation (8) is not limited to the 300 m feeder used in this case study. It can be applied to any LV feeder by evaluating the relevant voltage rise/drop scenarios and inserting the specific power flow conditions of the feeder. This makes the sizing procedure inherently scalable and adaptable to feeders with different configurations and penetration levels of distributed generation.
4. Case Study
4.1. Simulation Parameters
To demonstrate the voltage improvement capability of STATCOMs in LV feeders, a typical overhead four-wire feeder from New South Wales, Australia, was modelled in OpenDSS. The feeder length is 300 m. It is supplied by an 11 kV/400 V Dyn distribution transformer with 4% reactance (on its own base). The line-to-neutral voltage at the distribution transformer busbar was selected to be 240 V (10 V higher than the 230 V nominal voltage used in Australia). A multi-grounded approach is utilized for the four-wire LV distribution network design, commonly known as a multiple earthed neutral (MEN) system, where the feeder is earthed at multiple points (each load connection). In order to demonstrate the worst-case scenario, the LV feeder is heavily loaded with 60 loads (houses) across the three phases. With a length of 300 m, this results in 15 m between each load based on there being 20 loads per phase. A peak load of 3 kW per connection is applied, and a single-phase 5 kW rooftop PV system was also connected at each load point. While Australian grid standards require PV inverters to support grid voltages via Volt–Watt and Volt–VAr functions [
27], this study assumes the unity power factor for PV systems to ensure that STATCOM performance is evaluated independently without compromising PV active power outputs. By shifting the reactive power regulation task to the STATCOM, PV inverters can continue to maximize active power generation while the STATCOM mitigates voltage rise and unbalance.
For four-wire modelling, a 4 × 4 matrix was defined for the line impedance, explicitly modelling the neutral conductor. The conductor used for forming the network had a positive sequence resistance and reactance as per the details in
Section 3.2, giving an overall R/X ratio of 1.65. A grounding resistance of 0.5 Ω was used to model the neutral to grounding impedance. The network was modelled using Carson’s equations [
28].
Table 1 summarizes the key parameters used in the model.
Although this study examines a 300 m LV feeder, the methodology and design principles for STATCOM sizing and placement are broadly applicable to both urban and rural overhead feeders. The approach focuses on local voltage conditions and power flow extremes, making it adaptable to various feeder lengths and configurations.
4.2. Improvement of the Voltage Levels
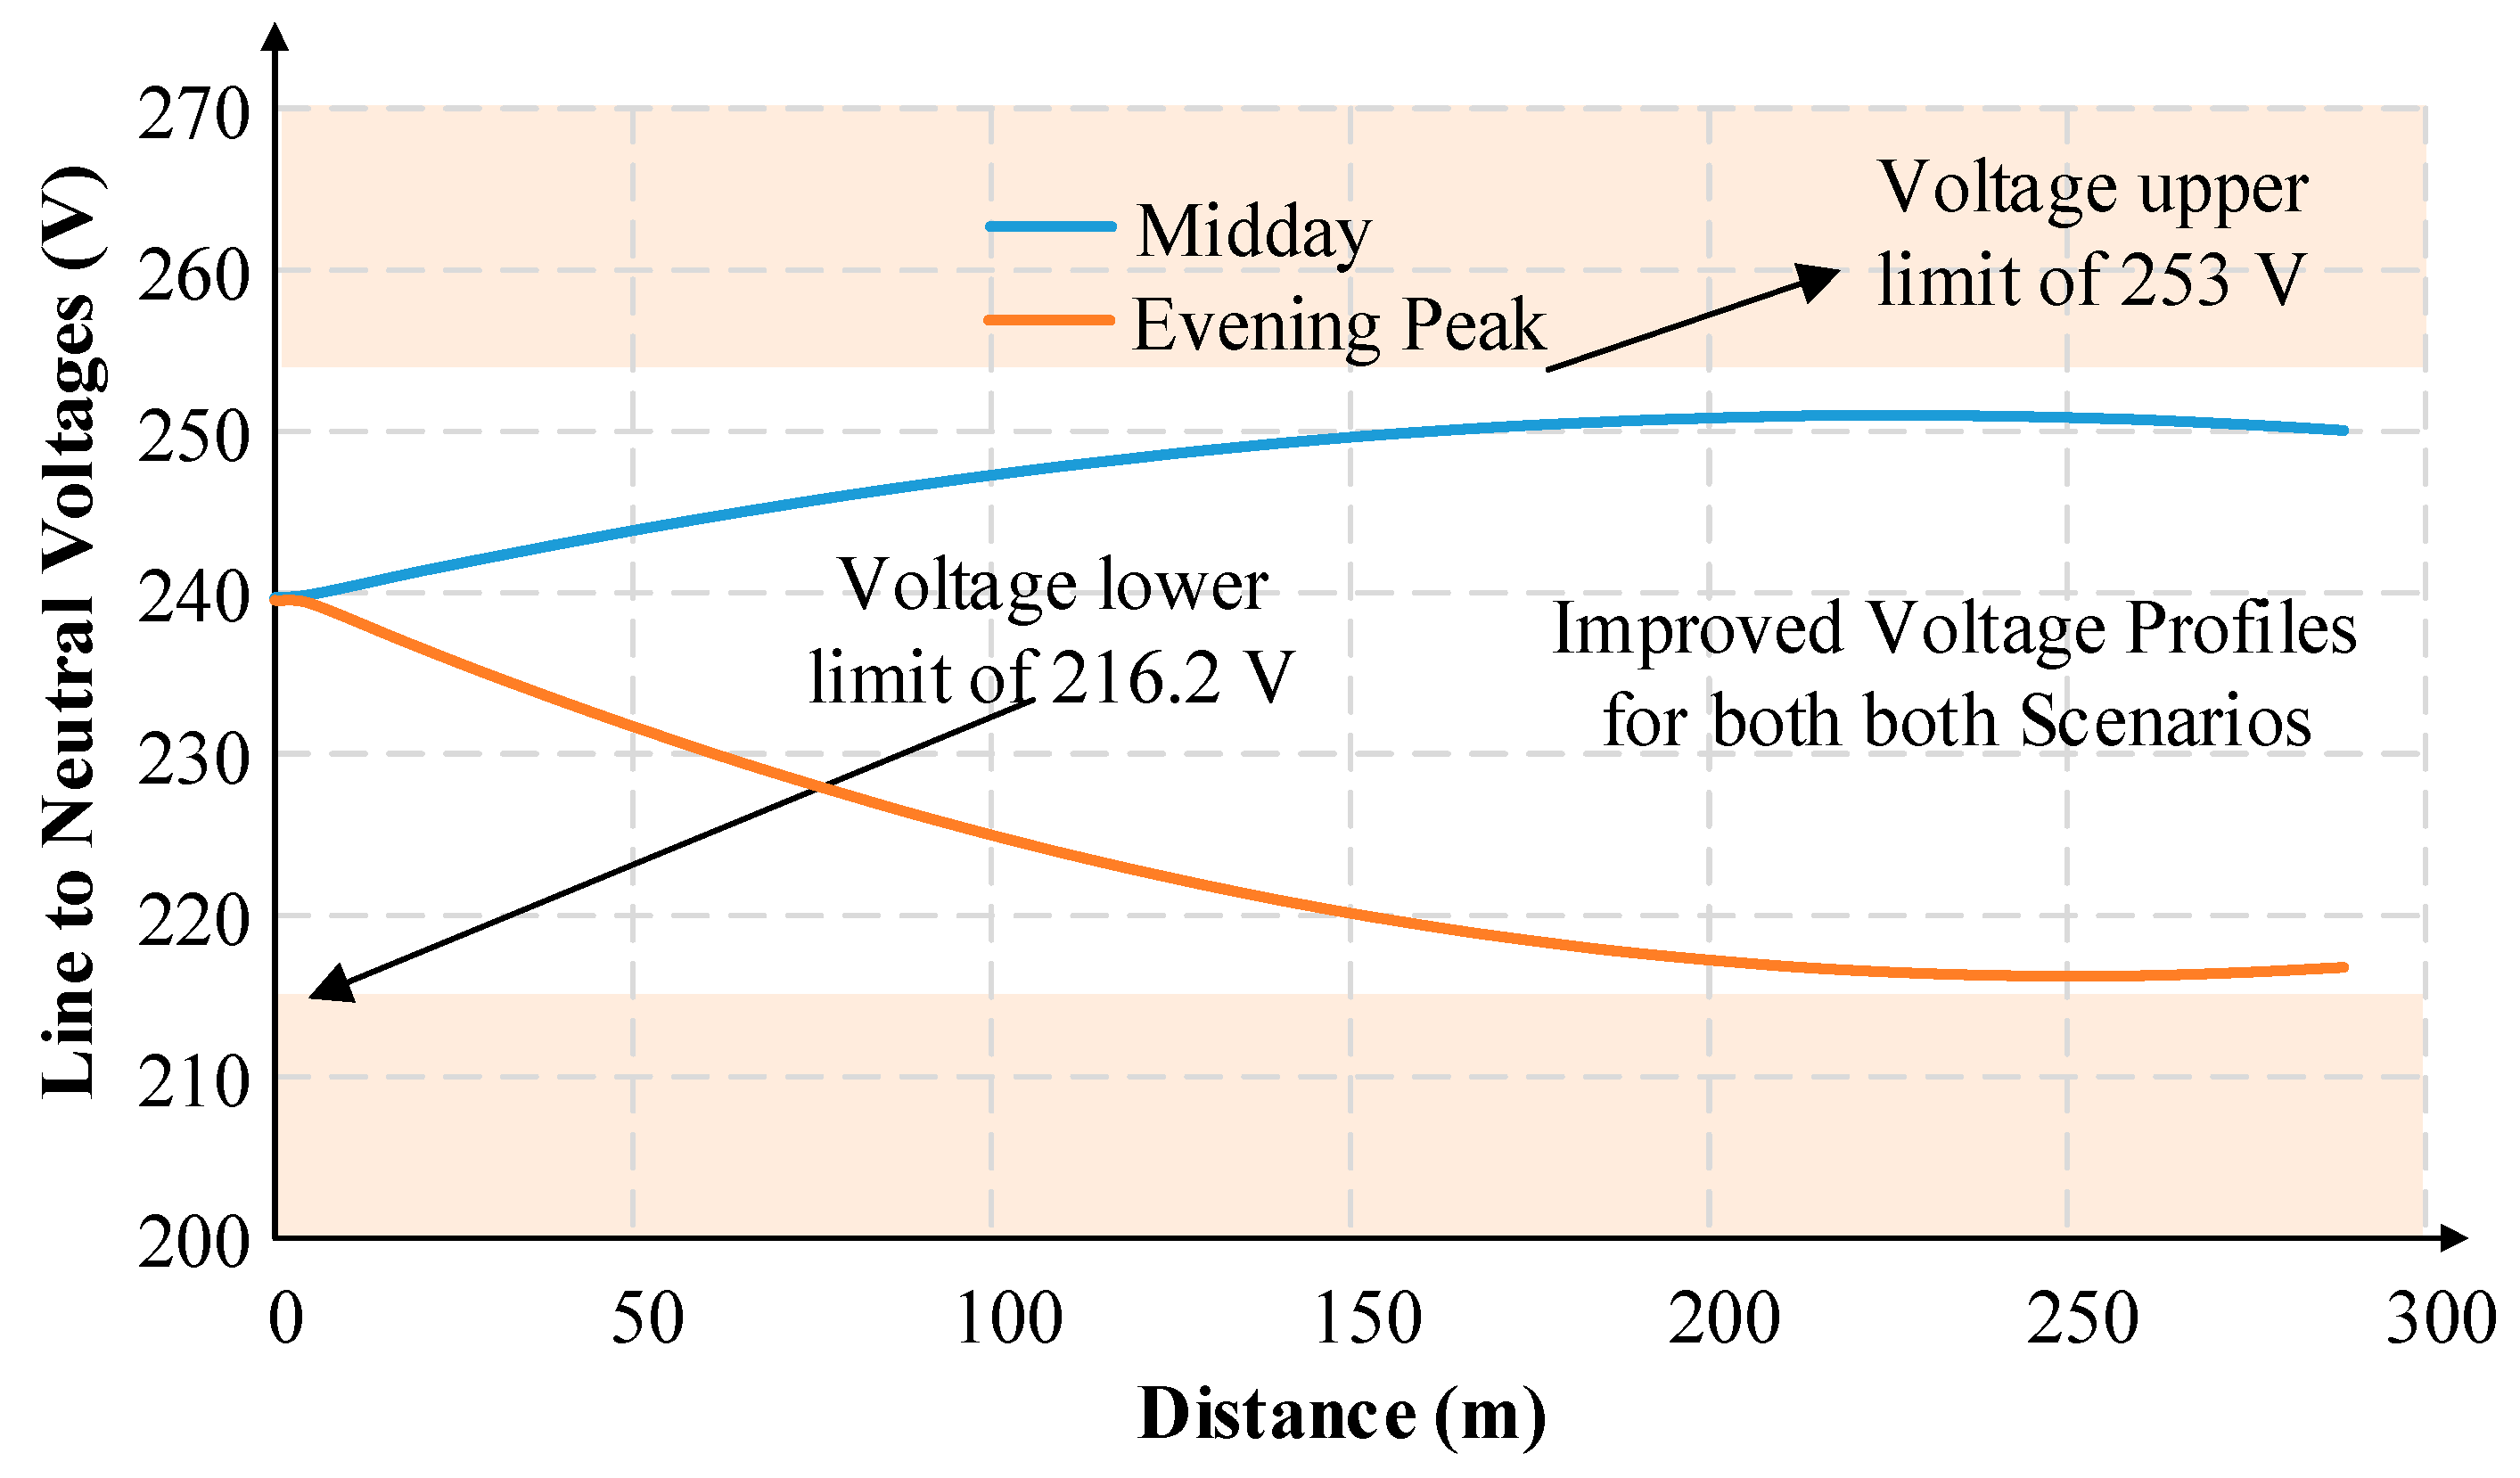
To demonstrate the voltage improvement capabilities of the STATCOM, the voltage profile of the feeder was analysed. According to Australian Standard AS 61000.3.100 [
3], the allowable line-to-neutral voltage range is 0.94–1.10 pu of the 230 V nominal voltage. This allows the individual line-neutral voltages to be between 216.2 V and 253 V. Before the connection of the STATCOM, two extreme scenarios were simulated:
Midday, when there is maximum PV production and minimum load, the PV generators output 5 kW, and the load is assumed to be 55% of its peak (0.95 lag). These values were selected based on the load data profiles provided by a DNSP in NSW, Australia. This represents the maximum voltage rise scenario.
During the evening, when there is a peak with maximum load and no PV generation, each load is assumed to be consuming 3 kW (0.95 lag). This represents the maximum voltage reduction scenario.
Figure 8 shows the voltage profile along the feeder for the two scenarios. In both scenarios, the voltages towards the end of the feeder can be seen to be outside the allowable range.
The maximum voltage observed is 259.2 V with maximum PV production, while the voltage decreased to 212.1 V during the maximum evening load. These values were used to calculate the amount of reactive power required to maintain voltage levels within the mandated limits using (8). For design purposes, the rating of the STATCOM was determined to reduce the voltage at the end of the feeder to 250 V for the voltage rise case and 220 V for the maximum voltage drop case, leading to a Δ
VStat of 9.2 V and −7.9 V, respectively. For the feeder used in this case study, this resulted in an inductive reactive power requirement of 19.9 kVAr to mitigate the voltage rise and a capacitive reactive power of 17.2 kVAr to mitigate the voltage reduction.
Figure 9 shows the improved voltage profile of the feeder with the STATCOM operating with these reactive power capabilities; it can be seen that the voltage is now within the prescribed range.
4.3. Time Series Performance Analysis
In this section, the performance of the STATCOM on the feeder with varying loads and PV output is demonstrated using a 24 h time series simulation for the LV study feeder. The data used for simulations was 1 min interval data provided by a DNSP in NSW, Australia.
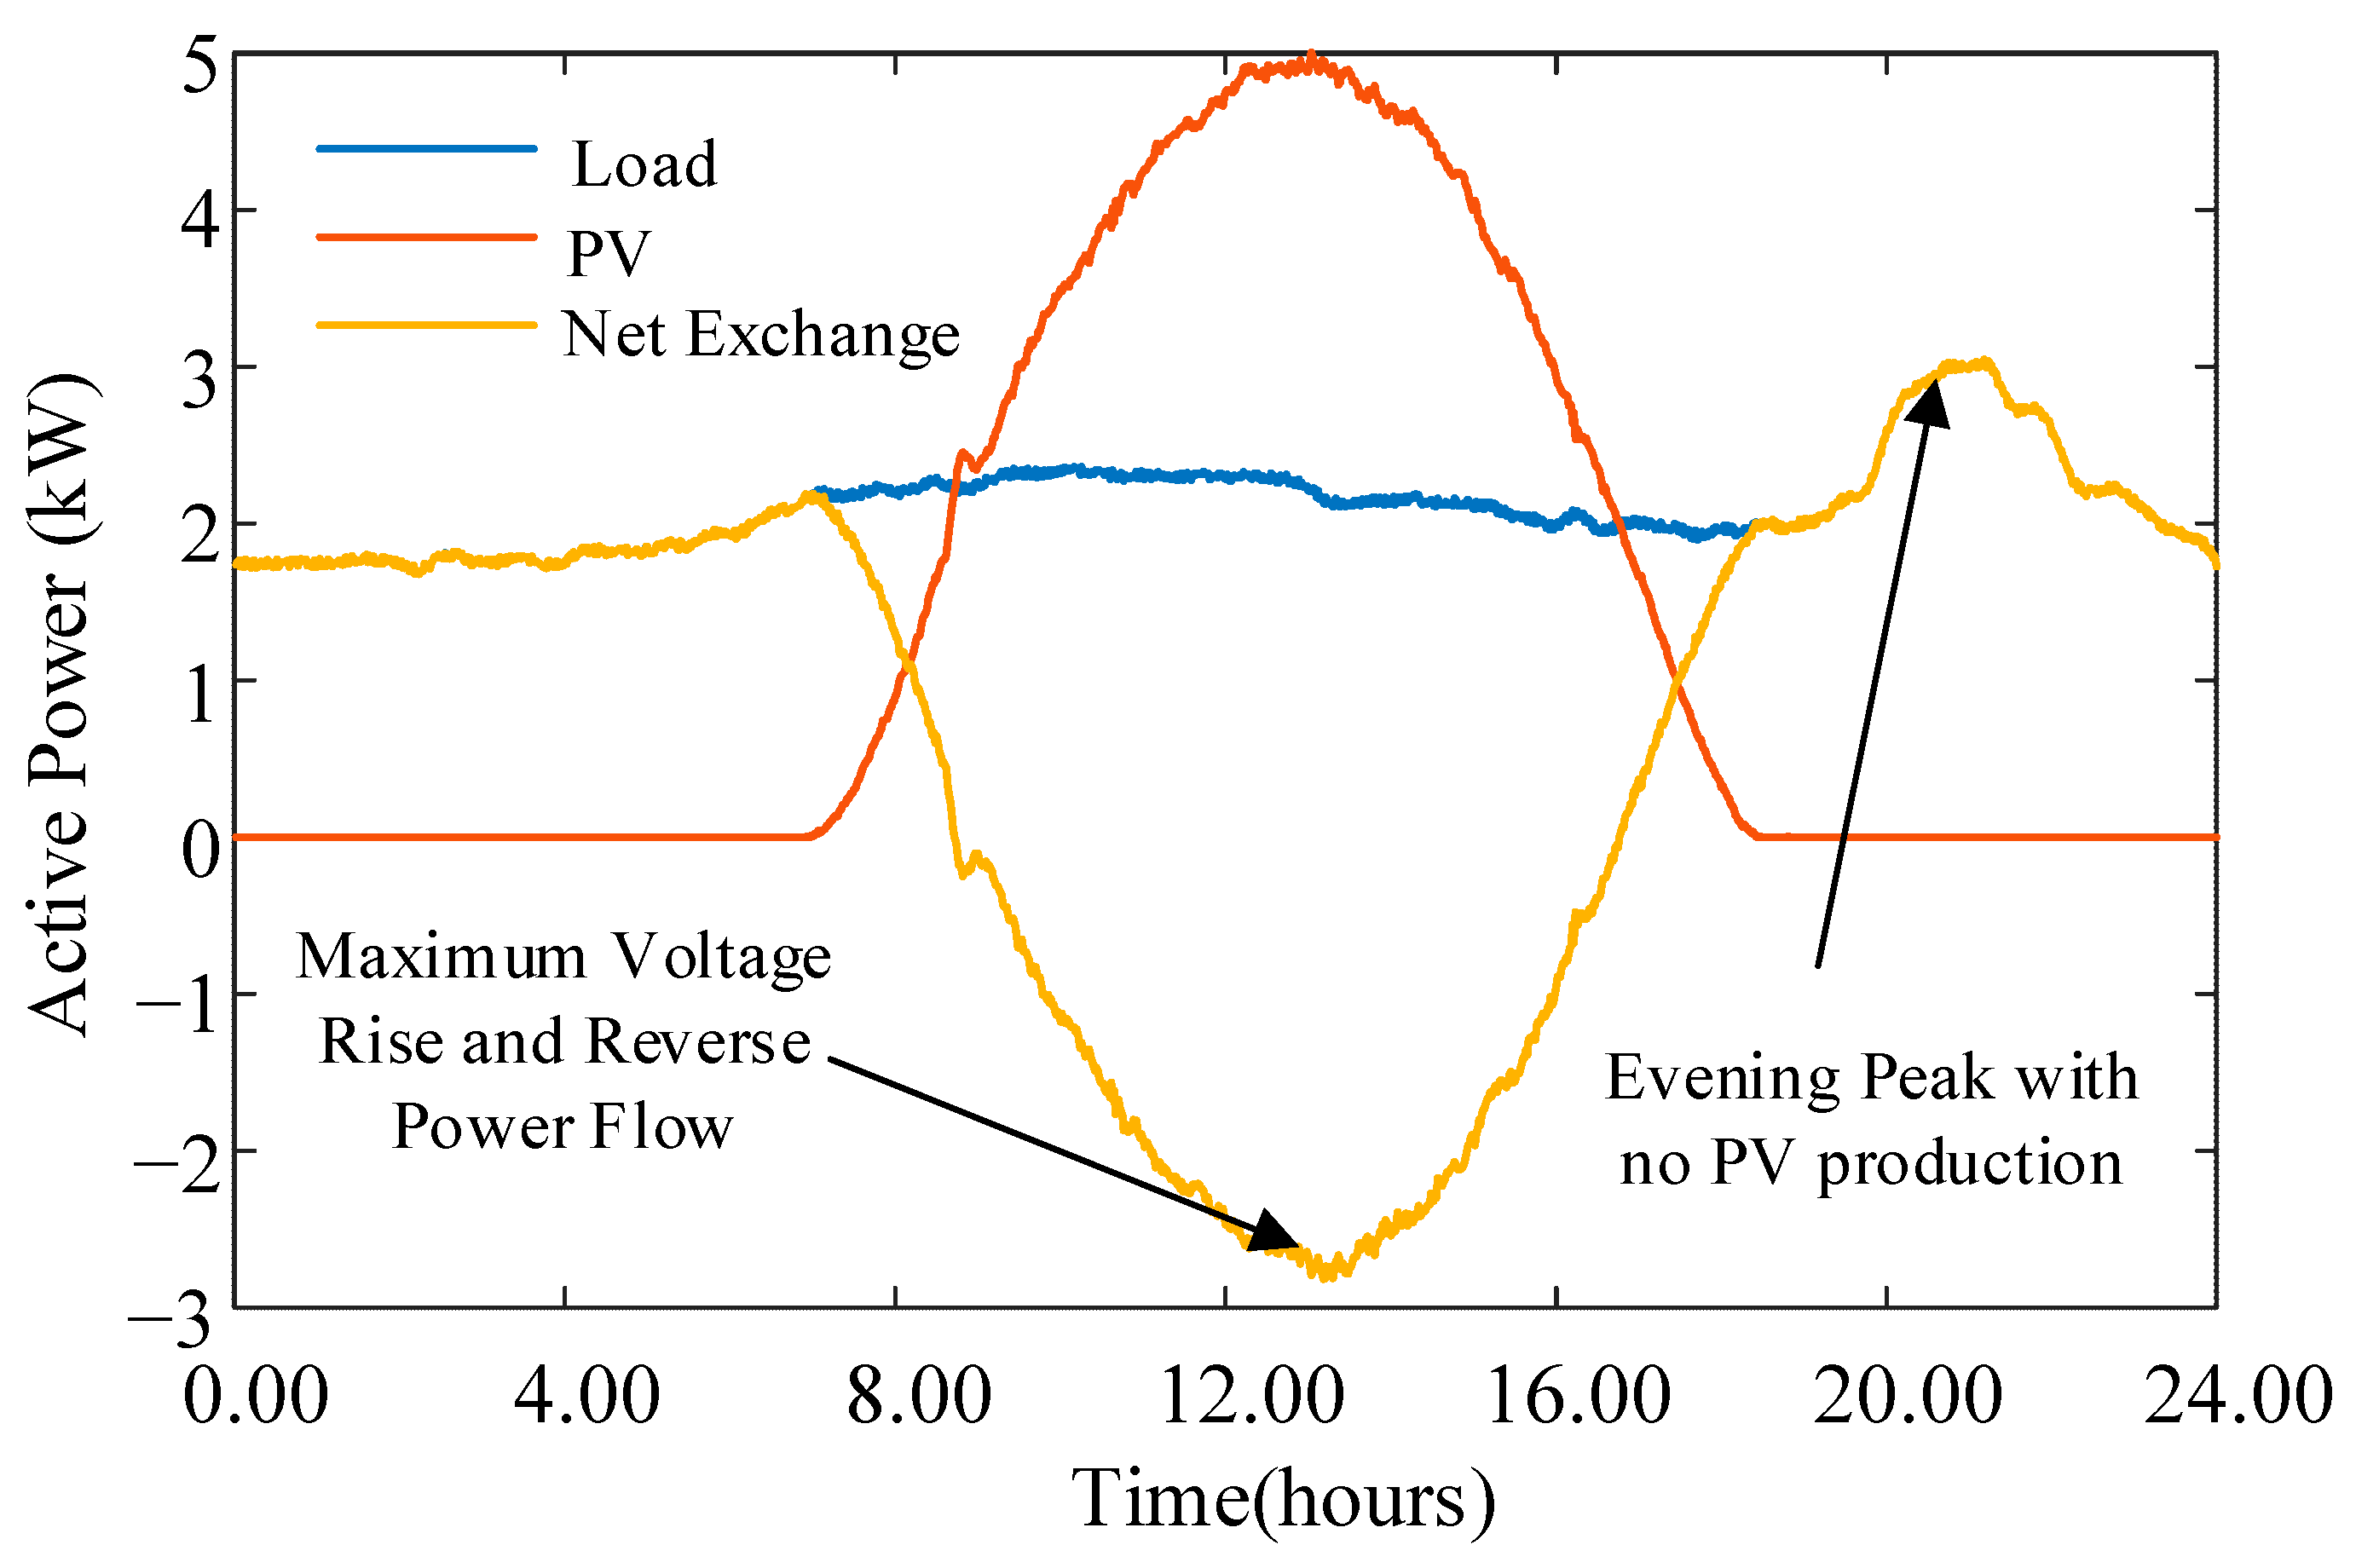
Figure 10 shows the active power variation of the load and PV output data throughout the day for a typical installation.
The load was operated at a lagging power factor of 0.95, and the PV system was generated with respect to the unity power factor to ensure the maximum utilization of the renewable energy source. The two extreme scenarios considered to investigate the maximum voltage deviations are identified in the plot, considering the net exchange of real power.
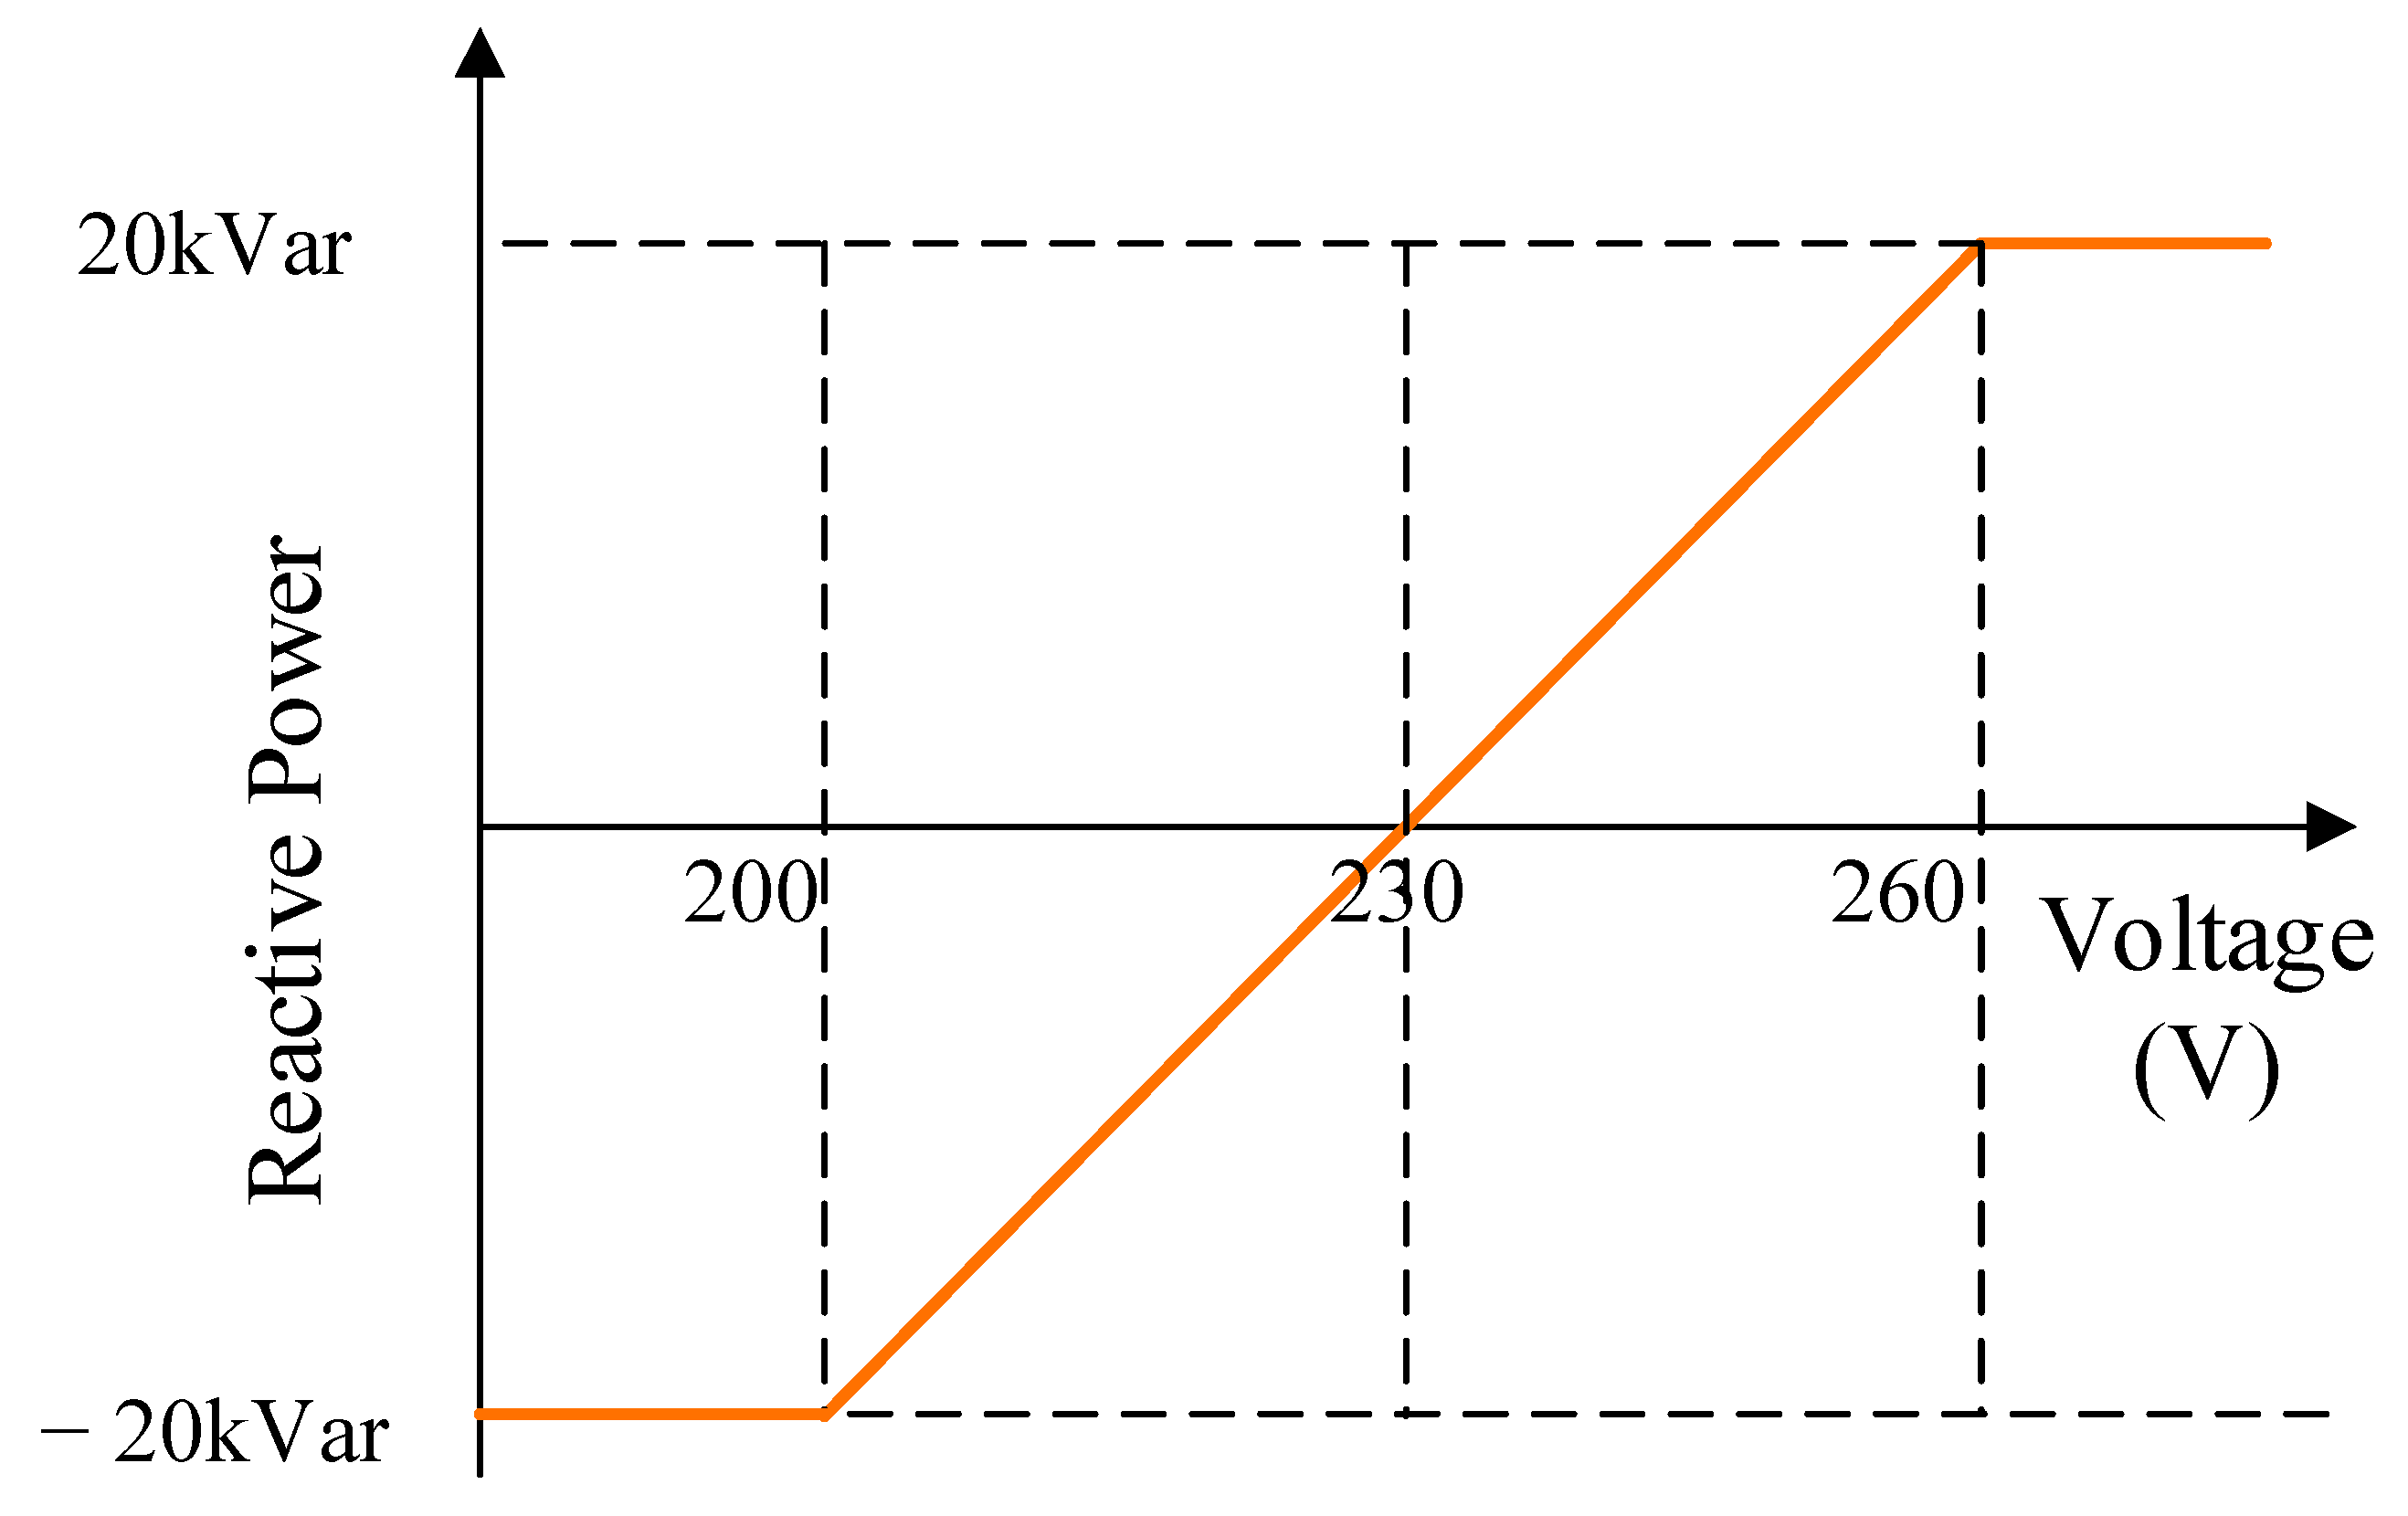
As the load and PV output vary throughout the day, the reactive power from the STATCOM needs to be regulated to control the voltage. A Q-V-based droop curve is utilized to regulate the amount of reactive power injected or absorbed by the STATCOM. The maximum reactive power to mitigate voltage deviations was previously calculated to be +19.9 kVAr and −17.2 kVAr to manage the voltage within the stipulated limits. The rating of the STATCOM was therefore selected to be 20 kVAr. Given the relationship between the voltage deviation and the level of reactive power sourced or absorbed, the STATCOM is linear according to Equation (8), and a linear droop curve was utilized, with a nominal voltage of 230 V.
Figure 11 shows the droop curve applied to regulate the amount of reactive power supplied by the STATCOM for the case study provided.
For the case study feeder, the voltage at the end of the feeder experiences maximum voltage deviations from the nominal voltage as the distributed loads and the PV systems vary.
Figure 12 shows the voltage of phase A of the household connected at the end of the feeder with and without the STATCOM operating. To develop the analysis tool, an interface between Matlab and OpenDSS was utilized. It is evident that the proposed solution was successful in maintaining voltage levels between the mandated voltage limits of 216.2 V and 253 V.
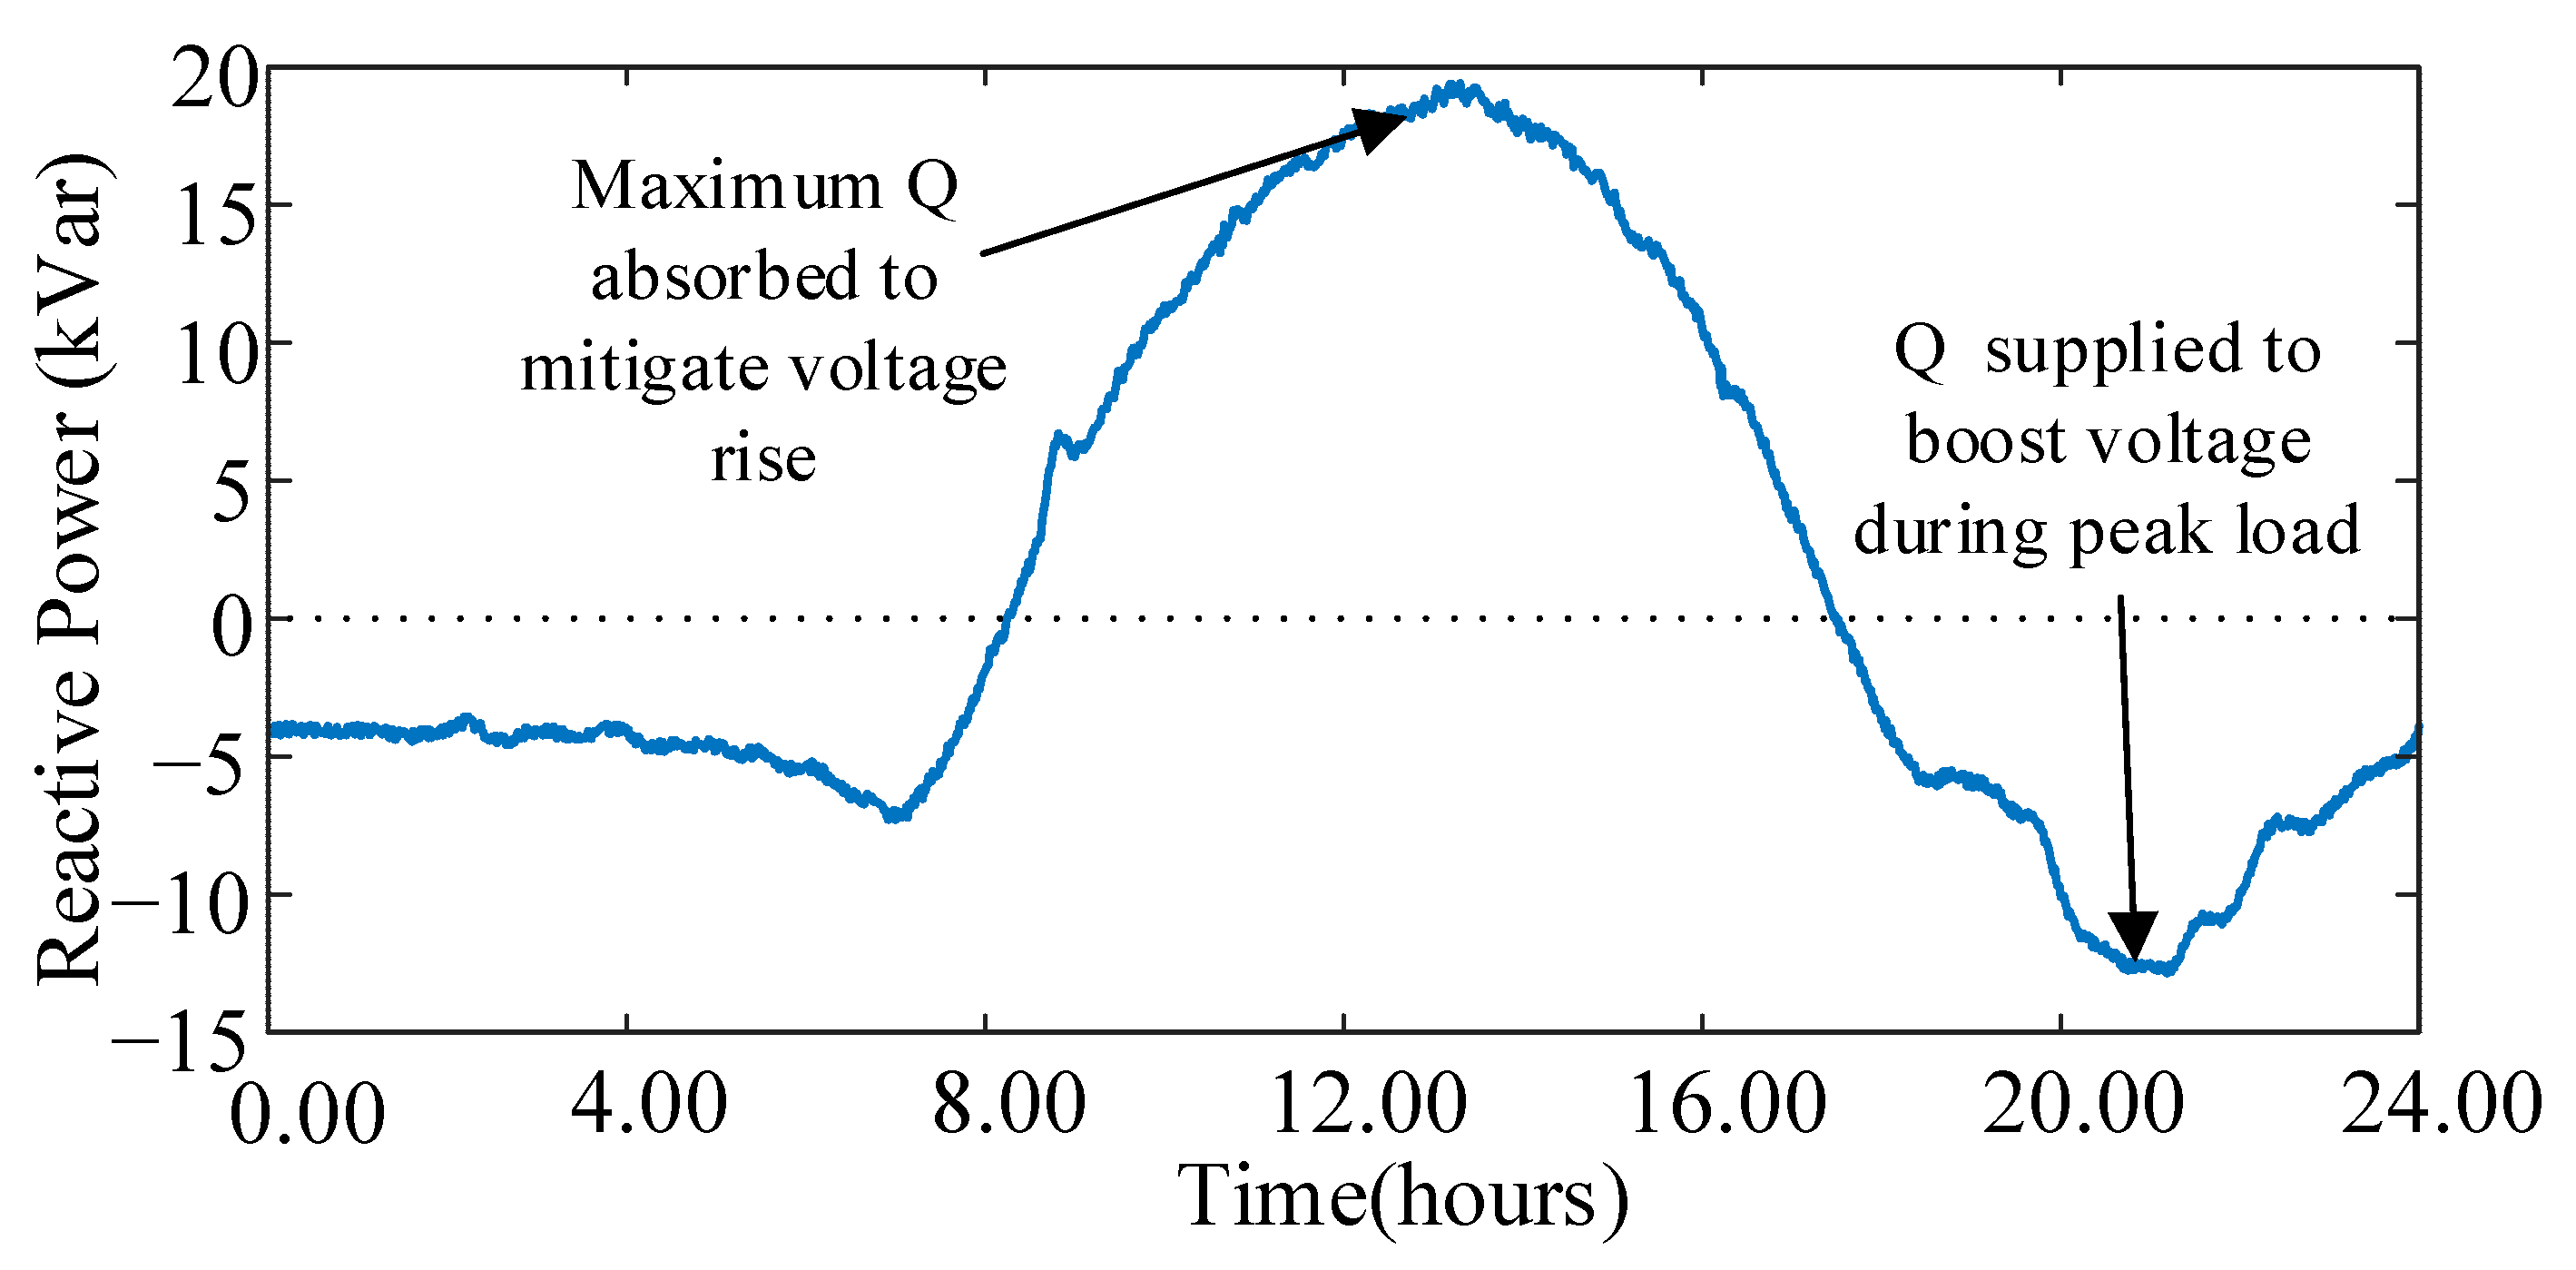
Figure 13 shows the required reactive power drawn/absorbed from the STATCOM in order to mitigate voltage deviation issues. As observed, the maximum reactive power is absorbed by the STATCOM during midday when PV generation is at the maximum. During the peak load around 21:00, the STATCOM supplies maximum reactive power according to the defined droop curve to support the voltage.
To evaluate the efficacy of the STATCOM, the performance of the system with and without reactive power regulation was investigated.
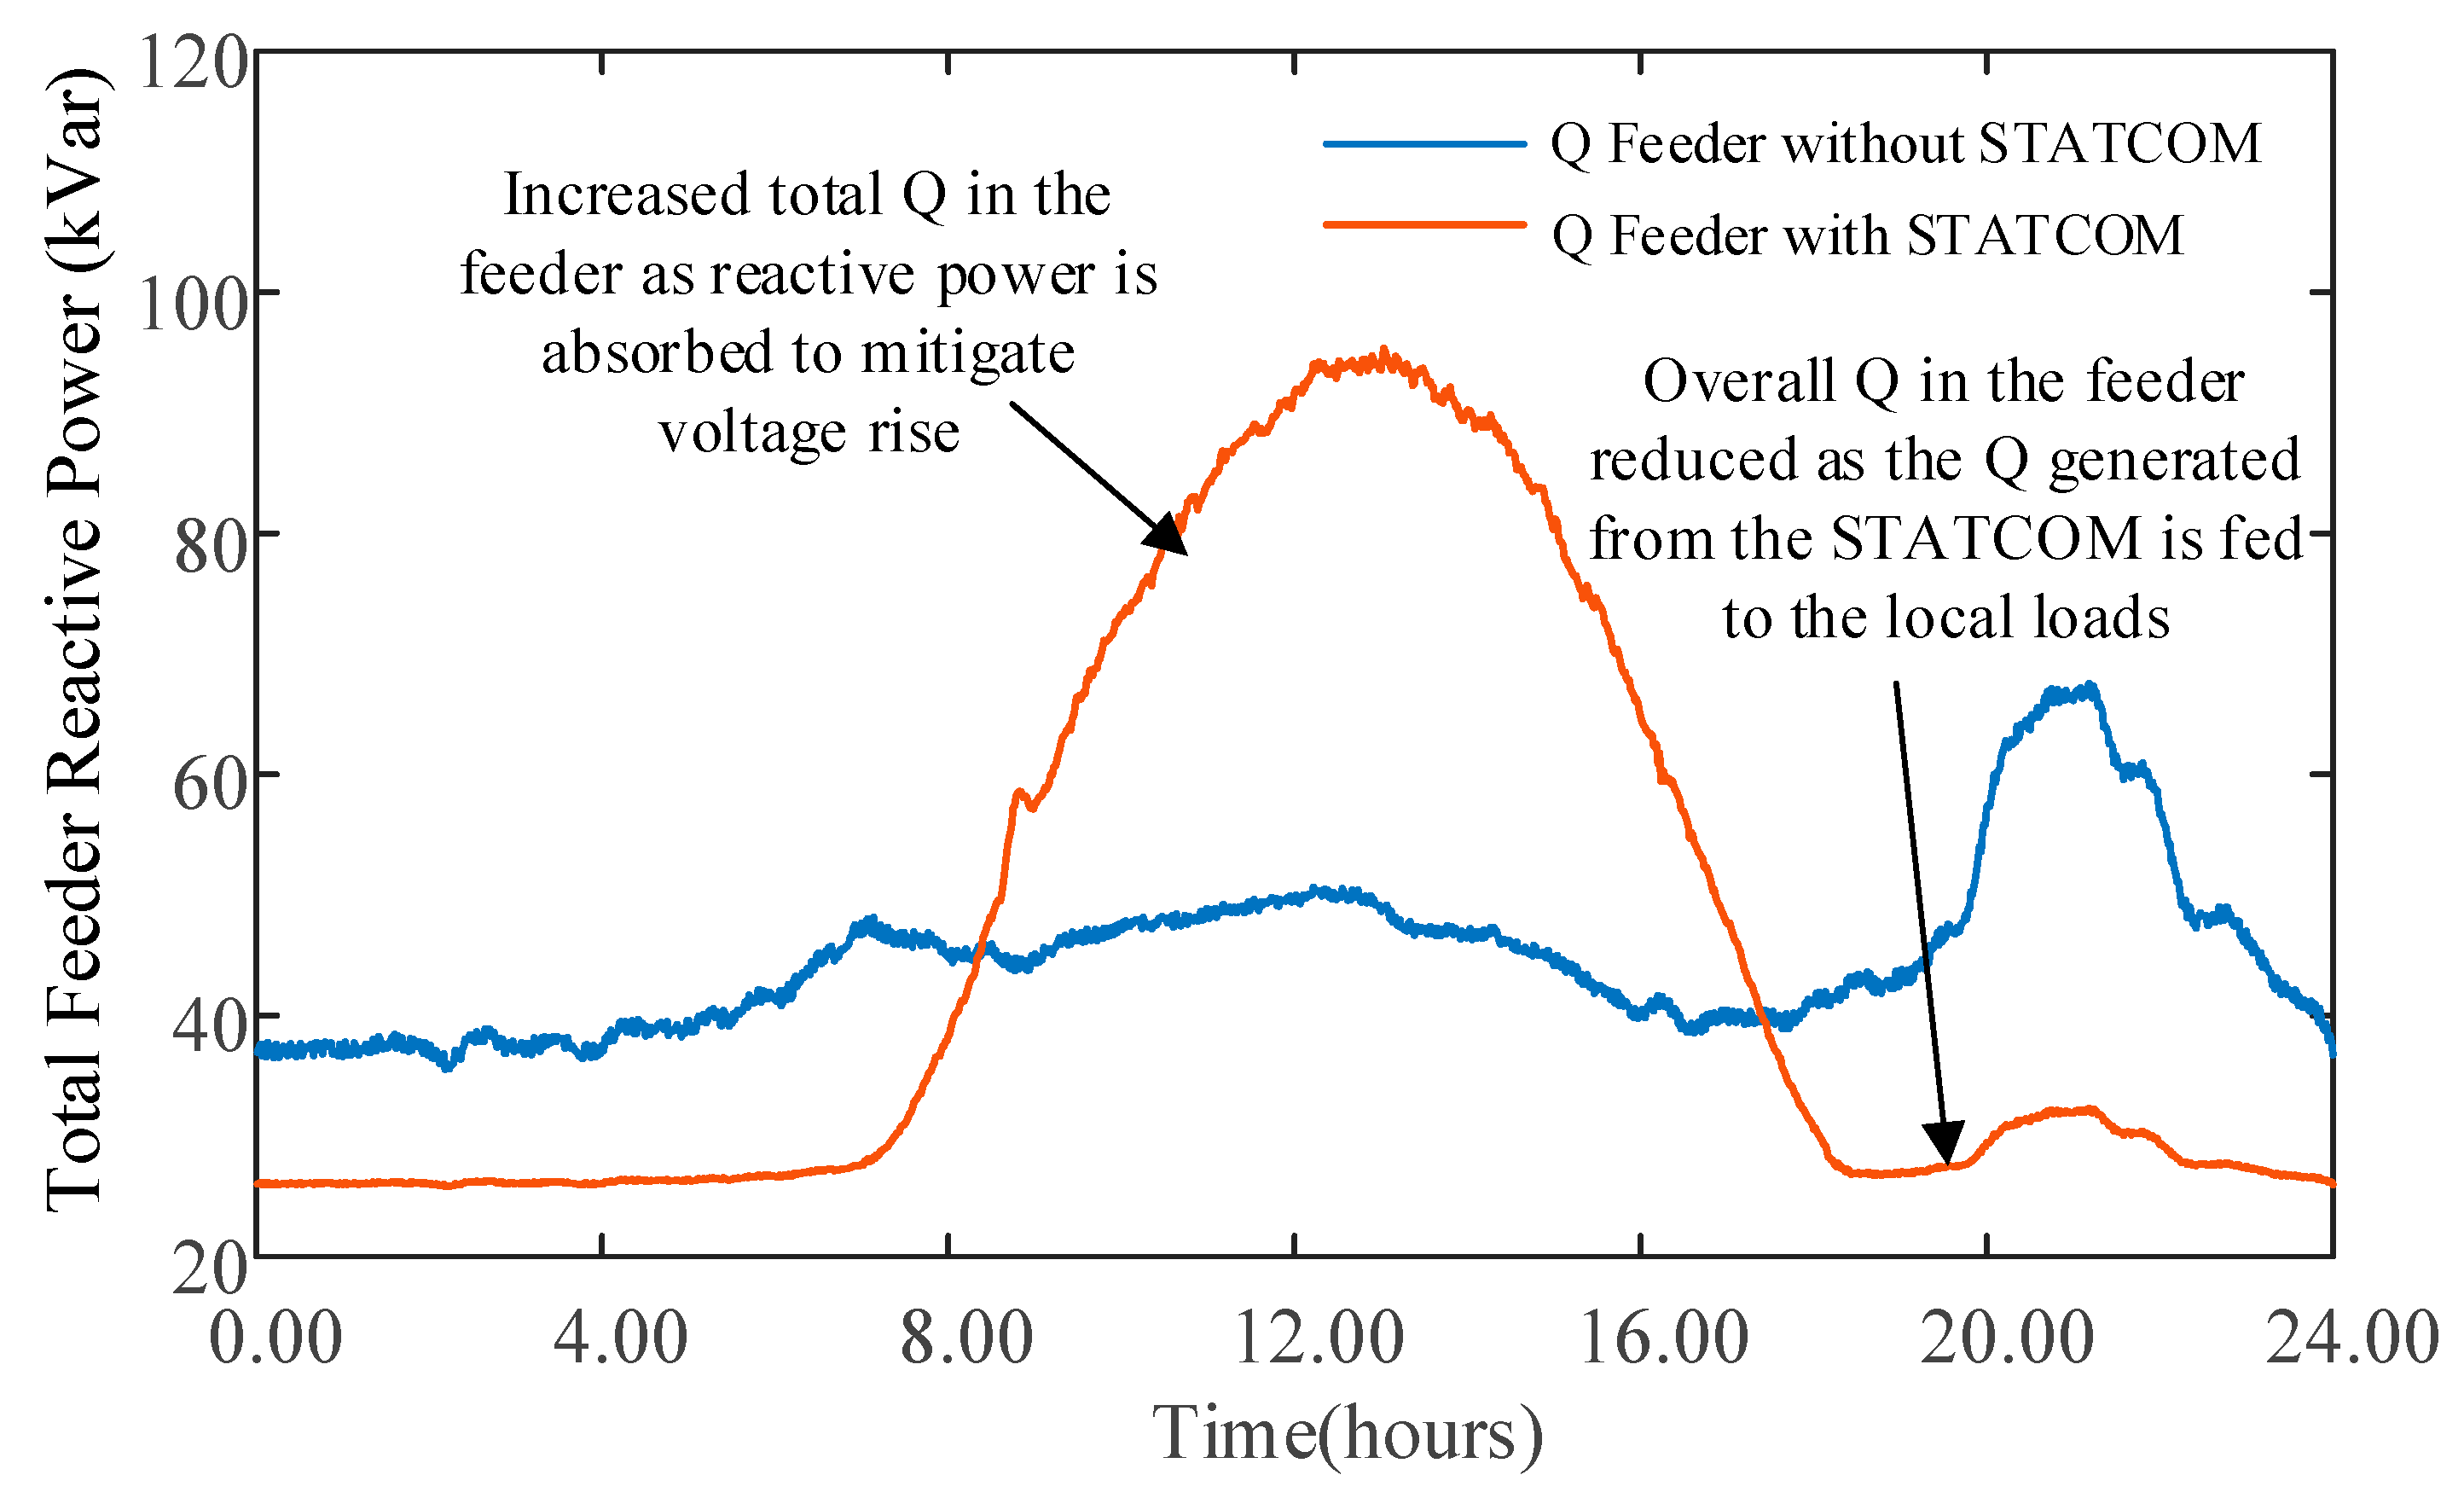
Figure 14 shows the total three-phase reactive power of the LV feeder with and without the STATCOM. During the daytime, the solar PV output surpasses the load, and the overall Q in the feeder increases as the STATCOM absorbs reactive power to mitigate the voltage rise issue. Conversely, with no PV production, when the STATCOM generates Q to boost the voltage, the overall Q in the feeder decreases, as seen in
Figure 14. Due to the operation of the STATCOM, at midday, the extra Q in the network increased the feeder’s rms current in phase A from 0.25 kA to 0.28 kA, a 12% increase in the peak current. However, during peak loads in the evening, the current in the feeder decreased from 0.29 kA to 0.27 kA, i.e., a 6.8% reduction.
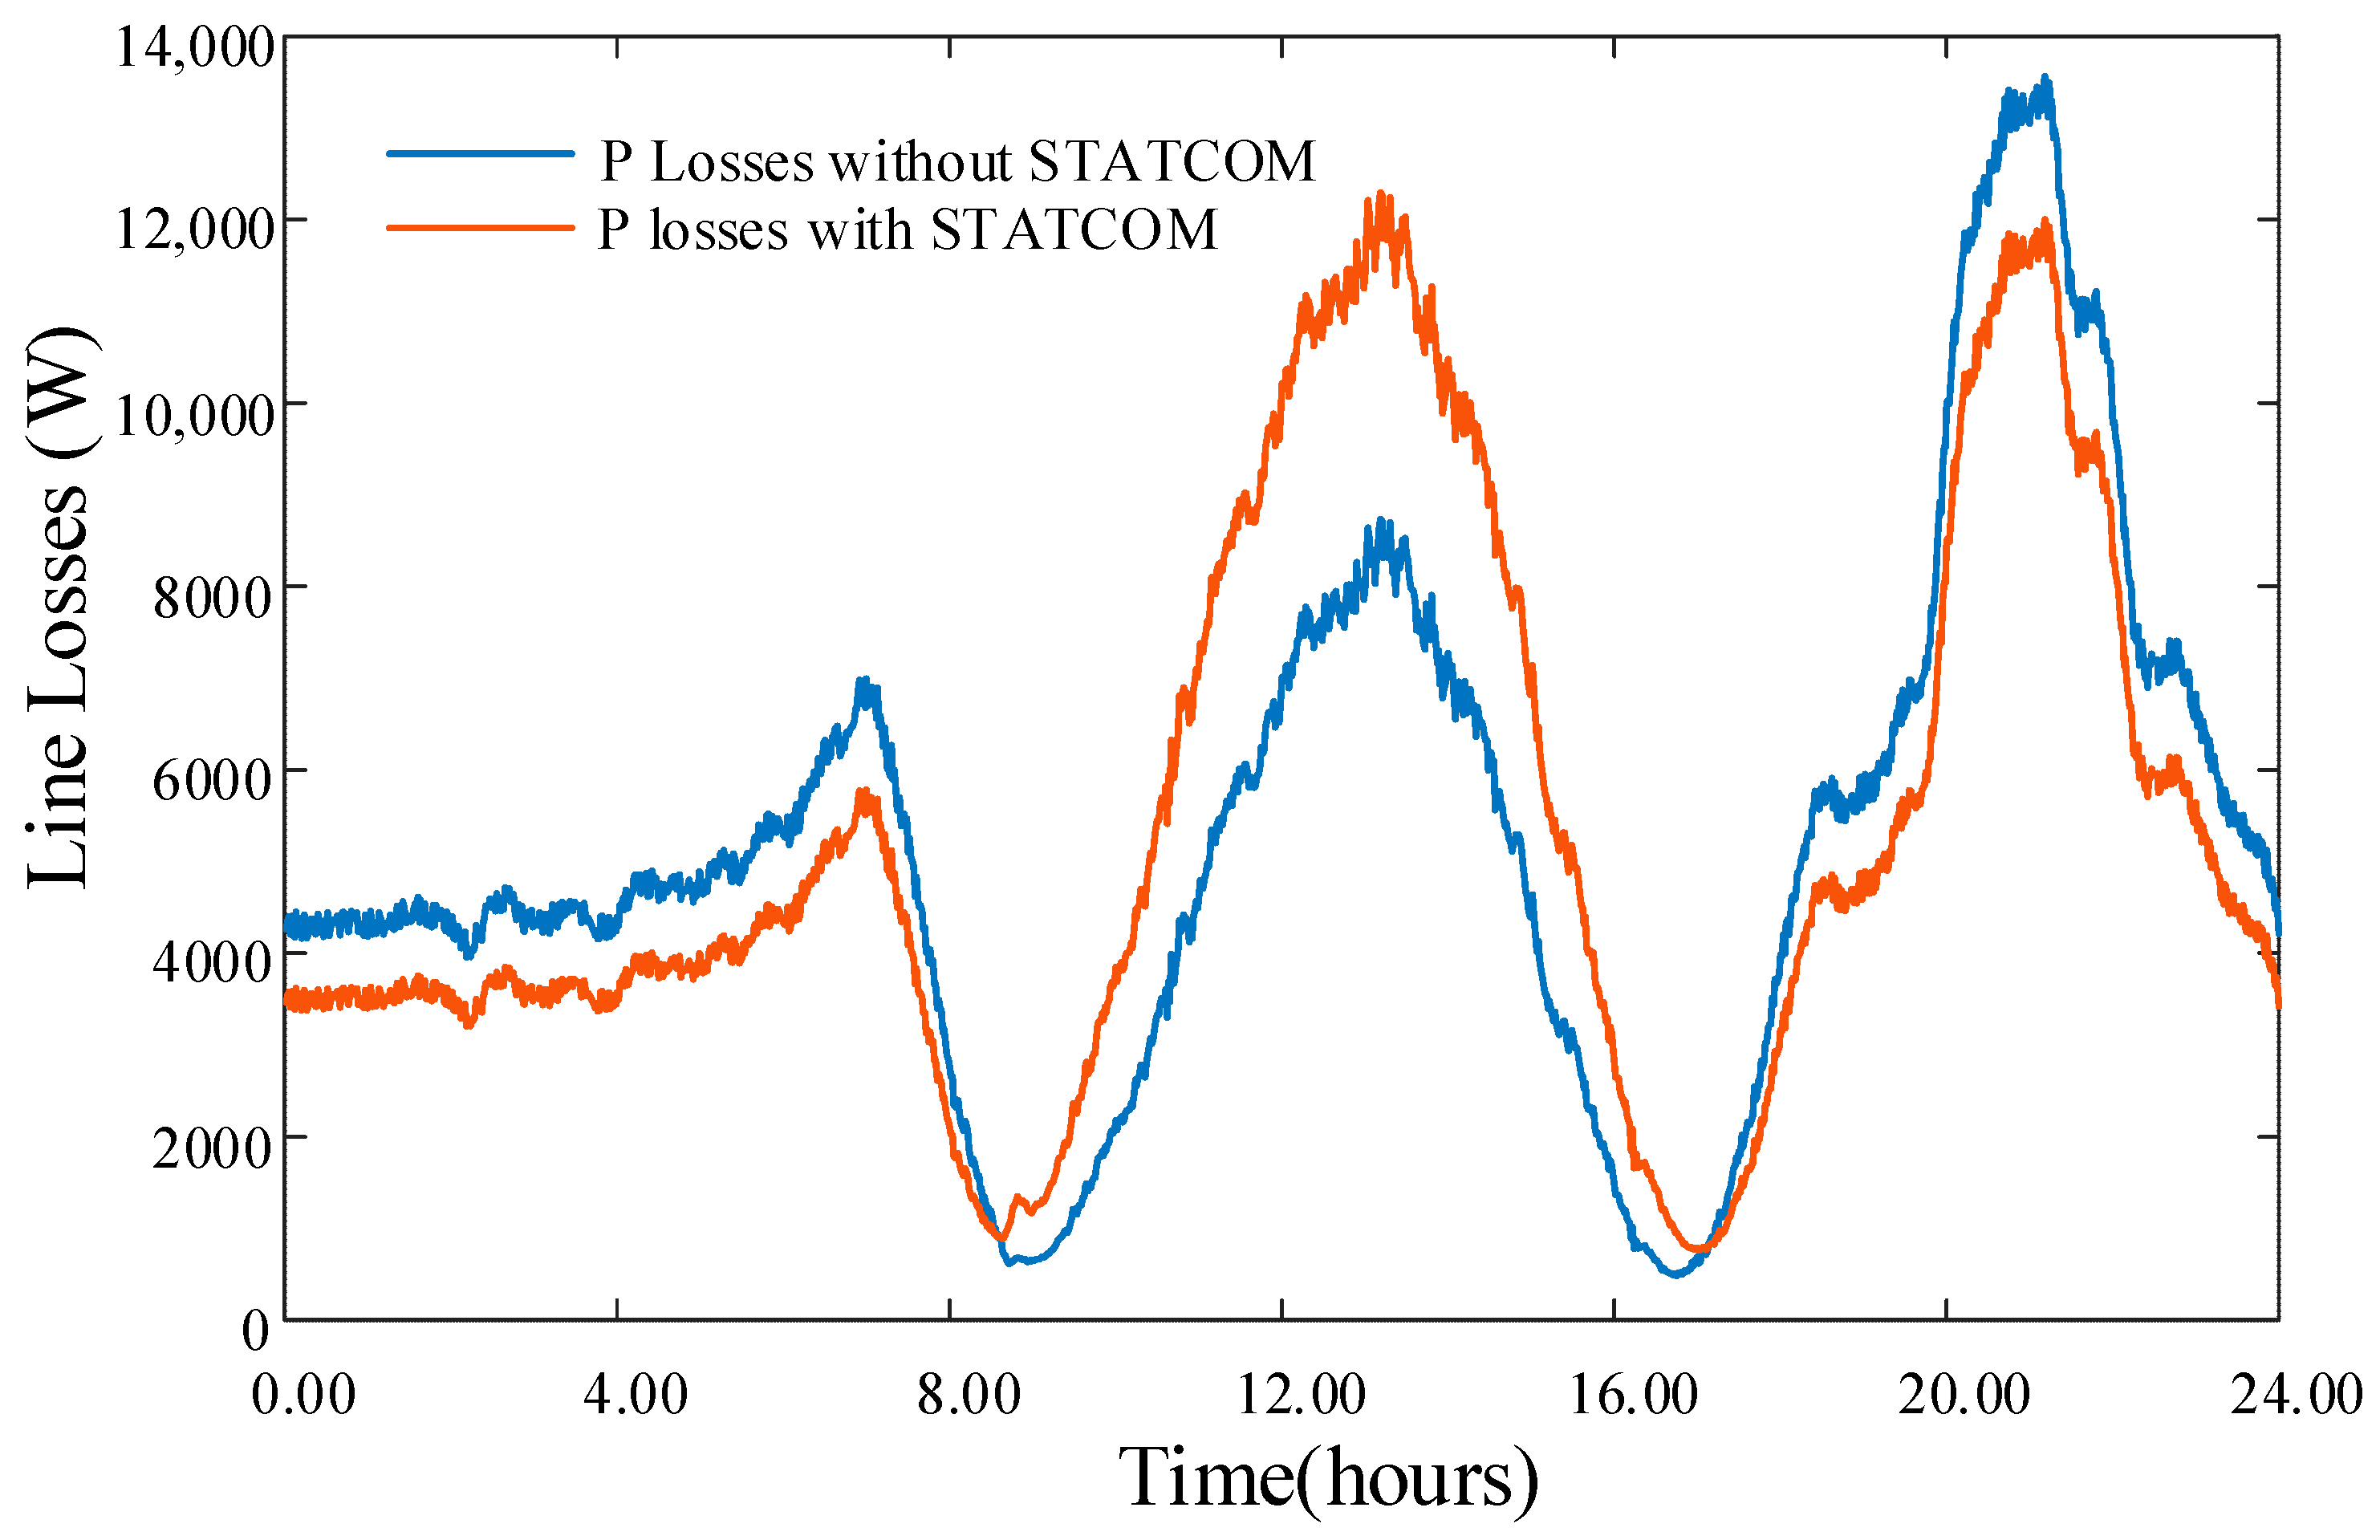
Figure 15 illustrates how the overall line losses varied throughout the day. Given that most residential loads operate with a lagging power factor, two main scenarios are introduced in terms of the line losses, with the application of the STATCOM:
The total Q at the grid end of the feeder reduces when the STATCOM is injecting reactive power, as the loads will absorb the Q from the STATCOM instead of absorbing it from the grid. Even though the real power in the system has not changed, with a lower Q, the losses will be lower as the current in the feeder is reduced reducing the I2R line losses.
When the STATCOM absorbs reactive power to mitigate voltage rise, the amount of reactive power flow in the network increases as additional Q is drawn from the upstream grid. This increased Q will increase the overall current in the feeder, and this increases the overall losses in the system.
Over the whole 24 h period considered in this case study, the overall maximum increase in line losses due to the STATCOM was found to be 11.1%. Although STATCOM operation during midday PV generation slightly increases line losses (due to additional reactive power flow), this trade-off is minor compared to the critical benefit of maintaining voltage compliance and avoiding network overvoltage issues. During peak load periods, the STATCOM reduces current flow by locally supplying reactive power, thereby reducing line losses. This complementary effect ensures that the overall impact on energy efficiency is minimal when considering the improved voltage profile and power quality.
From an operational standpoint, STATCOMs present a more economical solution due to their simple installation and autonomous operation, which avoids the need for communication infrastructure or complex coordination with upstream equipment. Unlike OLTC upgrades that require network-wide planning or energy storage solutions that incur ongoing maintenance and replacement cycles, STATCOMs maintain their performance over time with minimal intervention. Their ability to dynamically manage voltage without energy capacity constraints makes them a cost-effective and enduring option for LV feeders with increasing rooftop PV penetration.
4.4. System Unbalance
4.4.1. Voltage Unbalance
This section investigates the performance of the STATCOM with respect to mitigating the unbalance caused by unbalanced connections of loads and/or PV generators. Voltage unbalance in LV networks is an important power quality problem, and it has the potential to propagate to upstream networks. To introduce unbalance into this case study’s network, the PV size and peak load for phase B were reduced by 10%, and for phase C, they were reduced by 20% compared to phase A.
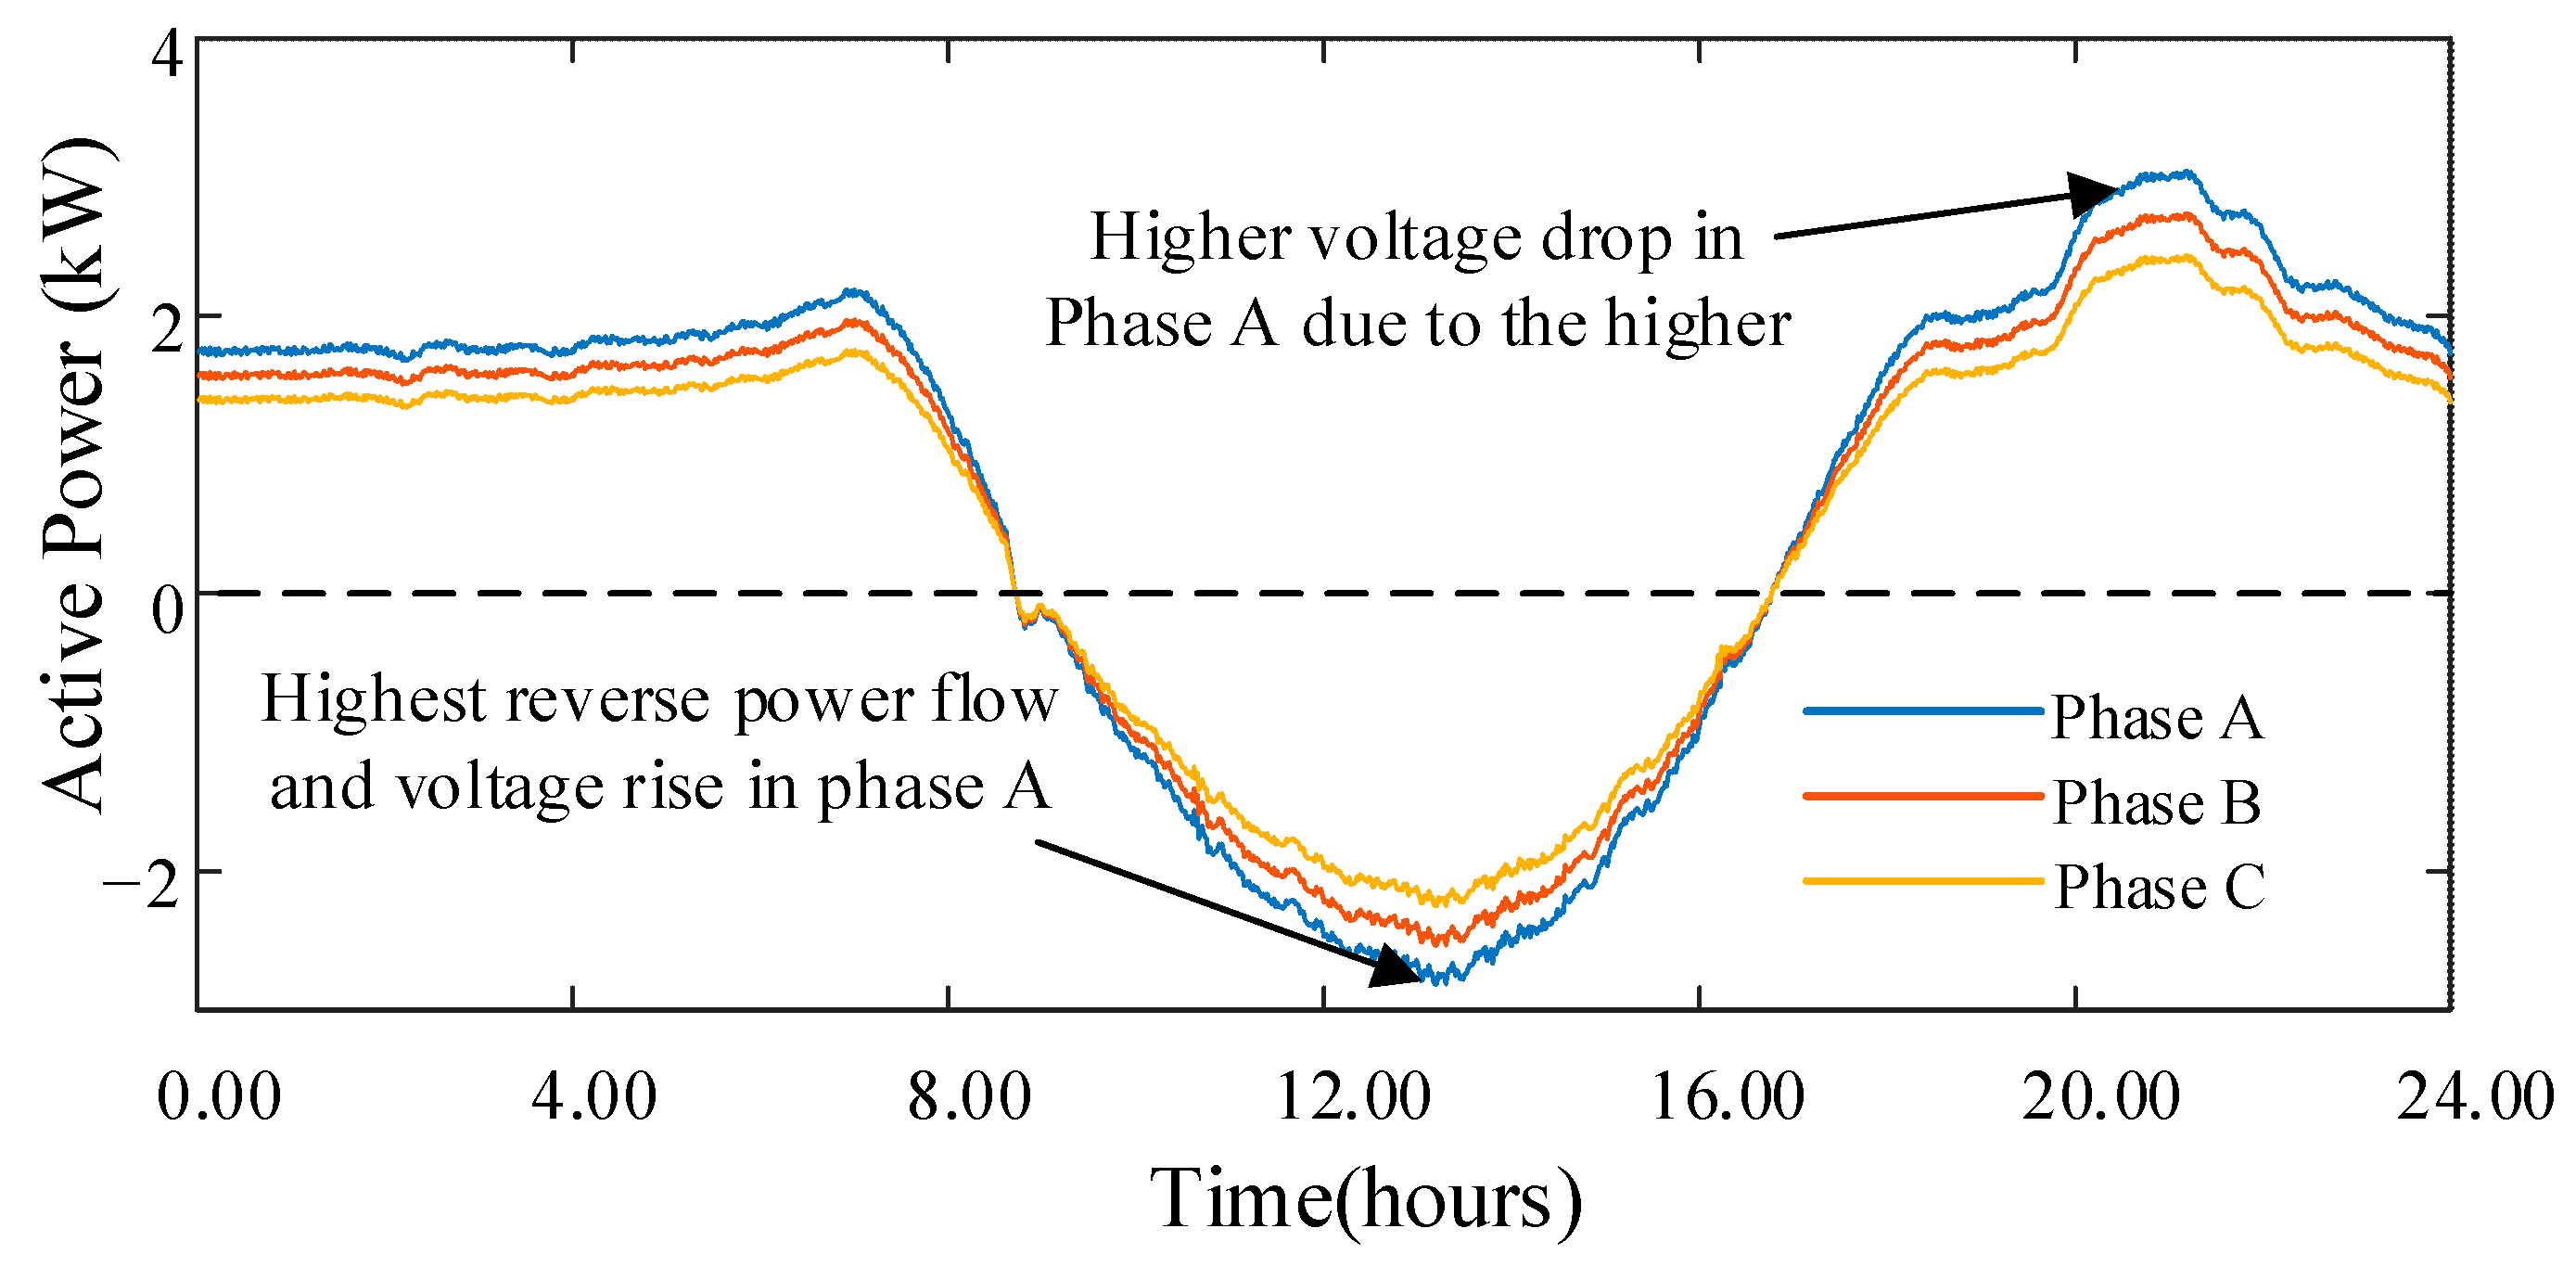
Figure 16 depicts the three-phase net exchange of active power for a particular node in the feeder. Due to the larger load and size of the PV system, the active power contribution from phase A is higher for both reverse power flow and conventional downstream power flow.
To investigate the ability of the STATCOM to mitigate unbalance, three single-phase 20 kVAr STATCOMs were connected to the end of the four-wire LV feeder considered in this study. As the voltage in the three phases varies over the 24 h period, the reactive power of the individual STATCOMs is regulated according to the droop curve defined in
Figure 11.
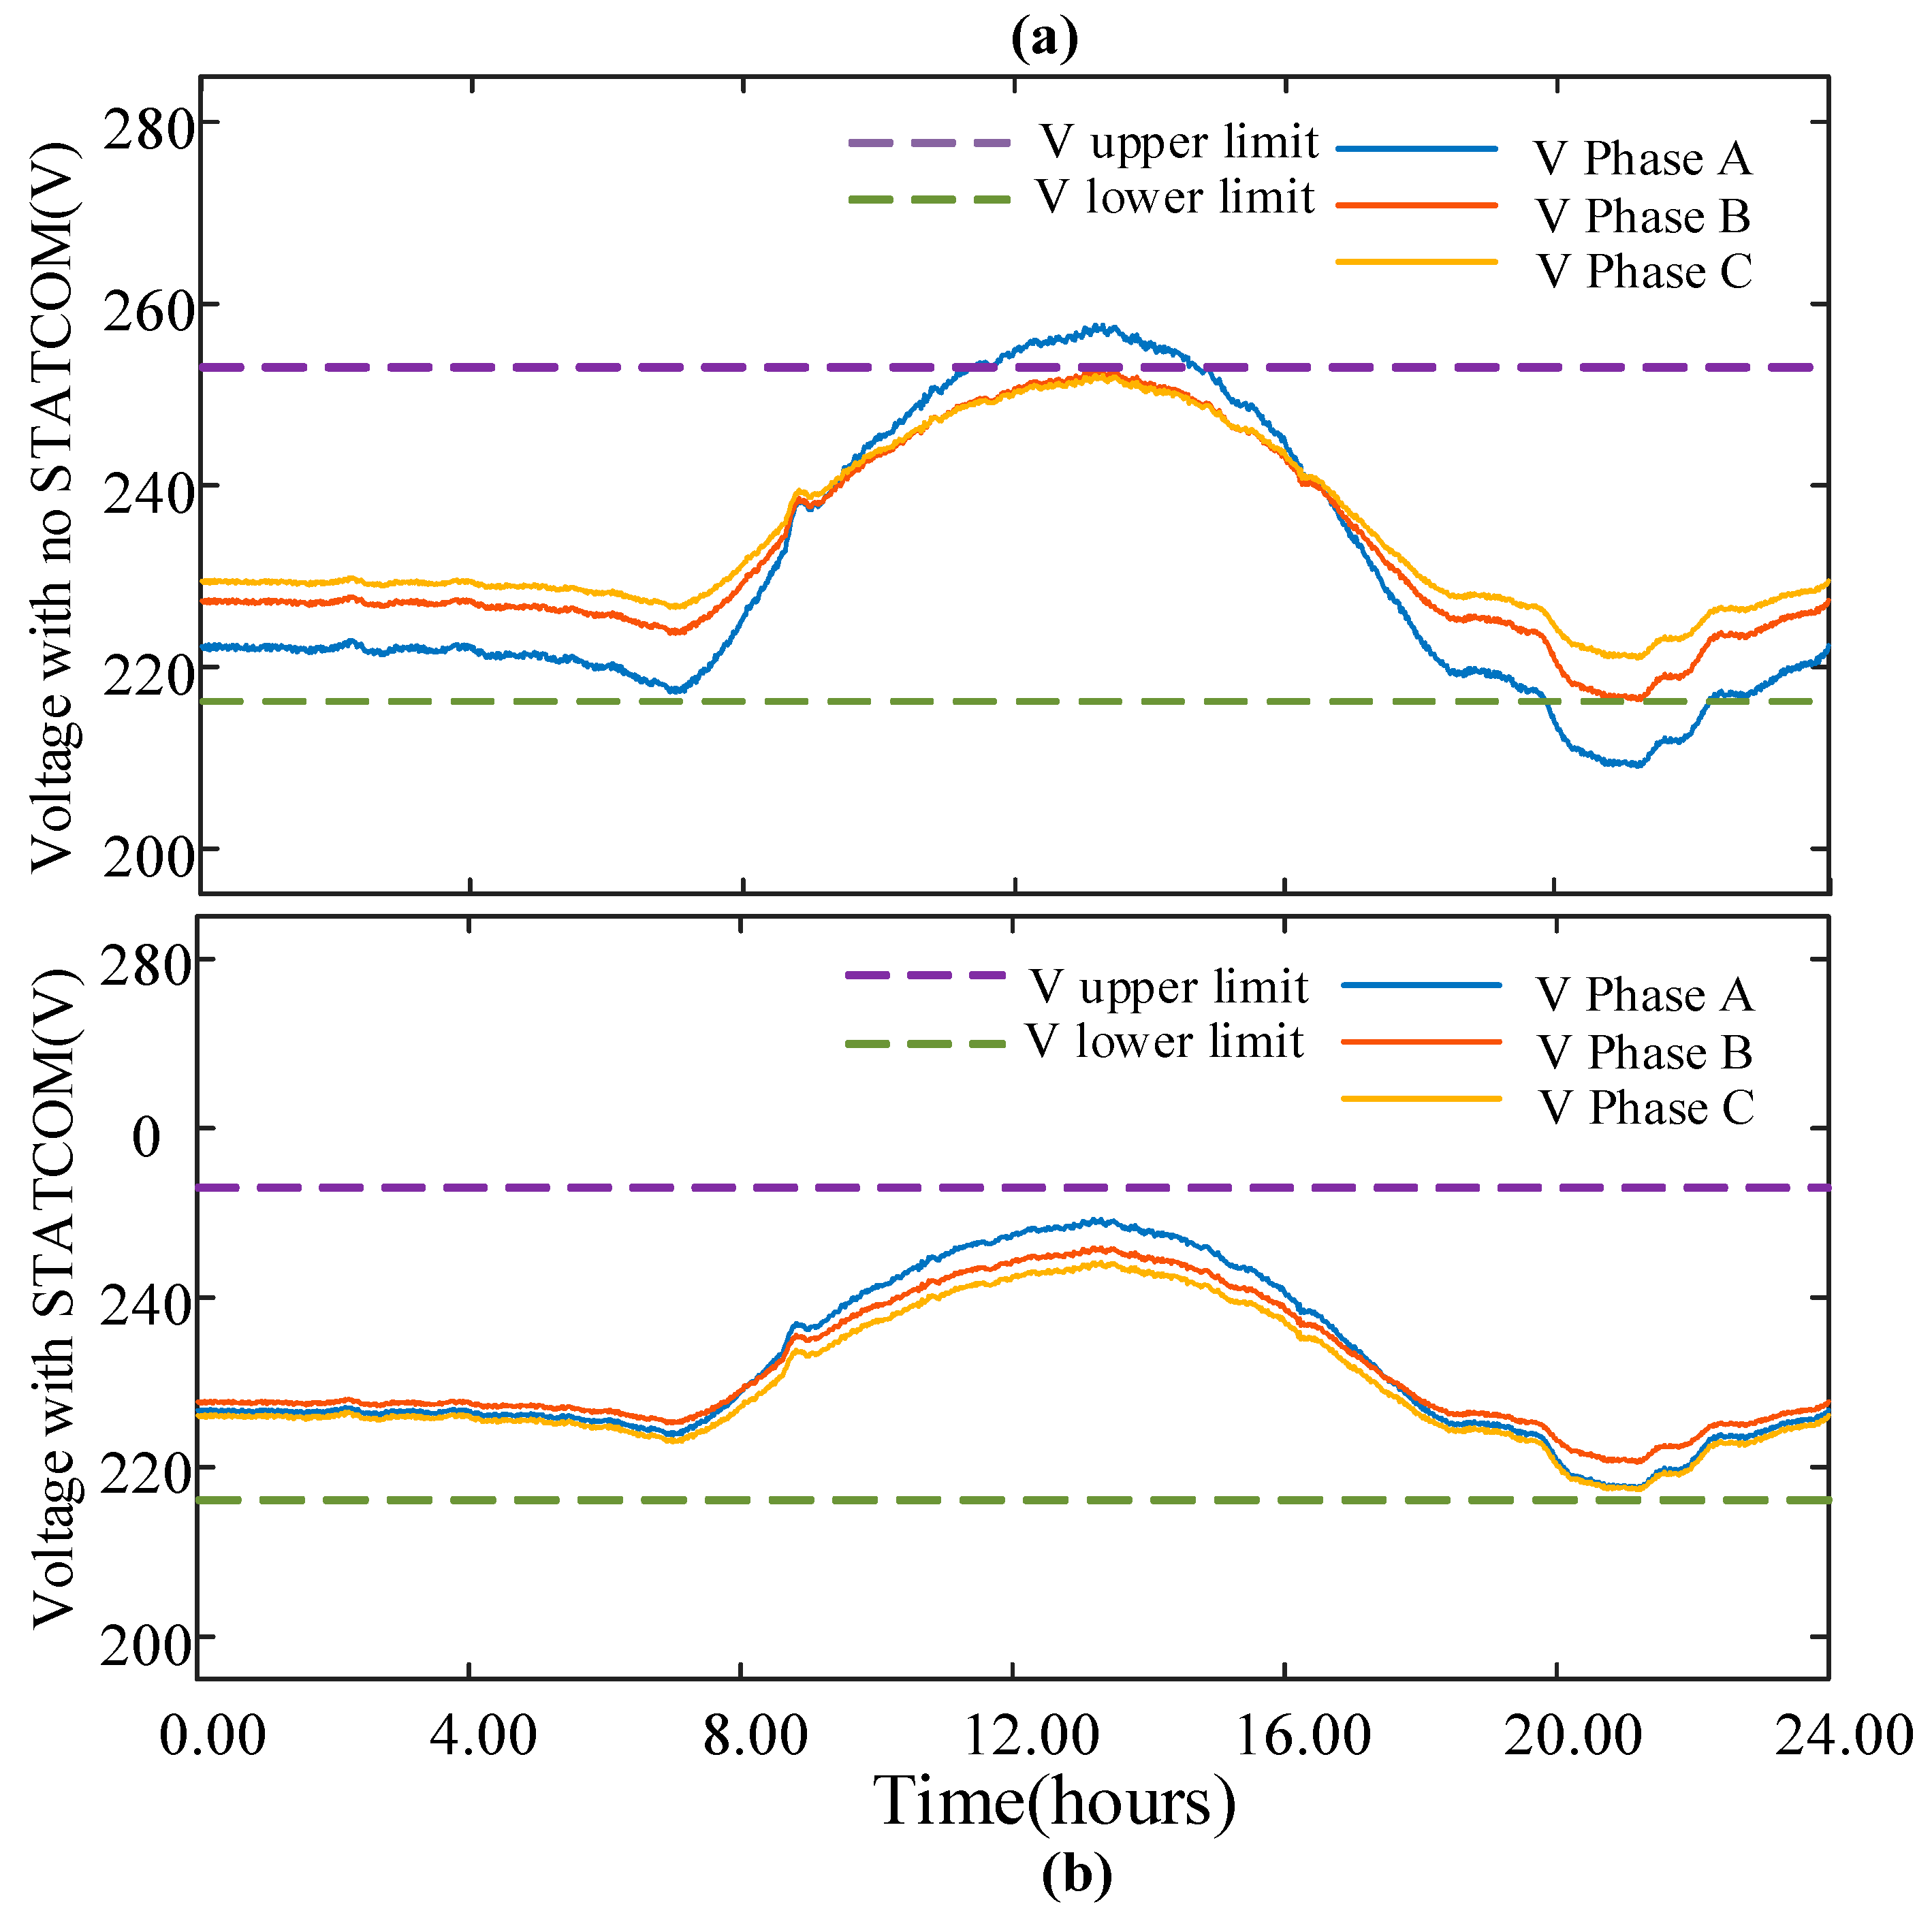
Figure 17 depicts the three-phase line-neutral voltages with and without the application of STATCOMs in the system. Analysing
Figure 17a, the difference in voltage levels across the three phases can be seen, indicating higher voltage unbalance in the system as individual phases absorb/inject different power values. With the reactive power regulation activated, it is evident from
Figure 17b that the three phase voltages can be successfully controlled to reduce the voltage unbalance in the network.
To quantify the voltage unbalance in the system, the definition of the voltage unbalance factor (VUF) according to IEC/TR 61000-3-13 [
29] is utilized. This is defined as follows:
where
, and V
ab, V
bc, and V
ca correspond to the magnitudes of the line–line voltages for the three-phase system.
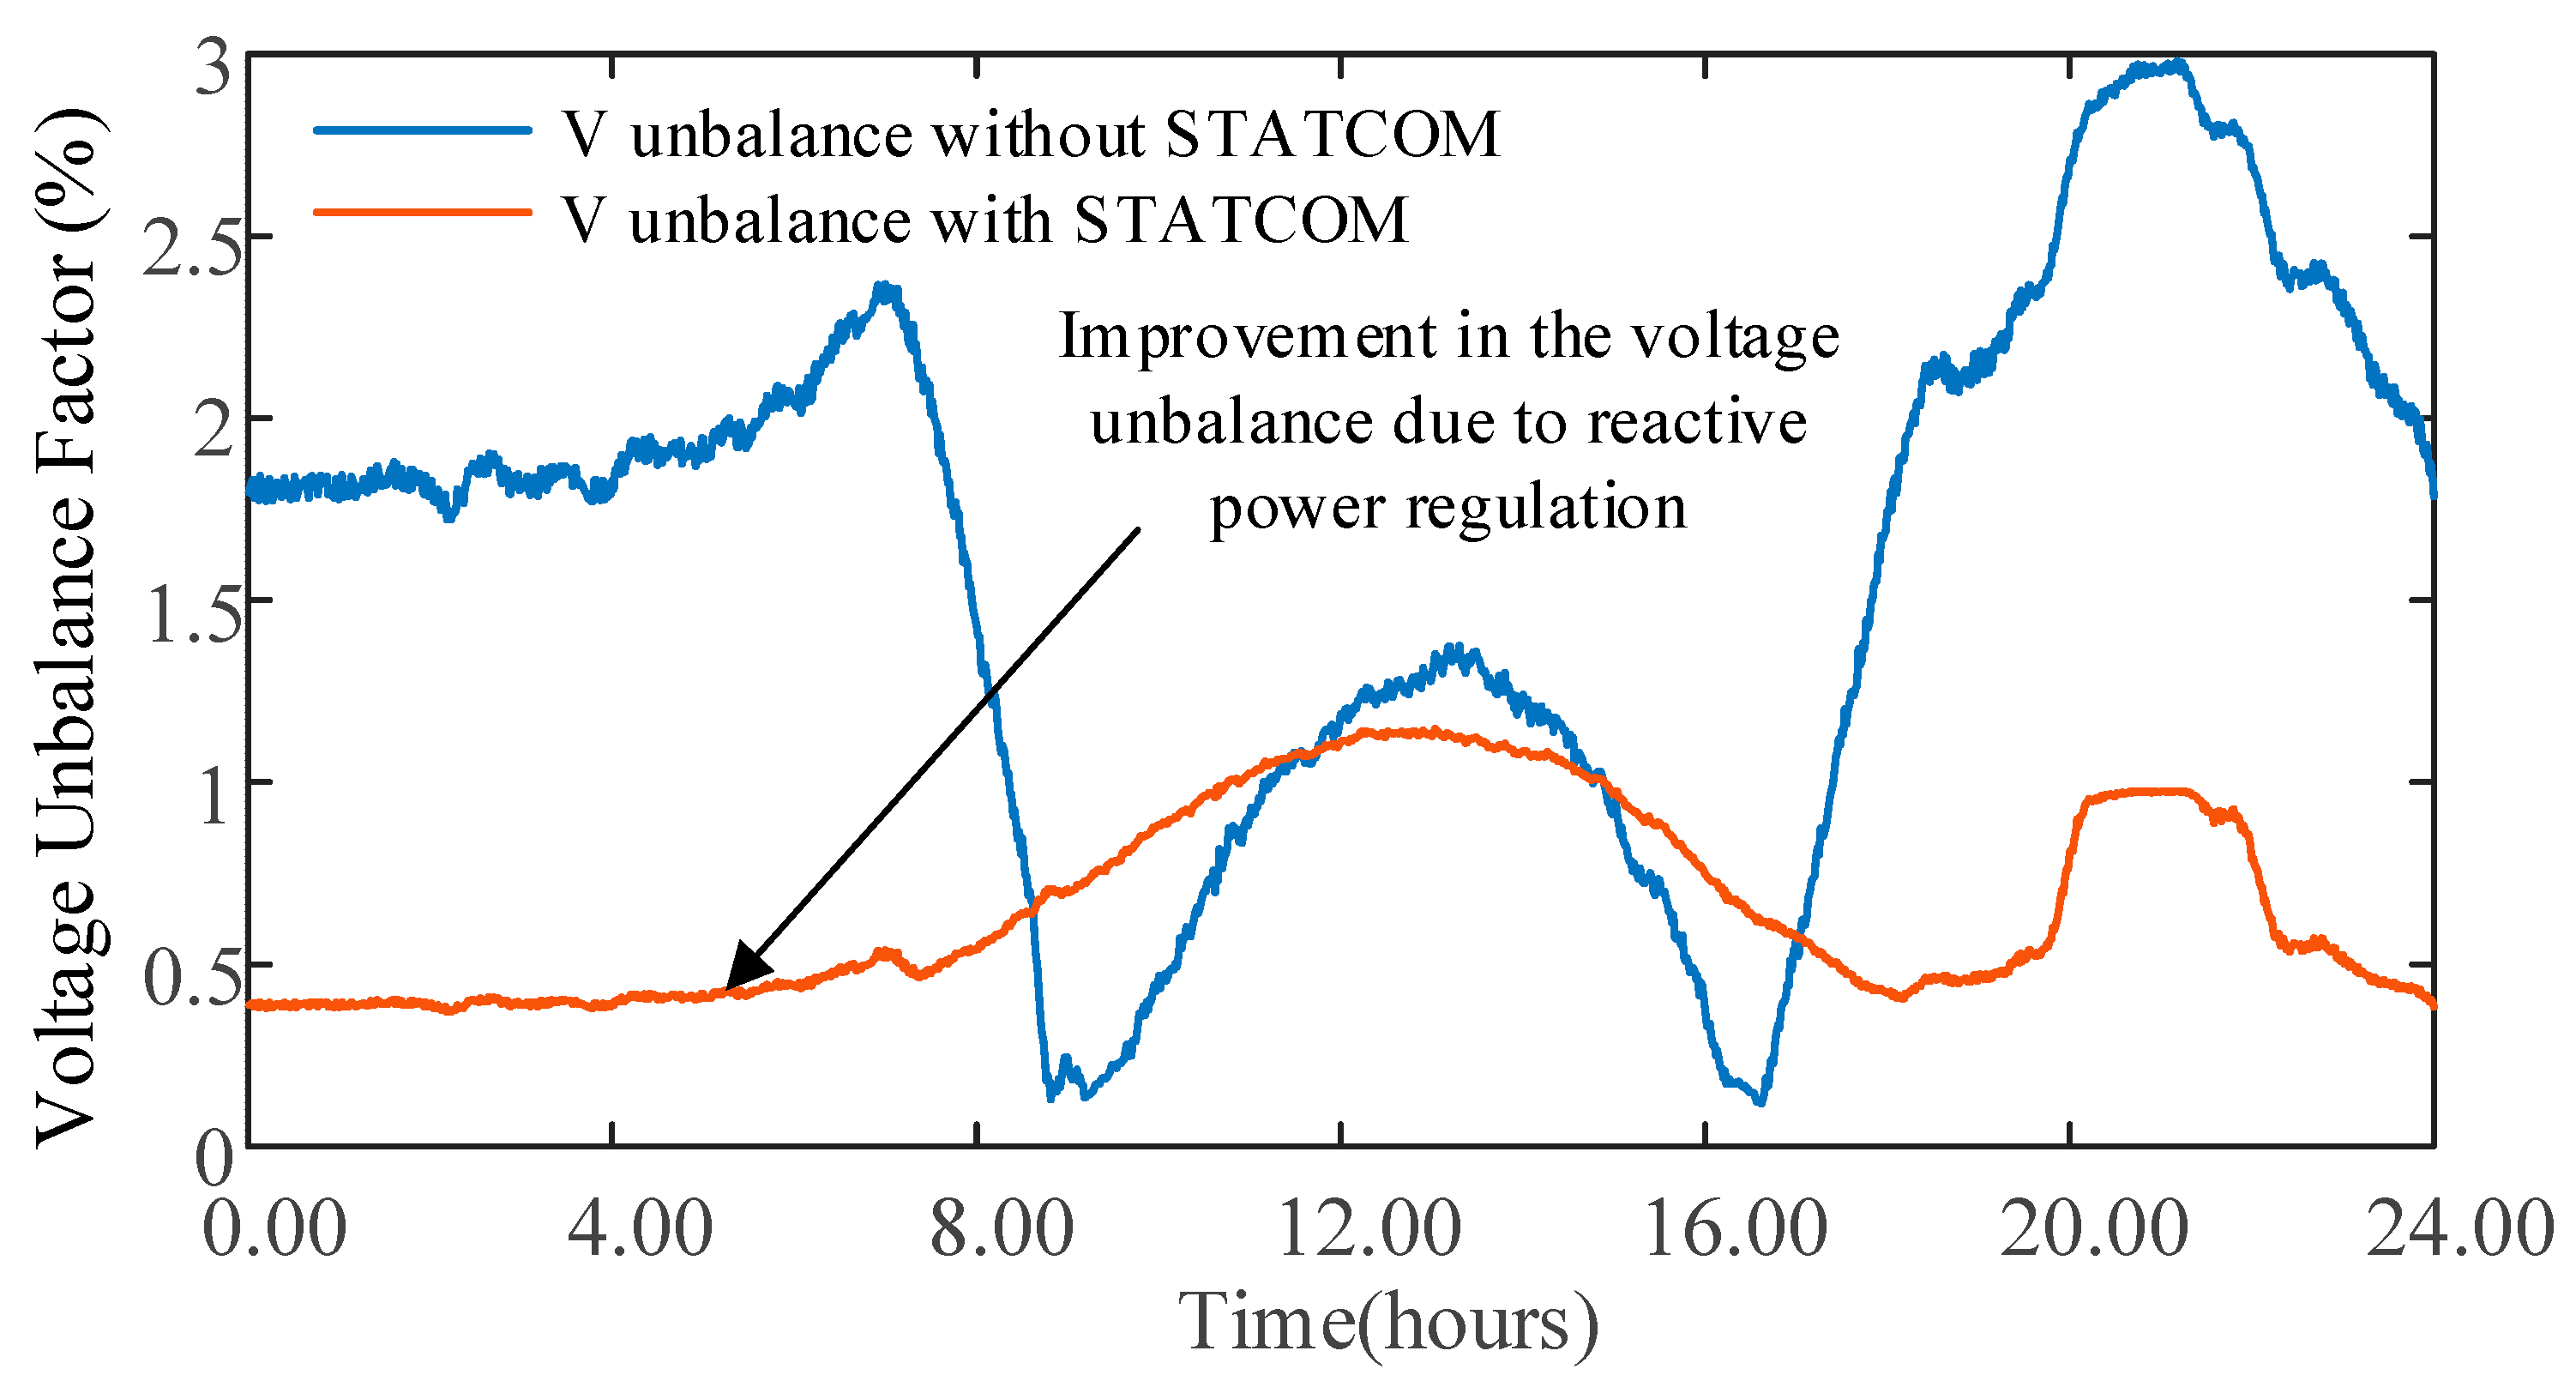
Figure 18 shows the variation in VUF measured at the end of the feeder. Due to the reduction in load and PV size in phases B and C, the maximum VUF is seen to be 3% with no STATCOM. Through the reactive power provided by the STATCOMs, as evident from
Figure 18, the overall VUF of the system has decreased. With the STATCOM operating, the maximum VUF is reduced to 1%.
Over short periods, at approximately 9:00 in the morning and 16:00 in the afternoon, the VUF with the STATCOMs in operation was measured to be higher compared to the VUF measured with no STATCOM. To explain this, the net active power given in
Figure 16 needs to be considered. It is seen that during those two instances, the net active power is close to zero, indicating minimal voltage drops in the feeder, and the voltage at the end of the feeder is close to 240 V (close to the sending end’s voltage due to minimal power flow in the feeder), as shown in
Figure 17a. The VUF without the STATCOM was also measured to be quite low during that time. Because the droop control applied in this study was designed to be around the nominal 230 V, even with few voltage drops in the feeder, the STATCOMs absorb reactive power to reduce the voltage to 230 V. During this operation, the reactive power from the individual single-phase STATCOMs increases the VUF by a small margin.
4.4.2. Neutral to Grounding Potential
The impact of reactive power regulation on the neutral to ground (N-G) voltage in a four-wire MEN system is investigated in this section. If the currents are unbalanced, the resulting N-G voltage can become an issue of serious concern. In traditional distribution network analysis, the neutral conductor is often accommodated using Kron’s reduction technique or assumed to be solidly grounded. From a practical perspective, this assumption is not realistic, especially if there is high unbalance in the system.
Figure 19 illustrates the basic connection philosophy of a MEN system.
Unlike the phase voltages, the N-G voltage is typically the highest towards the start of the feeder, as the neutral conductor currents are higher at this location.
Figure 20 shows the variation in the neutral-grounding potential at the 400 V bus of the 11 kV/400 V transformer supplying the feeder. As detailed previously, the N-G resistance was assumed to be 0.5 Ω.
Interestingly, the N-G voltage of the system was observed to be higher during the daytime when the reactive power needed to be absorbed to mitigate the voltage rise issue. In this case study, the PV size for phase A is higher than for phase B, which, in turn, is higher than for phase C. This means that phase A’s current was higher at midday compared to the other two phases. With reactive power regulation, the STATCOM in phase A will absorb the higher Q compared to phases B and C, leading to higher unbalance in the system’s current. This leads to the N-G voltage’s increase due to an increase in the flow of the neutral current. This is demonstrated via the orange line, which plots the N-G voltage with the reactive power regulation applied. With no PV generation, however, the N-G voltage is lower when the STATCOM is operating due to a lower Q; hence, a lower current is observed in the system.
The neutral-to-ground (N–G) potential was evaluated using a realistic four-wire MEN system model to capture the behaviour of actual LV feeders. While an increase in N–G voltage was observed during periods of unbalanced generation and reactive power absorption, all values remained within safe and operationally acceptable limits. It is important to note that mitigating the N–G potential was not the aim of this study; rather, it was analysed to confirm that STATCOM operation does not negatively impact the system’s safety.
4.5. Field Evidence of LV STATCOM Effectiveness
To complement the simulation-based analysis presented above, this section presents real-world results from LV STATCOM deployments trialled by a major Australian DNSP. These trials provide valuable evidence of the practical efficacy of STATCOMs in rural and semi-rural LV feeders with increasing levels of rooftop PV.
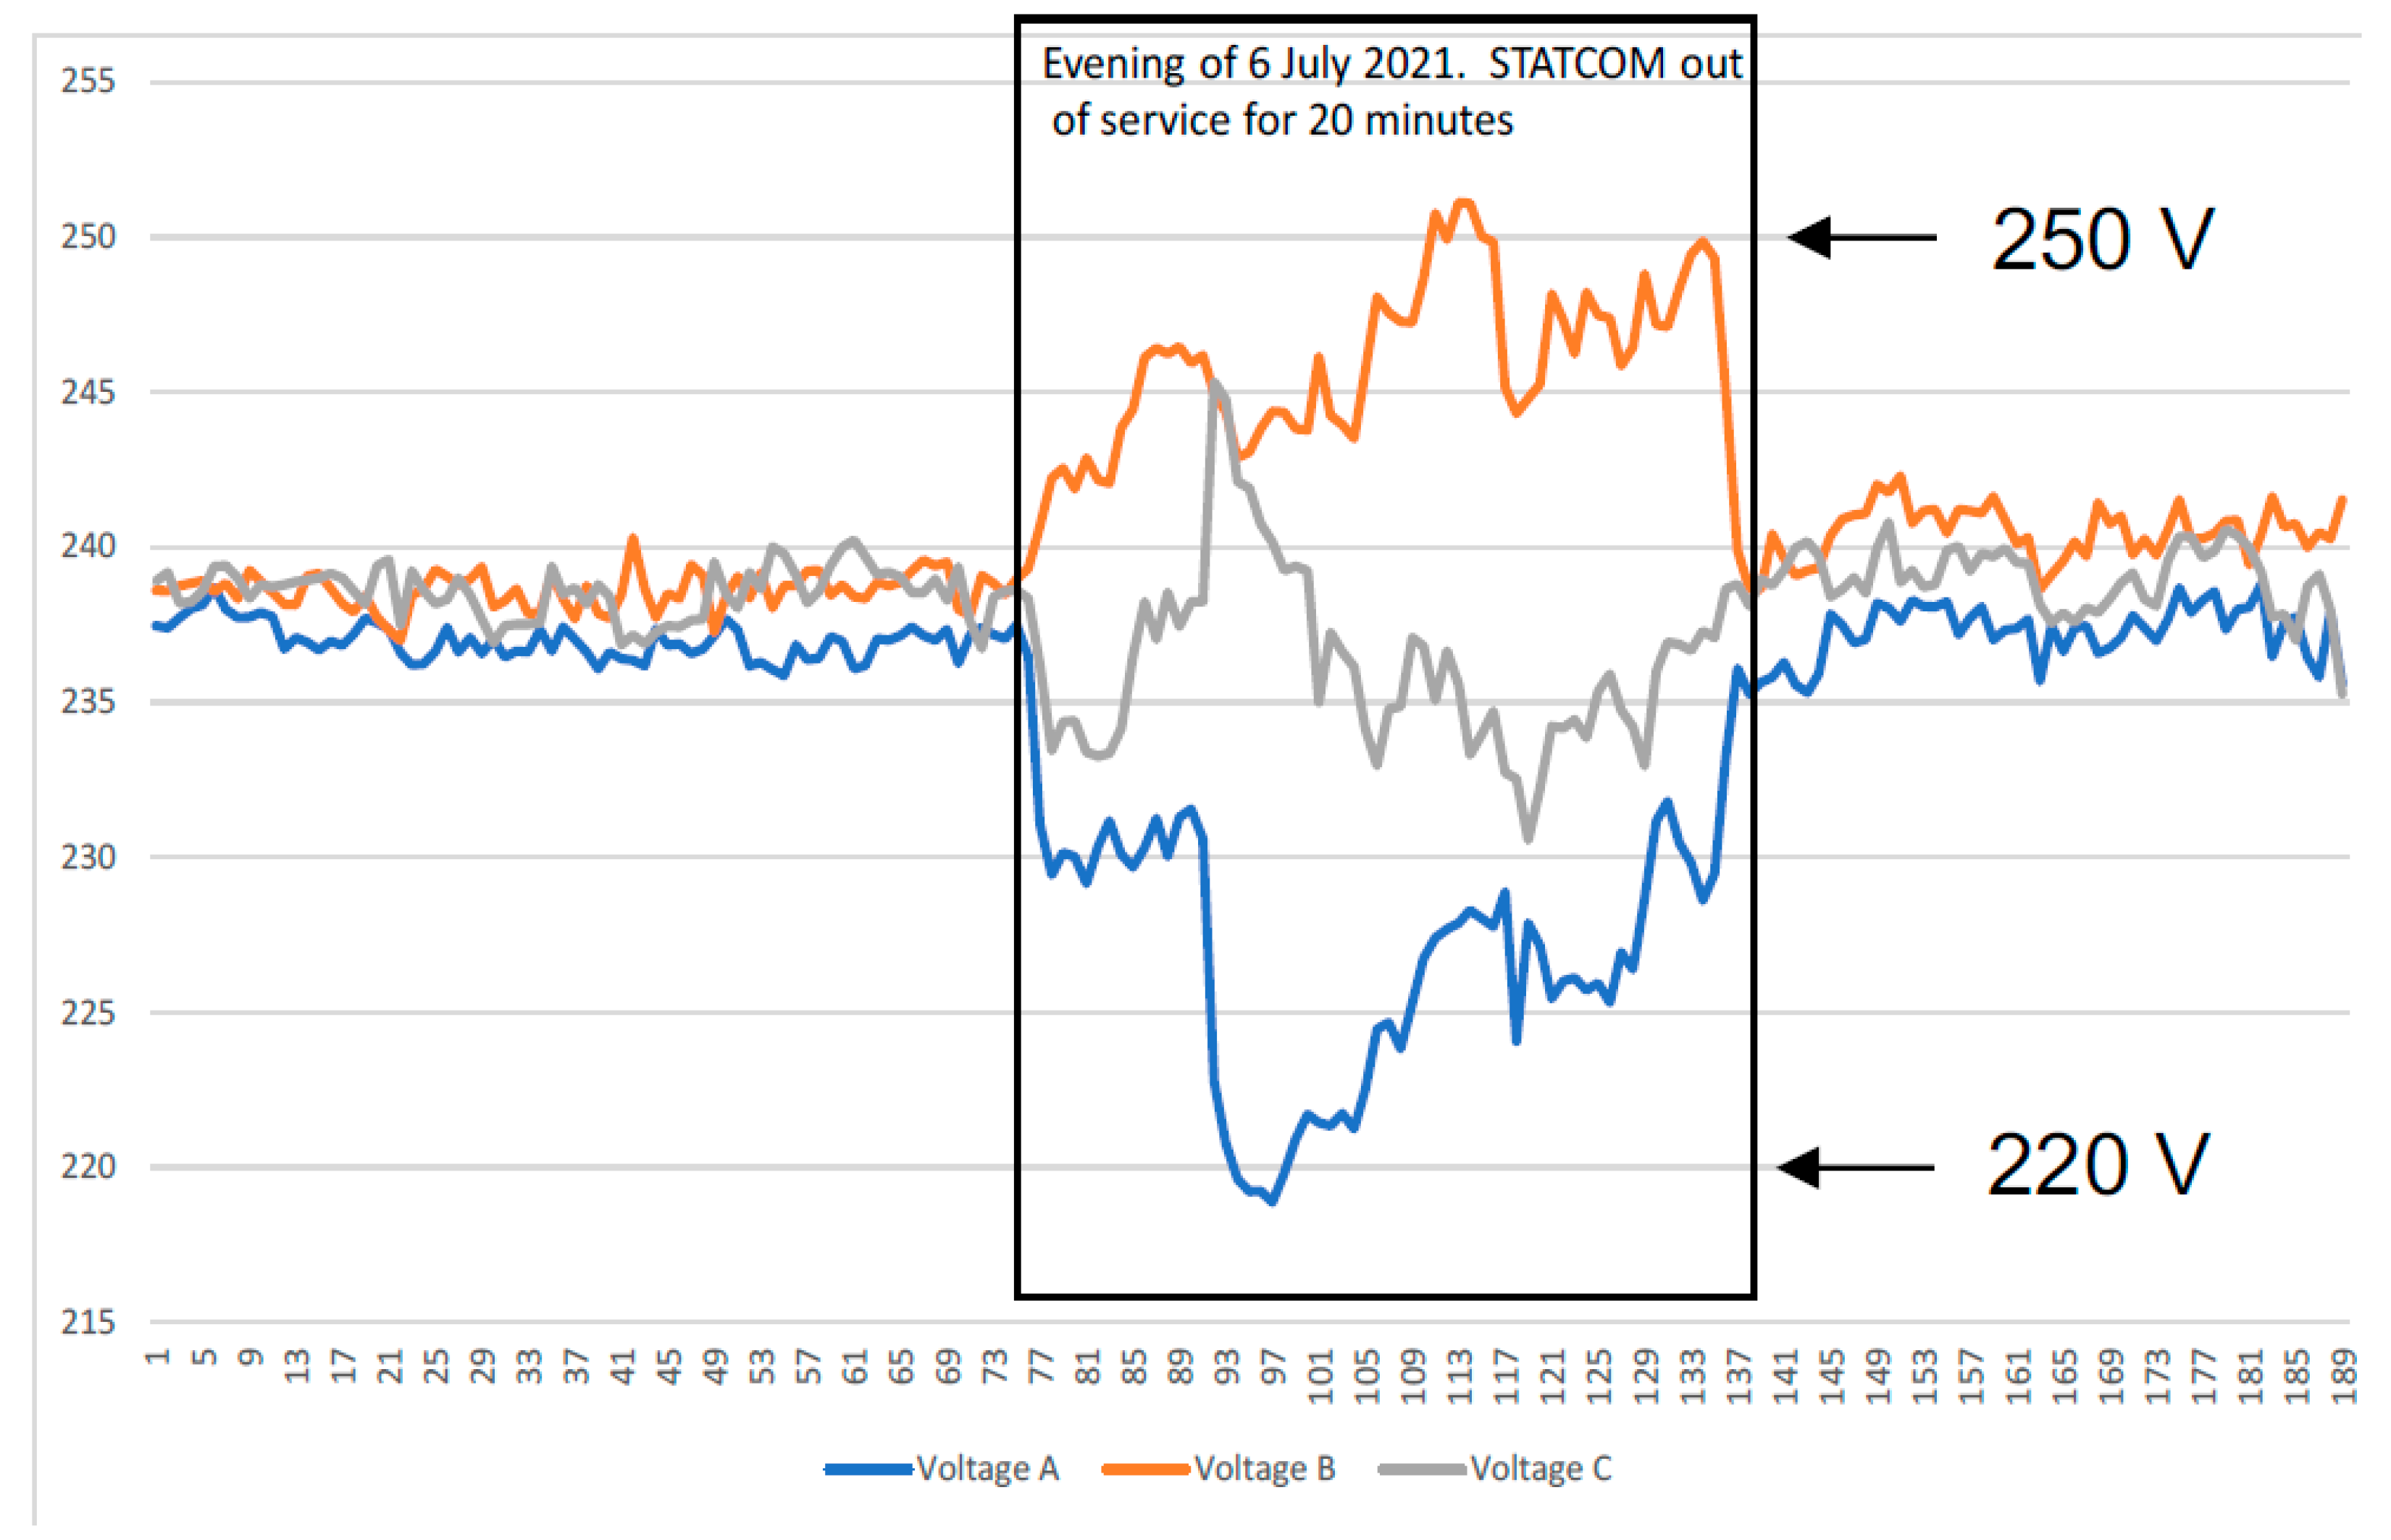
Figure 21 shows time series voltage data from a long rural overhead LV feeder that is approximately 750 m in length, supplying 61 customers—22 of whom have rooftop solar PV systems installed (~36% penetration). A 30 kVAr STATCOM was installed near the end of the feeder. The figure captures a brief 20 min period when the STATCOM was taken out of service. While the voltage remained within regulatory compliance limits, a clear deterioration in voltage regulation and an increase in phase imbalance were observed, highlighting the STATCOM’s ongoing role in maintaining tighter voltage control under dynamic conditions. To quantify the observed improvements, in
Figure 21, the maximum voltage spread without the STATCOM was approximately 31 V (from 219 V to 250 V). With the STATCOM in operation, the voltage spread reduced to approximately 5 V—an 84% reduction in voltage variation. Similarly, the estimated voltage unbalance factor (assuming a 120° phase shift) reduced from 2.43% without the STATCOM to 0.37% with it—also an 84% improvement.
Figure 22 presents the results from another site: a ~600 m feeder supplying approximately 30 customers with large residential blocks. In this case, the STATCOM was temporarily deactivated for approximately 30 min. During the STACOM’s downtime, the voltage levels increased significantly, with at least one phase exceeding the upper limit of the allowable range. Once the STATCOM was reactivated, the voltages returned to acceptable levels, and headroom for additional solar PV hosting was restored. This highlights how LV STATCOMs can not only manage voltage within limits but also increase hosting capacities for distributed generation in constrained feeders. In
Figure 22, the maximum voltage spread without the STATCOM was approximately 19 V (256 V to 237 V), while with the STATCOM in operation, the spread reduced to approximately 1 V—a 95% reduction. The estimated unbalance dropped from 1.17% to effectively 0%, indicating near-complete mitigation of voltage unbalance in that case
These real-world outcomes reinforce the findings of the modelling and simulation undertaken in this paper. They demonstrate that modestly sized LV STATCOMs (in the range of 30–40 kVAr) can provide effective voltage regulation in LV feeders containing significant penetration of distributed solar PV generation when deployed near the end of the line. Importantly, these benefits are achieved without the need for complex communication or control infrastructure, making them a practical and scalable solution for voltage management in high-DER LV networks.
5. Conclusions
This paper investigates the feasibility of applying STATCOM-based reactive power regulation to maintain steady-state voltage levels within prescribed limits in radial four-wire LV feeders. A future grid scenario is considered with 100% rooftop solar PV penetration, where all the residential houses are fitted with a single-phase rooftop PV system. An “exact” lump load model was utilized to provide a guideline for the approximate sizing of the STATCOM required for a general LV radial feeder to improve steady-state voltage levels. From the equations derived through circuit analyses, the amount of voltage improvement from the STATCOM was found to be dependent on the effective reactance of the line and the amount of Q from the device. For establishing the rating of the STATCOM, two extreme scenarios of maximum voltage rise (midday) and maximum voltage drop (evening) have been considered or applied to maintain the voltage levels within the prescribed lower and upper limits. For the 300 m feeder used for this case study, the rating of the STATCOM required to maintain voltage levels within the prescribed range was determined to be 20 kVAr. For time-series variations in PV and load outputs, a Q-V droop control was applied to regulate the Q in the STATCOM.
This case study’s LV feeder was also used to demonstrate the voltage improvement capabilities of the STATCOM through a 24 h time series simulation. The simulation results demonstrated that the STATCOM was successful in maintaining voltage levels during reverse power flow and peak evening load. The maximum line-to-neutral voltage (end of the feeder) during midday was reduced from 259.1 V to 249 V, and during the peak evening load, the STATCOM was successful in increasing the voltage from 212.1 V to 219.2 V.
System unbalance was also mitigated using individual single-phase STATCOMs, reducing the peak voltage unbalance factor (VUF) from 3% to 1%. Neutral-to-ground voltage impacts were evaluated using a four-wire MEN model. While increased reactive power absorption during high PV periods slightly increased line losses, the STATCOM reduced losses under high-load conditions.
Importantly, the field validation results from real LV networks in Australia supported the simulation findings. These trials demonstrated the ability of modestly rated STATCOMs to maintain voltage compliance and improve DER hosting capacities in long rural feeders. The proposed approach requires only local voltage measurements, and no sophisticated communication infrastructure is needed, making it a practical and economical solution for modern distribution networks.
Compared to conventional OLTC-based voltage regulation, which acts at the substation and can be slow to respond to local voltage fluctuations, STATCOMs offer faster and more localized voltage control. Unlike battery energy storage systems that provide both energy and reactive power but require complex energy management and regular cycling, STATCOMs focus solely on reactive power regulation, ensuring continuous operation without energy constraints. This makes STATCOMs a complementary and often simpler solution for feeders with high rooftop PV penetration, particularly where communication infrastructure for centralized control is unavailable.
STATCOMs are particularly attractive for LV feeders without advanced communications, as they can operate autonomously with minimal configuration and do not require network upgrades when PV penetration increases. However, they are an electronic device, and future work will focus on investigating harmonic effects from inverter switching and assessing their performance in PV-rich grids. Unlike storage-based solutions, STATCOM performance is not tied to energy availability. However, further studies will evaluate their integration with hybrid approaches for enhanced grid stability.
Author Contributions
Conceptualization, O.R., D.R. and S.E.; investigation, O.R.; supervision, D.R. and S.E.; validation, O.R.; writing—original draft, O.R.; writing—review and editing, D.R. and S.E. All authors have read and agreed to the published version of the manuscript.
Funding
This research received no external funding.
Data Availability Statement
The original contributions presented in the study are included in this article. Further inquiries can be directed to the corresponding author.
Acknowledgments
The authors would like to recognise the contribution of William Chesterton, Manager of Load Control at Ausgrid, for providing technical advice, and Ausgrid for making available the necessary data utilized in the work related to this paper.
Conflicts of Interest
The authors declare no conflicts of interest.
Abbreviations
The following abbreviations are used in this manuscript:
| DNSP | Distribution Network Service Provider; |
| LV | Low Voltage; |
| MEN | Multiple Earthed Neutral System; |
| MV | Medium Voltage; |
| OLTC | On Load Tap Changer; |
| PCC | Point of Common Coupling; |
| PI | Proportional Integral; |
| VUF | Voltage Unbalance Factor; |
| SOC | State of Charge. |
References
- Dugan, R.C.; McDermott, T.E.; Ball, G.J. Planning for distributed generation. IEEE Ind. Appl. Mag. 2001, 7, 80–88. [Google Scholar] [CrossRef]
- Australian PV Institute. Australian PV Market Since April 2001. Available online: https://pv-map.apvi.org.au/analyses (accessed on 1 April 2025).
- AS61000.3.100; Electromagnetic Compatibility (EMC) Limits-Steady State Voltage Limits in Public Electricity Systems. Standards Australia: Sydney, Australia, 2015.
- Alam, M.J.E.; Muttaqi, K.M.; Sutanto, D. A Three-Phase Power Flow Approach for Integrated 3-Wire MV and 4-Wire Multigrounded LV Networks With Rooftop Solar PV. IEEE Trans. Power Syst. 2013, 28, 1728–1737. [Google Scholar] [CrossRef]
- Canova, A.; Giaccone, L.; Spertino, F.; Tartaglia, M. Electrical Impact of Photovoltaic Plant in Distributed Network. IEEE Trans. Ind. Appl. 2009, 45, 341–347. [Google Scholar] [CrossRef]
- Elphick, S.; Smith, V.; Gosbell, V.; Barr, R. Characteristics of power quality disturbance levels in Australia. In Proceedings of the 2012 IEEE 15th International Conference on Harmonics and Quality of Power, Hong Kong, China, 17–20 June 2012; pp. 274–280. [Google Scholar] [CrossRef]
- Azizivahed, A.; Azizivahed, A.; Arefi, A.; Ghavidel, S.; Shafie-khah, M.; Li, L.; Zhang, J.; Catalão, J.P.C. Energy Management Strategy in Dynamic Distribution Network Reconfiguration Considering Renewable Energy Resources and Storage. IEEE Trans. Sustain. Energy 2020, 11, 662–673. [Google Scholar] [CrossRef]
- Banfield, B.; Robinson, D.A.; Agalgaonkar, A.P. Comparison of economic model predictive control and rule-based control for residential energy storage systems. IET Smart Grid 2020, 3, 722–729. [Google Scholar] [CrossRef]
- Nick, M.; Cherkaoui, R.; Paolone, M. Optimal Planning of Distributed Energy Storage Systems in Active Distribution Networks Embedding Grid Reconfiguration. IEEE Trans. Power Syst. 2018, 33, 1577–1590. [Google Scholar] [CrossRef]
- Jayam, A.P.; Chowdhury, B.H. Improving the dynamic performance of wind farms with STATCOM. In Proceedings of the 2009 IEEE/PES Power Systems Conference and Exposition, Seattle, WA, USA, 15–18 March 2009; pp. 1–8. [Google Scholar] [CrossRef]
- Rahman, O.; Muttaqi, K.M.; Sutanto, D. Three Phase Power Flow Analysis of Distribution Network Performance with High Penetration of Single Phase PV units Integrated with Energy Storage System. In Proceedings of the 2018 Australasian Universities Power Engineering Conference (AUPEC), Auckland, New Zealand, 27–30 November 2018; pp. 1–6. [Google Scholar] [CrossRef]
- Enderle, T.P.; da Silva, G.S.; Fischer, C.; Beltrame, R.C.; Schuch, L.; Montagner, V.F.; Rech, C. D-STATCOM applied to single-phase distribution networks: Modeling and control. In Proceedings of the IECON 2012-38th Annual Conference on IEEE Industrial Electronics Society, Montreal, QC, Canada, 25–28 October 2012; pp. 321–326. [Google Scholar] [CrossRef]
- Murugesan, K.; Muthu, R. Modeling and simulation of D-STATCOM for voltage regulations. In Proceedings of the 2011 the 1st International Conference on Electrical Energy Systems, Chennai, India, 3–5 January 2011; pp. 1–5. [Google Scholar] [CrossRef]
- Zad, B.B.; Lobry, J.; Vallée, F. Coordinated control of on-load tap changer and D-STATCOM for voltage regulation of radial distribution systems with DG units. In Proceedings of the 2013 3rd International Conference on Electric Power and Energy Conversion Systems, Istanbul, Turkey, 2–4 October 2013; pp. 1–5. [Google Scholar] [CrossRef]
- Gupta, A.; Jain, A.; Kumar, A. Optimal D-STATCOM placement in radial distribution system based on power loss index approach. In Proceedings of the 2015 International Conference on Energy, Power and Environment: Towards Sustainable Growth (ICEPE), Shillong, India, 12–13 June 2015; pp. 1–5. [Google Scholar]
- Jain, A.; Gupta, A.R.; Kumar, A. An efficient method for D-STATCOM placement in radial distribution system. In Proceedings of the 2014 IEEE 6th India International Conference on Power Electronics (IICPE), Kurukshetra, India, 8–10 December 2014; pp. 1–6. [Google Scholar]
- Ciric, R.; Padilha-Feltrin, A.; Ochoa, L. Power flow in four-wire distribution networks-General approach. IEEE Trans. Power Syst. 2003, 18, 1283–1290. [Google Scholar] [CrossRef]
- Ahmadi, G.; Shahrtash, S.M. Neutral to earth voltage reduction methods in three-phase four wire distribution systems. In Proceedings of the 2009 International Conference on Electrical and Electronics Engineering—ELECO 2009, Bursa, Turkey, 5–8 November 2009; pp. I-134–I-138. [Google Scholar]
- Alam, M.J.E.; Muttaqi, K.M.; Sutanto, D. Community Energy Storage for Neutral Voltage Rise Mitigation in Four-Wire Multigrounded LV Feeders with Unbalanced Solar PV Allocation. IEEE Trans. Smart Grid 2015, 6, 2845–2855. [Google Scholar] [CrossRef]
- Rahman, O.; Muttaqi, K.M.; Sutanto, D. Time Series Variations of the Neutral-to-Ground Potential in a 4-Wire LV Network under Unbalanced Allocation of Rooftop Solar PV and Mitigation using Energy Storage. In Proceedings of the 2019 IEEE Power & Energy Society General Meeting (PESGM), Atlanta, GA, USA, 4–8 August 2019; pp. 1–5. [Google Scholar] [CrossRef]
- Kersting, W.H. Distribution System Modeling and Analysis, 3rd ed.; CRC Press: Boca Raton, FL, USA, 2012. [Google Scholar]
- Tamp, F.; Ciufo, P. A Sensitivity Analysis Toolkit for the Simplification of MV Distribution Network Voltage Management. IEEE Trans. Smart Grid 2014, 5, 559–568. [Google Scholar] [CrossRef]
- Schauder, C.; Mehta, H. Vector analysis and control of advanced static VAr compensators. IEE Proc. C-Gener. Transm. Distrib. 1993, 140, 299–306. [Google Scholar] [CrossRef]
- Rao, P.; Crow, M.L.; Yang, Z. STATCOM control for power system voltage control applications. IEEE Trans. Power Deliv. 2000, 15, 1311–1317. [Google Scholar] [CrossRef]
- Christakou, K.; LeBoudec, J.; Paolone, M.; Tomozei, D. Efficient Computation of Sensitivity Coefficients of Node Voltages and Line Currents in Unbalanced Radial Electrical Distribution Networks. IEEE Trans. Smart Grid 2013, 4, 741–750. [Google Scholar] [CrossRef]
- Gonen, T. Electric Power Distribution Engineering, 3rd ed.; CRC Press: Boca Raton, FL, USA, 2014. [Google Scholar]
- AS/NZS 4777.2:2020; Grid Connection of Energy Systems via Inverters, Part 2: Inverter Requirements. Standards Australia: Sydney, Australia, 2020.
- Kersting, W.H.; Phillips, W.H. Distribution feeder line models. IEEE Trans. Ind. Appl. 1995, 31, 715–720. [Google Scholar] [CrossRef]
- IEC/TR 61000-3-13; Electromagnetic Compatibility (EMC)—Limits—Assessment of Emission Limits for the Connection of Unbalanced Installations to MV, HV and EHV Power Systems. I. E. Commission: Geneva, Switzerland, 2008.
Figure 1.
(a) Time series variation in load and PV output. (b) Voltage profiles in a typical LV feeder.
Figure 1.
(a) Time series variation in load and PV output. (b) Voltage profiles in a typical LV feeder.
Figure 2.
Lumped load model placements in the feeder.
Figure 2.
Lumped load model placements in the feeder.
Figure 3.
Connection of a STATCOM to an AC network.
Figure 3.
Connection of a STATCOM to an AC network.
Figure 4.
Control loop used to regulate the reactive power in STATCOMs.
Figure 4.
Control loop used to regulate the reactive power in STATCOMs.
Figure 5.
Voltage sensitivities with respect to the placement of the STATCOM.
Figure 5.
Voltage sensitivities with respect to the placement of the STATCOM.
Figure 6.
Line losses with respect to the placement of the STATCOM.
Figure 6.
Line losses with respect to the placement of the STATCOM.
Figure 7.
Lumped load model with STATCOM placed at the end of the feeder.
Figure 7.
Lumped load model with STATCOM placed at the end of the feeder.
Figure 8.
Voltages along the LV feeder with no STATCOM.
Figure 8.
Voltages along the LV feeder with no STATCOM.
Figure 9.
Improved voltage profile of the feeder with a STATCOM.
Figure 9.
Improved voltage profile of the feeder with a STATCOM.
Figure 10.
Time series variation in load and PV output of a typical installation.
Figure 10.
Time series variation in load and PV output of a typical installation.
Figure 11.
Defined Q-V droop curve for reactive power regulation of the STATCOM.
Figure 11.
Defined Q-V droop curve for reactive power regulation of the STATCOM.
Figure 12.
Time series voltage variation at the feeder end for a 24 h simulation.
Figure 12.
Time series voltage variation at the feeder end for a 24 h simulation.
Figure 13.
Time series variation of the reactive power from the STATCOM.
Figure 13.
Time series variation of the reactive power from the STATCOM.
Figure 14.
Total reactive power in the feeder.
Figure 14.
Total reactive power in the feeder.
Figure 15.
Variations in the line losses with and without STATCOM.
Figure 15.
Variations in the line losses with and without STATCOM.
Figure 16.
Three-phase active power contributions from a node in the LV feeder.
Figure 16.
Three-phase active power contributions from a node in the LV feeder.
Figure 17.
Time series variations in the three phase voltages. (a) With no STATCOM and (b) with STATCOM.
Figure 17.
Time series variations in the three phase voltages. (a) With no STATCOM and (b) with STATCOM.
Figure 18.
Impact of STATCOM on voltage unbalance.
Figure 18.
Impact of STATCOM on voltage unbalance.
Figure 19.
Connection of loads and in a 4-wire system.
Figure 19.
Connection of loads and in a 4-wire system.
Figure 20.
Impact on neutral-grounding potential with reactive power management.
Figure 20.
Impact on neutral-grounding potential with reactive power management.
Figure 21.
Voltage profile on a 750 m feeder during a 20 min STATCOM outage.
Figure 21.
Voltage profile on a 750 m feeder during a 20 min STATCOM outage.
Figure 22.
Voltage rise on a 600 m feeder during STATCOM outage and restoration.
Figure 22.
Voltage rise on a 600 m feeder during STATCOM outage and restoration.
Table 1.
Simulation parameters.
Table 1.
Simulation parameters.
| Peak Load | 3 kW at 0.95 pf |
| PV System | 5 kW at unity pf |
| Length of Feeder | 300 m with 15 m
between load connections |
| Line Impedance | 0.583 + 0.352j Ω/km |
| Grounding Impedance | 0.5 Ω |
| Disclaimer/Publisher’s Note: The statements, opinions and data contained in all publications are solely those of the individual author(s) and contributor(s) and not of MDPI and/or the editor(s). MDPI and/or the editor(s) disclaim responsibility for any injury to people or property resulting from any ideas, methods, instructions or products referred to in the content. |
© 2025 by the authors. Licensee MDPI, Basel, Switzerland. This article is an open access article distributed under the terms and conditions of the Creative Commons Attribution (CC BY) license (https://creativecommons.org/licenses/by/4.0/).


