Article

CML-RTDETR: A Lightweight Wheat Head Detection and Counting Algorithm Based on the Improved RT-DETR

Hubei Key Laboratory for High-Efficiency Utilization of Solar Energy and Operation Control of Energy Storage System, Hubei University of Technology, Wuhan 430068, China
*
Author to whom correspondence should be addressed.
Electronics 2025, 14(15), 3051; https://doi.org/10.3390/electronics14153051
Submission received: 2 July 2025 / Revised: 25 July 2025 / Accepted: 28 July 2025 / Published: 30 July 2025
(This article belongs to the Section Artificial Intelligence)

Abstract

Wheat is one of the important grain crops, and spike counting is crucial for predicting spike yield. However, in complex farmland environments, the wheat body scale has huge differences, its color is highly similar to the background, and wheat ears often overlap with each other, which makes wheat ear detection work face a lot of challenges. At the same time, the increasing demand for high accuracy and fast response in wheat spike detection has led to the need for models to be lightweight function with reduced the hardware costs. Therefore, this study proposes a lightweight wheat ear detection model, CML-RTDETR, for efficient and accurate detection of wheat ears in real complex farmland environments. In the model construction, the lightweight network CSPDarknet is firstly introduced as the backbone network of CML-RTDETR to enhance the feature extraction efficiency. In addition, the FM module is cleverly introduced to modify the bottleneck layer in the C2f component, and hybrid feature extraction is realized by spatial and frequency domain splicing to enhance the feature extraction capability of wheat to be tested in complex scenes. Secondly, to improve the model’s detection capability for targets of different scales, a multi-scale feature enhancement pyramid (MFEP) is designed, consisting of GHSDConv, for efficiently obtaining low-level detail information and CSPDWOK for constructing a multi-scale semantic fusion structure. Finally, channel pruning based on Layer-Adaptive Magnitude Pruning (LAMP) scoring is performed to reduce model parameters and runtime memory. The experimental results on the GWHD2021 dataset show that the AP 50 of CML-RTDETR reaches 90.5%, which is an improvement of 1.2% compared to the baseline RTDETR-R18 model. Meanwhile, the parameters and GFLOPs have been decreased to 11.03 M and 37.8 G, respectively, resulting in a reduction of 42% and 34%, respectively. Finally, the real-time frame rate reaches 73 fps, significantly achieving parameter simplification and speed improvement.

1. Introduction

Wheat (Triticum aestivum L.), as one of the most important food crops in the world [1,2], occupies a crucial position in our agricultural production and food security [3,4]. The formation of wheat yield in the field mainly depends on two key agronomic traits—the number of ears per unit area and the thousand grain weight [5,6]—of which the number of ears per unit area is the most decisive yield-constituting factor. Therefore, accurate counting of wheat ears in the field is of great theoretical and practical significance for dynamic monitoring of wheat growth, yield prediction and evaluation, and optimization of the breeding process.
In the traditional method of wheat spike detection and counting, manual surveying has long dominated the techniques employed [7,8,9]. However, there are many obvious drawbacks of manual surveying, such as low efficiency, making it difficult to ensure accurate results and introducing strong subjectivity to the prediction results; these factors make it difficult to meet the needs of modern agriculture for efficient and accurate wheat spike counting [10]. With the rapid development of computer technology, the method of counting wheat ears based on image processing and machine learning came into being, providing a new turnaround for the work of counting wheat ears. However, in practical applications, due to the complexity and variability of the field environment, there are large differences in the shape, color, and scale of wheat ears, which bring many challenges to the realization of high-throughput wheat ear detection and counting [3,11].
Satellite remote sensing technology, as a non-invasive monitoring approach, can efficiently obtain multi-spectral information of crops on a regional scale, providing data support for agricultural needs at different spatial and temporal resolutions, and it is increasingly widely used in the fields of fine crop management and yield modeling [12,13,14,15]. Many scholars have carried out in-depth research in this field and achieved remarkable results. For example, Wang et al. [16] proposed HyperSIGMA, a hyperspectral intelligent understanding model, to address the problems of weak cross-task generalization and poor cross-scene mobility in traditional hyperspectral image processing models, and they verified its excellent performance on multiple hyperspectral image datasets. Ileana et al. [17] combined remote sensing technology with the M5P model tree algorithm to estimate rapeseed oil yield. Chen et al. [18] used hyperspectral remote sensing technology to predict potato underground yield traits with the help of structural equation modeling, which provided a new method for precision agriculture. Zhao et al. [19] proposed a winter wheat extraction method based on multi-task learning and visual transformer for GF-2 remote sensing data, which effectively improves the accuracy of winter wheat extraction by fusing normalized vegetation index and surface temperature data. These research results have achieved remarkable results in agricultural crop characterization and promoted the development of precision agriculture. However, the application potential of satellite remote sensing in agricultural monitoring is constrained by its inherent technical limitations. Its low spatial resolution and temporal revisit frequency make it difficult to meet the demand for high spatial and temporal accuracy in fine agricultural management, which may lead to problems such as bias in characterization and identification during critical periods and difficulty in accurately counting important agronomic traits. In addition, the acquisition of multi-spectral information is highly dependent on favorable meteorological conditions [20,21], while wheat has large differences in individual morphology during the tasseling period, and the spatial distribution and visibility of wheat ears in the field change rapidly, which further reduce the feasibility of using multi-spectral data to achieve reliable and synchronized wheat ear counting. Therefore, the development of an efficient and automated high-throughput wheat spike counting technology has become a critical need to advance the wheat breeding process.
Visible light imaging systems carried by UAVs have received extensive attention in scientific research and engineering applications due to their significant advantages such as high mobility, high timeliness, and excellent spatial resolution [22,23,24,25,26]. With the continuous progress of computer vision technology, counting methods based on UAV images have gradually been applied in the automatic counting of various crops. At present, the mainstream counting methods are mainly categorized into two types: the rectangular box style detection model and the dense counting model based on density regression [27]. Among them, the dense counting model based on density regression shows better performance in handling the counting task in dense situations. However, the method can only output the numerical results of counting, and it cannot obtain the specific coordinates and location information of the target through the detection box as in the detection model, which limits its application in precision agriculture to a certain extent [28,29]. Therefore, the method based on detection counting has gradually become a research hotspot in precision agriculture. Numerous scholars have carried out in-depth research in this field and achieved fruitful results. For example, Lin et al. [30] used a new cascaded convolutional neural network to extract regions of interest from visible and multi-spectral images acquired by unmanned aerial systems, and they realized the detection and counting of grain ears under different field conditions. Guo et al. [31] proposed a deep learning algorithm based on natural image segmentation for automatically calculating the fruiting rate in response to the problem of spatial overlapping of rice grains that makes counting difficult. Li et al. [28] proposed a lightweight wheat ear detection model called RT-WEDT, which aims to improve the accuracy and efficiency of wheat ear detection and counting in a complex farmland environment. To enhance the model’s representation ability in complex agricultural scenarios, researchers have also introduced the attention mechanism as a core enhancement method: Firozeh [32] et al. used data rebalancing and the YOLOv8-SE attention module to solve the class imbalance and small-target problems in tomato flower/fruit/bud detection. Yan [33] et al., based on improved YOLOv11 (APYOLO) and DeepSORT, combined MSCA attention and EnMPDIoU loss to achieve apple detection and yield estimation in occluded and overlapping environments.
Although the above methods have shown good performance in detecting and counting various crops, in the actual field environment, due to the differences in the growth patterns of different wheat ears and the influence of factors such as wind and light, the wheat ear images often have problems such as occlusion and sticking, inconsistent scale, and being difficult to distinguish from the background, which bring great challenges to the work of counting wheat ears [34,35]. Previous studies have specifically conducted empirical exploration in dense occlusion scenarios: They proposed AO-DETR, introduced category-to-category one-to-one matching (CSA) and forward dense anchor boxes (LFDs) into the DETR-DINO framework, significantly alleviating the feature coupling and edge blurring caused by overlapping X-ray contraband features [36], as well as the lightweight YOLO-PDGT algorithm based on YOLOv8—under the synergy of a simplified neck, accelerated convolution, and enhanced small-target detection ability through triplet attention, achieving real-time detection and counting of unripe pomegranates [37]. In view of this, this study has proposed an innovative approach. First, hybrid feature extraction is realized by splicing the spatial and frequency domains, which improves the feature extraction capability of the target in the complex background. Second, the GHSDConv and CSPDWOK structures are designed to construct the multi-scale sequence feature fusion module MFEP, which aims to improve the model’s detection capability for targets of different scales. Finally, considering the growing demand for high accuracy and fast response in precision agriculture and the realistic need to reduce the hardware cost, this study adopts the channel pruning technique based on Layer-Adaptive Magnitude Pruning (LAMP) scoring based on a lightweight backbone network in order to reduce the model parameters and runtime memory. The main innovations of this paper are as follows:
(1) The FM module is introduced to transform the bottleneck layer in C2f to realize hybrid feature extraction by splicing spatial and frequency domains, which significantly improves the feature extraction capability of wheat to be tested in complex scenes.
(2) The multi-scale feature enhancement pyramid (MFEP) is designed by combining GHSDConv, which is used to efficiently obtain low-level detail information, and CSPDWOK, which constructs a multi-scale semantic fusion structure. This improves the model’s ability to detect targets at different scales while balancing the expression of small-target details and the context modeling of large targets.
(3) The channel pruning technique based on LAMP scoring is adopted to reduce the model parameters and runtime memory and realize the lightweight characteristic of the model under the premise of guaranteeing the model’s performance, which reduces the hardware cost and meets the demands of precision agriculture for high accuracy and fast responsiveness.

2. Dataset

In this paper, the 2021 version of the global wheat head detection (GWHD) [38] dataset was used as the training dataset for the model. The dataset consists of 6422 wheat head images (JPG format) taken in Asia, North America, Europe, and Oceania, and it contains 275,187 bounding box labels. It covers 60+ wheat varieties (including spring-type, winter-type, local varieties, and modern high-yield varieties). Samples were taken throughout the growth period from the time of wheat head emergence to the complete ripening stage, ensuring that the dataset contains different head shapes, colors, and densities. The imaging conditions were classified according to weather and light conditions: 45% for sunny days, 38% for cloudy days, and 17% for backlighting. This ensures the diversity of scenes and environments. The image specifications include a resolution of 1024 × 1024 pixels taken from heights ranging from 1.8 m to 3 m.
The global wheat sheaf dataset is rich in genetic and environmental diversity, which makes it ideal for use as a source of training data for neural networks and helps to improve the accuracy of wheat sheaf detection. According to the principle of machine learning data partitioning, if the dataset bounding box is in the order of 10 4 , considering that a larger validation set can provide more samples for the evaluation of the model configurations and thus be more conducive to the adjustment of the optimal parameters in training, the global wheat sheaf dataset was randomly partitioned into a training set, a validation set, and a test set in the ratio of 7:2:1.
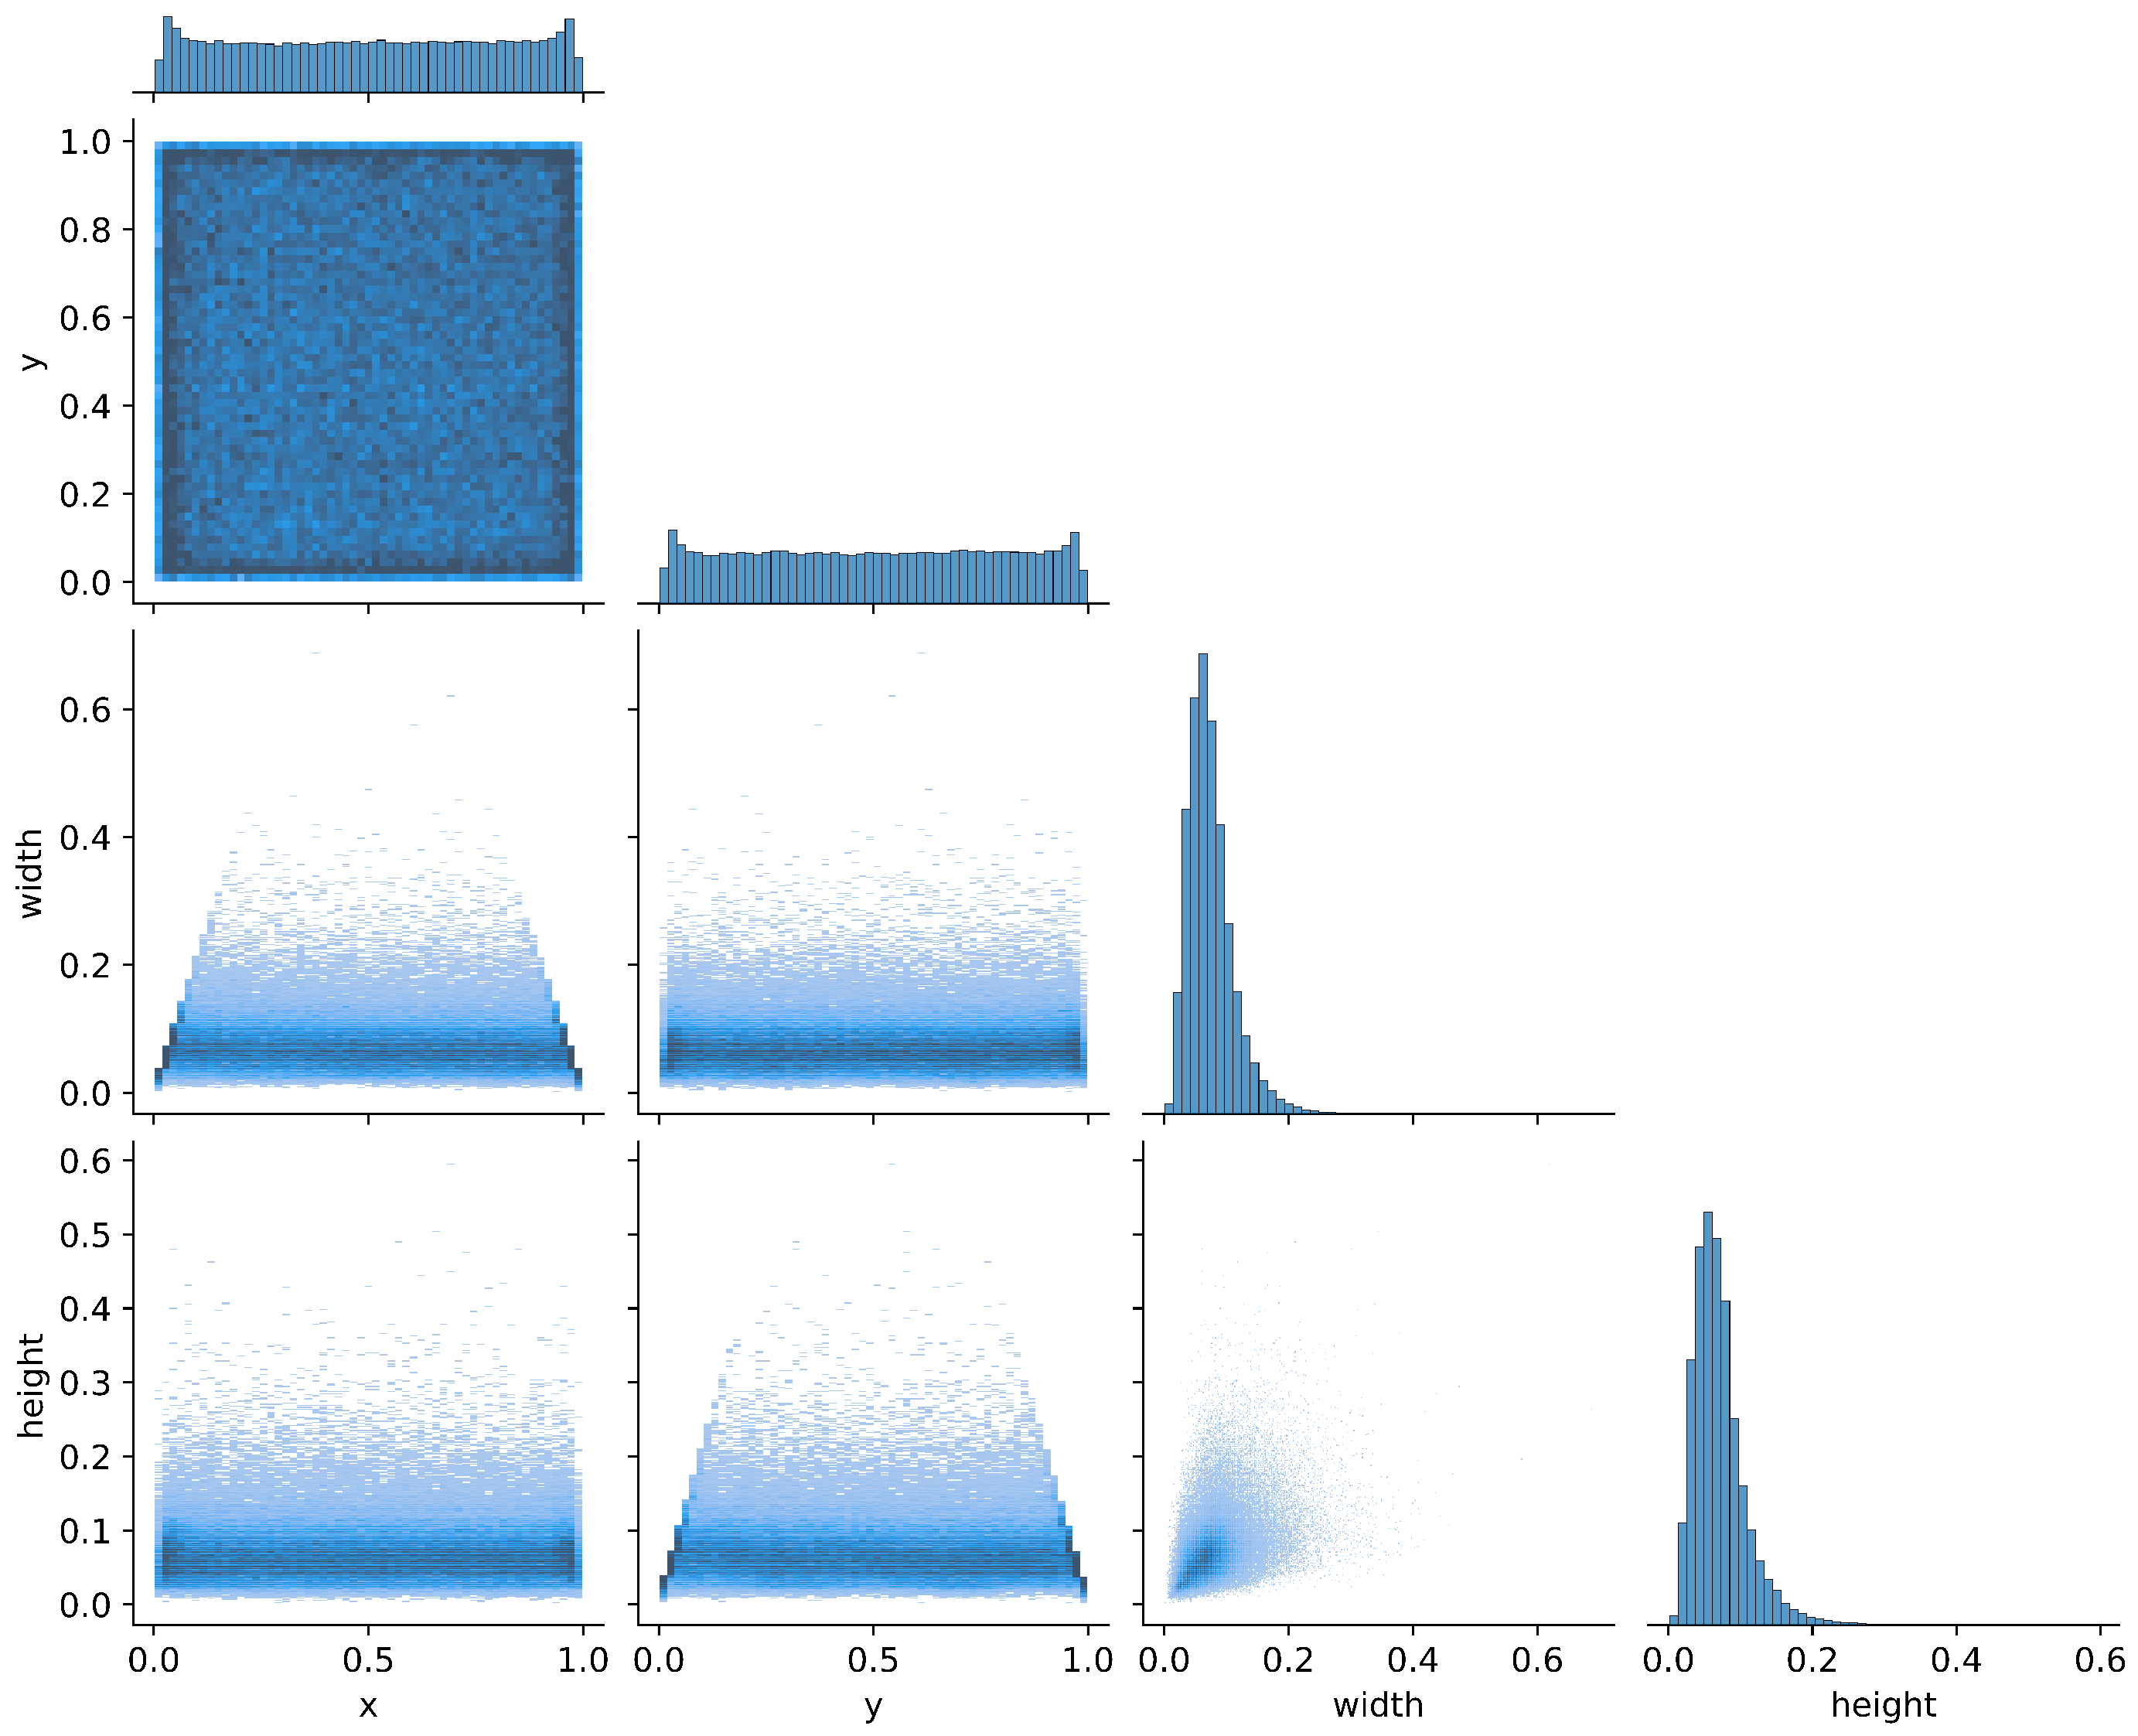
Figure 1 illustrates the distribution of the center points (x, y), widths, and heights of the rectangular boxes. The center points (x, y) are relatively uniformly distributed across the image, indicating a lack of distinct target concentration areas and a more dispersed distribution. The widths and heights are predominantly concentrated within smaller numerical ranges, with the heights exhibiting a near-normal distribution around a mean value, while the widths have a broader distribution but are still predominantly small. This suggests that the dataset contains targets of varying sizes, with most being relatively small and randomly positioned without significant spatial clustering.

3. Methods

3.1. RT-DETR Network

Detection Transformer (DETR) is the first deep learning model to apply the Transformer architecture to the field of object detection. It reframes the task as a sequence prediction problem, drawing inspiration from the Transformer’s encoder–decoder structure and bipartite graph-based matching strategy, while abandoning the non-maximum suppression (NMS) post-processing step. Compared to the YOLO series of algorithms that incorporate NMS post-processing, DETR not only offers lower optimization complexity but also offers greater robustness. However, it suffers from issues such as a large number of parameters and slow convergence, making it challenging to achieve good real-time detection performance in complex tasks. RT-DETR is a novel real-time end-to-end object detection model developed based on DETR. Compared to the YOLO series, it has stronger global feature modeling capabilities that can effectively capture the relationships between objects. In complex scenarios such as detecting closely arranged wheat targets, it demonstrates stronger robustness and better detection performance.
As shown in Figure 2, the RT-DETR architecture mainly consists of three parts: a backbone network, a hybrid encoder, and a decoder. The backbone network uses a convolutional neural network to extract three output features of different scales, namely, 8, 16, and 32.The hybrid encoder decouples intra-scale interactions and cross-scale fusion to effectively process multi-scale features, with the features from the last three layers S3, S4, and S5 serving as encoder inputs. Specifically, the Attention-based Intra-scale Feature Interaction (AIFI) module is used to process high-level features, reducing computational load and improving speed without compromising performance. Meanwhile, the Cross-scale Feature Fusion Module (CCFM) based on convolutional neural networks is employed for multi-scale integration and interaction, converting multi-scale features into a sequence representation of image features. The decoder employs a multi-layer Transformer denoising decoder, which obtains initial object queries from an IoU-aware query selection mechanism and iteratively optimizes them. This mechanism dynamically adjusts queries based on the IoU metric to focus on regions most relevant to the detected targets, improving the quality of bidirectional matching samples and accelerating training convergence. Additionally, it allows for flexible adjustment of the inference speed by changing the number of decoder layers, without the need for retraining. In summary, the RT-DETR model holds great potential for development in the field of object detection in agriculture and complex scenarios.

3.2. General Architecture of the CML-RTDETR Model

The RT-DETR has demonstrated high performance in wheat ear detection. However, in complex agricultural environments, wheat plants vary greatly in size, have similar colors to the background, and ears often overlap, posing challenges for detection. To address this issue, we designed the CML-RTDETR model based on the RT-DETR, which includes a backbone network and multi-scale feature enhancement module. First, we introduce the lightweight network CSPDarknet as the backbone network to effectively improve feature extraction efficiency and reduce computational complexity. Second, we explain how we modified the bottleneck layer in C2f using the FM module and thus could achieve hybrid feature extraction through spatial and frequency domain concatenation, thereby enhancing the feature extraction capabilities for wheat in complex scenes. Third, to balance the expression of small-target details and the contextual modeling of large targets, we detail the design of a multi-scale feature enhancement pyramid (MFEP) composed of GHSDConv for efficiently obtaining low-level detail information and CSPDWOK for constructing a multi-scale semantic fusion structure, thereby improving the model’s detection capability for targets of different scales. Furthermore, a loss function, CML_loss, was designed the model for dense small-object detection in scenes with overlapping and occluded objects to mitigate the missing detection box problem caused by overlapping and occlusion. Finally, channel pruning is performed based on Layer-wise Adaptive Amplitude Pruning (LAMP) scoring to reduce model parameters and runtime memory. Figure 3 illustrates the overall structure of the CML-RTDETR network.

3.3. Backbone Network

3.3.1. CSPDarknet Backbone Network

The selection of an appropriate backbone network is particularly important in RT-DETR-based wheat detection research. The initial official RT-DETR model uses the HGNetV2 [39] as the backbone feature extraction network, which is not powerful enough in multi-scale feature fusion and is limited in terms of network depth and width for small-target detection, sacrificing certain feature extraction capability and accuracy. Therefore, this paper replaces the backbone network with CSPDarknet in YOLOv8, the core of which lies in the use of the cross-stage partial network (CSP) structure, which effectively reduces the amount of computation and improves the learning ability of the network. The specific CSPDarknet structure is shown in Figure 4. CSPDarknet is capable of extracting richer features through a more effective feature transfer and fusion mechanism, which allows for more accurate identification and localization of wheat.

3.3.2. C2f-FM Module

The global wheat dataset is usually characterized by the difficulties in distinguishing wheat from the background in complex backgrounds, large scale differences in the wheat to be tested, strong irregularities, and the presence of many small targets. The C2f structure retains the rich gradient information through the multi-residual connection, but when dealing with highly complex and textured images, its traditional bottleneck structure is limited by the local spatial domain convolution. The traditional bottleneck structure is limited by the limited sensory field of the local spatial domain convolution, which makes it difficult to effectively capture global high-frequency features and low-frequency semantic information. For this reason, this paper proposes a novel Fused Fourier Convolution Mixer (FM) module, which replaces the bottleneck structure in the original C2f, and constructs the C2f-FM module. Gao et al. proposed the Fused Fourier Convolution Mixer (FM) module for efficient global modeling by transforming the spatial domain features to the frequency domain using the discrete Fourier transform (DFT). The method not only retains the global feature perception capability but also avoids the high computational overhead in the self-attention mechanism. Since the background of the field wheat and the object to be measured have significant and stable feature distributions in the frequency domain, they have more obvious differences. The FM module deeply integrates the Fast Fourier Transform (FFT) with the hybrid convolution mechanism in the frequency domain–space domain, aiming to enhance the multi-scale feature characterization capability in complex scenes through the synergistic optimization of the global modeling in the frequency domain and the local feature enhancement. The right side of Figure 4 illustrates the basic principle of C2f-FM. Inspired by the FM module, in order to achieve deep perception of global feature information, as well as a more efficient network model and to reduce the amount of floating-point calculations, the FM module is integrated with the Fourier convolution mixer and C2f. Through spatial domain and frequency domain splicing to realize hybrid feature extraction to enhance the feature extraction ability of wheat to be tested in complex scenes, its specific processing flow is as follows.
Given the input feature map X R C × H × W , it is first mapped to the frequency domain by FFT as follows:
F ( X ) = FFT ( X ) C C × H × W
where F denotes the Fourier transform operation.
In the frequency domain, a learnable complex convolution kernel K freq C C × C × k × k is designed for cross-channel feature blending as follows:
F ( Y ) = F ( X ) K freq + F ( b )
where ⊙ denotes frequency domain complex multiplication, and b is the bias term.
The frequency domain features F ( Y ) are recovered to the spatial domain by the Inverse Fast Fourier transform (iFFT) and gated fusion with the original input as follows:
Y spatial = Conv 3 × 3 ( X )
G = σ ( Conv 1 × 1 ( iFFT ( F ( Y ) ) ) )
Y fused = G Y spatial + ( 1 G ) iFFT ( F ( Y ) )
where σ is the sigmoid function, and ⊗ denotes channel-by-channel multiplication. The gating coefficients G [ 0 , 1 ] C × H × W dynamically adjust the contribution weights of the frequency domain and spatial features.
In order to reduce the complexity of the traditional frequency domain convolution O ( N 2 ) , the FM adopts the chunked frequency domain processing strategy defined as follows:
Complexity = C · H p · W p · ( p log p )
where p is the chunk size (default 16 × 16).

3.4. Neck Network

3.4.1. Multi-Scale Feature Enhancement Pyramid

In the complex scenario of monitoring wheat in farmland, variations in light conditions, differences in planting density, and different growth stages jointly result in a significant size variation of wheat ears. Therefore, enhancing the model’s ability to detect multi-scale wheat ears is the key to achieving high-precision recognition. Although traditional feature pyramids can alleviate the scale differences to some extent, their lack of deep-level details or rough fusion strategies makes it difficult to simultaneously balance the fine representation of small targets and the context modeling of large targets, thereby limiting further improvement of multi-scale detection performance. To address this challenge, this paper designs a multi-scale feature enhancement pyramid (MFEP) in the neck network. By strengthening cross-layer feature interaction and detail retention, it significantly improves the model’s robustness to extreme scale changes. Its specific structure is shown in Figure 3.
This module is jointly composed of two core sub-modules: GHSDConv and CSPDWOK. The former efficiently extracts shallow details, and the latter accomplishes multi-scale semantic fusion. The collaboration of these two enhances the model’s ability to represent and discriminate different-scale wheat ears. Specifically, GHSDConv acts on the 1/4 resolution shallow feature P2, compressing spatial information losslessly to the channel dimension through a Space-to-Depth operation, generating low-redundancy channel features using Ghost convolution and then restoring the original resolution through Pixel-Shuffle. This allows it to output feature maps of the same scale as the main feature and that are rich in details, thereby retaining the complete information of small targets while reducing computational and memory costs; CSPDWOK, through three complementary receptive field paths of global dual-domain attention, deformable large kernel convolution, and 3 × 3 depth convolution, respectively captures long-range dependencies, medium–large-target structures, and local texture edges, and its complete lightweight fusion within the cross-stage partial framework effectively enhances the model’s ability to represent and discriminate wheat ears of different scales in complex scenes.

3.4.2. GHSDConv

In order to control the model’s computation while introducing shallow high-resolution features, this paper proposes a lightweight shallow feature compression module, GHSDConv, as shown in Figure 5. The module firstly performs a Space-to-Depth (SPD) operation on the high-resolution feature maps output from the second stage in the backbone network. The SPD operation rearranges the local structural information in the spatial dimension to the channel dimension so as to obtain the spatial scale matching with the deep features of the backbone without losing the detail information, which is conducive to the subsequent feature fusion. Subsequently, in order to reduce the redundancy of convolutional computation, a dual-stream GhostConv is used, which is a module that decouples the features into main paths and ghost paths, with the main paths firstly generating a portion of the main features through a small amount of standard convolution and the ghost paths generating the complementary features using depth-separable convolution; after fusion of the dual-stream paths, the later selects the 1 × 1 convolution kernel for applying standard convolutional operations to the rearranged tensor. The specific process can be expressed as
X s d = Space to Depth ( X ) = Concat ( X 00 , X 10 , X 01 , X 11 )
Among them,
X 00 = X [ : , : , 0 : : 2 , 0 : : 2 ] X 10 = X [ : , : , 1 : : 2 , 0 : : 2 ] X 01 = X [ : , : , 0 : : 2 , 1 : : 2 ] X 11 = X [ : , : , 1 : : 2 , 1 : : 2 ]
X main = SiLU BN Conv 1 × 1 X s d
X cheap = SiLU BN DWConv 3 × 3 X main
Y = Conv 1 × 1 Concat X main , X cheap

3.4.3. CSPDWOK

In order to enhance the model’s ability to express different sensory field features, this paper further designs a multi-path fusion structure—CSPDWOK—to fuse feature maps at different scales. The specific network structure is shown in Figure 6. The design of this module is inspired by the CSP structure, which splits the original channel into two paths, ok_branch and identity, and the data in the ok_branch path are processed by Depth-wise Separable Convolution (DSConv) and then transformed by OmniKernel; followng this, the data are spliced into two paths. The data are bipath-spliced and then passed through the Depth-wise Separable Convolution with SE attention. The OmniKernel structure incorporates global, large-scale, and local branches through a parallel three-branch design to model global, local, and medium-sense wild feature representations, respectively, and reduces resource overhead through a lightweight design. GlobalPath: Dual-domain attention is introduced to integrate spatial attention and channel attention to strengthen the model’s ability to model large-scale targets and the contextual semantics of the whole map. Large Kernel Path: The network adopts different shapes of large-scale DWConv (DepthwiseConv) convolution to enhance the model’s ability to model medium-scale structures. Small Path: The network extracts local detail features using point-by-point depth-wise convolution to enhance the model’s ability to represent small-target edge textures. The CSP structure is used in the ok_branch and identity splicing process, which effectively suppresses the problem of gradient vanishing and feature redundancy through partial passing of the feature channel with residual connection while further improving the computational efficiency of the model. The CSPDWOK module, as the core fusion component of the MFEP, makes the model capable of taking into account details and semantic expression when facing different scales of wheat targets and improving detection robustness through the parallel modeling of the information of multi-scale paths. The specific process can be expressed as
Y 1 = DConv ( X ) = SiLU BN X W dw ( 1 ) W pw ( 1 )
( Y ok , Y id ) = Split ( Y 1 ) = Y ok R ε C × H × W Y id R ( 1 ε ) C × H × W
Z ok = Ω ( Y ok ) = W out · ReLU k { 1 , 3 , 3 , 1 , 3 , 3 , 1 , 1 } Y ok W dw ( k ) + Γ FCA-SCA ( Y ok )
where
Γ FCA-SCA ( X ) = ReLU F 1 ( Φ fac F ( X ) ) FCA Φ sca
Φ fac = W fac · GAP ( X )
Φ sca = W sca · GAP ( X )
Y fuse = Concat ( Z ok , Y id ) R C × H × W
Z final = SE ( DW - PWConv ( Y fuse ) )
Z final = SiLU BN Y fuse W dw ( 2 ) W pw ( 2 ) σ W 2 δ W 1 GAP Y fuse
where the input features are X R C × H × W , and the channel segmentation scale is e ( 0 , 1 ) .

3.5. The Improved Loss Function

The GIoU loss function used by the RT-DETR solves the problem of a zero gradient when there is no intersection of the two objectives by introducing the minimum outer rectangle of the prediction frame and the true frame to obtain the weight of the prediction frame and the true frame in the region of the minimum outer rectangle [40]. However, there is a failure problem of GIoU loss in the case where the prediction frame completely covers the real frame. To solve this problem, we designed a new loss function of CML_loss function to speed up the fitting speed of the model to the positional relationship between the prediction frame and the ground truth frame, especially in the scenes involving dense small-target that appear to be overlapped and occluded, so as to achieve more accurate target localization. The computational process of CML_loss is greatly simplified and better solves the problem of loss function failure when the aspect ratio is the same, especially in scenes involving overlapping occlusion, so as to realize more accurate target localization. Specifically, we introduce the MPDIoU and innerIoU, and we combine them with the NGWD through weighting to construct the CML_loss. The formula of CML_loss is as follows:
L inner-MPDIoU = 1 MPDIoU + IoU innerIoU
C M L l o s s = α L inner-MPDIoU + ( 1 α ) N G W D ( N a N b )
where the Normalized Gaussian Wasserstein Distance (NGWD) is a new metric for calculating the similarity between boxes. It models boxes as Gaussian distributions and then uses the Wasserstein distance to measure the similarity between these two distributions, replacing the loU. The advantage of this distance is that even if two boxes do not overlap at all or overlap very little, it can still measure their similarity. In addition, the NGWD is insensitive to the scale of the target and is more stable for small targets. The formula for the NGWD Loss is as follows:
W 2 2 ( N a , N b ) = c x a , c y a , w a 2 , h a 2 T , c x b , c y b , w b 2 , h b 2 T 2 2
N G W D ( N a , N b ) = exp W 2 2 ( N a , N b ) C
The innerIoU dynamically adjusts the loss weights through an auxiliary box IoU, where high-IoU samples are accelerated and optimized using small auxiliary boxes, while low-IoU samples are adjusted in the opposite direction to prevent overfitting, thereby achieving adaptive regression.
The MPDIoU (Multi-Point Distance Intersection over Union) is an improved bounding box regression loss function. Its core lies in optimizing the positioning of bounding boxes by directly minimizing the distances between the predicted boxes and the real boxes at key points. It comprehensively considers the overlapping area, center point distance, and width–height deviation. Compared to traditional IoU series loss functions, its calculation process is simpler, and its performance is better. This method combines the IoU with a point distance penalty term. The formula is
M P D I o U = I o U ( x 1 p r d x 1 g t ) 2 + ( y 1 p r d y 1 g t ) 2 w 2 + h 2 ( x 2 p r d x 2 g t ) 2 + ( y 2 p r d y 2 g t ) 2 w 2 + h 2
where ( x 1 g t , y 1 g t ) , ( x 2 g t , y 2 g t ) are the coordinates of the ground truth bounding box, ( x 1 p r d , y 1 p r d ) and ( x 2 p r d , y 2 p r d ) are the predicted bounding box coordinates, and the values w , h are the width and height of the input image, respectively.

3.6. LAMP

Layer-Adaptive Magnitude Pruning (LAMP) achieves model lightweighting by quantifying the relative importance of channel weights. Its core lies in using mathematical modeling to measure the contribution of individual channels to feature extraction in the network. The LAMP score is defined as follows: For the weight tensor W of a layer in a neural network, when it is flattened into a one-dimensional vector and sorted by index (where index u corresponds to the weight W [ u ] , and for u < v , W [ u ] W [ v ] ), the LAMP score of the u-th weight is given by
score ( u ; W ) = ( W [ u ] ) 2 v u ( W [ v ] ) 2
Here, the denominator v u ( W [ v ] ) 2 represents the sum of squared magnitudes of all remaining connections in the same layer, and the numerator ( W [ u ] ) 2 represents the squared magnitude of the target connection’s weight.
The core principle of the LAMP pruning method is to calculate the LAMP score for the weights of each layer in a neural network. For a weight tensor of a certain layer, it is expanded into a one-dimensional vector and sorted by index. The ratio of each weight squared to the sum of the squares of the remaining weights in that layer is calculated. The lower the score, the more redundant the channel. This method uses a global pruning strategy to remove low-score channels while ensuring that each layer retains at least one valid connection to prevent layer collapse. It belongs to the category of structured pruning, which maintains the integrity of the network structure and avoids the issues of irregular connections and memory overhead caused by unstructured pruning. The specific algorithm flow is shown in Algorithm 1.
In the improved CML-RTDETR model, LAMP removes channels that contribute little to wheat spike feature extraction, reducing the number of model parameters and degree of computation while retaining high-weight channels related to key features such as spike morphology and texture. Combined with a fine-tuning mechanism for the pruned model, this approach achieves model lightweighting with only a slight loss in accuracy.
Algorithm 1 Channel pruning based on LAMP scores.
InputModel parameters before pruning, global pruning rate
1. Traverse all layers of the model to obtain the weight parameters of all convolutional layers
2. For each convolutional layer l:
Steps2.1. Extract the weight matrix W l of this layer and flatten it into a one-dimensional vector W ^ l
2.2. Calculate the square of each weight: W ^ l 2 = { w 2 | w W ^ l }
2.3. Sort the squares in descending order to obtain the sorted index idx
2.4. Calculate the sum of squares of all weights in this layer S = w W ^ l w 2
2.5. Calculate the LAMP score for each weight: score ( u ; W l ) = ( W ^ l [ idx [ u ] ] ) 2 i = u | W ^ l | 1 ( W ^ l [ idx [ i ] ] ) 2
3. Based on the pruning rate r, remove the r × number of channels with the lowest LAMP scores from each layer, ensuring at least one channel is retained in each layer.
4. Reconstruct the model structure after pruning, retaining the weights of the unpruned channels.
OutputThe pruned model parameters and structure.

4. Experimental Setting and Evaluation Metrics

4.1. Experimental Environment

The experiments in this paper were conducted on a computer with an Ubuntu operating system, equipped with an NVIDIA RTX 3090 GPU (24 GB of VRAM) and Intel (R) Xeon (R) Platinum 8358P CPU @ 2.60 GHz processor. The software utilized PyTorch 1.11.0, CUDA 11.3, and Python3.8 to realize the experiments. The training parameters were set as follows: the batch size was 16, the number of training rounds was 200, the learning rate was set to 0.0001, and the training process used the cosine annealing strategy and the AdamW optimizer, which remained unchanged in subsequent experiments.

4.2. Evaluation Metrics

In this paper, the standard COCOAP evaluation metrics were used to evaluate the model performance: AP 50 , AP 75 , AP 50 95 , AP S , AP M , and AP L . The AP is the area enclosed by the P-R curve, which is used to measure how good the model is at detecting a class. The formula for average precision is expressed as
A P = 0 1 P ( r ) d r
The IoU is the ratio of the intersection and concatenation of the predicted and real frames, and this ratio is used to measure the degree of overlap between the predicted and real frames. AP 50 and AP 75 denote the average accuracy values under the IoU thresholds of 0.50 and 0.75, respectively, and AP 50 95 denotes the average accuracy mean values under the IoU thresholds of 0.50–0.95 (with a step size of 0.05) for AP 50 and AP 75 . AP 50 95 denotes an overall generalization of the model accuracy, AP S denotes the value of AP 50 95 in the small-target range, AP M denotes the value of AP 50 95 in the medium-target range, and AP L denotes the value of AP 50 95 in the large-target range. In this paper, the parameter count (parameters) and the giga floating-point operations per second (GFLOPs) were used to measure the complexity of the model, and the frame rate (frames per second, FPS) was used to measure the real-time performance of the model.

5. Results and Analysis

5.1. Comparison Experiment

5.1.1. Detection Performance Evaluation

In order to compare the detection effect of this paper’s model with the current mainstream target detection models for wheat ears in the field, the classical CNN-based detection models Faster-RCNN [41], SSD [42], Centernet [43], and Retinanet [44]; lightweight CNN networks YOLOv8n [45], YOLOv10n [46], YOLOv11n [47], and YOLOv12n [48]; and the Transformer-based network model RT-DETR series were selected in this paper. Table 1 shows the results of the evaluation metrics of the CML-RTDETR model proposed in this paper compared against other mainstream target detection models on the global wheat dataset, from which it can be seen that the parameter size of the CML-RTDETR model is 11.03 M, GFLOPs is 37.8 G, AP 50 95 is 52.7%, AP 50 is 90.5%, and real-time frame rate is 73 fps.
Compared with the RT-DETR series models, the CML-RTDETR model demonstrates significant performance advantages in terms of parameter efficiency and real-time performance: Its parameter size is only 58% of the RTDETR-R18 model (18.95M) and 28% of the RTDETR-R50 model (40.01M), with GFLOPs reduced by 33% and 71%, respectively, compared to the aforementioned models. In terms of detection accuracy, the AP 50 of CML-RTDETR is 90.5%, putting it on par with RTDETR-R50. In terms of real-time performance, its real-time frame rate of 73 fps is significantly higher than the 54 fps of RTDETR-R34 and the 39 fps of RTDETR-R50, representing a 17.7% improvement compared to the baseline model RTDETR-R18. This meets real-time detection requirements while maintaining the same accuracy, thereby achieving parameter simplification and speed improvement.
A comparative analysis was conducted between CML-RTDETR and the YOLO series networks with lower parameter densities, YOLOv8n to YOLOv12n, primarily based on the actual deployment requirements of agricultural scenarios. The parameter ranges of these models are from 2.16 M to 2.86 M, with the GFLOPs ranging from 5.8 G to 8.1 G. By streamlining network depth and width, these models achieve extremely low computational overhead, making them naturally suited for resource-constrained scenarios such as drone inspections and edge devices, thereby effectively reducing hardware costs. Additionally, CML-RTDETR breaks through the traditional bottleneck where lightweight models struggle to balance parameter scale and detection accuracy: Despite having a parameter scale four to five times larger than the YOLO series nano versions, it employs optimization techniques such as the FM module’s frequency domain-to-spatial domain feature fusion mechanism and the MFEP’s multi-scale feature enhancement strategy. These result in significantly improved detection robustness in complex background interference and target overlap scenarios compared to the comparison models. CML-RTDETR achieved an AP 50 of 90.5%, outperforming YOLOv8n (90.0%),YOLOv10n (89.6%), YOLOv11n (89.7%), and YOLOv12n (89.9%) by 0.5%, 0.9%, 0.8%, and 0.6%, respectively.The small-object detection accuracy ( AP s ) was 19.0%, significantly better than the 15.5% of YOLOv12n and the 16.1% of YOLOv11n. It led by 2.5 to 3.5 percentage points, demonstrating significantly superior small-object perception capabilities in complex large-scale environments compared to the YOLO series networks with lower parameter density. The lightweight design of CML-RTDETR focuses on improving parameter utilization efficiency rather than simply minimizing parameter scale, achieving an optimal balance between complexity and detection accuracy compared to other models and thereby showcasing its strong comprehensive performance advantages.
In order to specifically visualize and hold the performance difference between different detection models in terms of detection, we performed wheat ear detection inspection on the GWHD dataset. Figure 7 shows the inspection details; the red rectangular boxes denote the model prediction boxes, the blue rectangular boxes denote the wheat ears missed by the model, and the white rectangular boxes denote the redundant detection boxes generated by the model. As can be seen from Figure 7, all CNN models exhibited false negatives, while the RT-DETR series showed varying degrees of false positives. These results are due to the similarity between wheat ears and the background in complex field environments, making them difficult to distinguish. The CML-RTDETR model proposed in this paper could fully extract information from the global features of images, achieving the best overall detection performance in the examples shown in the figure and demonstrating the superiority of the proposed algorithm. In summary, the performance improvement of CML-RTDETR is attributed to the precise selection of redundant channels by the LAMP technique and the efficient fusion of multi-scale features by the CSPDWOK module. This enables the model to maintain its global feature modeling capability while better adapting to the real-time detection requirements of field scenarios, fully demonstrating its application potential in agricultural high-throughput monitoring scenarios.

5.1.2. Accuracy Aalysis in Different Scenes

In order to deeply explore the influence of environmental factors on the detection accuracy of the model, this paper manually screened the wheat images under four typical field scenes, namely, complex background, blurring, strong illumination, and overlapping occlusion.
The original real images and predicted images of each scene are shown in Figure 8. From the local magnified areas, it can be seen that even in the case of complex background textures, the detection boxes output by the model are highly consistent with the manually annotated true values, with negligible differences. Under the conditions of motion blur and leaf occlusion, the target edges are weakened, the foreground–background discrimination decreases, the model shows a certain decline in performance, there are missed detections, and they are mainly concentrated on the targets partially occluded at the tip of the wheat ears. In the strong-light condition, the overexposed areas enhance the local contrast, and the model mistakenly identified the highlights as the contour of the wheat ears, resulting in redundant detection boxes. However, in general, in the face of the complex field environment under natural conditions, the model’s detection performance was not significantly affected, and it has certain generalization ability and robustness.

5.1.3. Counting Performance Analysis

In order to further evaluate the counting performance of the model proposed in this paper, we chose to compare its counting performance with some classic density estimation-based counting models (MCNN [49], CSRNet [50], and the TasselNet [51] series) and the new models in crop counting in recent years (such as RapeNet [52], RPNet [27], RiceNet [53], and CMRNet [54]). The mean absolute error (MAE), root mean absolute error (rMAE), root mean squared error (RMSE), and the coefficient of determination R 2 were used as evaluation metrics. Among them, the smaller the MAE value, the smaller the error between the real value and the predicted value. The smaller the RMSE value, the smaller the dispersion between the predicted value and the real value. R 2 represents the fitting degree of the trend line, and the closer it is to 1, the higher the fitting degree is. All models in the comparison experiments were trained and tested on the global wheat dataset, and the comparison results of the different methods are shown in Table 2. The fitting result graph of R 2 is shown in Figure 9.
The experimental results show that our proposed method yielded an 18% advantage over the current state-of-the-art density regression counting network in the core metric of the MAE. This performance difference mainly stems from the complex background textures and significant illumination variations in wheat ear images, which make it difficult for models based on density maps to obtain stable feature representations, thereby reducing their counting accuracy and robustness. In contrast, the model in this paper, through the collaborative effect of the FM module and MFEP, can more effectively capture target features in complex scenarios, suppress the negative impacts brought by background and illumination intensity changes, and thereby improve the overall counting performance.

5.2. Ablation Experiments

5.2.1. Hyperparametric Experiment

To explore the impact of optimizers on the performance of the baseline model RTDETR-R18, which served as the foundation for subsequent model improvements and training, hyperparametric experiments were conducted by comparing four optimizers: RAdam, Adam, NAdam, and AdamW. The results are presented in Table 3, covering key metrics such as parameters, GFLOPs, and various AP values.
As shown in Table 3, AdamW outperformed other optimizers, and the baseline model RTDETR-R18 performed best under AdamW, with an AP50−95 of 51.2%, an AP50 of 89.3%, and an AP75 of 52.1%, producing results that were significantly higher than the corresponding metrics of RAdam, Adam, and NAdam.The latter three methods performed relatively poorly, with their AP50−95 values ranging from 45.1% to 45.5% and AP50 values ranging from 86.2% to 86.8%.
This sensitivity analysis of the optimizer hyperparameter demonstrates that the performance of RTDETR-R18 varies significantly with different optimizers. It reveals the model’s sensitivity to this hyperparameter, providing valuable insights for selecting the optimal optimizer in subsequent improvements and training to ensure robust performance.

5.2.2. Backbone Network Ablation Experiment

To validate the effectiveness of the proposed improved CSPDarknet backbone network, representative backbone networks were selected, including CNN-based HGNetV2, Fasternet [55], MobilenetV4 [56], and ConvNextv2 [57], as well as Transformer-based EfficientViT [58], EfficientFormerv2 [59], and Swin-Transformer [60], to replace the original backbone of RT-DETR for comparison experiments. The experimental results are shown in Table 4. As can be seen from Table 4, although the improved CSPDarknet backbone network designed in this paper has a slightly higher parameter count and computational complexity compared to lightweight backbone networks such as Fasternet and EfficientViT, it achieved significant improvements in all accuracy metrics. Its AP50-95 reached 52.2%, higher than all other backbone networks, with its AP50 at 90.2% and its AP75 at 53.7%. It also achieved the best performance in small-object detection accuracy ( AP S ), medium-object detection accuracy ( AP M ), and large-object detection accuracy ( AP L ). When compared to the Transformer-based Swin-Transformer, although Swin-Transformer achieved similar performance on some metrics, the improved CSPDarknet has a parameter count of only 15.79 M, significantly lower than Swin-Transformer’s 34.63 M, and a computational complexity of 50.5 G, far smaller than Swin-Transformer’s 97.0 G. This results in significantly reduced computational costs while maintaining higher accuracy. In summary, the improved CSPDarknet achieves the optimal balance between complexity and detection accuracy compared to other state-of-the-art methods.

5.2.3. Network Ablation Experiment

In this paper, 631 wheat ears images selected from the global wheat ears dataset were used as the test set for backbone network ablation experiments, and the proposed modules were added one by one to verify the impact of the proposed modules on the performance of the model. Table 5 shows the test results of adding each module. A, B, C, and D represent the four modules—improved CSPDarknet, MFEP, CML_loss, and LAMP, respectively.
As can be seen from the table, after CML-RTDETR improved the original backbone network of RTDETR-improved CSPDarknet, the AP 50 and AP 50 95 results increased by 0.9 and 1.0 percentage points, respectively, and the model’s overall number of parameters and floating-point arithmetic were reduced by 16% and 11%. On this basis, the number of parameters only increased by 0.32 M after adding the multi-scale feature enhancement pyramid, but the AP 50 and AP 50 95 improved by 0.3 and 0.5 percentage points, respectively. In addition, there was a 0.6 percentage point improvement in the detection accuracy metrics for the AP S on small targets, a 0.5 percentage point improvement in the AP M on medium targets, and a 1.2 percentage point improvement in the AP L on large targets, which verifies that the multi-scale feature enhancement pyramid proposed in this paper can improve the model’s detection ability on wheat targets of different scales. After replacing the CML_loss function, the AP 50 and small-target AP S were improved by 0.1 and 0.9 percentage points, respectively, while the number of parameters was kept constant. Since the model in this paper considered the loss in accuracy for small targets after lightweighting, the final model improved the detection accuracy index AP 50 by 1.2 percentage points to 90.5% and the AP 50 95 by 1.5 percentage points while reducing the number of parameters in the model. These results prove the effectiveness of the improved module in this paper. In order to verify the effectiveness of the improved module more intuitively, this paper utilized a heat map to embody the network’s ability to capture the target features of wheat ears, gradually adding each module adopted in this paper under the benchmark of RT-DETR and comparing the results with the original RT-DETR. The experimental results in Figure 10 show that the original RT-DETR focuses attention on wheat ears, the wheat ear pole diameter, and part of the background, whereas the CML-RTDETR favors attention more toward wheat ears and reduces the degree of attention on the background and wheat ear pole diameter.

5.2.4. Loss Function Ablation Experiment

In order to explore the effect of the NGWD and L inner-MPDIoU weighting on the performance of the RT-DETR model, this paper conducted seven sets of experiments with different weight values ranging from 0 to 1. The results of the experiments are shown in Table 6. By comparing the training effect under different weights, the effect of L inner-MPDIoU and NGWD on the model performance could be analyzed.
From the experimental results in the table, it can be seen that even without introducing the loss function we designed, this model was still able to maintain a high level of focus on the target area; however, when encountering background occlusion areas, there were cases where the model incorrectly identified the occlusion areas as the target areas. Different weight values were found to have different impacts on the performance of the model. When the weight value α of the loss functions of L inner-MPDIoU and NGWD is 0.8, the performance of the model reaches its peak. Under this configuration, the model takes into account the needs of small-target detection and multi-scale target detection; the detection accuracy of each category was improved, and the AP50 reached the highest value of 90.6. As can be seen from Figure 11, under this configuration, the model paid the closest attention to the target, and the interference from the background was the least. Therefore, in this paper, the weight value α of 0.8 was used to combine these loss functions to obtain the best model performance.

5.2.5. Model Pruning Rate Ablation Experiment

According to the ablation experiments and heat maps, the CML-RTDETR detection accuracy has been improved, but the model has redundant parameters. Therefore, a pruning operation based on the LAMP score was used to compress the model. During pruning, some output layers could not be pruned, so we used a skip-layer operation to prune the network and adjusted different pruning rates (the final model GFLOPs as a proportion of the original model) to achieve different degrees of pruning. In order to further explore the impact of pruning operations on model efficiency while ensuring detection accuracy, we conducted ablation experiments with different pruning rates (defined as the ratio of the final model’s GFLOPs to the original model’s GFLOPs) and comprehensively evaluated the changes in key metrics such as parameters, computational complexity, detection accuracy, and real-time performance.
Table 7 shows the changes in the performance metrics under different pruning rates. It can be observed from the experimental data that as the pruning rate increased, the number of parameters and GFLOPs of the model showed a decreasing trend, which is consistent with the expectation of model lightweighting. Notably, the real-time performance (fps) of the model presented a non-linear variation: It increased from 56 fps of the base model to the highest 73 fps when the pruning rate was 1.4 and then decreased slightly with the further increase in the pruning rate. This indicates that an appropriate pruning rate can effectively reduce redundant computations and improve the inference speed, but excessive pruning may damage the integrity of the network structure, leading to a slight decline in real-time performance. In terms of detection accuracy, when the pruning rate was 1.2 and 1.4, key metrics such as AP 50 95 ), AP 50 , and AP S remained basically stable compared to the base model, with no significant loss. However, when the pruning rate reached 1.6 and above, indicators like AP 50 and AP S showed a noticeable decline, which may be due to the excessive removal of channels related to important feature extraction, affecting the model’s ability to capture target information. Furthermore, as shown in Figure 12, analyzing the changes in the number of channels in each layer of the network before and after pruning, the proportion of output channels decreased with increasing pruning rate, while the backbone network (layer indices 1 to 8) showed no significant changes. This indicates that the shallow layers have low redundancy, while the deep layers exhibit more parameter redundancy, and pruning can remove these redundant parameters without significantly affecting the overall network performance.
Comprehensively considering the balance between detection accuracy and lightweight performance, especially the significant improvement in real-time performance (73 fps) at a pruning rate of 1.4 while maintaining high accuracy, this pruning rate was selected as the optimal choice for the final model. This ensures that the model can meet the requirements of real-time detection in complex farmland scenarios while maintaining accurate wheat ear detection and counting capabilities, laying a solid foundation for its practical application in agricultural high-throughput monitoring.

6. Conclusions

In order to realize accurate detection of wheat and facilitate the subsequent realization of lightweight accurate counting of wheat, this paper proposes an improved wheat detection and counting model based on RT-DETR, and the main conclusions are as follows: The lightweight network CSPDarknet was adopted as the backbone network of RT-DETR to improve the feature extraction efficiency, and the FM module was introduced to modify the bottleneck in C2f to realize hybrid feature extraction through spatial and frequency domain splicing to improve the feature extraction capability of wheat to be tested in complex scenes. Second, the GHSDConv and CSPDWOK structures were designed to construct the multi-scale sequence feature fusion module MFEP, which aims to improve the model’s detection capability for targets of different scales. In addition, a loss function named CML_loss has been created specifically for dense small-object detection in scenes with overlapping and occluded objects. It aims to mitigate the missing detection box problem caused by overlapping and occlusion. Finally, channel pruning based on LAMP scoring was performed to reduce the model parameters and runtime memory. The accuracy AP 50 of the improved model reached 90.5, and the AP 50 95 , AP 75 , AP S , AP M , and AP L were improved by 1.5%, 2.1%, 3.6%, 1.4%, and 1.9% over the initial values. Comparing the more advantageous lightweight CNN networks in recent years, the AP 50 results of CML-RTDETR were 0.5 and 0.9 percentage points higher than YOLOv8n, and YOLO10n, respectively. Compared with the classical Retinanet and CenterNet, the AP 50 was 6.0 percentage points and 2.8 percentage points higher, respectively. Since models such as the CNN lack shallow feature maps to recognize localized small-target wheat ears, and CML-RTDETR obtains multi-scale fusion features through GHSDConv, the detection accuracy AP S values of most CNN models were much lower than that of CML-DETR on small targets. Compared with the Transfomer-based RT-DETR series, the number of parameter of the model proposed in this paper is only a half of theirs, which has a large advantage in terms of parameters and is equal to them in terms of AP 50 metrics.
However, the actual field environment is much more complex: The diversity in morphology and texture brought about by variety differences, as well as the significant fluctuations in resolution caused by differences in collection equipment and shooting distance, all significantly reduce the robustness and generalization ability of the model. In the future, we will do the following: carry out systematic evaluations on an expanded dataset covering multiple varieties, multiple resolutions, and multiple climate zones to quantify the specific impacts of these factors on the detection performance and design and implement an adaptive illumination normalization module to suppress the illumination disturbances caused by strong light, shadows, and color bias, further improving the stability and accuracy of the model in complex lighting conditions.

Author Contributions

Conceptualization, Y.F.; Methodology, Y.F.; Software, Y.F.; Validation, C.Y. and C.Z.; Formal analysis, C.Y.; Resources, C.Z. and J.L.; Data curation, H.J., J.T. and J.L.; Writing—original draft, Y.F.; Writing—review and editing, Y.F. and J.L.; Visualization, J.L.; Supervision, H.J. and J.L.; Project administration, J.T. and J.L.; Funding acquisition, J.L. All authors have read and agreed to the published version of the manuscript.

Funding

This research was funded by the Major scientific and technological project of Shenzhen (No. KJZD 20230923114611023), and the National Natural Science Foundation of China (No. 42301515).

Data Availability Statement

Data are contained within the article.

Conflicts of Interest

The authors declare no conflicts of interest.

References

  1. Ren, W.; Chen, L. Unravelling the Dynamic Physiological and Metabolome Responses of Wheat (Triticum aestivum L.) to Saline–Alkaline Stress at the Seedling Stage. Metabolites 2025, 15, 430. [Google Scholar] [CrossRef]
  2. Li, R.; Wu, Y. Improved YOLO v5 wheat ear detection algorithm based on attention mechanism. Electronics 2022, 11, 1673. [Google Scholar] [CrossRef]
  3. Wang, S.; Zhao, J.; Cai, Y.; Li, Y.; Qi, X.; Qiu, X.; Yao, X.; Tian, Y.; Zhu, Y.; Cao, W.; et al. A method for small-sized wheat seedlings detection: From annotation mode to model construction. Plant Methods 2024, 20, 15. [Google Scholar] [CrossRef] [PubMed]
  4. Zhou, M.; Zheng, H.; He, C.; Liu, P.; Awan, G.M.; Wang, X.; Cheng, T.; Zhu, Y.; Cao, W.; Yao, X. Wheat phenology detection with the methodology of classification based on the time-series UAV images. Field Crops Res. 2023, 292, 108798. [Google Scholar] [CrossRef]
  5. Hasan, M.M.; Chopin, J.P.; Laga, H.; Miklavcic, S.J. Detection and analysis of wheat spikes using convolutional neural networks. Plant Methods 2018, 14, 100. [Google Scholar] [CrossRef]
  6. Pan, Y.; Zhu, N.; Ding, L.; Li, X.; Goh, H.H.; Han, C.; Zhang, M. Identification and counting of sugarcane seedlings in the field using improved faster R-CNN. Remote Sens. 2022, 14, 5846. [Google Scholar] [CrossRef]
  7. Wu, W.; Zhong, X.; Lei, C.; Zhao, Y.; Liu, T.; Sun, C.; Guo, W.; Sun, T.; Liu, S. Sampling survey method of wheat ear number based on UAV images and density map regression algorithm. Remote Sens. 2023, 15, 1280. [Google Scholar] [CrossRef]
  8. Meng, X.; Li, C.; Li, J.; Li, X.; Guo, F.; Xiao, Z. Yolov7-ma: Improved yolov7-based wheat head detection and counting. Remote Sens. 2023, 15, 3770. [Google Scholar] [CrossRef]
  9. Zhang, R.; Yao, M.; Qiu, Z.; Zhang, L.; Li, W.; Shen, Y. Wheat Teacher: A One-Stage Anchor-Based Semi-Supervised Wheat Head Detector Utilizing Pseudo-Labeling and Consistency Regularization Methods. Agriculture 2024, 14, 327. [Google Scholar] [CrossRef]
  10. Qiu, Z.; Wang, F.; Li, T.; Liu, C.; Jin, X.; Qing, S.; Shi, Y.; Wu, Y.; Liu, C. LGWheatNet: A Lightweight Wheat Spike Detection Model Based on Multi-Scale Information Fusion. Plants 2025, 14, 1098. [Google Scholar] [CrossRef]
  11. Jin, Z.; Hong, W.; Wang, Y.; Jiang, C.; Zhang, B.; Sun, Z.; Liu, S.; Lv, C. A Transformer-Based Symmetric Diffusion Segmentation Network for Wheat Growth Monitoring and Yield Counting. Agriculture 2025, 15, 670. [Google Scholar] [CrossRef]
  12. Liu, T.; Li, P.; Zhao, F.; Liu, J.; Meng, R. Early-Stage Mapping of Winter Canola by Combining Sentinel-1 and Sentinel-2 Data in Jianghan Plain China. Remote Sens. 2024, 16, 3197. [Google Scholar] [CrossRef]
  13. d’Andrimont, R.; Taymans, M.; Lemoine, G.; Ceglar, A.; Yordanov, M.; van der Velde, M. Detecting flowering phenology in oil seed rape parcels with Sentinel-1 and-2 time series. Remote Sens. Environ. 2020, 239, 111660. [Google Scholar] [CrossRef]
  14. Ma, Q.; Liu, H.; Jin, Y.; Liu, X. Multi-Scale Context Enhancement Network with Local–Global Synergy Modeling Strategy for Semantic Segmentation on Remote Sensing Images. Electronics 2025, 14, 2526. [Google Scholar] [CrossRef]
  15. Chen, J.; Tian, X.; Du, C. DPCSANet: Dual-Path Convolutional Self-Attention for Small Ship Detection in Optical Remote Sensing Images. Electronics 2025, 14, 1225. [Google Scholar] [CrossRef]
  16. Wang, D.; Hu, M.; Jin, Y.; Miao, Y.; Yang, J.; Xu, Y.; Qin, X.; Ma, J.; Sun, L.; Li, C.; et al. Hypersigma: Hyperspectral intelligence comprehension foundation model. IEEE Trans. Pattern Anal. Mach. Intell. 2025, 47, 6427–6444. [Google Scholar] [CrossRef]
  17. Fallas Calderón, I.D.l.Á.; Heenkenda, M.K.; Sahota, T.S.; Serrano, L.S. Canola Yield Estimation Using Remotely Sensed Images and M5P Model Tree Algorithm. Remote Sens. 2025, 17, 2127. [Google Scholar] [CrossRef]
  18. Chen, W.; Huang, Y.; Tan, W.; Deng, Y.; Yang, C.; Zhu, X.; Shen, J.; Liu, N. Investigating the Mechanisms of Hyperspectral Remote Sensing for Belowground Yield Traits in Potato Plants. Remote Sens. 2025, 17, 2097. [Google Scholar] [CrossRef]
  19. Zhao, Z.; Liu, Z.; Luo, H.; Yang, H.; Wang, B.; Jiang, Y.; Liu, Y.; Wu, Y. GF-2 Remote Sensing-Based Winter Wheat Extraction With Multitask Learning Vision Transformer. IEEE J. Sel. Top. Appl. Earth Obs. Remote Sens. 2025, 18, 12454–12469. [Google Scholar] [CrossRef]
  20. Yu, J.; Zhang, Y.; Song, Z.; Jiang, D.; Guo, Y.; Liu, Y.; Chang, Q. Estimating leaf area index in apple orchard by UAV multispectral images with spectral and texture information. Remote Sens. 2024, 16, 3237. [Google Scholar] [CrossRef]
  21. Sári-Barnácz, F.E.; Zalai, M.; Milics, G.; Tóthné Kun, M.; Mészáros, J.; Árvai, M.; Kiss, J. Monitoring Helicoverpa armigera Damage with PRISMA Hyperspectral Imagery: First Experience in Maize and Comparison with Sentinel-2 Imagery. Remote Sens. 2024, 16, 3235. [Google Scholar] [CrossRef]
  22. Shi, Z.; Wang, L.; Yang, Z.; Li, J.; Cai, L.; Huang, Y.; Zhang, H.; Han, L. Unmanned Aerial Vehicle-Based Hyperspectral Imaging Integrated with a Data Cleaning Strategy for Detection of Corn Canopy Biomass, Chlorophyll, and Nitrogen Contents at Plant Scale. Remote Sens. 2025, 17, 895. [Google Scholar] [CrossRef]
  23. Yang, H.; Wu, J.; Lu, Y.; Huang, Y.; Yang, P.; Qian, Y. Lightweight Detection and Counting of Maize Tassels in UAV RGB Images. Remote Sens. 2024, 17, 3. [Google Scholar] [CrossRef]
  24. Shi, P.; Zhao, Z.; Fan, X.; Yan, X.; Yan, W.; Xin, Y. Remote sensing image object detection based on angle classification. IEEE Access 2021, 9, 118696–118707. [Google Scholar] [CrossRef]
  25. Tai, X.; Zhang, X. LMEC-YOLOv8: An Enhanced Object Detection Algorithm for UAV Imagery. Electronics 2025, 14, 2535. [Google Scholar] [CrossRef]
  26. Chen, D.; Chen, D.; Zhong, C.; Zhan, F. NSC-YOLOv8: A Small Target Detection Method for UAV-Acquired Images Based on Self-Adaptive Embedding. Electronics 2025, 14, 1548. [Google Scholar] [CrossRef]
  27. Bai, X.; Gu, S.; Liu, P.; Yang, A.; Cai, Z.; Wang, J.; Yao, J. Rpnet: Rice plant counting after tillering stage based on plant attention and multiple supervision network. Crop J. 2023, 11, 1586–1594. [Google Scholar] [CrossRef]
  28. Jie, L.; Zihao, Y.; Jiangwei, Q.; Jingmin, T. Method for detecting and counting wheat ears using RT-WEDT. Trans. Chin. Soc. Agric. Eng. 2024, 40, 146–156. [Google Scholar]
  29. Ji, Y.; Ma, T.; Shen, H.; Feng, H.; Zhang, Z.; Li, D.; He, Y. Transmission Line Defect Detection Algorithm Based on Improved YOLOv12. Electronics 2025, 14, 2432. [Google Scholar] [CrossRef]
  30. Lin, Z.; Guo, W. Sorghum panicle detection and counting using unmanned aerial system images and deep learning. Front. Plant Sci. 2020, 11, 534853. [Google Scholar] [CrossRef]
  31. Guo, Y.; Li, S.; Zhang, Z.; Li, Y.; Hu, Z.; Xin, D.; Chen, Q.; Wang, J.; Zhu, R. Automatic and accurate calculation of rice seed setting rate based on image segmentation and deep learning. Front. Plant Sci. 2021, 12, 770916. [Google Scholar] [CrossRef] [PubMed]
  32. Solimani, F.; Cardellicchio, A.; Dimauro, G.; Petrozza, A.; Summerer, S.; Cellini, F.; Renò, V. Optimizing tomato plant phenotyping detection: Boosting YOLOv8 architecture to tackle data complexity. Comput. Electron. Agric. 2024, 218, 108728. [Google Scholar] [CrossRef]
  33. Yan, Z.; Wu, Y.; Zhao, W.; Zhang, S.; Li, X. Research on an apple recognition and yield estimation model based on the fusion of improved YOLOv11 and DeepSORT. Agriculture 2025, 15, 765. [Google Scholar] [CrossRef]
  34. Zhu, J.; Yang, G.; Feng, X.; Li, X.; Fang, H.; Zhang, J.; Bai, X.; Tao, M.; He, Y. Detecting wheat heads from UAV low-altitude remote sensing images using Deep Learning based on transformer. Remote Sens. 2022, 14, 5141. [Google Scholar] [CrossRef]
  35. Zhang, D.Y.; Luo, H.S.; Cheng, T.; Li, W.F.; Zhou, X.G.; Gu, C.Y.; Diao, Z. Enhancing wheat Fusarium head blight detection using rotation Yolo wheat detection network and simple spatial attention network. Comput. Electron. Agric. 2023, 211, 107968. [Google Scholar] [CrossRef]
  36. Li, M.; Jia, T.; Wang, H.; Ma, B.; Lu, H.; Lin, S.; Cai, D.; Chen, D. Ao-detr: Anti-overlapping detr for x-ray prohibited items detection. IEEE Trans. Neural Netw. Learn. Syst. 2024, 36, 12076–12090. [Google Scholar] [CrossRef]
  37. Fan, Z.; Lu, D.; Liu, M.; Liu, Z.; Dong, Q.; Zou, H.; Hao, H.; Su, Y. YOLO-PDGT: A lightweight and efficient algorithm for unripe pomegranate detection and counting. Measurement 2025, 254, 117852. [Google Scholar] [CrossRef]
  38. David, E.; Serouart, M.; Smith, D.; Madec, S.; Velumani, K.; Liu, S.; Wang, X.; Pinto, F.; Shafiee, S.; Tahir, I.S.; et al. Global wheat head detection 2021: An improved dataset for benchmarking wheat head detection methods. Plant Phenomics 2021, 1, 1–9. [Google Scholar] [CrossRef]
  39. Zhao, Y.; Lv, W.; Xu, S.; Wei, J.; Wang, G.; Dang, Q.; Liu, Y.; Chen, J. Detrs beat yolos on real-time object detection. In Proceedings of the IEEE/CVF Conference on Computer Vision and Pattern Recognition, Seattle, WA, USA, 16–22 June 2024; pp. 16965–16974. [Google Scholar]
  40. Huang, Y.; Wang, X.; Liu, X.; Cai, L.; Feng, X.; Chen, X. A Lightweight Citrus Ripeness Detection Algorithm Based on Visual Saliency Priors and Improved RT-DETR. Agronomy 2025, 15, 1173. [Google Scholar] [CrossRef]
  41. Ren, S.; He, K.; Girshick, R.; Sun, J. Faster r-cnn: Towards real-time object detection with region proposal networks. IEEE Trans. Pattern Anal. Mach. Intell. 2016, 39, 1137–1149. [Google Scholar] [CrossRef] [PubMed]
  42. Liu, W.; Anguelov, D.; Erhan, D.; Szegedy, C.; Reed, S.; Fu, C.Y.; Berg, A.C. SSD: Single Shot MultiBox Detector. arXiv 2015, arXiv:1512.02325. [Google Scholar]
  43. Duan, K.; Bai, S.; Xie, L.; Qi, H.; Huang, Q.; Tian, Q. Centernet: Keypoint triplets for object detection. In Proceedings of the IEEE/CVF International Conference on Computer Vision, Seoul, Republic of Korea, 27 October–2 November 2019; pp. 6569–6578. [Google Scholar]
  44. Lin, T.Y.; Goyal, P.; Girshick, R.; He, K.; Dollár, P. Focal loss for dense object detection. In Proceedings of the IEEE International Conference on Computer Vision, Venice, Italy, 22–29 October 2017; pp. 2980–2988. [Google Scholar]
  45. Terven, J.; Córdova-Esparza, D.M.; Romero-González, J.A. A comprehensive review of yolo architectures in computer vision: From yolov1 to yolov8 and yolo-nas. Mach. Learn. Knowl. Extr. 2023, 5, 1680–1716. [Google Scholar] [CrossRef]
  46. Wang, A.; Chen, H.; Liu, L.; Chen, K.; Lin, Z.; Han, J. Yolov10: Real-time end-to-end object detection. Adv. Neural Inf. Process. Syst. 2024, 37, 107984–108011. [Google Scholar]
  47. Khanam, R.; Hussain, M. Yolov11: An overview of the key architectural enhancements. arXiv 2024, arXiv:2410.17725. [Google Scholar]
  48. Tian, Y.; Ye, Q.; Doermann, D. Yolov12: Attention-centric real-time object detectors. arXiv 2025, arXiv:2502.12524. [Google Scholar]
  49. Zhang, Y.; Zhou, D.; Chen, S.; Gao, S.; Ma, Y. Single-Image Crowd Counting via Multi-Column Convolutional Neural Network. In Proceedings of the IEEE Conference on Computer Vision and Pattern Recognition (CVPR), Las Vegas, NV, USA, 27–30 June 2016; pp. 589–597. [Google Scholar]
  50. Li, Y.; Zhang, X.; Chen, D. CSRNet: Dilated Convolutional Neural Networks for Understanding the Highly Congested Scenes. In Proceedings of the IEEE Conference on Computer Vision and Pattern Recognition (CVPR), Salt Lake City, UT, USA, 18–23 June 2018; pp. 1091–1100. [Google Scholar]
  51. Lu, H.; Cao, Z. TasselNetV2+: A fast implementation for high-throughput plant counting from high-resolution RGB imagery. Front. Plant Sci. 2020, 11, 541960. [Google Scholar] [CrossRef] [PubMed]
  52. Li, J.; Wang, E.; Qiao, J.; Li, Y.; Li, L.; Yao, J.; Liao, G. Automatic rape flower cluster counting method based on low-cost labelling and UAV-RGB images. Plant Methods 2023, 19, 40. [Google Scholar] [CrossRef] [PubMed]
  53. Bai, X.; Liu, P.; Cao, Z.; Lu, H.; Xiong, H.; Yang, A.; Cai, Z.; Wang, J.; Yao, J. Rice plant counting, locating, and sizing method based on high-throughput UAV RGB images. Plant Phenomics 2023, 5, 20. [Google Scholar] [CrossRef] [PubMed]
  54. Li, J.; Yang, C.; Zhu, C.; Qin, T.; Tu, J.; Wang, B.; Yao, J.; Qiao, J. CMRNet: An Automatic Rapeseed Counting and Localization Method Based on the CNN-Mamba Hybrid Model. IEEE J. Sel. Top. Appl. Earth Obs. Remote Sens. 2025, 1–18. [Google Scholar] [CrossRef]
  55. Chen, J.; Kao, S.h.; He, H.; Zhuo, W.; Wen, S.; Lee, C.H.; Chan, S.H.G. Run, don’t walk: Chasing higher FLOPS for faster neural networks. In Proceedings of the IEEE/CVF Conference on Computer Vision and Pattern Recognition, Vancouver, BC, Canada, 17–24 June 2023; pp. 12021–12031. [Google Scholar]
  56. Qin, D.; Leichner, C.; Delakis, M.; Fornoni, M.; Luo, S.; Yang, F.; Wang, W.; Banbury, C.; Ye, C.; Akin, B.; et al. MobileNetV4: Universal models for the mobile ecosystem. In Proceedings of the European Conference on Computer Vision, Milan, Italy, 29 September–4 October 2024; Springer: Cham, Switzerland, 2024; pp. 78–96. [Google Scholar]
  57. Woo, S.; Debnath, S.; Hu, R.; Chen, X.; Liu, Z.; Kweon, I.S.; Xie, S. Convnext v2: Co-designing and scaling convnets with masked autoencoders. In Proceedings of the IEEE/CVF Conference on Computer Vision and Pattern Recognition, Vancouver, BC, Canada, 17–24 June 2023; pp. 16133–16142. [Google Scholar]
  58. Liu, X.; Peng, H.; Zheng, N.; Yang, Y.; Hu, H.; Yuan, Y. Efficientvit: Memory efficient vision transformer with cascaded group attention. In Proceedings of the IEEE/CVF Conference on Computer Vision and Pattern Recognition, Vancouver, BC, Canada, 17–24 June 2023; pp. 14420–14430. [Google Scholar]
  59. Li, Y.; Hu, J.; Wen, Y.; Evangelidis, G.; Salahi, K.; Wang, Y.; Tulyakov, S.; Ren, J. Rethinking vision transformers for mobilenet size and speed. In Proceedings of the IEEE/CVF International Conference on Computer Vision, Paris, France, 1–6 October 2023; pp. 16889–16900. [Google Scholar]
  60. Liu, Z.; Lin, Y.; Cao, Y.; Hu, H.; Wei, Y.; Zhang, Z.; Lin, S.; Guo, B. Swin transformer: Hierarchical vision transformer using shifted windows. In Proceedings of the IEEE/CVF International Conference on Computer Vision, Montreal, QC, Canada, 10–17 October 2021; pp. 10012–10022. [Google Scholar]
Figure 1. The distribution of the center points (x, y), widths, and heights of the dataset.
Electronics 14 03051 g001
Figure 2. The network structure of the RT-DETR model.
Electronics 14 03051 g002
Figure 3. The network structure of the CML-RTDETR model.
Electronics 14 03051 g003
Figure 4. The structure of the CSPDarknet.
Electronics 14 03051 g004
Figure 5. The structure of GHSDConv module.
Electronics 14 03051 g005
Figure 6. The structure of CSPDWOK module.
Electronics 14 03051 g006
Figure 7. Comparison of the detection effect between this research scheme and mainstream models.
Electronics 14 03051 g007
Figure 8. The detection performance of the model in different scenarios.
Electronics 14 03051 g008
Figure 9. The coefficients of determination of CML-RTDETR.
Electronics 14 03051 g009
Figure 10. Heat maps of the ablation of each module.
Electronics 14 03051 g010
Figure 11. Heat maps under different weight loss functions.
Electronics 14 03051 g011
Figure 12. Comparison of model channel numbers under different pruning rates.
Electronics 14 03051 g012
Table 1. Comparison between this research program and mainstream model.
ModelParametersGFLOPs/G AP 50 95 /% AP 50 /% AP 75 /% AP S /% AP M /% AP L /%fps
Faster-RCNN26.98948.128.662.622.03.128.535.57
SSD22.52273.233.068.527.23.833.040.656
Centenet31.15109.749.687.750.513.449.358.650
Retinanet34.65163.546.484.545.811.146.055.753
YOLOv8n2.868.152.090.053.916.951.561.4118
YOLOv10n2.166.551.689.653.316.851.160.5110
YOLOv11n2.466.352.089.754.016.151.561.5112
YOLOv12n2.395.852.189.954.015.551.661.982
RTDETR-R1818.9556.951.289.352.116.450.661.062
RTDETR-R3429.6688.852.190.353.218.051.561.454
RTDETR-R50M34.5796.152.290.253.817.951.462.152
RTDETR-L30.50103.452.190.353.217.751.561.445
RTDETR-R5040.01129.552.390.553.519.251.562.139
CML-RTDETR11.0337.852.790.554.219.052.062.973
Bold values indicate statistically significant results.
Table 2. Performance comparison of different models.
ModelMAErMAERMSE R 2
MCNN13.213.6315.360.75
CSRNet10.353.2113.950.84
TasselNetV28.782.9611.150.89
RapeNet7.362.7110.450.91
RPNet5.912.438.190.92
RiceNet5.622.377.980.91
CMRNet3.271.805.370.93
CML-RTDETR2.751.664.750.95
Bold values indicate statistically significant results.
Table 3. Hyperparametric Experimental results of each optimizer.
OptimizerParametersGFLOPs/G AP 50 95 /% AP 50 /% AP 75 /% AP S /% AP M /% AP L /%
RAdam18.9556.945.586.443.013.045.453.2
Adam18.9556.945.186.241.913.044.952.0
NAdam18.9556.945.486.842.111.345.253.7
AdamW18.9556.951.289.352.116.450.661.0
Bold values indicate statistically significant results.
Table 4. Backbone network ablation experimental results of each improved module.
BackboneParametersGFLOPs/G AP 50 95 /% AP 50 /% AP 75 /% AP S /% AP M /% AP L /%
HGNetV218.9556.951.289.352.116.450.661.0
Fasternet10.3028.549.488.051.214.049.859.7
MobilenetV410.7839.549.487.849.613.448.759.7
Convnextv211.7331.950.588.751.214.049.861.6
EfficientViT10.2027.248.486.348.711.647.559.7
EfficientFormerv211.2529.451.589.352.615.250.861.7
Swin-Tranformer34.6397.051.489.452.516.150.961.2
Improved CSPDarknet15.7950.552.290.253.717.451.562.0
Bold values indicate statistically significant results.
Table 5. Network ablation experimental results of each improved module.
NameModelParametersGFLOPs/G AP 50 95 /% AP 50 /% AP 75 /% AP S /% AP M /% AP L /%
EXP1RTDETR18.9556.951.289.352.116.450.661.0
EXP2RTDETR+A15.7950.552.290.253.717.451.562.0
EXP3RTDETR+A+B16.1153.852.790.554.718.052.063.2
EXP4RTDETR+A+B+C16.1153.852.990.654.618.952.263.4
EXP5RTDETR+A+B+C+D11.0337.852.790.554.219.052.062.9
Bold values indicate statistically significant results.
Table 6. Experimental results of loss functions with different weights.
Name α ParametersGFLOPs/G AP 50 95 /% AP 50 /% AP 75 /% AP S /% AP M /% AP L /%
EXP 1-16.1153.852.790.554.718.052.063.2
EXP 2016.1153.852.890.654.618.652.162.8
EXP 30.216.1153.852.690.554.518.151.862.9
EXP 40.416.1153.852.690.454.718.251.763.1
EXP 50.616.1153.852.590.554.417.851.863.0
EXP 60.816.1153.852.990.654.618.952.263.4
EXP 71.016.1153.852.690.454.618.251.962.7
Bold values indicate statistically significant results.
Table 7. Performance of the model with different pruning rates.
Pruning RateParametersGFLOPs/G AP 50 95 /% AP 50 /% AP 75 /% AP S /% AP M /% AP L /%fps
base16.1153.852.990.654.618.952.263.456
1.212.1243.752.790.554.418.852.062.962
1.411.0337.852.790.554.219.052.062.973
1.610.2932.752.390.453.418.451.562.170
1.89.8429.451.789.652.617.151.161.668
2.09.2725.350.789.151.415.150.161.071
2.29.0823.950.388.850.814.849.960.067
Bold values indicate statistically significant results.
Disclaimer/Publisher’s Note: The statements, opinions and data contained in all publications are solely those of the individual author(s) and contributor(s) and not of MDPI and/or the editor(s). MDPI and/or the editor(s) disclaim responsibility for any injury to people or property resulting from any ideas, methods, instructions or products referred to in the content.

