1. Introduction
College is often seen as a formative period that shapes students’ knowledge and skills. During this time, they complete a series of courses, gradually build their own knowledge base, and ultimately progress toward graduation. To support this journey, modern institutions typically design well-structured prerequisite systems to help students clarify their learning paths.
Despite the provided prerequisite structure, students often still encounter confusion when selecting courses. They may struggle to assess the importance of specific courses for future learning or feel uncertain when presented with multiple progression routes. Choosing an inefficient or misaligned path can delay graduation, which is costly both academically and financially. For instance, the average annual tuition at public universities in the United States exceeds USD 11,600 [
1], making timely graduation a critical concern for students and families. From an institutional perspective, student course-taking behavior offers valuable insights into the effectiveness of curriculum design. Are students following the intended learning paths? Which courses act as critical hubs or bottlenecks in a degree program? Do some pathways lead to more efficient graduation timelines than others? Addressing these issues not only supports students in making informed decisions but also helps universities improve curricular coherence and optimize educational outcomes.
To systematically study curriculum progression and prerequisite structures, graph modeling should be the most direct and natural approach [
2]. A graph is a mathematical structure used to model pairwise relationships between objects. Formally, a graph consists of a set of nodes, which represent entities, and a set of edges, which represent relationships or connections between these entities [
3,
4]. In the context of prerequisite analysis, courses are modeled as nodes and prerequisites are modeled as directed edges, forming the course prerequisite network (CPN). For example, some prior studies [
2] commonly rely on centrality metrics, path lengths, or simulated flows to identify influential courses. However, these approaches often neglect real student outcomes such as grades and completion timelines.
Most prior studies focus on individual courses or the overall curriculum structure, overlooking the path-level progression of students. Few have modeled how students traverse prerequisite sequences, their difficulty, and associated success rates. To fill this gap, we propose a data-driven framework that evaluates each prerequisite path from multiple perspectives. Specifically, we introduce three probabilistic models to estimate the expected number of semesters required to complete a path and the overall success probability.
Another contribution of this study is a joint analysis of course centrality and pass rate, which helps identify structurally important courses that are difficult to pass in practice. Such courses often serve as critical bottlenecks in student progression and may warrant targeted academic support or curricular redesign.
Our final novelty is our use of grade transitions between connected course pairs to evaluate performance continuity. This allows us to quantify how well students’ achievement in a prerequisite translates into success in its successor, offering insights into the alignment between course content and instruction.
2. Literature Review
Course Prerequisite Network (CPN) modeling has been widely applied to analyze curriculum structures across diverse institutional contexts. For instance, ref. [
5] examined CPNs at a leading STEM (science, technology, engineering, and mathematics)-oriented institution, demonstrating their potential to clarify academic pathways and support curriculum planning. Others have viewed curricula as complex systems and employed CPN-based analyses to uncover systemic patterns within specific majors [
6,
7,
8]. More recently, ref. [
9] conducted a comparative study of CPNs from five public universities, highlighting structural variations that reflect each institution’s disciplinary emphasis, such as engineering versus biomedical sciences. Ref. [
10] extended the traditional CPN framework by incorporating semantic information like learning outcomes and assessment linkages, enabling more comprehensive visualizations and analyses.
A substantial body of work focuses on identifying structurally important courses using graph-based metrics. Betweenness and degree centrality have been commonly used to locate pivotal nodes, while the ‘Reach’ metric proposed by [
9,
11] quantifies the downstream influence of a course. Ref. [
7] introduced a ‘course cruciality’ metric to assess how delays or failures in specific courses may affect graduation timelines. While these methods yield valuable structural insights, they are typically isolated from actual student performance and rely solely on static network topology.
To address this, a growing number of studies have started to consider student trajectories and behavior. Ref. [
6] noted that path length in a CPN provides a theoretical lower bound on time to completion, assuming one course per term. Building on this idea, refs. [
9,
11] proposed the Longest Path Induced Graph (LPIG) to identify prerequisite chains that may pose completion risks. Other works have applied frequent subgraph mining to uncover recurring course taking patterns [
12], developed simulation-based frameworks to model student flow [
13], and visualized curriculum navigation across majors and levels [
14]. Several studies have also begun incorporating performance-based metrics, such as ‘curricular efficiency’ [
8] and grade-informed predictive modeling [
15].
While these efforts represent a shift toward more realistic modeling, many still rely on either simulated data or aggregate statistics. Few analyses focused on prerequisite paths based on empirical data. To bridge this gap, our study adopts a path-level modeling perspective grounded in student transcript data. By integrating probabilistic modeling, structural importance measures, and performance continuity analysis, we aim to provide a more comprehensive understanding of curricular effectiveness and progression risk.
It is worth noting that recent advances in machine learning, though beyond the scope of this study, offer valuable directions for future work. These studies particularly focused on integrating student behavioral data with curriculum models. For instance, [
16] developed a graph neural network that jointly models student interaction behaviors and static attributes for academic performance prediction. The authors in [
17] employed a relational Graph Convolutional Network to capture student–course dependencies in heterogeneous graphs, enabling fine-grained grade prediction. Beyond these graph neural network approaches, another emerging strand of research leverages large language models (LLMs) to advance educational analytics [
18,
19,
20]. The rich content embedded in course materials can be used to construct knowledge graphs that reveal deeper conceptual and thematic connections among courses. By extracting these semantic relationships, researchers can foster content-driven approaches to inform and enhance curriculum design. Although these approaches are not directly incorporated into our work, they highlight promising future directions for integrating student behavioral patterns with curriculum structures in modeling. In addition, issues of data decentralization and privacy preserving computation are becoming increasingly important in educational analytics, especially when cross-institutional data is involved. Techniques such as federated learning and collaborative adaptation have shown promise in related domains. For example, refs. [
21,
22] provided meaningful prospects.
Finally, we want to clarify that all existing CPN-related analyses, included in our current work, are established based on the assumption that the subjective universities provide the prerequisite course structure. Our work is not applicable for those prerequisite-free subjects. Such works warrants an independent division of the curriculum research; ref. [
23] can be seen as a important recent work under the prerequisite-free curriculum.
3. Methods
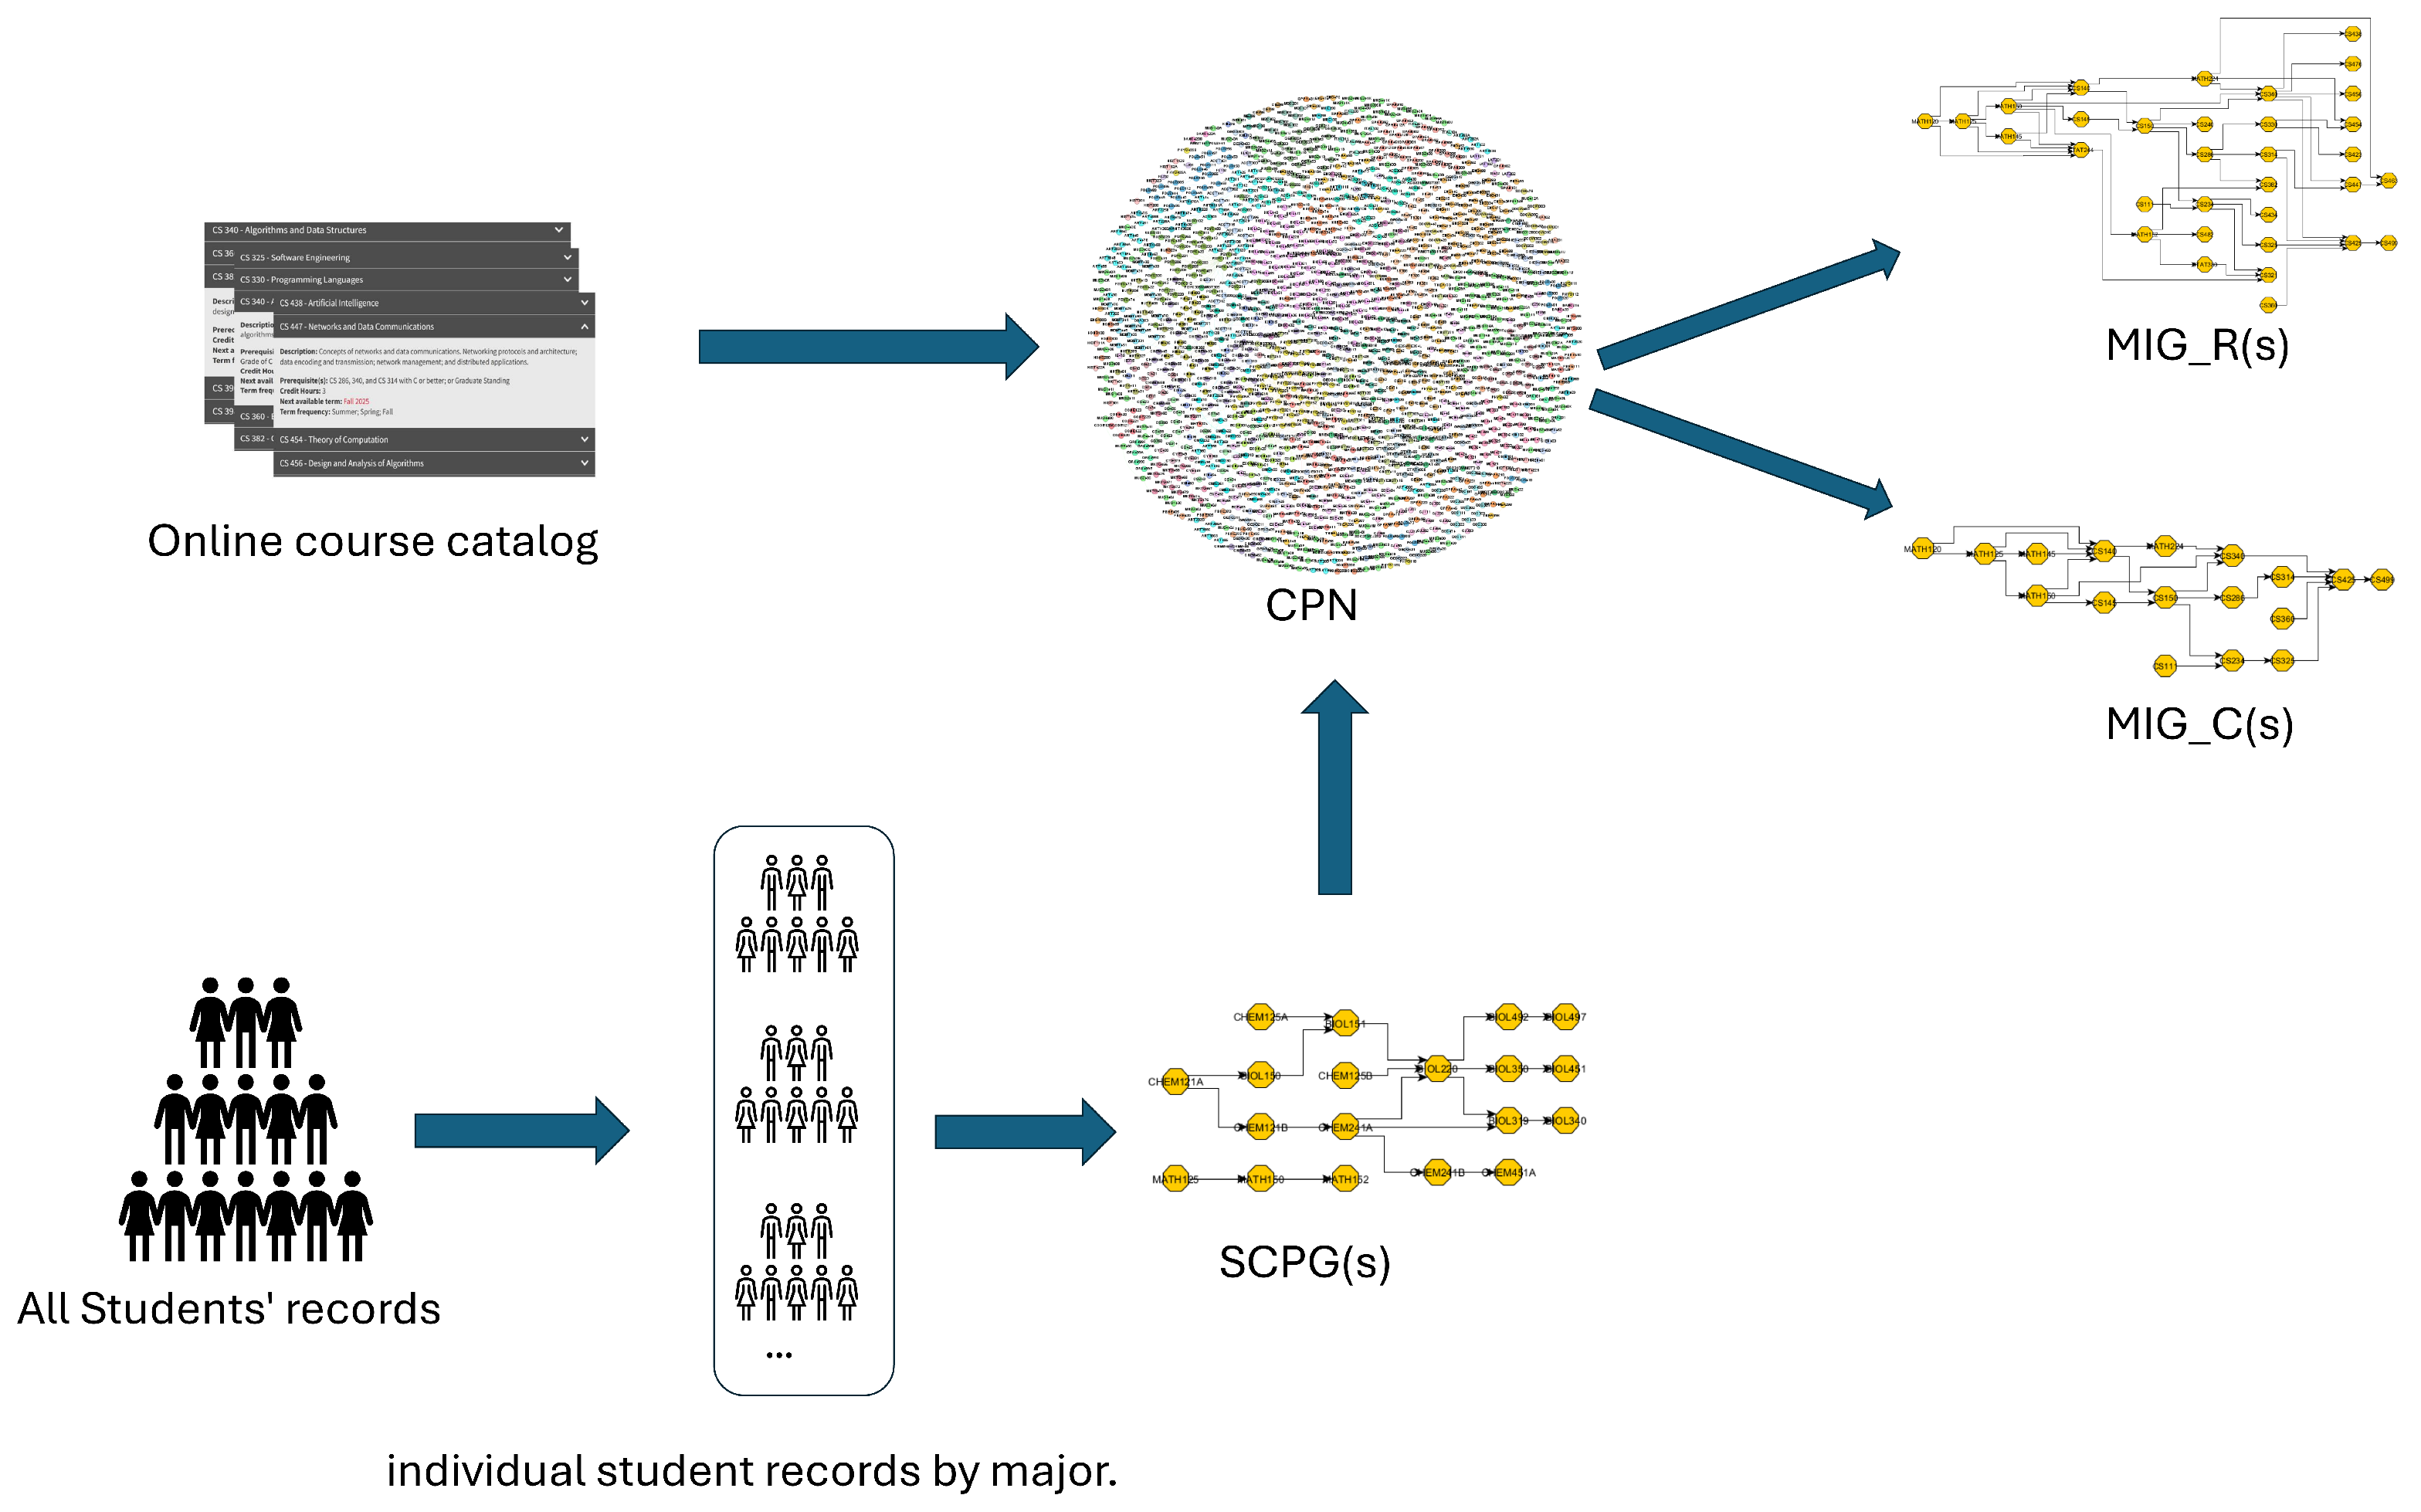
In this work, we introduce a graph-theoretical approach combined with statistical analysis to examine the curriculum system, beginning with the formation of the curriculum network. The graph construction pipeline is illustrated in
Figure 1. The data sources include the online course catalog and student transcript records. Specifically, we parsed prerequisite relationships from course descriptions and used them to construct the CPN, where each node represents a course and directed edges indicate prerequisite links.
In parallel, we preprocess all students’ registration records and segment them into individual academic trajectories grouped by major. These trajectories are used to construct Student Course Path Graphs (SCPGs), each of which reflects a student’s actual course-taking pathway along with the corresponding grades. These graphs enable us to observe how students navigate the curriculum in practice.
Next, we enrich the CPN by annotating its edges with student-level data derived from the SCPGs, including enrollment frequencies and performance metrics. Based on this enriched network, we derive two specialized graph variants for each major, namely MIG_R, which captures the major-specific structural backbone of the curriculum, and MIG_C, which traces converging prerequisite pathways leading toward the capstone course, revealing the core knowledge flow necessary for program completion.
3.1. Network Formation
3.1.1. Course Prerequisite Network (CPN)
As mentioned above, all the analyses in this study are based on the representation of the Course Prerequisite Network (CPN). The CPN is a directed graph where each node corresponds to a course, and a direct edge from node X to node Y, denoted , indicates that course X is a prerequisite of course Y. The CPN is constructed by parsing the university’s official course catalog, which explicitly lists prerequisite relationships between courses.
Since students must complete the prerequisites before enrolling in the successor courses, the CPN is inherently encoded as a directed acyclic graph (DAG). There are no cycles, and one cannot return to a course once it has been passed in the prerequisite chain. Such a directed acyclic structure naturally reflects the hierarchical organization of a curriculum, ensuring that courses progress from foundational to advanced levels. It also preserves the temporal order of course taking, as no course can appear earlier than its prerequisites in any valid path.
While schools aim to offer students flexibility in course selection, the course dependencies often involve complexities such as AND/OR logic, co-requisites, and cross-listed or equivalent courses. Following our prior work [
9], we simplified the logic by treating all listed prerequisites as mandatory. For instance, when a course lists “A or B” as prerequisites, both A and B are included in the CPN as prerequisite nodes to ensure that all potential prerequisite paths are preserved and the graph remains acyclic. This transformation is to guarantee that all potential valid paths are well preserved.
For co-requisites, we consider two common cases. Firstly, if a course X is listed as a “prerequisite or co-requisite” for course Y but not vice versa, it typically means that students may take X before or alongside Y. In such cases, we model the dependency as a one-way edge from X to Y. Secondly, if a pair of courses are explicitly listed as mutual co-requisites, indicating that they must be taken simultaneously, we do not add any edge between them in the CPN since neither precedes the other.
It is worth noting that, in this work, each node in the CPN represents an individual course, and each directed edge encodes a prerequisite relationship between two courses. Beyond structural dependencies, we enrich the edge-level information with student performance data extracted from the Individualized Course Path Graphs. More details will be provided in the later section.
3.1.2. Major Induced Graph (MIG)
To extract the portion of the curriculum relevant to each major, we isolate the subgraphs of the CPN, termed the Major Induced Graph (MIG). The concept of the MIG extends our previous work on the Longest Path Induced Graph (LPIG) [
9]. In the original formulation,
was defined as the induced subgraph of a DAG that contains all nodes lying on paths of length greater than
t. In terms of CPN analysis, the threshold
t can be interpreted as a structural depth criterion, such that the resulting LPIG captures course sequences that are sufficiently long to reflect meaningful curricular constraints.
In contrast to our prior work, where LPIG was defined based on a path length threshold, in the current work, we adopt MIG to extract the major relevant subgraphs of the CPN. Specifically, we aim to capture those courses that are connected to a given major through prerequisite paths. The key motivation for using MIG is that a major’s curriculum cannot be simply captured solely by filtering courses based on their major prefix. For example, selecting courses labeled as “ECE” would omit the foundational “MATH” or “PHYS” courses, which are commonly required in its pathways. In this work, we introduce two variants of MIG for major-level analysis.
MIG_R (Related): This variant includes all courses that appear on any prerequisite path that leads to a course with the target major’s prefix (e.g., “ECE”). Formally, for a given major M, a course X is included in MIG_R if there exists a path in the CPN such that , where Y is labeled with prefix M. This subgraph thus captures not only the major’s own courses but also foundational or supporting courses (e.g., MATH, PHYS) that serve as prerequisites along those paths. In summary, MIG_R encompasses all courses that are associated with major M through any prerequisite chains.
MIG_C (Capstone): This variant restricts to prerequisite paths that culminate in the capstone course (e.g., Senior Design or academic internship) of the major. A course X is included in MIG_C if it lies on any path that ends at the capstone course for major M. This variant focuses on the structural backbone that supports capstone completion, offering a more stringent subgraph for dependency analysis. In summary, MIG_C is a subgraph of MIG_R that includes only those courses lying on prerequisite paths leading to the designated capstone courses of major M.
3.1.3. Student Course Path Graphs (SCPGs)
In addition to the CPN and its major specific subgraphs, we also constructed the individualized Student Course Path Graphs (SCPGs) for each student based on their academic records. Each SCPG is a DAG, depicting the sequences of courses taken by an individual student throughout their university career.
The node set of an SCPG consists of all courses attempted by the student, and the node attributes include (1) First attempted semester, (2) Finished semester, (3) Retaken count, and (4) Grade. The Retaken count is initialized as zero. If a student passes the course on the first attempt, the First attempted semester and Finished semester are identical. Otherwise, the Finished semester records the term in which the course was successfully completed, while the Retaken count reflects the number of failed attempts prior to passing. An edge between two nodes is added if (1) the CPN contains this edge and (2) the Finished semester of course X is earlier than the First attempted semester of course Y, and (3) the Grade of course X is one of , indicating a passing grade. These conditions ensures that the edges reflect valid prerequisite relationships that were respected in the student’s actual course taking sequence. In cases where a student attempts a course multiple times but never achieves a passing grade (such as D or F), the node is still included in the SCPG. In such cases, the Finished semester is set to the last attempted semester. Since the course was never passed, this node is not eligible to serve as a valid prerequisite for any courses, and therefore has no outgoing edges.
Each SCPG reflects one student’s course taking trajectory and is used to enrich the CPN with statistical attributes. Specifically, they are used to compute edge-level metrics in CPN, such as conditional pass rates and grade correlations between course pairs.
3.1.4. Graph Postprocessing
For each directed edge in the CPN, we associate a set of edge attributes based on actual student course-taking behavior, extracted from the SCPGs. These attributes include the following:
d: Total number of students who attempted course Y after completing course X.
n_f: Number of students who passed course X, then passed course Y on first attempt.
n_a: The number of students who passed course X, then passed course Y regardless of how many attempts were needed.
Repeat: Total number of repeats among students between course X and Y.
Rep_stu: Total number of students who retook course Y after completion of course X.
Matrix_first: A matrix recording the number of students with each grade combination for courses X and Y, restricted to students who passed X and attempted Y exactly once. The rows correspond to grades in X, and the columns correspond to grades in Y.
Matrix_all: This matrix shares the same structure and interpretation as Matrix_f, with rows corresponding to grades in X and columns to grades in Y. The only difference is that Matrix_a includes all students who passed X and eventually completed Y, regardless of whether they repeated the course. It therefore reflects the overall transition pattern without excluding students who retook Y.
These statistics provide a foundation for computing conditional pass rates, modeling grade dependencies, and estimating the expected time needed to traverse specific paths in the curriculum. At this stage, the graph construction part is complete.
3.2. Analysis
3.2.1. Centrality Analysis
To characterize the structural properties of the curriculum, we performed a series of graph-based centrality measures on the CPN. In particular, node centralities identifying courses that play structurally important roles within the prerequisite network. We first considered outdegree centrality, which counts the number of immediate successors for each course, reflecting its direct influence on access to the subsequent courses.
Given a directed graph
,
, we use
to denote the outdegree of node
i. In terms of adjacency matrix
A,
is given by Equation (
1).
We also computed the betweenness centrality, which identifies courses that frequently lie on the shortest paths between other courses and serve as bottlenecks in the curriculum. We use
to denote the betweenness centrality of node
i, defined as in Equation (
2). Here,
denotes the total number of shortest paths from node
s to node
t, and
denotes the number of those paths that pass through node
i.
In addition, we introduced
as a centrality measure tailored for the curricular context. For each course,
is defined as the number of downstream courses accessible via any direct path. Unlike betweenness or degree,
captures the total span of a course’s influence. As highlighted in our previous work [
9], high-reach courses often serve as critical gateways; and disruptions to them can affect large portions of the curriculum. The
metric is computed using breadth-first search (BFS) from each course node. Formally,
is defined as
where
is the BFS tree rooted at
i.
Among these three centrality measures, is especially useful for capturing how broadly a course influences downstream curriculum. In the next section, we combine it with pass rates to identify courses that are both structurally central and difficult to pass.
3.2.2. Reach–Pass Rate Joint Analysis
Having identified the structural roles of courses within the curriculum through the aforementioned measures, we now incorporate the student data to further understand their functional impact. In this section, we perform a joint analysis that combines with course passing rates that are derived from student transcripts. The pass rate is defined as the proportion of students who passed the course out of all students who attempted it. While captures a course’s structural centrality within the curriculum, the pass rate reflects its real-world difficulty as experienced by students. Together, they provide a more holistic view of curricular impact. This analysis is based on MIG_R, which emphasizes how far a course reaches through the curriculum in terms of prerequisite influence.
By plotting courses in the two-dimensional space of and pass rate, we were able to identify key curricular bottlenecks, specifically courses that are both structurally central and difficult to pass. These high-risk courses may require additional instructional support or curricular adjustments, as they have a disproportionately impact on student progression.
3.2.3. Path Completion Modeling
The above analyses provide valuable insights into the structural roles and difficulty of individual courses, but they are still conducted at the individual course level (node-level). From students’ perspective, what truly matters is not just whether a single course is hard, but whether they can successfully complete an entire course chain that leads to graduation, and how long that might take. From an institutional perspective, it is equally important to evaluate whether a program’s structure creates unintended barriers or lowers overall completion feasibility. In this section, we focus on analyzing the complete chains extracted from the MIG_C. Since all prerequisites in an attempted chain must be passed, assuming one course per term, the length of a path also reflects the minimum number of semesters required to complete it [
6]. To evaluate the feasibility of completing these course paths, we introduce three statistical models that estimate the expected time or probability of path completion under varying assumptions about student performance. These models, referred to as M1, M2, and M3, progressively incorporate increasing levels of empirical information. Assume
represents a course path consisting of
n sequential courses connected by prerequisite relationships.
M1 (Independent Passing Probability Model): Assume that the passing rates
for each course
on
are independent, and the expected number of semesters to complete
is calculated as the sum of the inverses of these pass rates (Equation (
4)).
M2 (Conditional Passing Probability Model): This model incorporates empirical pass rates by estimating the conditional probability of passing a course given that the prerequisite was passed. Specifically, for each course pair
, we estimate
using the edge information of the CPN, considering only students who passed course
on their first attempt. The expected number of semesters to complete
is calculated as the sum of the inverses of these conditional probabilities. Under M2 (Equation (
5)), each course’s success likelihood depends on the prerequisite success.
M3 (Path Completion Probability Model): This model estimates the overall probability of successfully completing a path. It incorporates conditional pass rates
, including all students who eventually passed course
after passing
, regardless of the number of attempts. Unlike M1 and M2, which focus on expected time, M3 measures the structural survivability of a path by computing the cumulative success probability across all transitions. The completion probability for
is calculated as Equation (
6):
Together, these three models offer complementary perspectives on curricular progression: M1 provides a baseline estimate under independent course-level assumptions, M2 incorporates realistic dependencies between courses without considering repetition, and M3 further captures the long-term completion likelihood by accounting for eventual success through course retakes. By comparing results across these models, we can assess both the temporal demands and structural fragility of different degree pathways.
3.2.4. Grade Transition Pattern
The analyses mentioned in the previous section focused on course passing rates, treating outcomes as binary events (i.e., either passed or failed a course). A deeper examination of fine-grained grade relationships between courses may reveal how students’ performance in a prerequisite course influences their subsequent courses. Intuitively, for a given prerequisite pair , if a student earns an “A” in course X, one would expect a high likelihood of also achieving a good corresponding grade in course Y as well. Conversely, if a student performs well in X but performs poorly in Y, it may suggest that either the content of Y diverges significantly from X, or that the preparation offered by X does not equip students for the challenge presented in Y. To capture such dynamics, we propose a grade-based transition index, denoted as , that captures the directional shift in student performance from one course to its successor. This index is computed based on three key grade transition pattern:
Let denote the number of students whose grade transitions from p in course x to q in course y, and denote the total number of students who received p in course x.
Jump: The proportion of students who move from a lower grade in the prerequisite course to a higher grade in the subsequent course, reflecting upward academic momentum.
Fall: The proportion of students who earn a high grade in the prerequisite but drop to a low grade in the successor, suggesting a mismatch or gap in curricular alignment. The Fall-Down factor is given by
Stability: The proportion of students who maintain similar performance levels across both courses (
,
,
), representing the curricular consistency. The Stability factor is given by
In our experiments, we focus primarily on whether students experience a performance drop when progressing to the successor course. From this perspective, we only focus on the component . This simplified formulation emphasizes curricular coherence by penalizing transitions where students’ performance drops after passing the prerequisite. A lower value indicates that most students maintain or improve their grades when moving to the successor course, suggesting better continuity and instructional alignment between the two courses. Conversely, a higher value implies that a larger proportion of students perform worse in the successor course, potentially revealing gaps in curricular coherence or prerequisite preparation.
4. Experiments and Results
4.1. Dataset and Experiment Overview
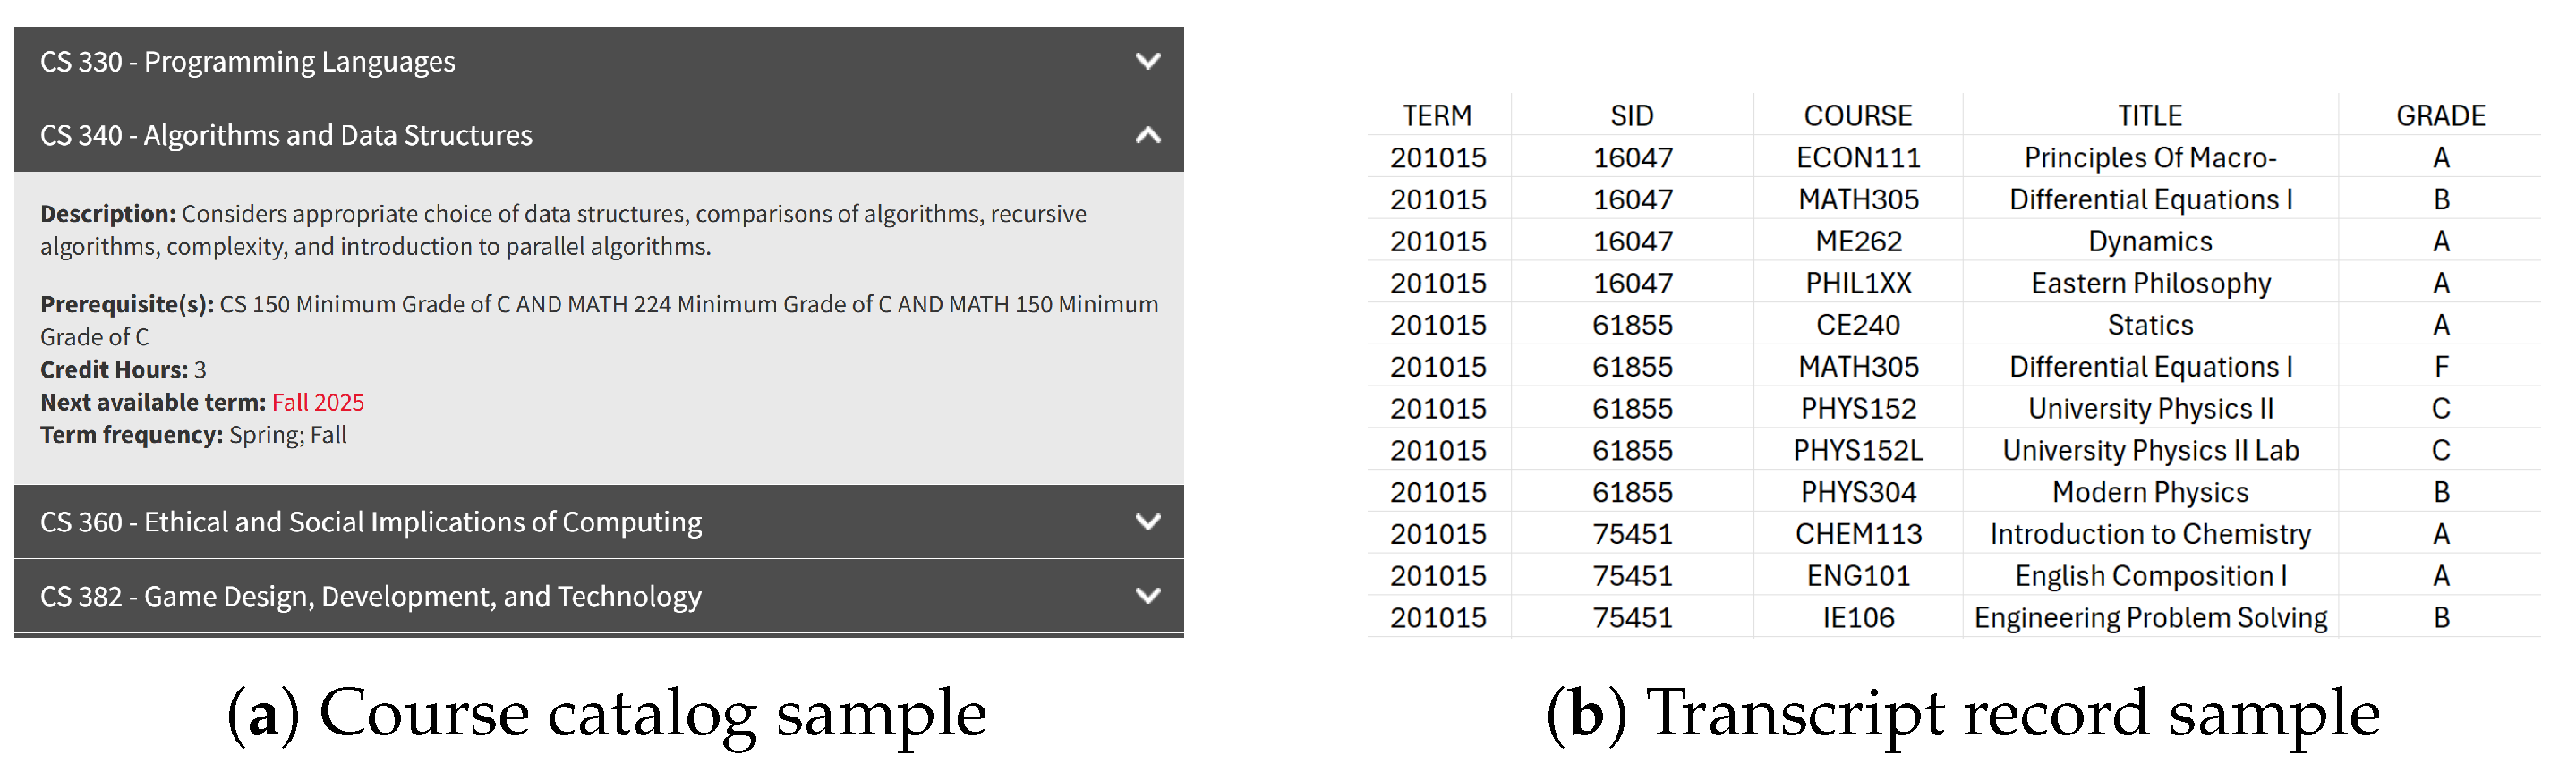
The dataset used in this study comprises both course information and student academic records from Southern Illinois University Edwardsville. Course information was obtained by crawling the university’s official website [
24] using Python request (2.32.3) and bs4 (4.13) library. The student records consist of transcript data from four majors, spanning the years 2010 to 2024. Personally identifiable information was removed prior to analysis to ensure compliance with privacy standards. For each entry includes the unique student ID, the course code, the attempted term, and the corresponding grade. The transcript data preprocessing involved two main aspects. On the one hand, since our analysis focuses on course-taking pathways and students are only allowed to proceed to subsequent courses upon earning a grade of ‘
C’ or higher
in the prerequisite course, all grades below ‘
C’ were treated as
(‘
F’) in our model. On the other hand, there is an exception where some records showed students enrolled in the same course more than once within a single semester with invalid grades; such redundancies were removed during preprocessing to ensure data consistency. The samples of both prerequisites and transcript data are shown in
Figure 2. To ensure meaningful analysis, the subjective majors should have sufficient numbers of students and exhibited complete prerequisite chains in the CPN. Based on these criteria, we selected four representative STEM majors: Computer Science (CS), Biology (BIOL), Electrical and Computer Engineering (ECE), and Mechanical Engineering (ME). Since student major information is not presented in the transcript data, students were assigned to the major in which they completed the greatest number of courses. An overview of the course offerings, the capstone courses, and student counts is shown in
Table 1 (note that the course counts in
Table 1 include only those with the specified major prefix). In addition, all the graph construction and analysis were primarily conducted using NetworkX (3.5) library [
25]. Part of the path analysis and result plotting are carried out by using graph visualization tools Gephi(0.10) [
26] and yEd Graph Editor(3.25).
All course codes and their corresponding course names mentioned in this paper are listed in
Table A1, and the major induced graphs are provided in
Figure A1,
Figure A2,
Figure A3 and
Figure A4. The data and code used in this research are available at [
27].
4.2. Centrality Results
Table 2 and
Table 3 summarize the structural characteristics of the CPN and the corresponding subgraphs.
Table 2 shows the number of STEM courses and prerequisite links that constitute the CPN, along with the courses exhibiting the highest centrality under different metrics. The abbreviation “Lcc” refers to the Largest Connected Component, which captures the largest subset of courses connected via prerequisite relationships. We found that
BIOL220(Genetics) exhibits both the highest betweenness centrality and the highest outdegree. This prominence can be partially attributed to the relatively large number of biology-related courses represented in the network, which increases the likelihood of BIOL220 serving as a key connector or prerequisite across multiple paths. This observation is consistent with the subgraph statistics shown in
Table 3. In addition, we found all fundamental Math courses
MATH120 (College Algebra) →
MATH125 (Precalculus Mathematics) →
MATH150 (Calculus I) appears at the top of the
. This is primarily because MATH courses are required across nearly all STEM majors, making them common entry points in many students’ academic pathways.
Table 3 lists the size of MIG_R and MIG_C for each major. We observed that BIOL contains 99 related courses, but only 15 of them are included in its core paths toward the capstone. In comparison, CS offers 33 related courses, 17 of which are included in the core path.
Table 4,
Table 5,
Table 6 and
Table 7 list the courses with high betweenness centrality and high out-degree for each major.
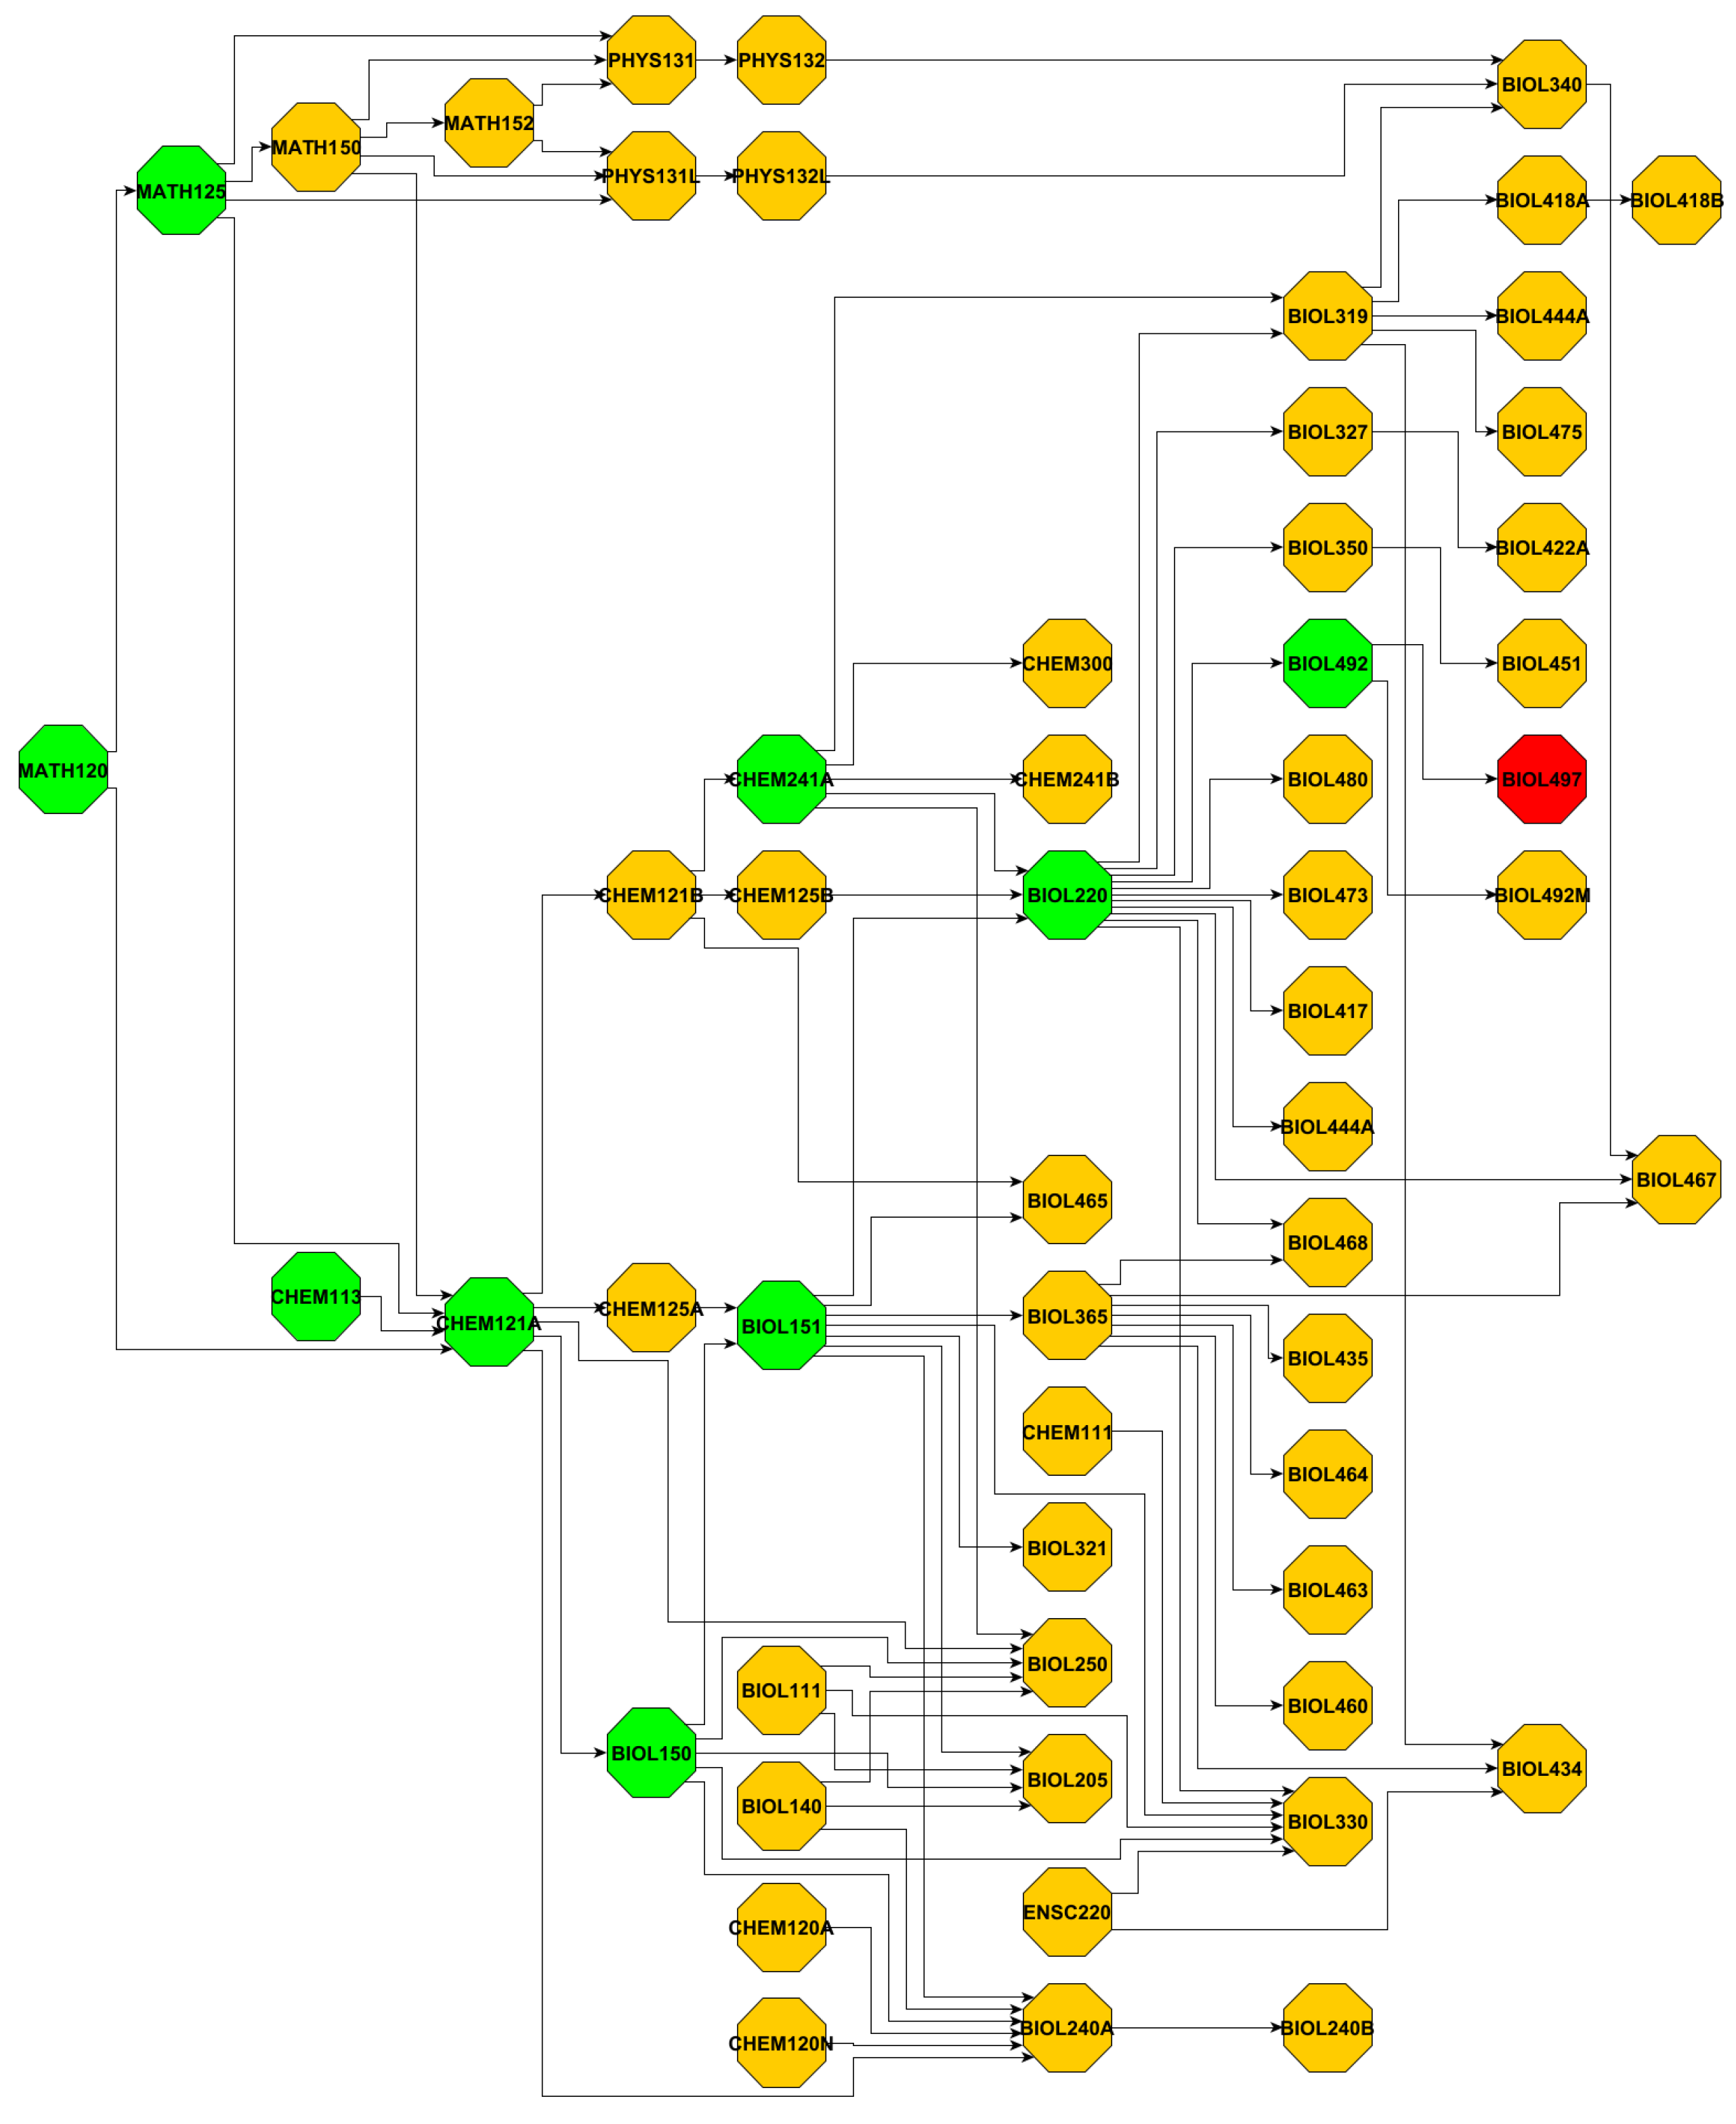
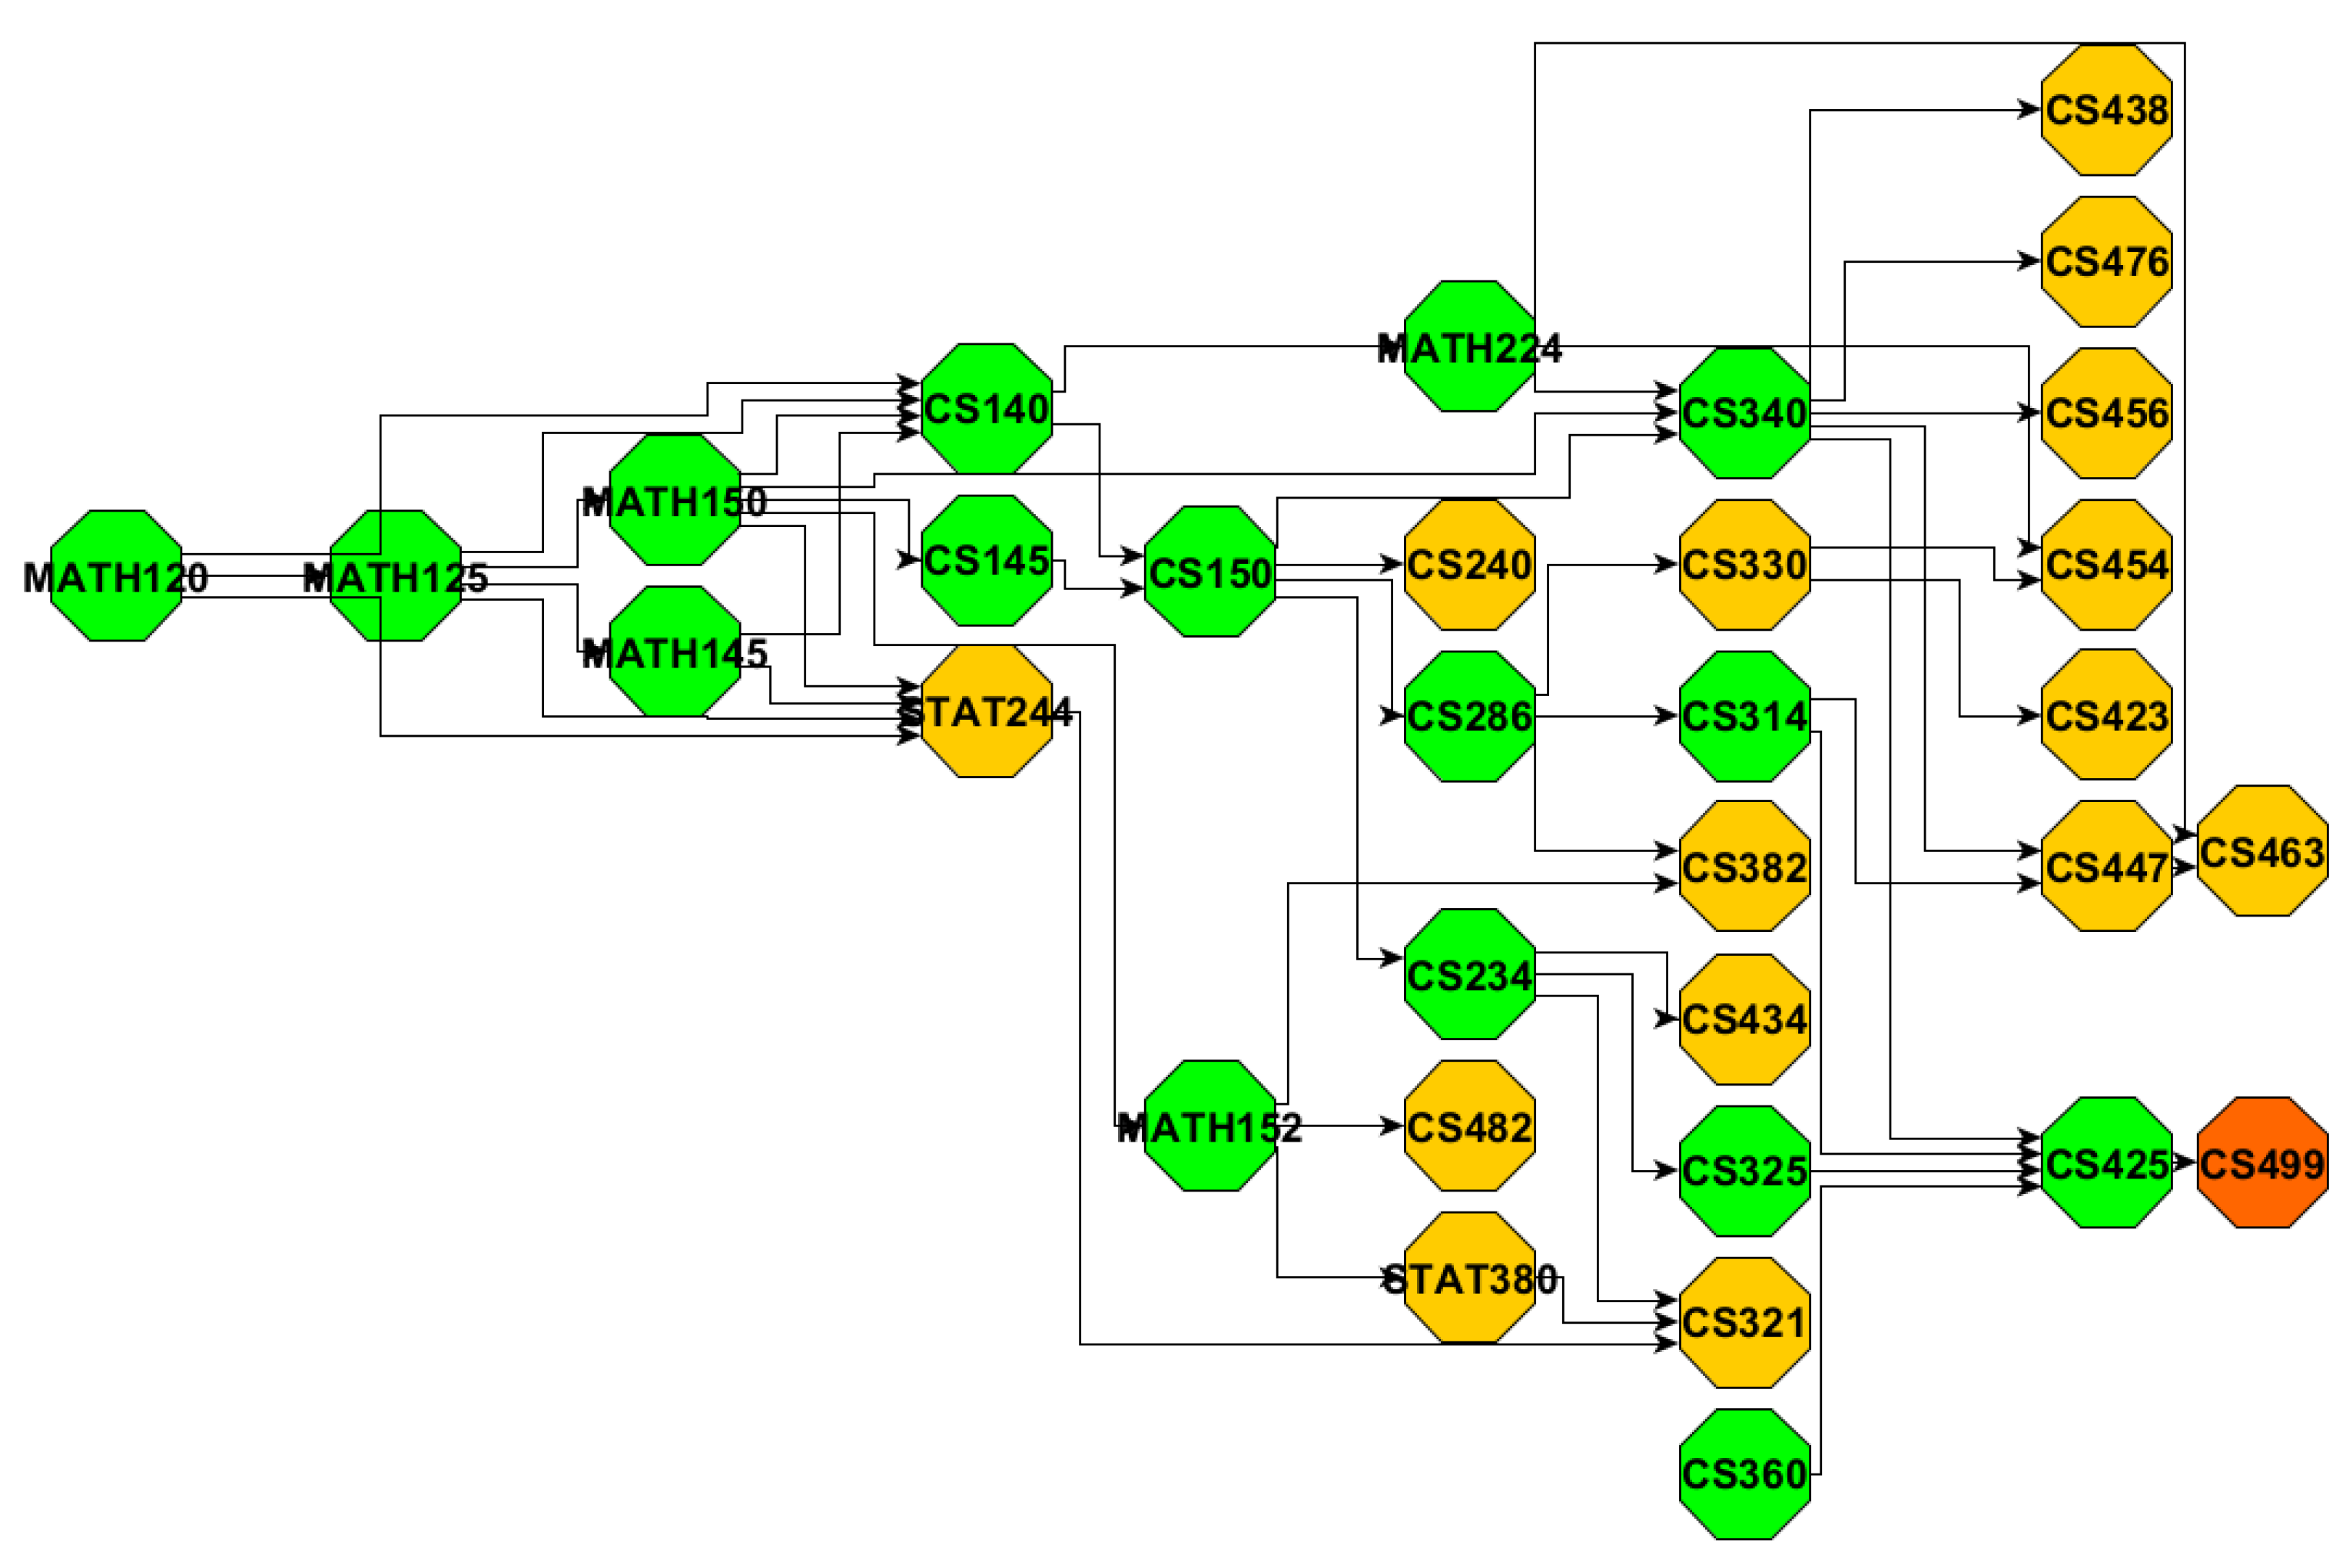
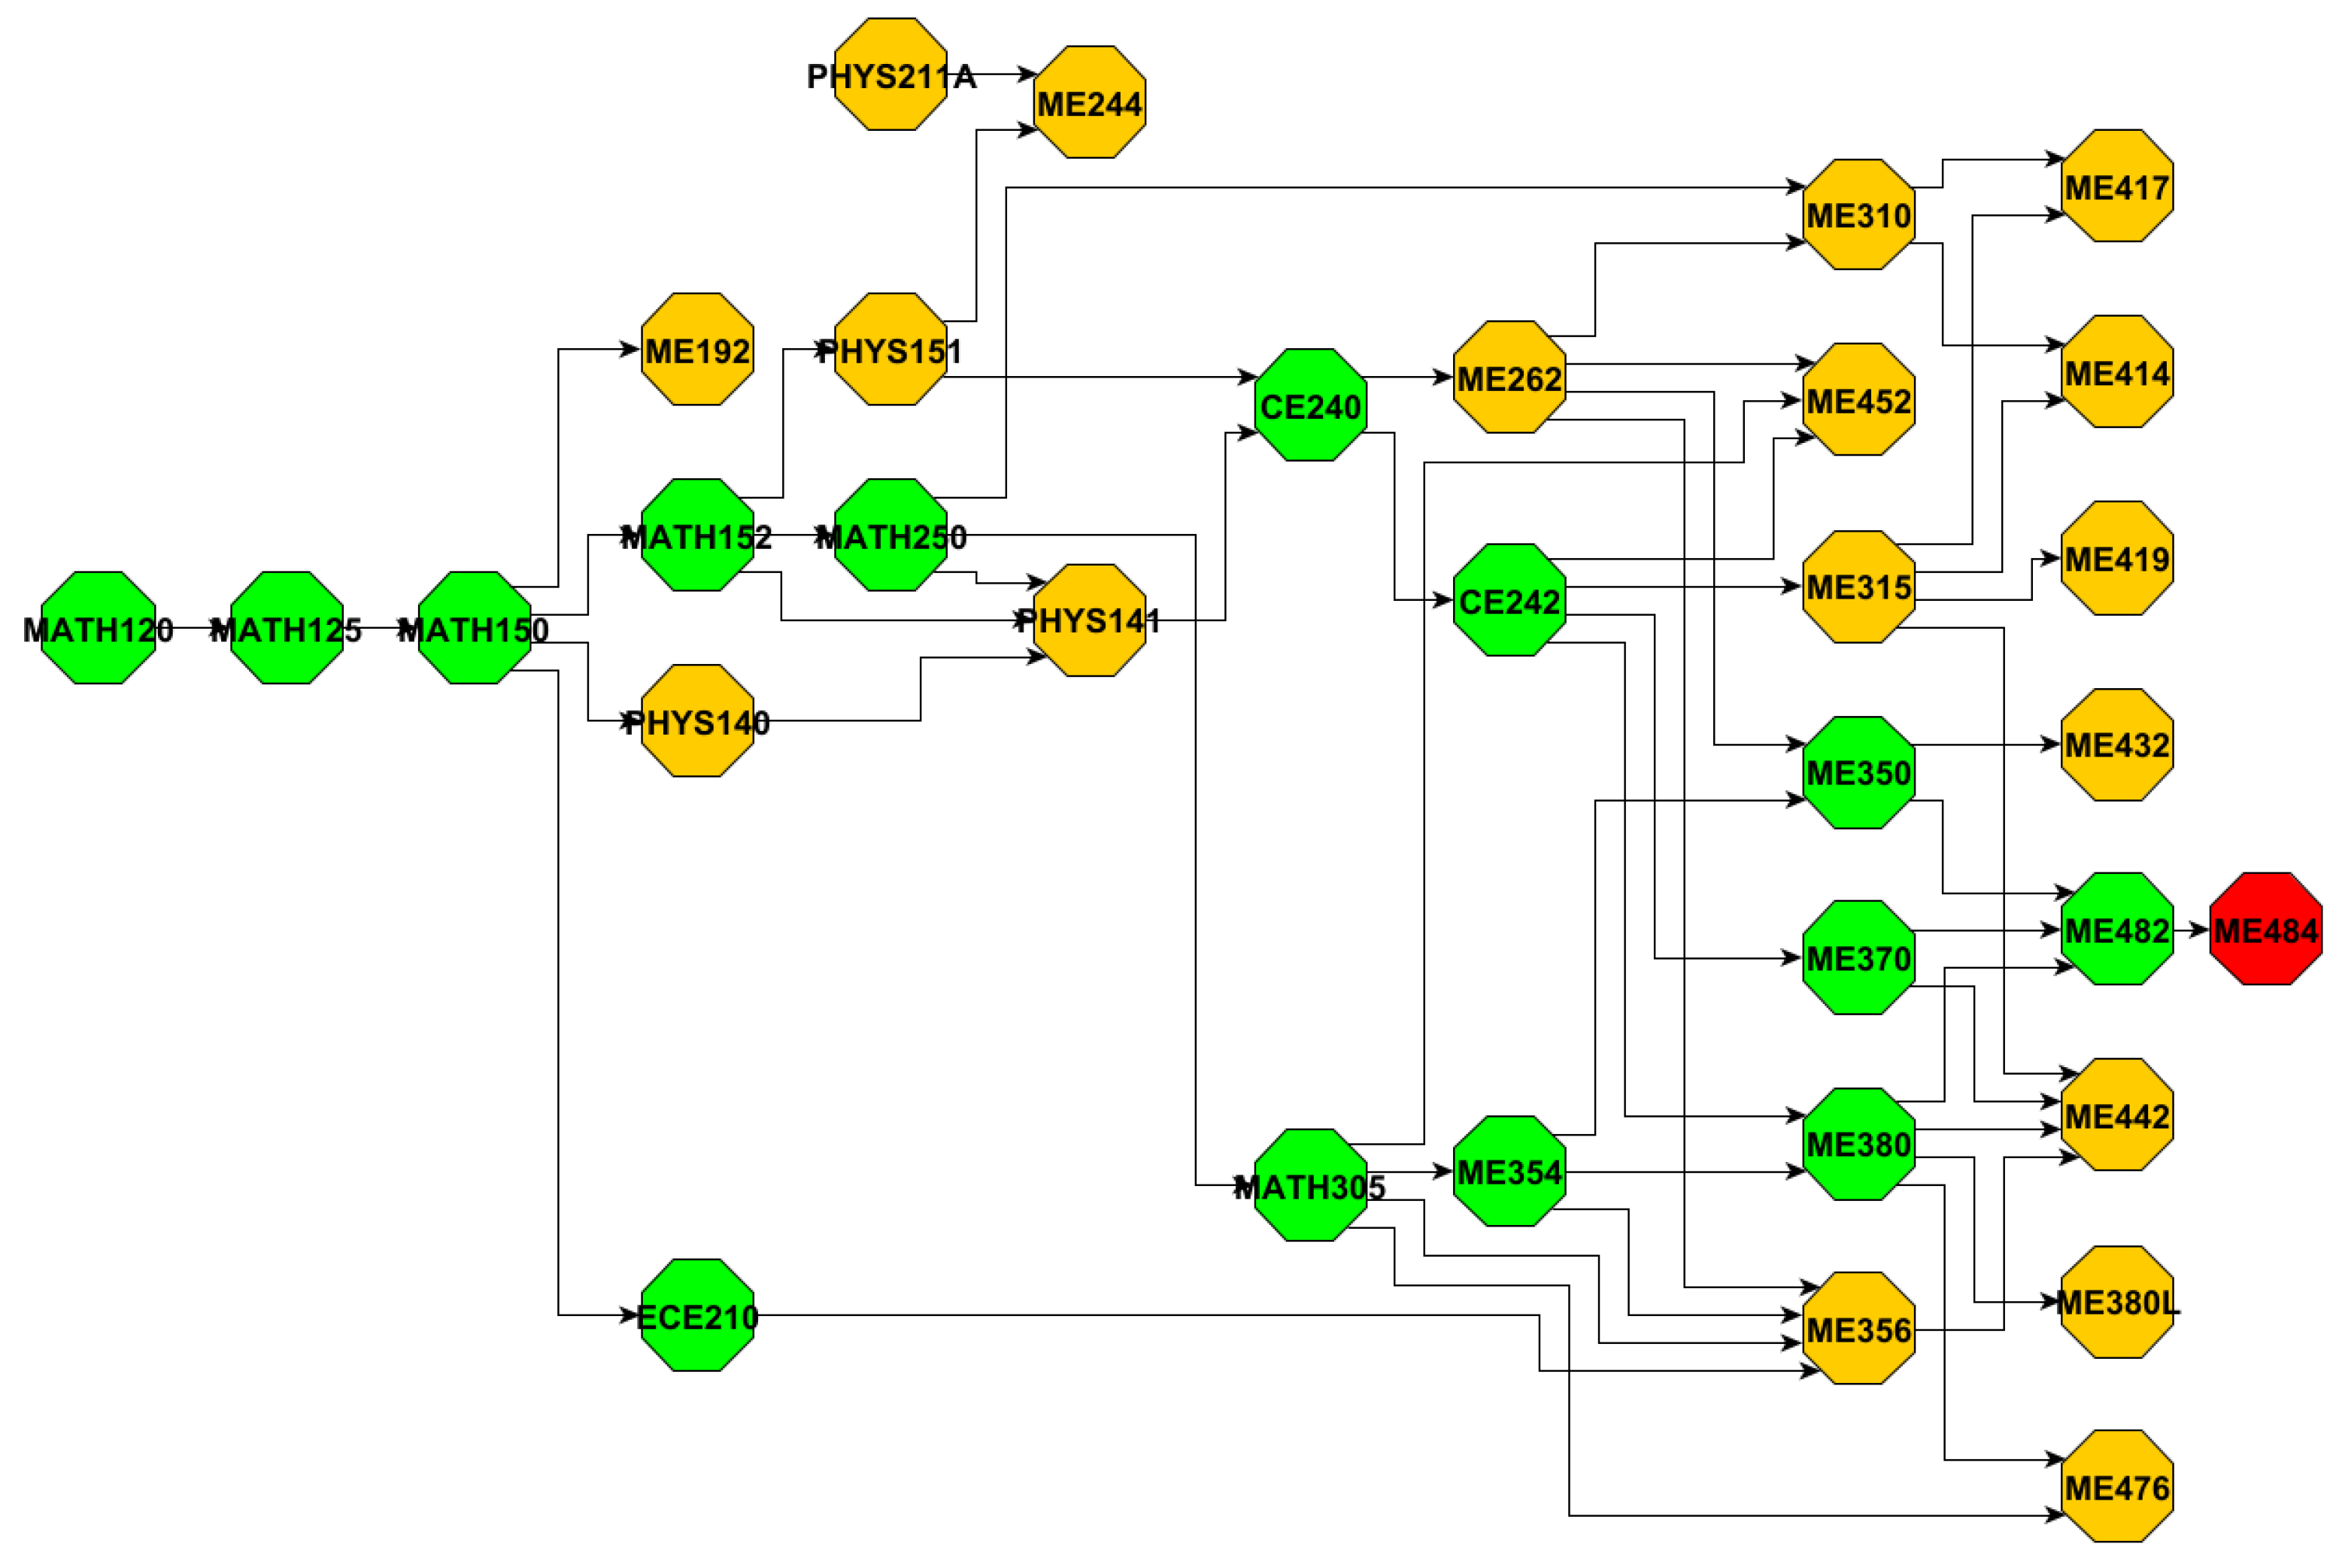
Figure A1,
Figure A2,
Figure A3 and
Figure A4 illustrate the corresponding MIG_R graphs, where green nodes indicate the subset of courses include in MIG_C, and red nodes represent the capstone courses. By examining
Table 4 and
Table 5, we observe a strong overlap in the courses with high betweenness centrality between MIG_R and MIG_C across all majors. Key courses such as
CHEM121A, BIOL220, CS150, ECE351, MATH150, MATH152, and
CE240 consistently appear in both networks, indicating that they are not only structurally central within the curriculum graph but also serve as essential connectors along the core paths toward capstone. We also noted a few differences, such as
CS234 and ECE282, which appear exclusively in MIG_C, suggesting that they are prominent in the core paths despite having relatively lower overall betweenness centrality.
Table 6 and
Table 7 list the high out-degree courses in MIG_R and MIG_C, respectively. Courses with out-degree less than 2 are omitted and marked with a “*”, and the number in parentheses indicates the out-degree of the course. By comparing these two tables, we find that several courses such as
CHEM121A, MATH150, CS150, ECE351, ECE282, and ME354 consistently exhibit high out-degree in both subgraphs, indicating their role as central prerequisites that directly lead to multiple downstream courses, including those in the capstone-oriented paths. Most courses such as
BIOL220, CS340, etc., only appear in MIG_R, underscoring their structural centrality but less relevant to the core graduation paths. As shown in
Figure A1, although
BIOL220 has 22 successors in MIG_R, but only 1 of them (
BIOL492) contributes to the capstone path. In contrast, we noticed some courses like
CS140 show high out-degree exclusively in MIG_C, which means that although they are not dominant in the major curriculum graph, they serve as critical connectors along the core academic paths.
Across all four subjective majors, we observe that the courses with the highest in both MIG_R and MIG_C consistently originate from the foundational mathematics course chain beginning with MATH120. This sequence typically includes MATH120, MATH125, MATH150, and often extends further to MATH152 (Calculus II), MATH250 (Calculus III), or MATH305 (Differential Equations) depending on the major. This pattern reflects the universal curricular importance of mathematics in STEM education, and highlights how early math preparation is not only structurally central but also functionally critical for student progression toward degree completion.
4.3. Reach-Pass Rate Joint Analysis
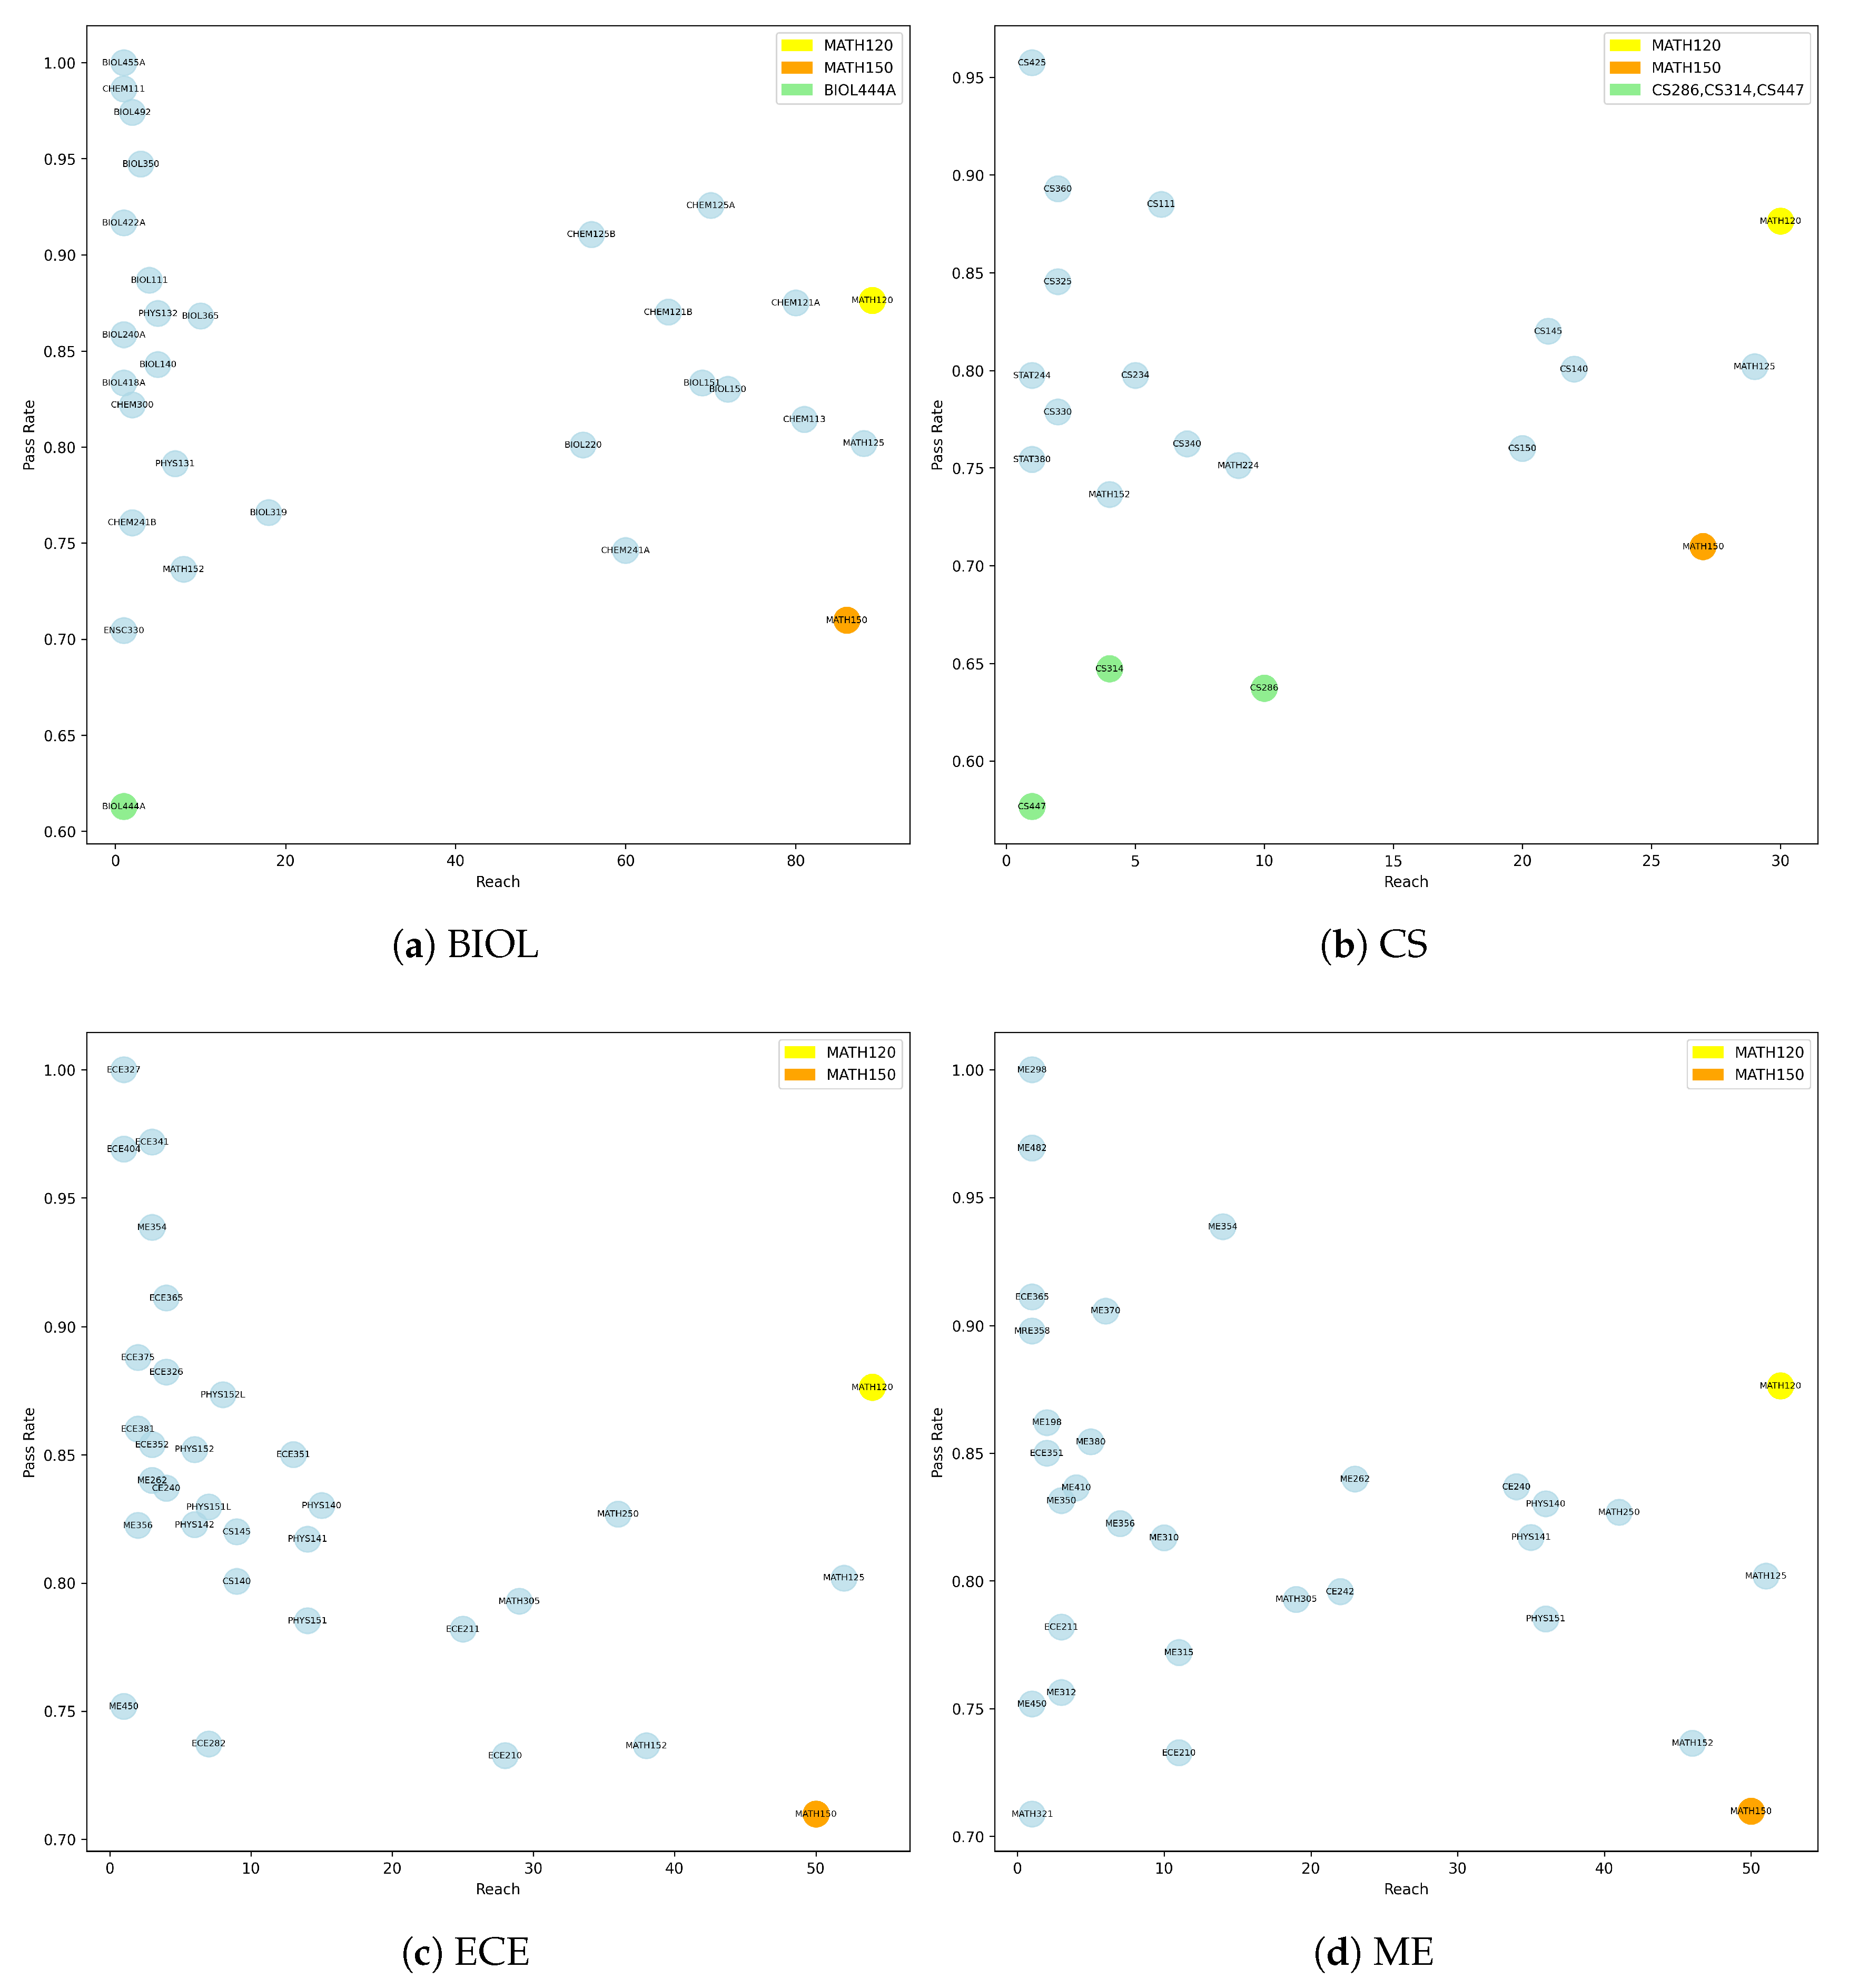
Figure 3 presents the analytical result for each major. We observe that
MATH150 (the orange node) stands out in all four majors as a course with high Reach but low pass rate, highlighting its role as a foundational but challenging bottleneck in student’s academic progression. Comparatively,
MATH120 (the yellow node) always occupies high
and high pass rate position, and serves as an accessible and starting point that supports a wide range of downstream paths. Several courses like
BIOL444A, CS447, CS314, CS286 (the green nodes) fall into the low
and low pass rate quadrant. These courses may not be central to the curriculum pathways but present high failure risks. Conversely, courses with high pass rate but low Reach are often upper-level (300–400 level) electives or specialized courses. These tend to be less pivotal role within the curriculum but are generally less challenging and have higher pass rates. The above pattern helps identify critical bottlenecks, and outlier courses that may warrant further curricular attention.
4.4. Path Completion Results
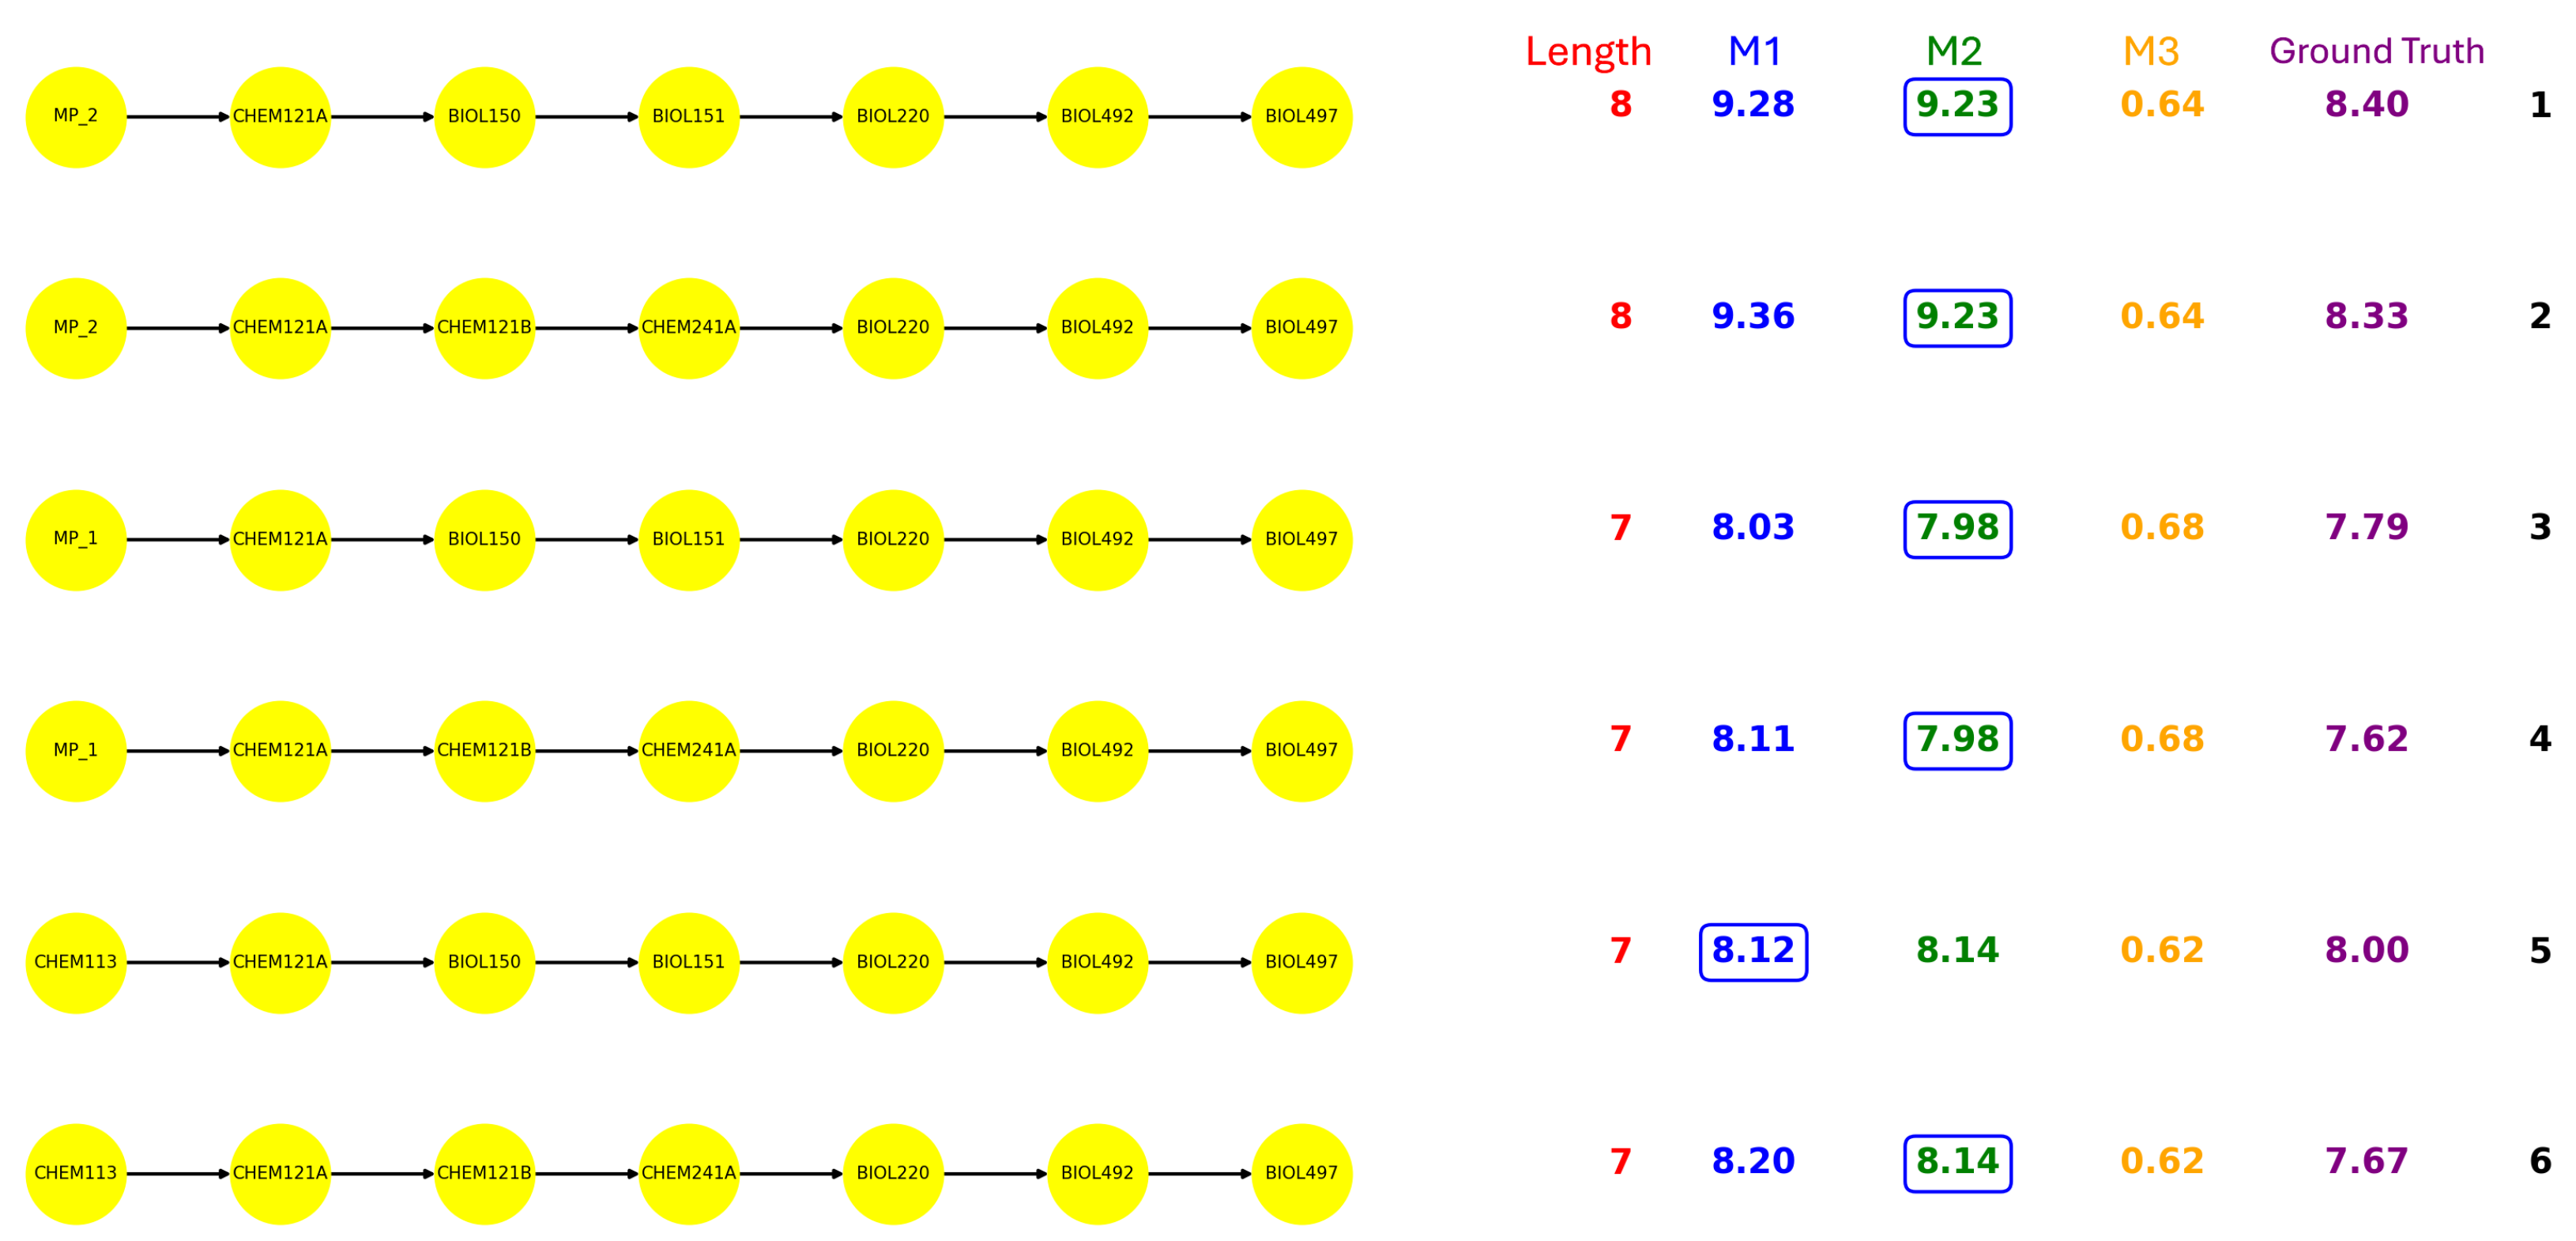
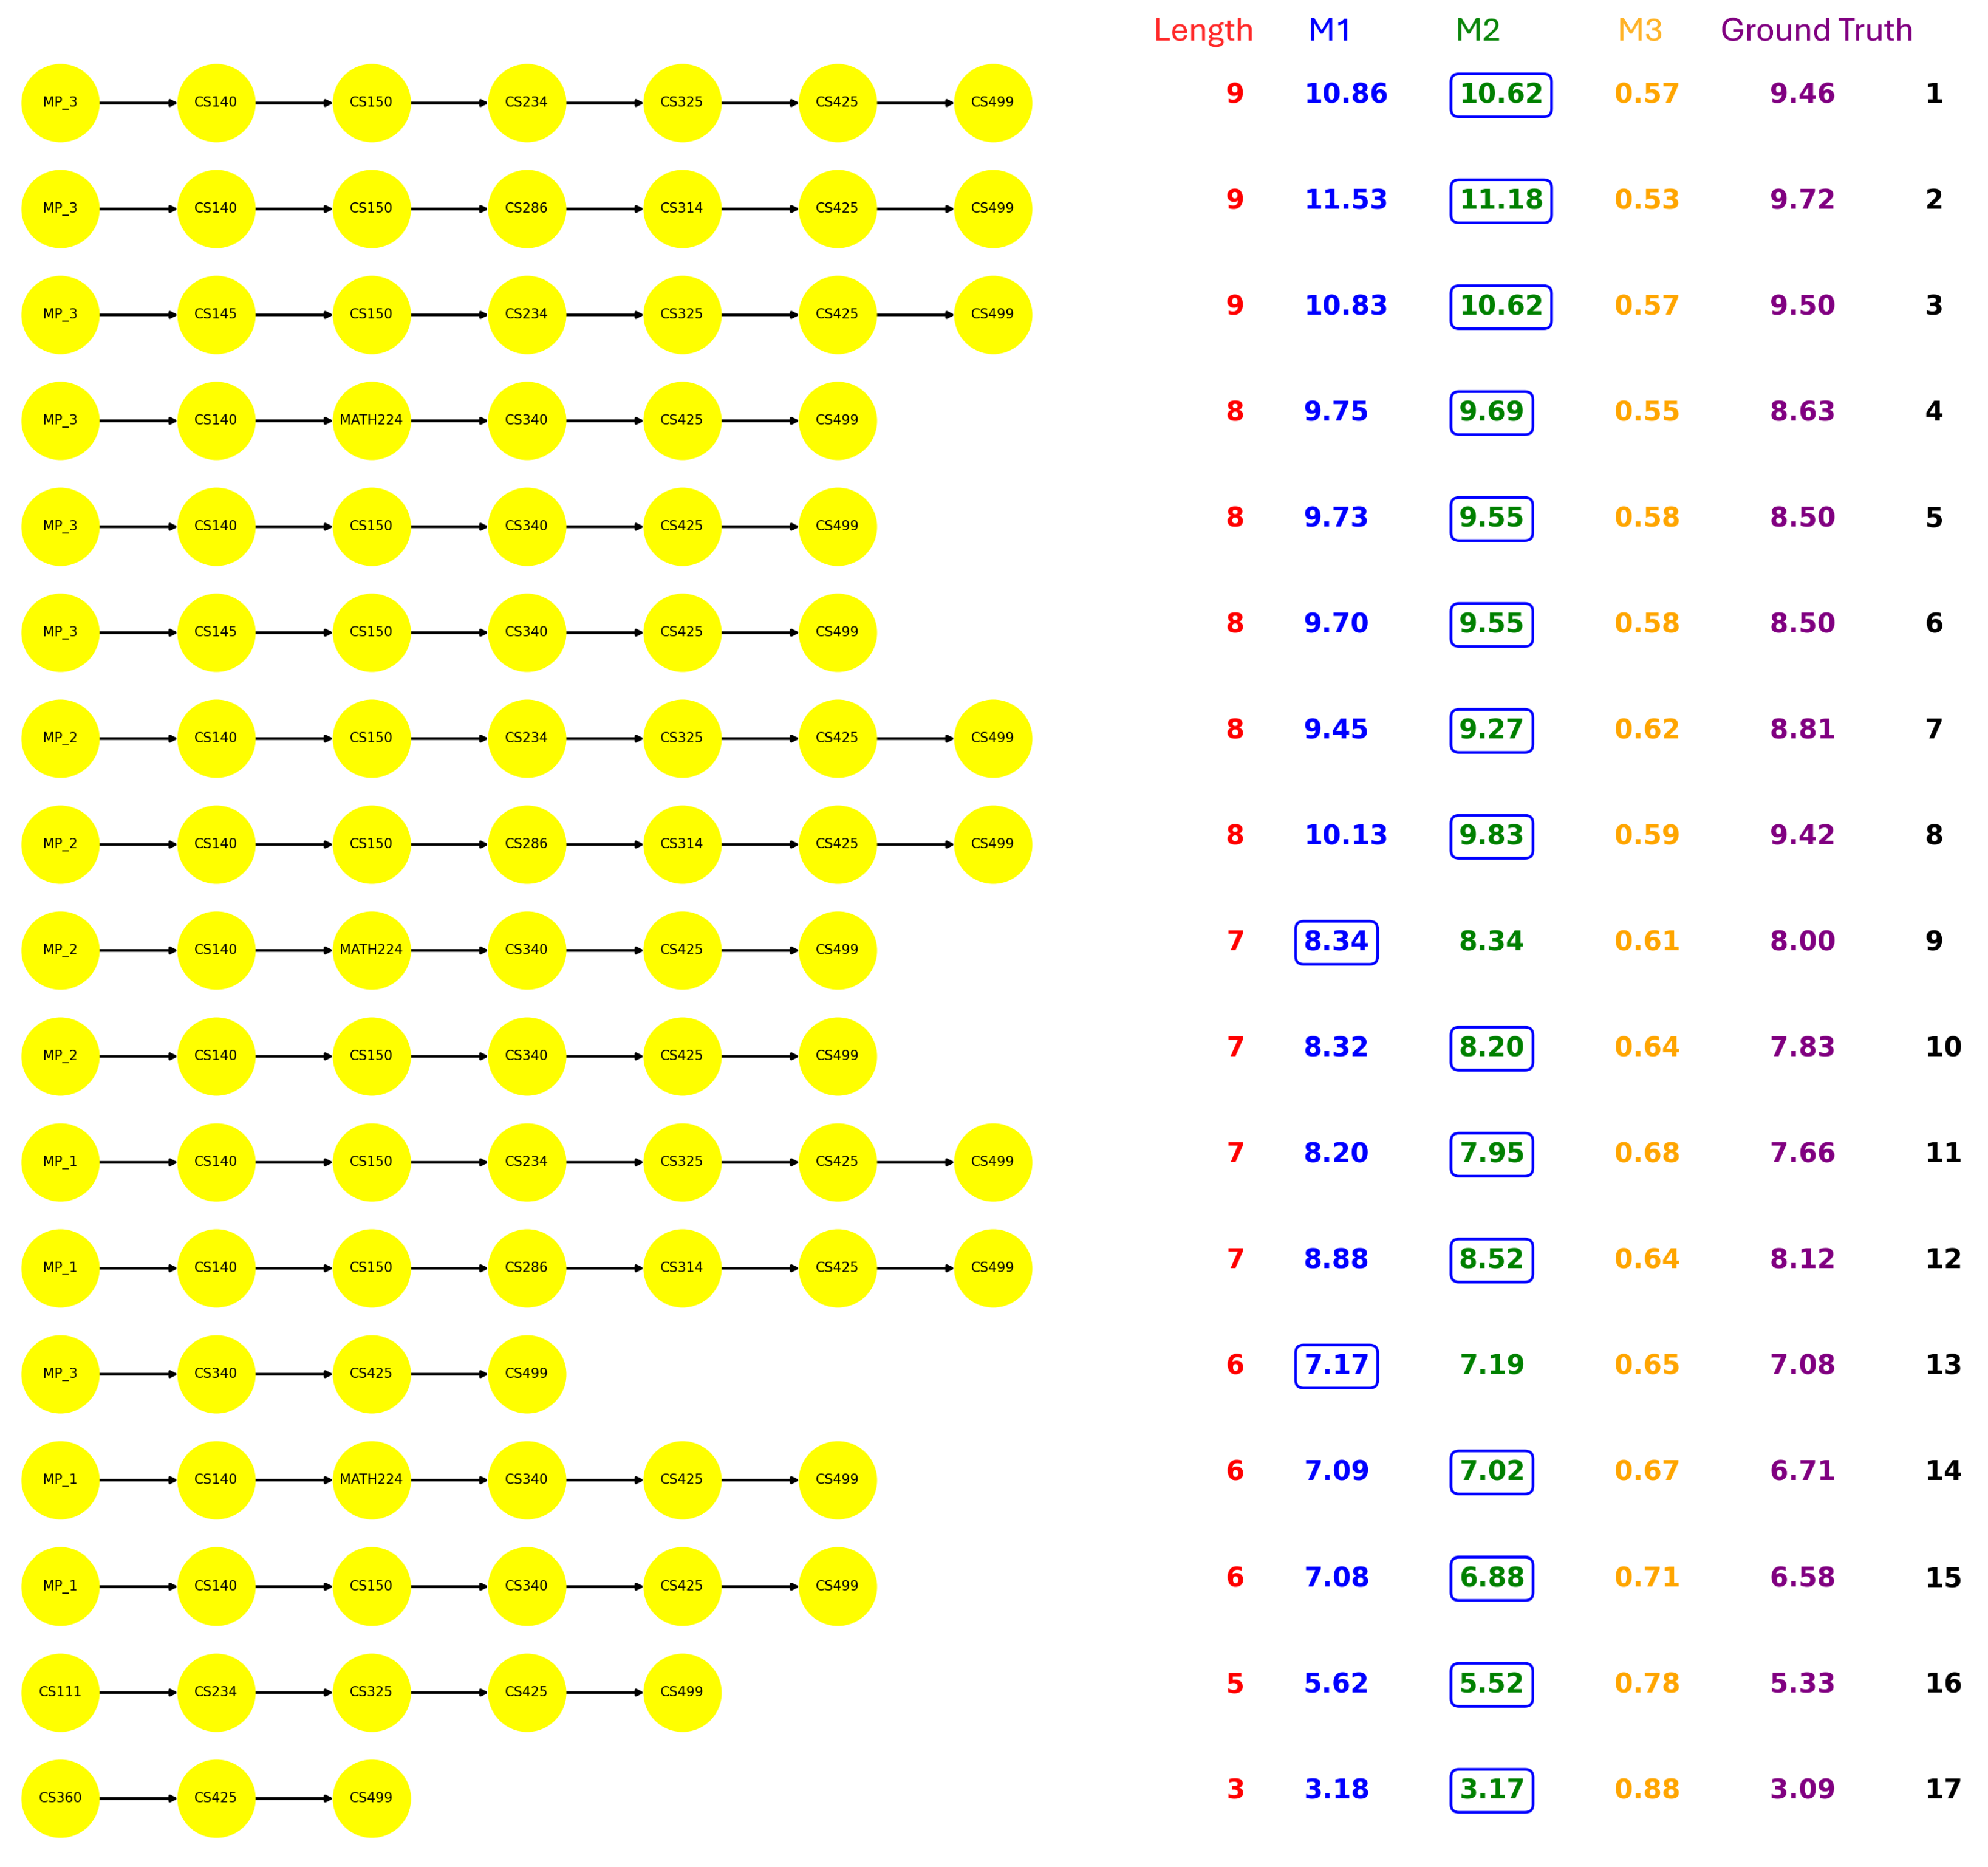
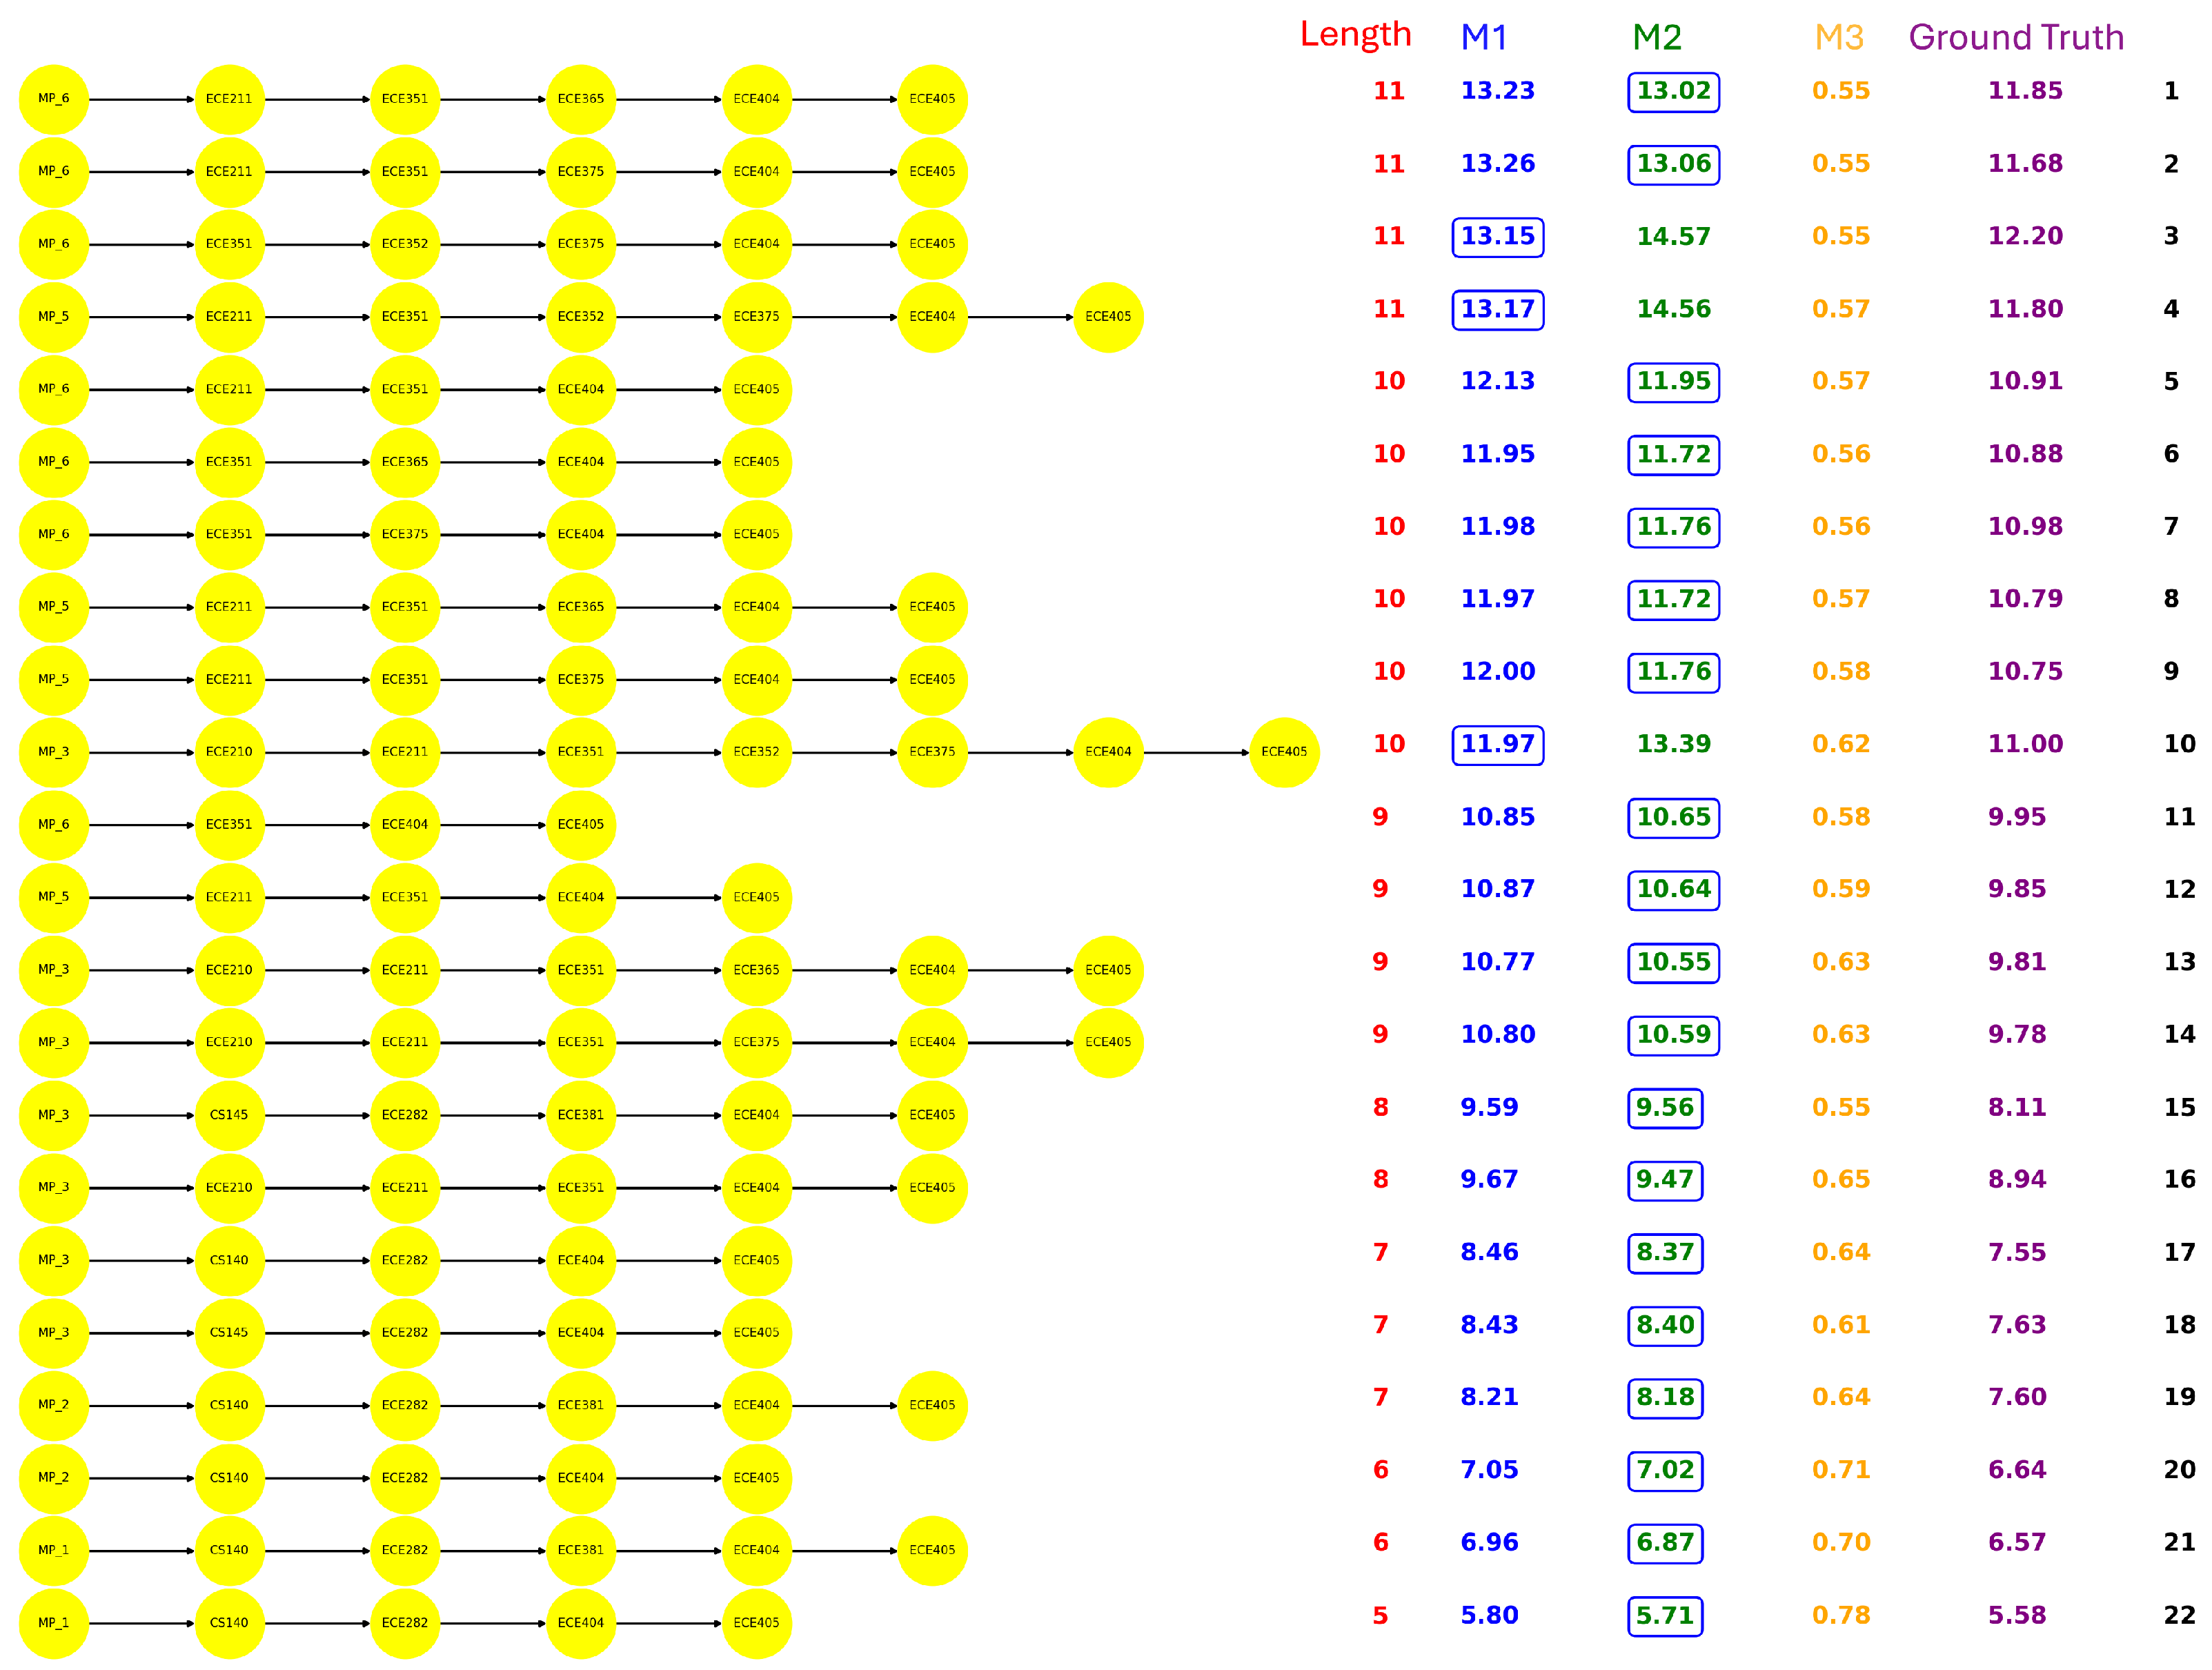
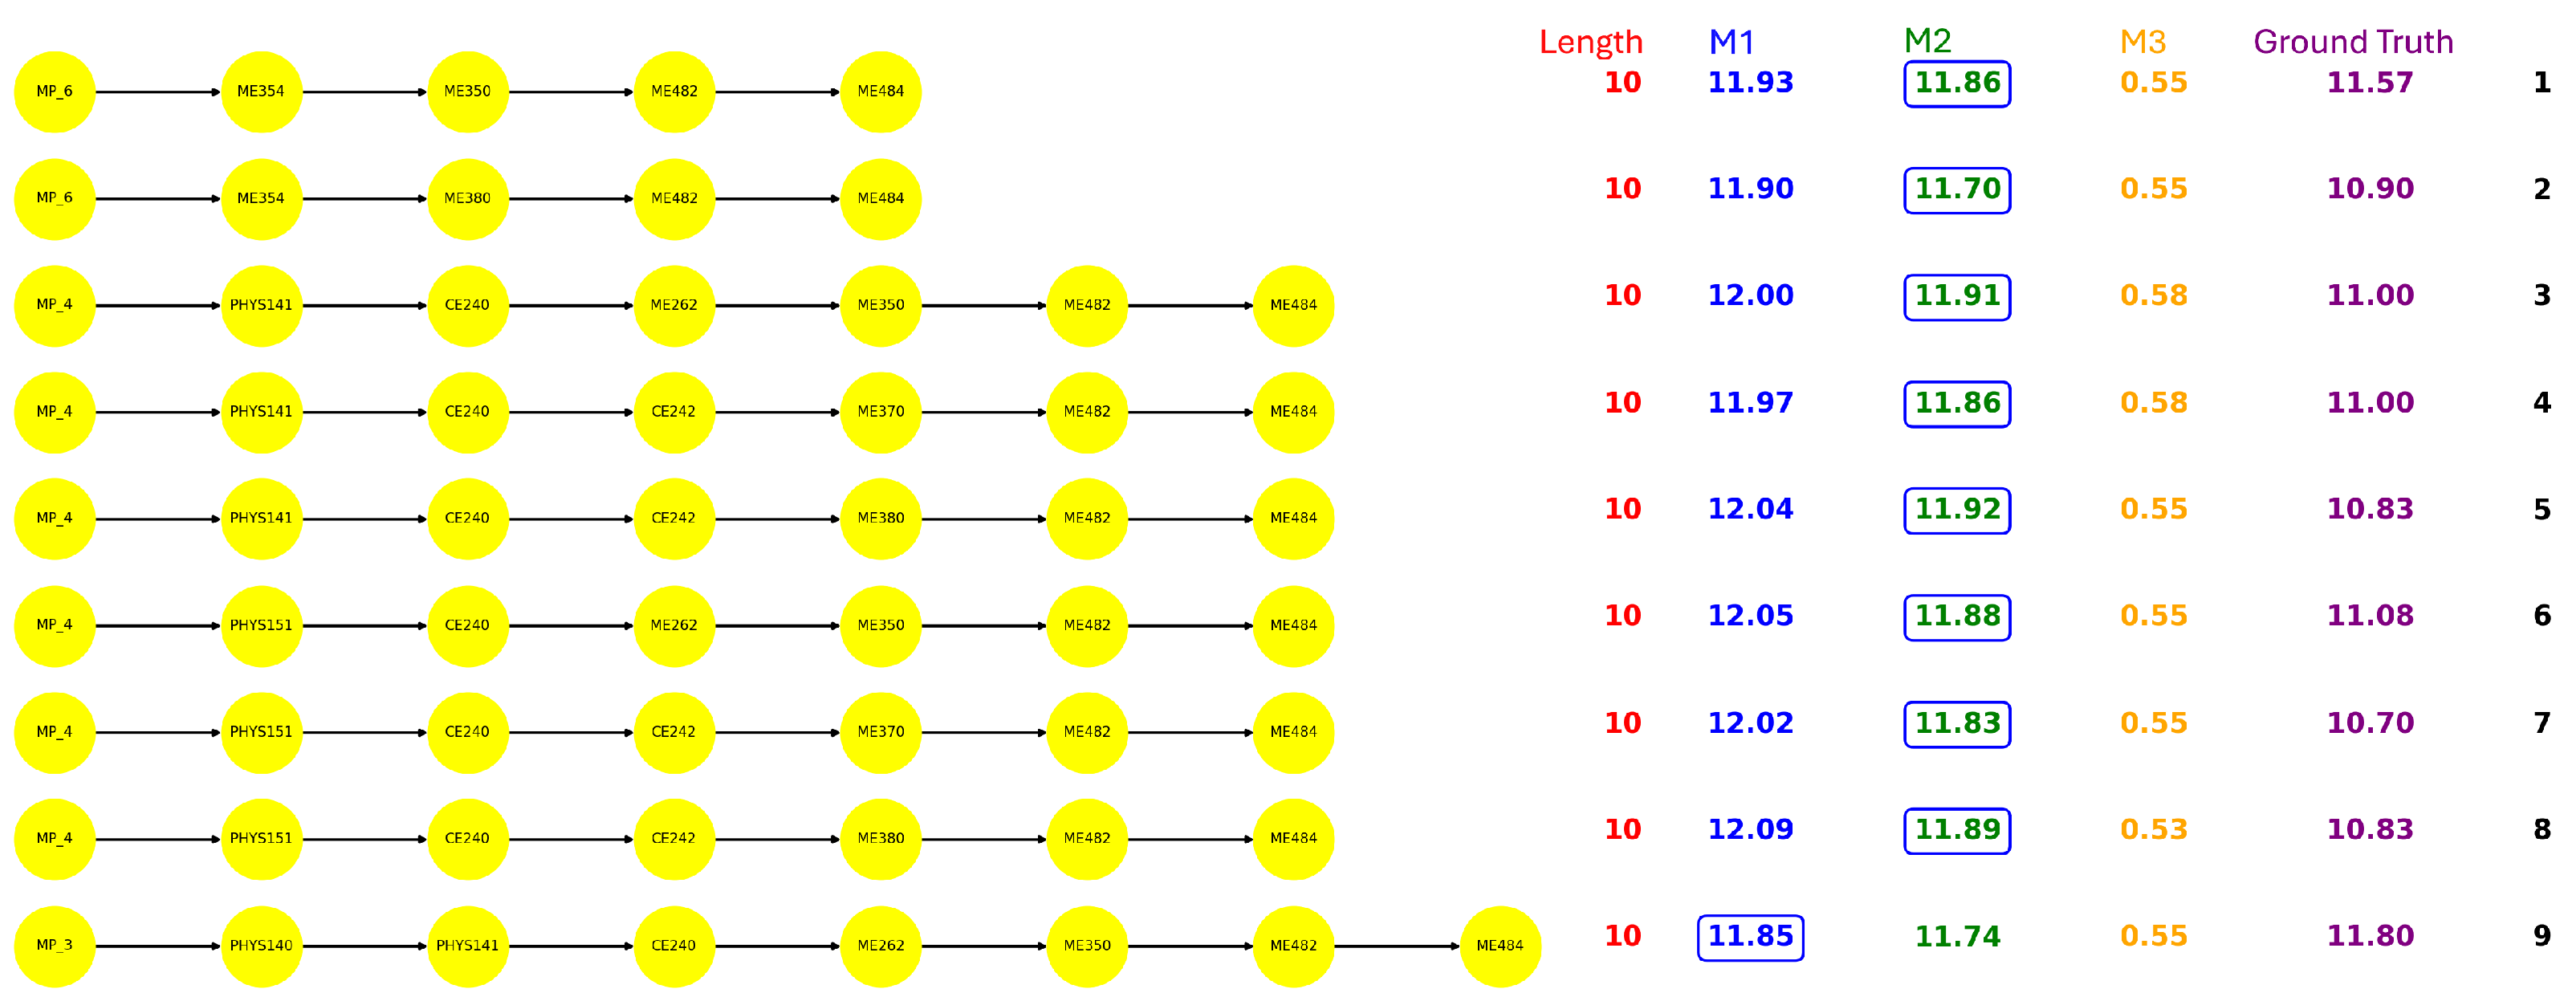
Figure 4,
Figure 5,
Figure 6 and
Figure 7 demonstrated all the prerequisite chains leading to the capstone course of each major. The paths beginning with head node
denote the math prerequisite chains, and
x indicates the length of the math chain. Specifically, the math chains refer to the segments of math path that begin with
MATH120 and typically progress through
MATH125 →
MATH150 →
MATH152 →
MATH250 →
MATH305. Regarding each path, the path length, the statistic results, and the actual semesters students took are presented. Notably, the ground truth is calculated by averaging the semesters taken by all students who completed the corresponding path. The estimations derived from M1 and M2 are evaluated against this baseline, with the closer estimate highlighted in the results.
Several noteworthy patterns emerge from the comparison of the paths in each major: Although the BIOL offers the largest number of courses, it has only six paths leading to the capstone course. In contrast, despite CS having the fewest courses, it exhibits a relatively larger amount of capstone paths. In addition, the path length also varies across majors. BIOL paths typically span seven to eight courses, CS ranges from three to nine, ECE from five to eleven, while all ME paths consistently contain ten courses. Furthermore, the math load requirements differ significantly among the majors, BIOL students generally need at most two math courses, CS requires three. ECE and ME demand a more intensive sequence of six math courses.
From the estimation perspective, we observe the advantage of the conditional probability model (M2) over the raw probability model (M1), as M2 yields estimates that are closer to the actual completion times for most of the paths. In the results, we circled the items that are closer to the ground truth.
M3 reflects the path completion rates by incorporating course repetition. A high M3 score indicates that a large proportion of students are eventually able to complete the path, even if it involves course repetitions. This suggests that the path has a degree of resilience, and students may struggle along the way, but institutional structures or course policies may allow them to recover and proceed. In most cases, when comparing paths with the same length, those with higher M3 scores tend to exhibit shorter completion times, while lower M3 scores are often associated with longer time. However, a high M3 does not necessarily imply efficiency, as repeated attempts may lead to longer actual completion times. In contrast, a low M3 score implies that failures along the path are more consequential, and students who encounter difficulties are less likely to recover and complete the path. This may reflect stricter prerequisites, bottleneck courses, or limited opportunities for retaking. Paths with low M3 score but short actual durations might reflect a subset of high-performing students progressing smoothly through more demanding trajectories. For example, path-5 and path-6 of CS (
Figure 5) have a passing probability of 0.58 and a completion duration of 8.50, while path-7 has a slightly higher passing probability of 0.62 but a longer duration of 8.81. Another example can be seen in path-11 of ECE (
Figure 6), which has a passing probability of 0.58 and a completion duration of 9.95, while path-10 has a slightly higher passing probability of 0.62 but a longer duration of 11.00.
We also found some inner patterns for each major:
BIOL: The paths start with CHEM prerequisites have a lower completion rate than those start with MATH.
CS:
- –
The computer architecture and system design pathways (CS286 (Intro to computer organization and architecture) →CS314 (Operating System)) is more challenging than software development and application pathways (CS234 (Web development) → CS325 (Software Engineering)).
- –
The pathways leading from MATH224 (Discrete Mathematics) → CS340 (Data Structures) is more challenging than the pathway from CS150 (Introduction to Computing I) → CS340 (Data Structures), as it builds on abstract reasoning and mathematical rigor which increases the overall cognitive load.
ECE: As shown in ECE (
Figure 6), path-15 has the lowest passing probability of 0.55, yet it is relatively short, indicating that it represents one of the most challenging trajectories within the ECE curriculum.
ME: Almost all ME paths incorporate Civil Engineering (CE) courses such as CE240 (Statics) and CE242 (Mechanics of Solids), which are foundational but challenging. These courses are common prerequisites across the ME curriculum.
When comparing majors, BIOL and ME have a similar number of paths leading toward their respective capstone courses. However, the paths in ME are more difficult. The average passing probability for ME is around 56%, while BIOL has a higher average passing probability of approximately 64%, highlighting a greater overall challenge in the ME curriculum. Additionally, the overall completion rates for CS and ECE are comparable.
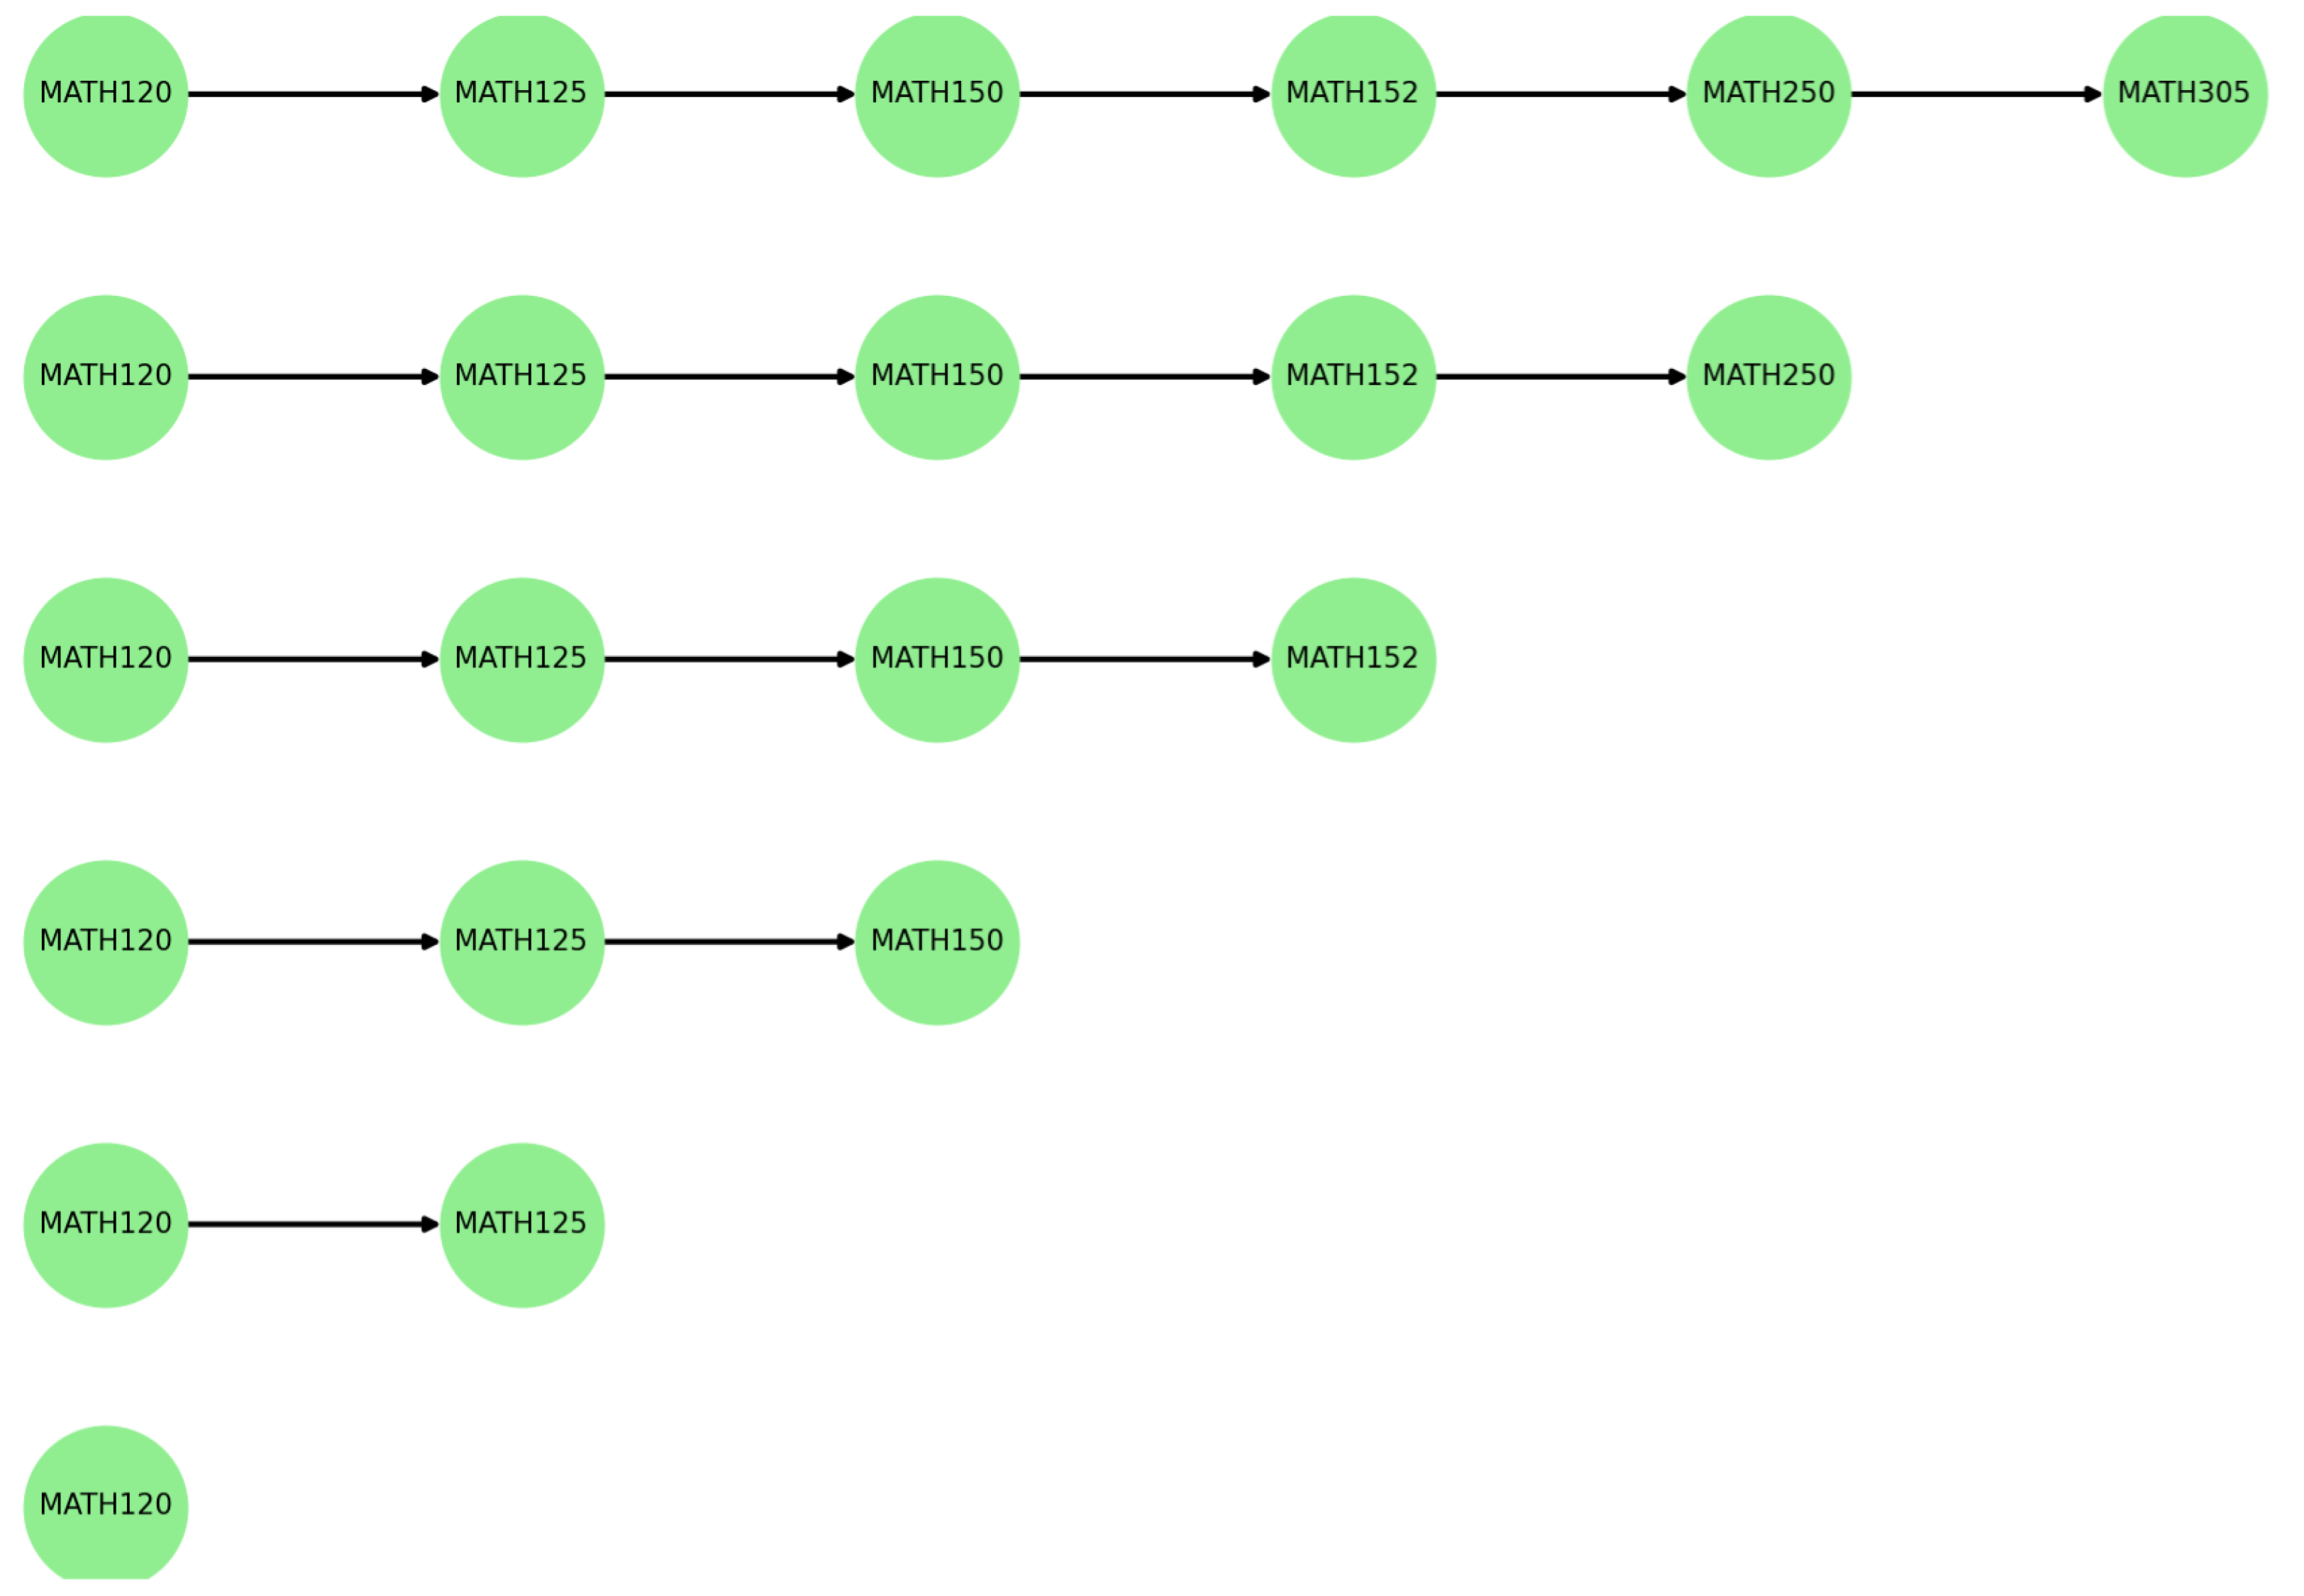
The previous analysis was based on students who complete the entire prerequisite path, meaning all courses along the path were completed. However, students may often have varying mathematical backgrounds and may not be required to complete every foundational math courses. For instance, some students may be exempted from precalculus courses such as MATH120 or MATH125 through college placement exams (such as AP exam), allowing them to start directly with a higher level math course and enter major-specific courses earlier. This enables them to access upper-level content sooner and potentially graduate in a shorter time.
To account for this variation, we also conducted a focused analysis on the influence of each individual math course as a starting point, aiming to understand how different entry levels in the math sequence affect curricular coverage and progression across majors.
Figure 8 shows the math prerequisite path from
MP_1 to
MP_6, and
Table 8 presents the average graduation duration associated with each entry point. Theoretically, adjacent starting points should correspond to a one-semester difference in overall duration. However, as highlighted in
Table 8, we noticed cases where this difference exceeds one semester, suggesting that placing out certain math courses may lead to faster graduation outcomes. This feature is particularly notable in
ECE major.
4.5. Grade Transition Results
To supplement analyses of critical paths, we focused on
values (as described in
Section 3.2.4) to further hone in on which specific prerequisite
X to course
Y pairs are important candidates for further examination by the relevant departments. While we understand that the
values are not normalized according to each individual course’s grade distribution, we nonetheless find these values to be a useful indicator of the likelihood that a student who succeeded in a prerequisite
X might exhibit worse performance in subsequent course
Y. In
Section 4.4, we analyzed the patterns along paths across different majors. The grade transition results in this chapter to some extent echo and support those observed patterns.
Table A2,
Table A3,
Table A4,
Table A5 and
Table A6 show fall values for course pairs existing along critical paths, separated by major and sorted maximum to minimum
value.
In the BIOL major, we found that the load of paths start from MATH prerequisites are less than the load of paths start from
CHEM113. In terms of
score, we can clearly see that the transition from
CHEM113 to
CHEM121A yields the highest
score (0.619), significantly higher than the transitions start from MATH courses (as shown in
Figure 9).
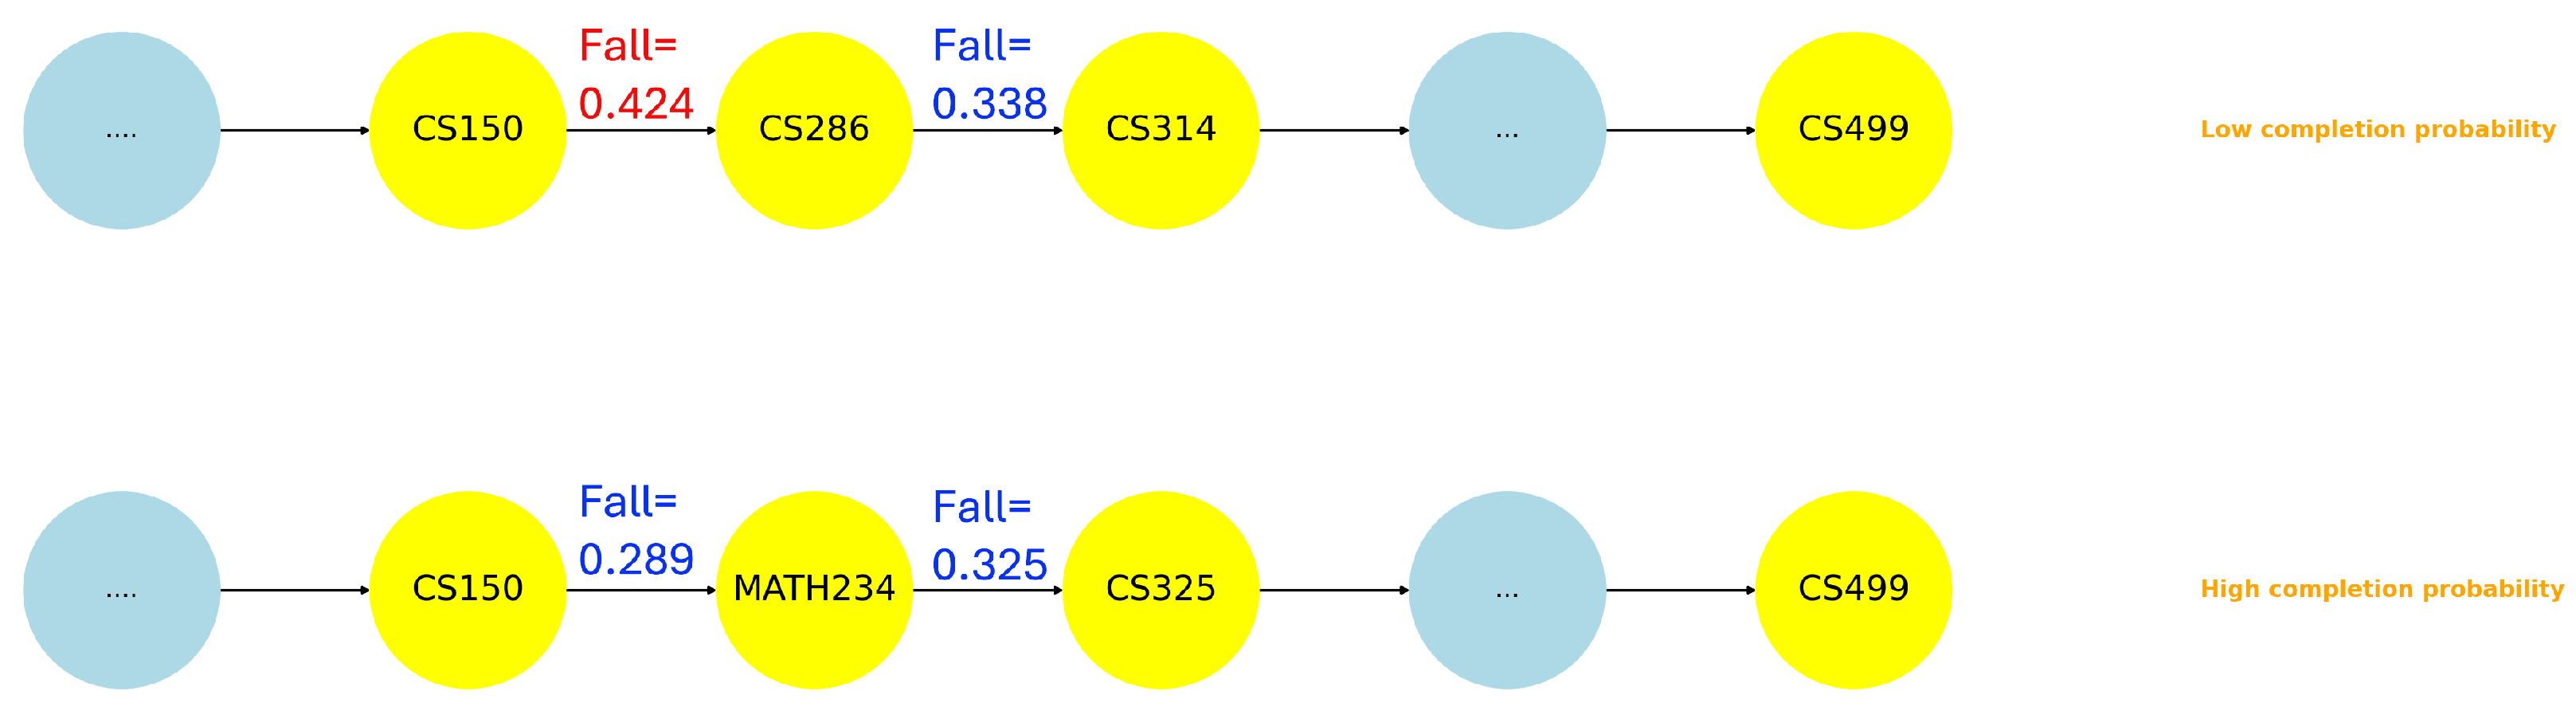
Similarly, in the CS major, we found that the grade transition results also corroborate the pathway patterns. Firstly, the sub-path from
CS140 to
CS340 via
MATH224 is more challenging than the one through
CS150. As highlighted in
Figure 10, the bottleneck between
CS140 and
MATH224 is the reason. Secondly, we have identified that the Software Engineering sub-path is easier than the Architecture and Operating System sub-path. As shown in
Figure 11, here we also found the corresponding performance drop down between
CS150 and
CS286.
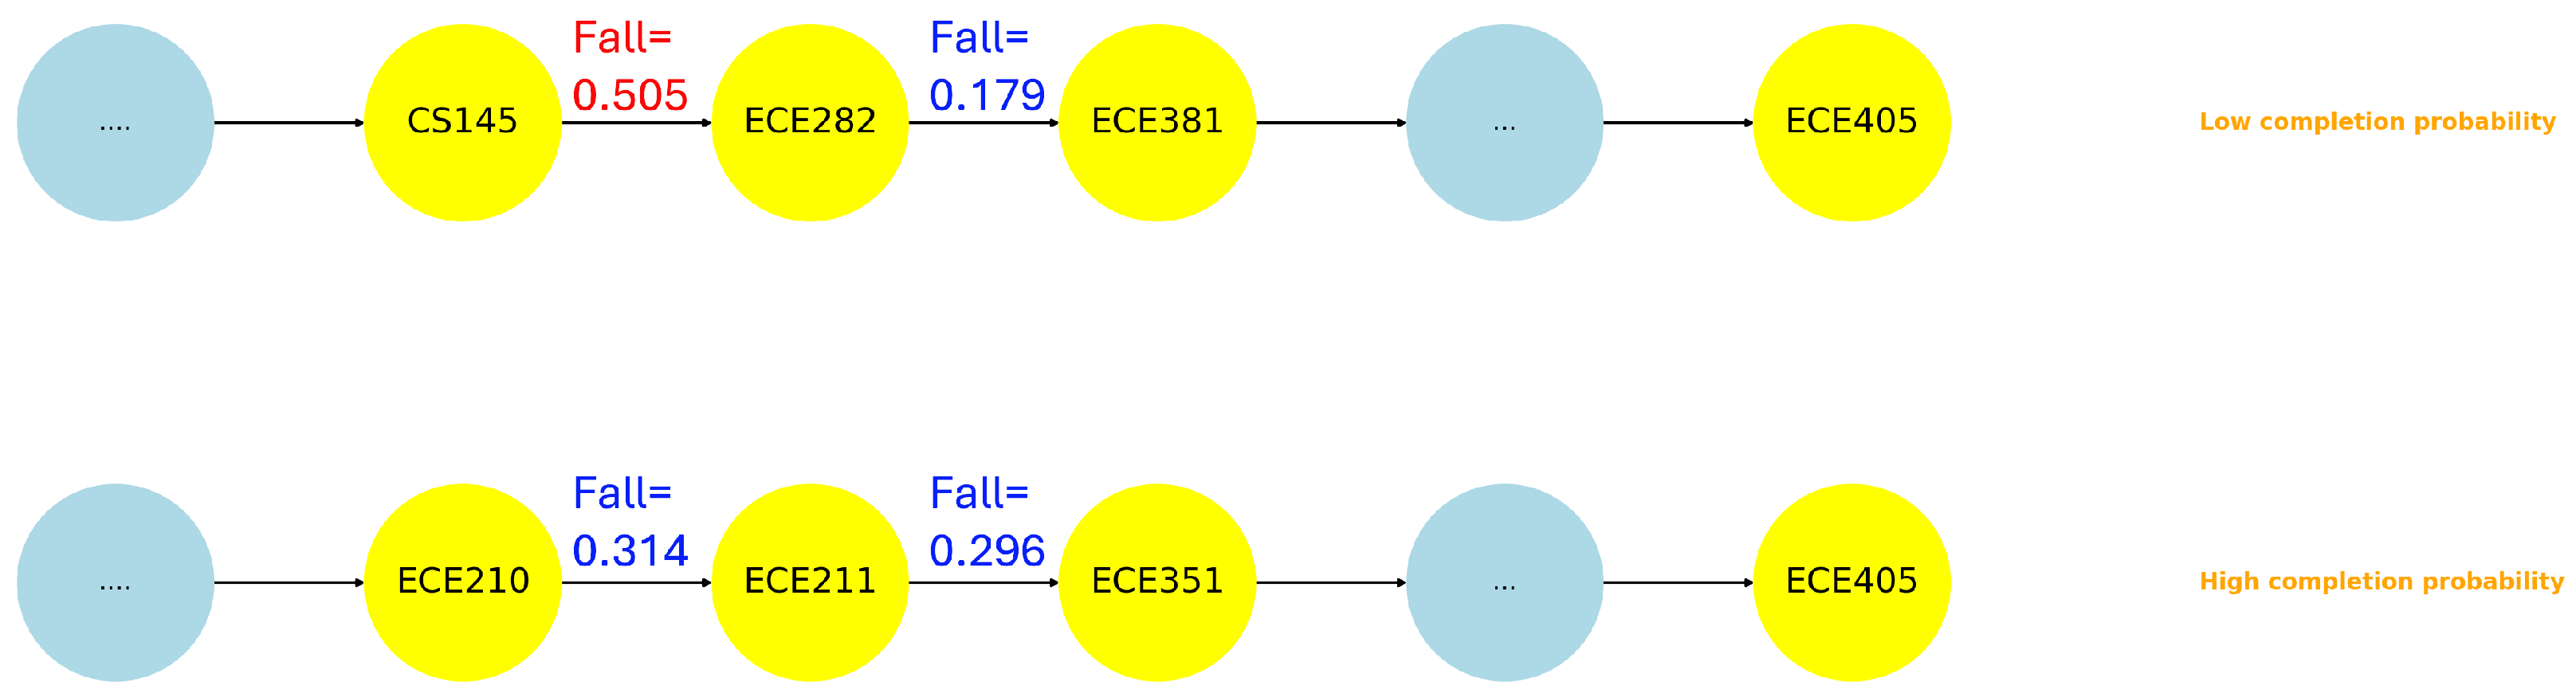
For the ECE major, as we noticed that under the same path length (Path-15 and Path-16 in
Figure 6), the subpath of
CS145 → ECE282 → ECE381 is significantly more challenge than the subpath of
ECE210 → ECE211 → ECE351. The barrier occurs between
CS145 and
ECE282, which yields the second-highest
factor (0.505) among all ECE course pairs (
Figure 12).
As for the ME major, although the relationship between paths and student performance is not as evident as other majors, we still observed some noteworthy patterns. In particular, as shown in
Table A5,
ME354 appears to serve as a major bottleneck, as both of its transitions
ME354 → ME380 and
ME354 → ME350 exhibit the highest
scores (0.571 and 0.565, respectively) among all course pairs in the ME curriculum.
5. Discussion
In our effort to model curriculum structure in conjunction with student performance data, the analysis unfolded in a progressive manner. We started from understanding the curriculum structure by decomposing CPN to extract two type of major level subgraphs, MIG_R and MIG_C, and performed centrality analyses on each of them to identify structurally important courses, those that function as hubs or bottlenecks. These courses occupy central positions within the prerequisite structure and thus warrant special consideration in curriculum planning. Interestingly, we observed that some courses, while not centrally located in the overall MIG_R graph, serve as critical transition points on the pathways to capstone courses in MIG_C. In our cases, CS234 and ECE282 play pivotal roles in enabling capstone completion, despite their relatively peripheral positions in the broader curriculum. This discrepancy originates from the curriculum structure itself, yet is often overlooked in conventional curriculum analysis, which typically emphasizes global course importance rather than path-dependent structural roles.
Although centrality measures provide valuable insights into the overall organization of the curriculum, they do not fully capture the practical challenges students face in completing certain courses. For example, hubs primarily reflect how many direct prerequisite relationships a course has, indicating its local connectedness. Betweenness centrality, on the other hand, measures how often a course lies on the shortest paths between other courses, reflecting its bridging role in the curriculum. Instead, the
metric provides a more cumulative view, quantifying how extensively a course impacts the curriculum by measuring the number of downstream courses that depend on it. When combined with pass rate, Reach enables a more nuanced understanding of both structural importance and real-world difficulty, highlighting courses that are not only influential but also difficult to complete. From our observations in
Section 4.3, we found that,
MATH150 consistently domains the significantly influential position but with very low passing rate, making it a persistent high risk course. In contrast,
MATH120 also exhibits high
but maintains a relatively high pass rate, indicating that it functions as a stable and foundational course. In addition, although the vast majority of courses have pass rates above 70%, we still identified several exceptions like
BIOL444A, CS286, CS447, and CS314 that fall below this threshold. This clearly indicates areas where instructional support or curriculum adjustment is needed.
While the Reach–Pass Rate joint analysis addresses part of the concern regarding course impact, it leaves open the question of how challenges accumulate across entire prerequisite paths, shifting the attention from individual courses to prerequisite paths. We focused on particularly those leading to capstone courses, which ultimately determine whether students can graduate on time. Motivated by this, we proposed both independent (M1) and conditional (M2) passing probability metrics to estimate the number of semesters required to complete a given path. By comparing these estimations with actual student data, we found that the conditional probability model more accurately reflects real world outcomes. This fact is natural, as the conditional probability captures how performance in earlier courses influences success in later ones. In practice, students who struggle with earlier courses are more likely to face difficulties in downstream courses, while those who perform well early on tend to maintain higher success rates throughout the path. By progressively adjusting the passing probabilities along the sequence, the M2 model more accurately reflects this cumulative and dependent nature of course progression. Here, we emphasize that M1 and M2 estimations are not meant to replicate actual course schedules, but to provide a standardized abstraction that assumes students take one course per term, in line with prerequisite logic.
Besides the completion time estimation, we also introduced the path completion probability metric (M3), which focuses on path survivability. M3 captures the overall likelihood that a student eventually completes a given path, regardless of the number of attempts. Beyond measuring resilience, the M3 score also serves as a useful indicator for comparing the relative difficulty of different paths. Paths with lower M3 scores are generally more difficult due to potential bottlenecks. We captured several major-specific patterns, such as in the BIOL major, paths beginning with CHEM prerequisites tend to have lower completion rates than those starting from MATH; in CS, the computer architecture and systems path (CS286 → CS314) is consistently more challenging than software development path (CS234 → CS325), and so on. These patterns warrant the attention of curriculum designers, as they highlight structural disparities that may affect student progression.
Furthermore, we observed that students who start with more advanced math courses tend to graduate in less time. While theoretically skipping a course should reduce the timeline by just one semester, in CS, ECE, and ME majors, the average time saving exceeds that. Since bypassing foundational math courses typically requires placement exams, these students likely already possess strong mathematical skills. Given that foundational math courses serve as root prerequisites for nearly all STEM majors, this finding further reinforces the hypothesis that stronger math preparation leads to more efficient degree completion.
Finally, the grade transition analysis offers a new perspective on students’ learning continuity across prerequisite course links. Unlike pass/fail indicators, the metric captures more subtle shifts in performance. High values indicate that a significant number of students experience grade drops after completing a prerequisite course, often signaling issues such as poor conceptual alignment, curricular disconnects. Notably, these high course pairs often align with the path pattern that identified earlier. For example, CHEM113 → CHEM121A in BIOL, CS140 → MATH224 and CS150 → CS286 in CS, and CS145 → ECE282 in ECE emerge as critical bottlenecks. These course pairs consistently perform poorly in both path flow and performance continuity, suggesting they are key points where students are likely to fall behind. As such, the Fall metric serves as a valuable diagnostic tool to pinpoint targets for pedagogical intervention such as refining instructional content or adjusting prerequisites to enhance student performance in subsequent courses and improve overall path completion.
6. Conclusions
In this work, we introduced a set of nuanced approaches for assessing curriculum structure, learning pathway feasibility, and grade transition pattern by integrating transcript data with the course prerequisite network. The results reveal that some courses serve as critical hubs not only due to their structural position, but also due to their low pass rates at these key junctures. The introduction of the grade transition pattern offers a novel view to measure the continuity of academic performance between prerequisite and subsequent courses, with the factor effectively identifying points where performance tends to decline.
Despite these contributions, our study still has several limitations. The analysis is based on historical records from four majors at a single public university, and the prerequisite structures themselves are relatively simple. As a result, the number of distinct paths and structural patterns available for comparison is inherently small. In our future work, we plan to incorporate data from more institutions to enable comparative studies across different curricular designs, which will help uncover more generalized and transferable patterns.


 ,
, 

