1. Introduction
The energy resources and power loads in China exhibit a notably reverse distribution pattern. With the increasing volume and diversity of power loads, coupled with the large-scale integration of renewable energy sources characterized by volatility and uncertainty, the scale of cross-regional power transmission has expanded significantly to ensure reliable energy development and power supply to load centers [
1,
2]. High-voltage direct-current (HVDC) transmission, due to its advantages in large-capacity and long-distance power transmission, has been implemented as part of the national “West-to-East Power Transmission” strategy and the expansion of the grid’s scale. Ultra-high-voltage direct-current (UHVDC) transmission lines have begun operation, demonstrating initial effectiveness in enhancing the controllability of power flow and suppressing short-circuit currents [
3,
4]. However, the relatively immature development of UHV AC grids has led to insufficient system reserve capacity, potentially resulting in a “strong DC, weak AC” state. This state means the coupling strength between the DC system and the AC system is weak, while the coupling between the DC systems is strong, meaning that the electrical connection between the DC systems is relatively tight, while the connection with the AC system is more loosely coupled, making it difficult to effectively support the stable operation of the system’s power transmission. When the system exhibits the “strong DC, weak AC” phenomenon, the AC grid is relatively weak, with insufficient inertia response and dynamic reactive power support capabilities, making it difficult to dampen system frequency/voltage fluctuations caused by renewable energy fluctuations or sudden load changes. With the introduction of renewable energy, this poses significant risks to the operational security of the power flow, frequency stability, voltage stability, and synchronous stability of the system [
5,
6].
The replacement of AC transmission lines with DC systems can also increase the electrical distance between the systems at both ends of the line, accompanied by a significant reduction in the capacity and inertia of the AC systems [
7]. The increased electrical distance, which reflects reduced electrical coupling and weakened AC interconnection, means lower power flow regulation capability, weaker power support, and heightened risk of power imbalance. Consequently, the frequency and synchronization stability of the system are compromised [
8]. It is evident that AC/DC hybrid transmission systems represent a rational approach, balancing the requirements for power flow control and short-circuit current suppression. However, the growing reliance on DC transmission technologies also introduces threats to the static/transient stability of grid operation. The existing flexible DC systems have already played a certain supporting role in both the sending and receiving ends of the power grid. The support role of flexible DC at the receiving end of the grid is mainly reflected in transient voltage support, frequency regulation, and the improvement in the equivalent short-circuit ratio of multiple DC systems [
9]. The flexible regulation capability of flexible DC transmission can provide frequency support for the grid [
10] and offer reactive voltage support to the grid during faults [
11], helping to enhance grid stability. Due to its highly flexible and controllable positive and negative sequence current closed-loop control technology, flexible DC can precisely control the current level injected into the grid in real time [
12]. It actively and quickly adjusts the output current based on grid operation requirements, alleviating short-circuit current risks. However, after the introduction of DC systems, system stability becomes highly dependent on the control technology of the devices. With the rapid increase in the proportion of electronic power equipment, and due to the relatively weak overload capacity, the system’s ability to withstand fault disturbances is reduced, which also increases the risks to the system’s safety and stability [
13]. To ensure operational stability under different conditions, a fault detection method based on circulating current suppression controller compensation and a control method based on modulation signal correction have been proposed [
14].
Existing research has predominantly focused on stability constraints. Scholars have investigated methods for determining the overall scale of synchronous power grids under multiple stability constraints from the perspective of system stability [
15]. In addition to the overall scale of synchronous grids, the rationality of power flow distribution between AC and DC lines also serves as a critical factor determining operational stability under fault conditions [
16], making the balance between AC and DC system strengths imperative. As such, the AC/DC strong–weak balance principle is essential. Therefore, as DC lines continue to be integrated into power systems, coordinated planning strategies for AC/DC hybrid grids must emphasize the coupling characteristics of hybrid AC/DC systems to meet the requirements for AC/DC balance and stability. In recent years, optimization and planning studies have been conducted in the areas of operational stability and power flow security in power systems. In the stability domain, traditional power system planning methods have primarily focused on static security constraints or reactive power optimization, addressing static stability issues, which makes it difficult to meet the dynamic stability requirements of future low-inertia power systems [
17,
18]. To improve grid operational safety, some studies have incorporated the N-1 security criterion into planning models to reduce the potential security risks of the system [
19]. The N-1 power flow security constraints were quantified and included in the planning objectives to achieve integrated source–network planning in reference [
20]. However, there is still a lack of research on planning schemes that comprehensively consider multidimensional stability and security constraints.
However, with the increasing concentration of loads in receiving-end power grids, the concentrated UHVDC systems feed into terminal grids, deepening the coupling between DC systems. Meanwhile, the large-scale integration of renewable energy sources will lead to a decline in system inertia and regulation capabilities. When a disturbance occurs in one DC system, it may trigger cascading failures like commutation failure, the maloperation of protection devices, and DC blocking in adjacent DC lines, posing significant risks to system operational security and stability [
21,
22]. Thus, the operational safety and stability of strongly coupled DC systems need urgent attention. Considering the electrical distance and parameter differences between DC systems, effectively evaluating the coupling degree between multi-DC systems remains a major research challenge. The current main indicator for assessing mutual influence among multi-DC systems is the Multi-Infeed Interaction Factor (MIIF) [
23]. Nevertheless, this indicator requires simulation-based derivation and lacks clear physical interpretation, failing to explain the underlying mechanisms of interactions between multi-DC systems. Additionally, it cannot meet the growing demand for evaluating multi-DC couplings with increasing numbers and diverse parameters.
The traditional MIIF is used to quantitatively describe the impact of each power source on system stability when multiple sources are integrated into the grid. MIIF can only reflect the electrical distance between any two nodes in the system and does not take into account the impact of the equipment’s own control strategies on voltage–reactive power. It also fails to consider the influence of DC dynamics during transient faults [
24], making it difficult to reflect the voltage–reactive power relationships between devices.
In strongly coupled multi-DC systems, the simultaneous commutation failures of multi-DC lines can cause the receiving-end power grids to lose massive power in a short time, potentially leading to grid collapse in severe cases. Disconnecting AC lines between DC infeed points can increase the electrical distance between DC systems, mitigating simultaneous commutation failures in multi-DC systems. However, simply disconnecting AC lines may not meet system power transmission requirements. Therefore, existing AC lines could be replaced with embedded DC systems to reduce electrical coupling between multi-DC systems while maintaining transmission capacity [
25]. Currently, determining optimal siting strategies for such embedded DC systems remains an urgent challenge.
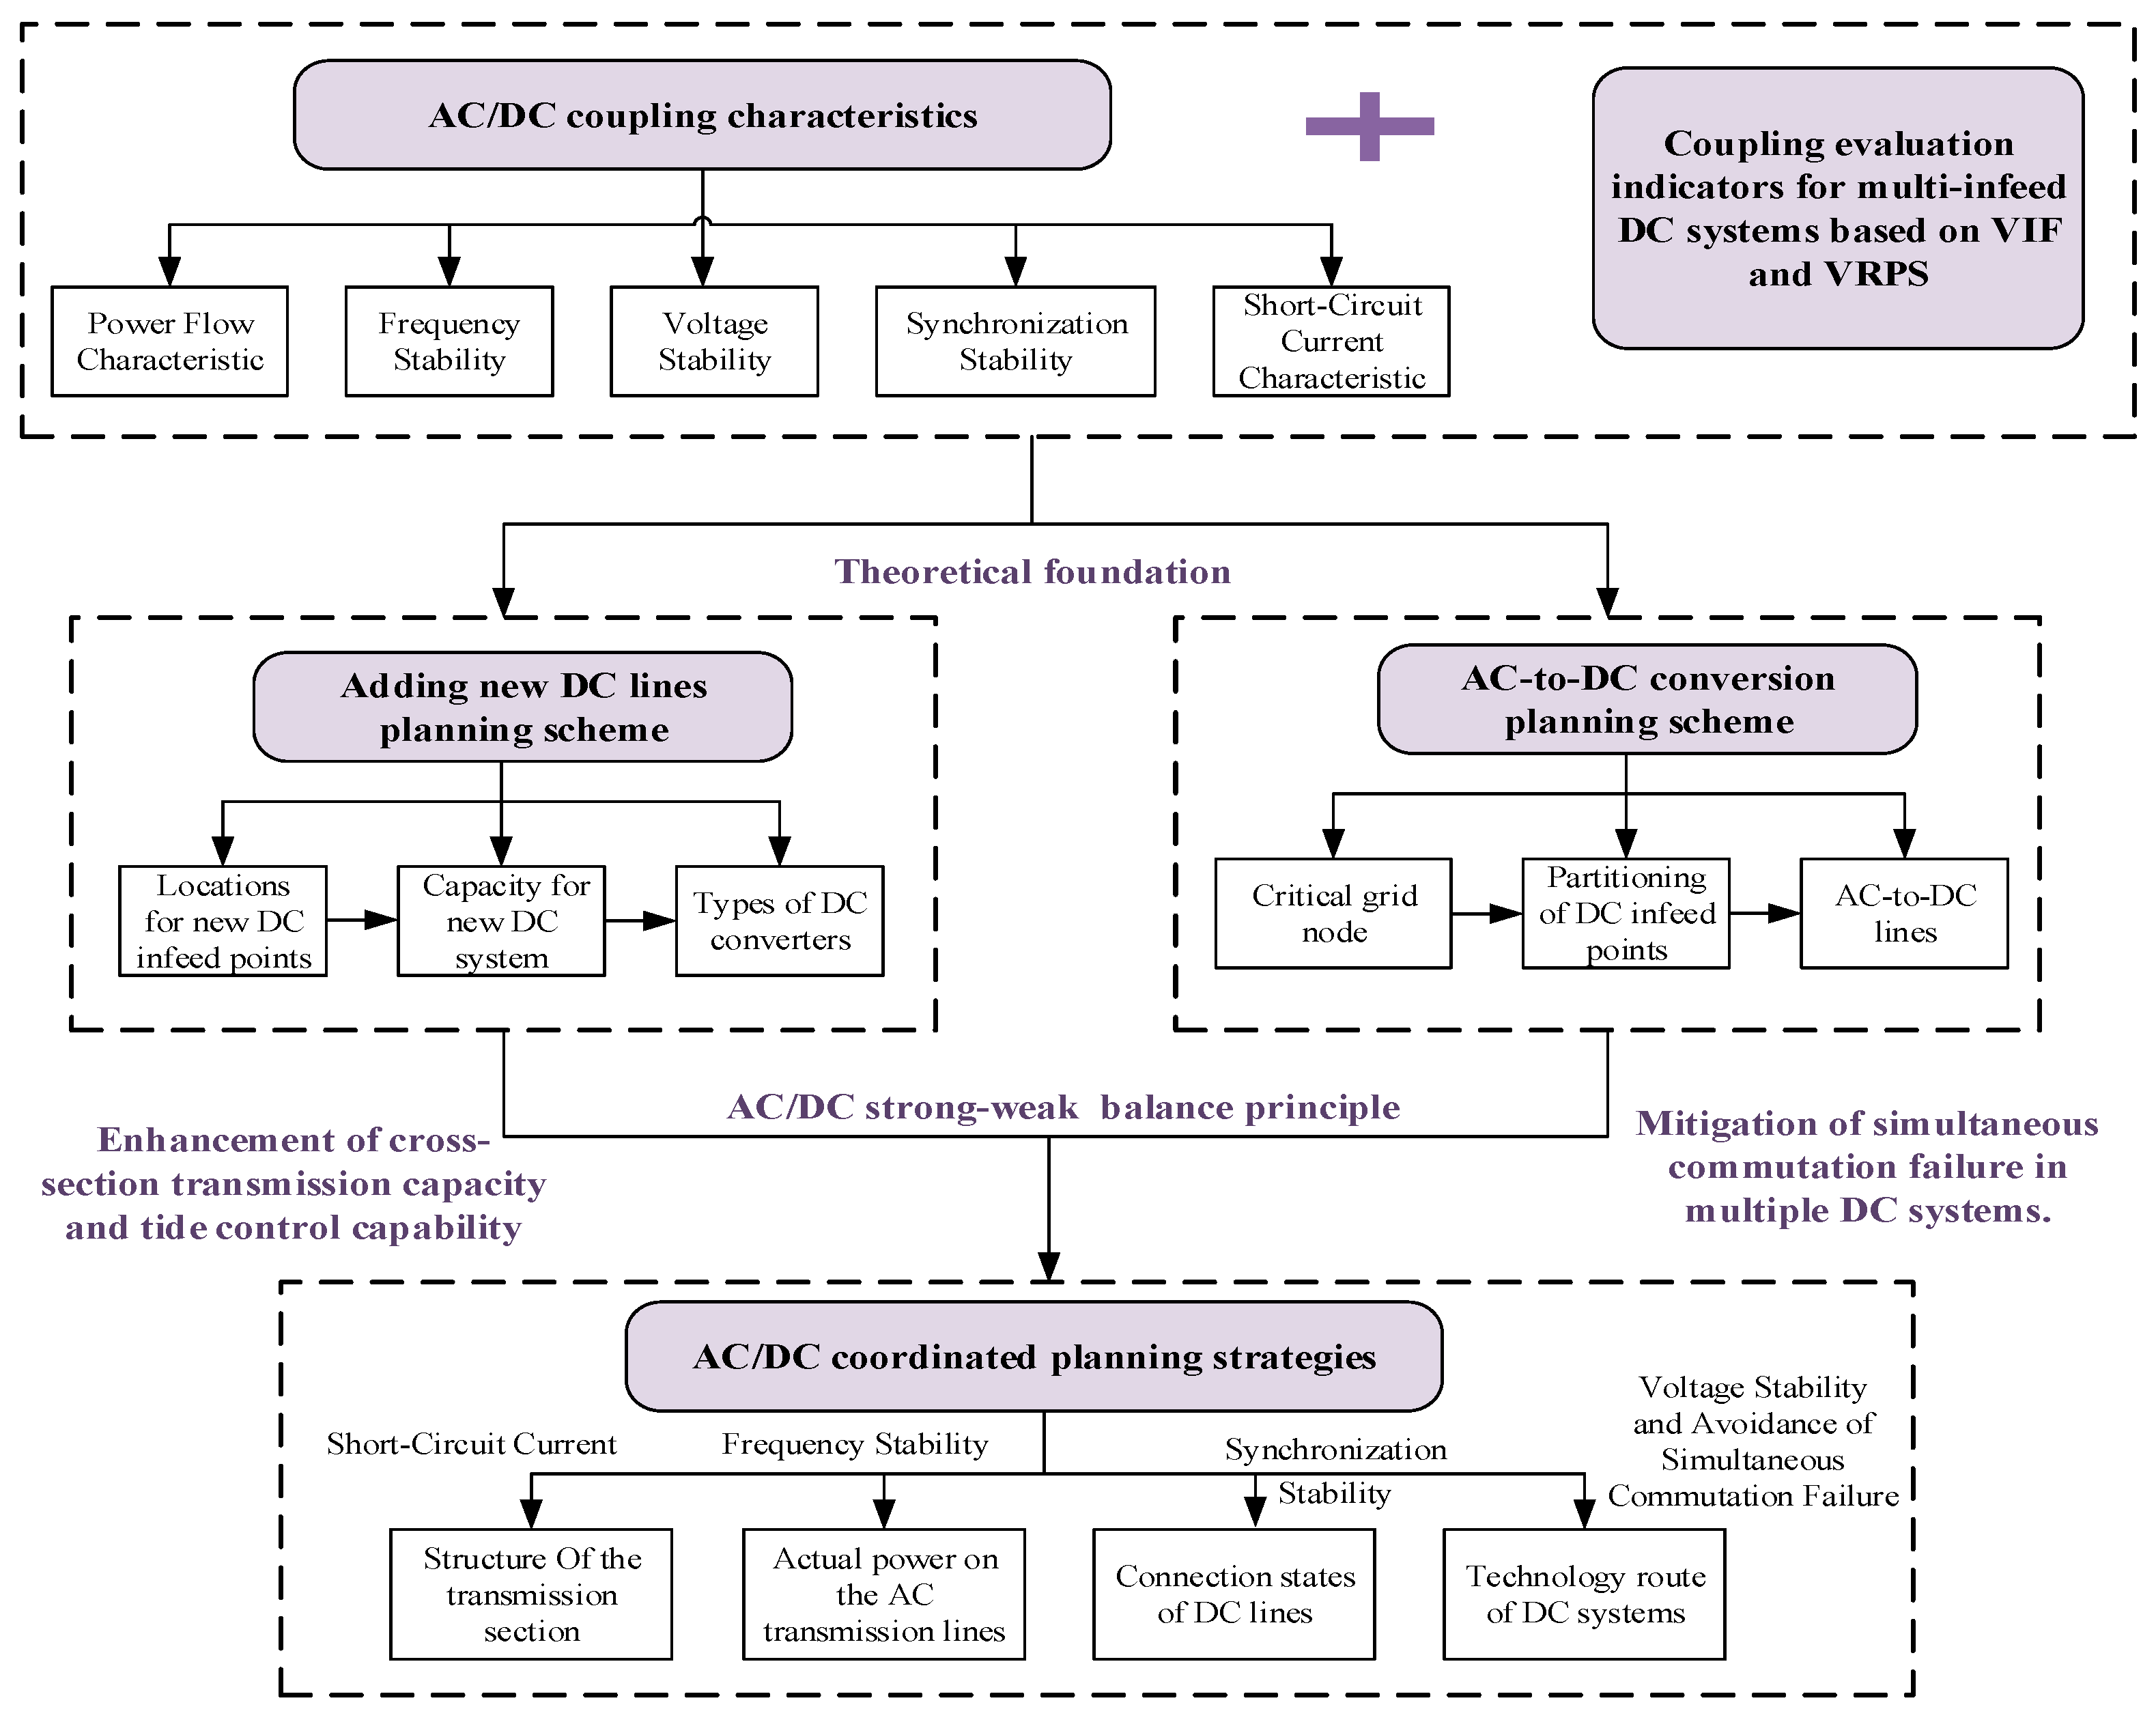
First, this paper proposes evaluation indicators and assessment schemes aimed at analyzing the coupling characteristics between AC and DC systems and among multiple DC systems within AC/DC hybrid transmission systems. To enhance the operational stability of AC/DC hybrid transmission systems, a planning scheme for adding new DC lines is developed by integrating the operational characteristics of AC/DC hybrid sections and adhering to the AC/DC strong–weak balance principle. Building on this foundation, multi-DC coupling degree evaluation is conducted on the hybrid system. An AC-to-DC conversion planning strategy and a strategy for adjusting DC system technology route are proposed to address the challenge of simultaneous commutation failures in multi-DC systems, culminating in coordinated planning strategies tailored to multi-infeed AC/DC hybrid systems. The proposed strategies meet the safety and stability requirements of AC/DC hybrid grids and are adaptable to the future integrated development of AC/DC transmission systems. The logical framework diagram for the research of this paper is shown as
Figure 1.
2. AC/DC Coupling Characteristics in Systems
Significant changes have occurred in the sources, loads, and network structure of power grids, exhibiting the diversification of grid sources and load types, the massive integration of highly volatile and stochastic renewable energy sources, and the increasing complexity of grid topology. To ensure the real-time dynamic power balance between sending and receiving-end power grids under diverse power sources and loads, while meeting the demand for renewable energy consumption, AC/DC hybrid transmission systems have been vigorously developed. However, the complex topology structure of AC/DC hybrid systems has intensified the coupling of operational characteristics, posing severe challenges to system stability. Against this backdrop, clarifying the relationship between AC/DC power flow distribution and the safe and stable development of AC/DC hybrid systems represents a critical technical challenge.
2.1. The Power Flow Characteristic
To enhance power flow control capabilities, various power flow control technologies have been proposed. While FACTS devices, commonly used in engineering, improve power flow regulation to some extent by modifying line parameters, they fail to fully address the inherent limitations of AC transmission lines. Therefore, DC lines with controllable power flow characteristics need to be introduced. Consequently, the controllability of power flow in AC/DC hybrid transmission sections depends on the degree of DC integration, which is positively correlated with controllability. However, during DC faults, power flow transfers between AC and DC channels can cause a surge along AC lines. When the power flow margin of AC lines is insufficient, N-1 overload phenomena will occur. Thus, maintaining power flow balance across AC and DC channels is critical for ensuring normal power flow transmission under different operational conditions.
2.2. Frequency Stability
When an N-1 DC line fault occurs, the power flow from the faulted line is transferred to the remaining AC lines in the section. Designing sufficient power flow transmission margins for AC lines can mitigate frequency disturbances caused by DC line faults. However, when an AC fault occurs and the capacity of the remaining AC lines is insufficient to fully accommodate the transferred power flow of the faulty line, the power imbalance between the sending-end and receiving-end power grids will induce system frequency impacts. Therefore, during the planning phase, it is essential to verify the system’s frequency stability.
2.3. Synchronization Stability
The synchronization stability between sending-end and receiving-end power grids primarily depends on the strength of the AC system. When the AC system is weak, after a commutation failure caused by a DC system blocking fault or an AC system short-circuit fault, the unbalanced power resulting from the interruption of DC power transmission cannot be eliminated by the AC tie lines. This will lead to a continuous increase in the power angle difference between the two grids. In severe cases, the power angle of the system will become unstable, destroying the synchronous stability. This is accompanied by significant frequency fluctuations. Therefore, ensuring the strength of the AC section is the key to maintaining the synchronous stability of the systems.
2.4. Voltage Stability
The introduction of DC lines into AC transmission sections reduces the number of AC tie lines, weakening mutual support with other regions and diminishing frequency assistance. This results in degraded voltage support for converter buses and heightened voltage risks during faults. Therefore, system voltage stability reflects both power support capabilities and frequency stability, making it a critical indicator when determining the introduction volume of DC lines.
2.5. The Short-Circuit Current Characteristic
The construction of hybrid AC/DC sections requires the consideration of steady-state operation, power flow characteristics under N-1 line contingencies, and system frequency/synchronization/voltage stability, but also of the short-circuit current, which is a critical characteristic requiring focused assessment. As the AC section expands, the short-circuit current margin continues to decrease, and the risk of exceeding short-circuit current during faults rises sharply. The short-circuit current is a major limiting factor for the expansion of the transmission scale. Introducing DC serves as an effective means to suppress the short-circuit current in the power grids. Consequently, the short-circuit current margin is also a key factor to be considered when building the AC/DC hybrid sections.
3. Multi-DC Coupling Characteristics in Systems
In hybrid AC/DC power systems, the coupling characteristics among multi-DC lines constitute a critical factor that cannot be ignored in terms of their impact on the system’s operational characteristics. Under the mutual influence of multi-DC transmission lines, the operational characteristics of multi-DC transmission systems exhibit high sensitivity to system voltage and absorb substantial reactive power from the grid during operation. Therefore, the voltage and reactive power dimensions can reflect the mutual influence of the multi-DC transmission systems. In the following discussion, an evaluation scheme is proposed for the coupling degree of a multi-DC systems based on the voltage interaction influence factor and the voltage-reactive power sensitivity.
The existing SCR reflects the strength of the grid’s connection to the integrated power sources, primarily measuring the ratio of the short-circuit capacity at the connection point to the power source capacity. MIIF is used to quantitatively describe the impact of each power source on system stability when multiple sources are integrated into the grid. SCR primarily analyzes the strength between the system and equipment from a structural perspective, and cannot reflect the interactive effects between devices. MIIF only reflects the electrical distance between any two nodes in the system and struggles to capture the voltage–reactive power relationship between devices. In contrast, VIF and VRPS focus on the device level, emphasizing the interaction between voltage and reactive power. They can directly reflect the impact of reactive power regulation from one power source on the voltage of neighboring sources or nodes, providing guidance for reactive power optimization and distributed power source control. The specific calculation process for the VIF and VRPS factors is as follows.
3.1. Constructing the Sensitivity Matrix of the Voltage Interaction Influence Factor
First, the active power increment of the DC system is set as ΔPdc, the DC increment is set as ΔIdc, and the sensitivity matrix of DC active power is set as JPdI. The sensitivity matrices of DC active power with respect to DC, voltage angle, and voltage magnitude are set as JPdI, JPdθ, and JPdU, respectively. For the AC system, the increments of active power, reactive power, voltage angle, and voltage magnitude are set as ΔPac, ΔQac, Δθ, and ΔU, respectively. The voltage changes at the i-th and j-th AC buses are set as ΔUi and ΔUj, respectively. The sensitivity matrices for AC active power with DC, AC reactive power with DC, AC active power with voltage angle, AC reactive power with voltage angle, AC active power with voltage magnitude, and AC reactive power with voltage magnitude and the Jacobian matrix are set as JPaI, JQaI, JPaθ, JQaθ, JPaU, JQaU, and JR, respectively.
The power flow balance equations are formulated for the AC/DC hybrid systems as shown in Equation (1).
When active power disturbances are neglected, the reactive power increment is given as follows:
where
JR denotes the Jacobian matrix. Assuming the change in reactive power injection at the
i-th AC bus in the AC system is Δ
Qi, with Δ
Qi ≠ 0 and Δ
Qj = 0 (
j ≠
i), the equation shown in Equation (5) is obtained.
Therefore, the voltage interaction factor
VIFji is defined as shown in Equation (6), where
VIFji represents the voltage interaction influence between the
i-th and
j-th AC buses in the AC system. When the reactive power of
i-th bus experiences a disturbance (
), the indicator
represents the proportional relationship between the voltage change at the
j-th bus and the reactive power disturbance at the
i-th bus.
The voltage interaction factor (VIF) is not only correlated with AC system load, equivalent impedance, coupling impedance, and DC system parameters, but also closely tied to reactive power compensation capacity. The VIF indicator quantifies the strength of mutual interactions between AC buses, bounded by 0 ≤ VIFji ≤ 1. When VIFji = 1, it indicates that two DC systems are connected to the same bus with zero electrical distance, meaning that the voltage is fully coupled. A higher VIFji value signifies shorter electrical distance between buses, leading to the stronger propagation of reactive disturbances and mutual voltage influence, while a lower VIFji corresponds to larger electrical distance and weaker voltage interaction. A VIF indicator value close to 0 indicates the existence of a large electrical distance between buses, weak reactive power disturbance influence, and negligible voltage interaction.
Thus, the VIF indicator is a specialized indicator for measuring the strength of the reactive power–voltage interaction between AC buses. It reflects the system’s ability to resist voltage disturbances. A high VIF value indicates that the system is more sensitive to reactive power disturbances, has weaker voltage stability, and may face the risk of local voltage collapse under larger disturbances.
3.2. Constructing the Voltage-Reactive Power Sensitivity Matrix
The voltage interaction factor (
VIF) reflects the electrical distance between two DC infeed points. However, the mutual influence between these DC infeed points also depends on system strength. If a DC infeed point exhibits high system strength, it indicates that there is strong voltage support from the external AC system, rendering the impact of other DC systems negligible. Relying solely on VIF cannot comprehensively characterize the reactive power–voltage coupling relationship between DC infeed points. Therefore, the voltage and reactive power sensitivity (
VRPS) is defined as shown in Equation (7).
where
VRPSji denotes the voltage–reactive power sensitivity between the
i-th and
j-th AC buses in the AC system, and Δ
Qi represents the variation in reactive power injection at the
i-th AC bus. If the
VRPS is large, a change in the reactive power of one DC system will significantly affect the voltage at another DC infeed point.
By combining the voltage interaction influence factor (VIF) and the voltage-reactive power sensitivity (VRPS), the mutual influence between two DC infeed points can be determined well. If both the values of VIF and VRPS are large, it indicates that the electrical distance between the two DC infeed points is short, and the strength of the external system is relatively low compared to that of the DC systems. In this case, a change in the reactive power of one DC system can significantly affect the voltage at the DC infeed point. If the VIF value is large while the VRPS value is small, it means that the electrical distance between the two DC infeed points is electrically close, but the strength of the external system is relatively high compared to that of the DC systems. Here, a change in the reactive power of one DC system has little impact on the voltage at the other DC infeed point, and the voltage at the DC infeed point mainly depends on the support of the external system. If both the values of VIF and VRPS are relatively small, it shows that the electrical distance between the two DC infeed points is long and their mutual influence is very small.
3.3. Constructing the First Relative Gain Matrix and the Second Relative Gain Matrix
Based on the voltage interaction influence factor VRPSji and the voltage-reactive power sensitivity mentioned above, different relative gain matrices are established.
3.3.1. The First Relative Gain Matrix
First, the first relative gain matrix is established using the voltage interaction factor (
VIF). By considering the voltage at one DC infeed point as the input and the voltage at another DC infeed point as the output, a multi-input multi-output system based on
VIF is formulated as shown in Equation (9).
where
ULCC denotes the vector of the DC infeed point voltage magnitudes, and
KVIF represents the coefficient matrix composed of voltage interaction factors.
The first relative gain matrix based on voltage interaction factors is then formulated as shown in Equation (10).
3.3.2. The Second Relative Gain Matrix
Similarly, by considering the reactive power of a DC system as the input and the voltage at another DC infeed point as the output, a multi-input multi-output system based on voltage–reactive power sensitivity (
VRPS) is established as shown in Equation (12).
where
QLCC denotes the vector of reactive power from DC systems, and
KVRPS represents the coefficient matrix composed of voltage–reactive power sensitivity.
The second relative gain matrix based on voltage–reactive power sensitivity is then formulated as shown in Equation (13).
Thus, two relative gain matrices with distinct metrics are obtained. These matrices enable the assessment of reactive power–voltage correlations between DC infeed points based on their relative gain characteristics.
3.4. Constructing the Coupling Evaluation Indicators for Multi-Infeed DC Systems
For each DC system, there are two distinct methodologies for ranking coupling degree. These are the modified relative gain coefficient based on the voltage interaction factor (VIF) and the modified relative gain coefficient based on the voltage-reactive power sensitivity (VRPS). The results obtained using different ranking methods vary, and the physical meanings they reflect are also different.
If the modified relative gain coefficient based on the voltage interaction factor (VIF) indicates a weak correlation between DC infeed points, it means that the electrical distance between the DC infeed points is relatively long. If the modified relative gain coefficient based on the voltage-reactive power sensitivity (VRPS) indicates the existence of a weak correlation between DC infeed points, it means that the electrical distance between the DC infeed points and the pumped-storage units is too long, or the system strength at the DC infeed points is too high, masking the effects of other DC systems. Therefore, the two ranking methods involve mapping from two dimensions of the system’s strength at the DC infeed points and the electrical distance between the DC infeed points.
For any two DC systems in a multi-DC system, taking the
k-th and
l-th DC systems as an example, the evaluation system shown in Equation (14) is used to determine the coupling degree between the DC systems.
4. Planning Scheme for Adding New DC Lines
For new DC planning in AC/DC hybrid sections, the location and capacity of the new DC are determined from the perspective of short-circuit current characteristics and power flow characteristics, respectively, and the type of the DC converter is determined from the perspective of system voltage stability. A reasonable planning scheme for the new DC in the transmission section is proposed to meet the AC/DC strong-weak balance principle.
4.1. Determining the Locations for New DC Infeed Points
Regarding the variation law of the system short-circuit current, it is necessary to evaluate whether the short-circuit current during a fault meets the safety requirements under different structures of the AC/DC hybrid transmission section. Here, the three-phase short-circuit, which is the most severe type of fault, is considered, and a short-circuit current margin indicator is proposed, as shown in Equation (15).
In the formula, is the short-circuit current margin of the i-th node in the system, is the maximum allowable short-circuit current of the i-th node, and is the actual short-circuit current of the i-th node.
During the DC planning phase, for each different combination scheme of AC and DC lines, the indicators of each node in the system are calculated. The minimum values of the short-circuit current margins of system nodes for various schemes are compared. Based on the principle of maximizing the indicators, the AC/DC combination scheme with the largest short-circuit current margin is selected to determine the location of the newly added DC system.
4.2. Determining the Capacity for New DC System
Considering power system power flow relationships, the N-1 impact resistance strength indicator shown in Equation (16) is proposed to accurately evaluate the capability of AC transmission channels within the grid section to withstand power flow transfer impacts from DC channels under the N-1 contingency of DC lines.
In the formula, represents the transmitted power of all the j-th DC transmission lines, represents the sum of the maximum transmission capacities of all AC transmission lines, and represents the sum of the transmitted powers of all AC lines under normal operating conditions.
An N-1 impact resistance strength indicator reflects the power flow balance relationship between AC and DC systems. To ensure that the AC/DC hybrid power grid complies with the N-1 principle stipulated in the Guidelines for Security and Stability of Power Systems, the N-1 impact resistance strength indicator must be greater than 1. This indicator also provides guidance for planning the power transmission capacity of AC channels. When the maximum power transmission capacity of all AC lines and DC lines is determined, the indicator depends on the value of , and a smaller will result in a larger . Therefore, to enhance the ability of the power grid to withstand the impact of N-1 faults, should be minimized as much as possible.
Based on the N-1 impact resistance strength indicator, the new DC capacity is determined. The capacity allocation of AC and DC transmission lines complies with the AC/DC strong-weak balance principle, ensuring that > 1.
4.3. Determining the Types of DC Converters
Regarding the system voltage stability, the voltage strength in the AC/DC hybrid power grid is measured using the voltage stiffness indicator. The voltage support strength at any point in the power grid is defined as the ability to maintain the voltage magnitude at the connection point close to its no-load voltage level, as expressed in Equation (17). The short-circuit ratio of the connected equipment corresponding to any point in the power grid is
. The voltage magnitude at the network terminal varies with the
and impedance angle
, while the no-load voltage at the same node without grid-connected equipment is
. When the grid-connected equipment is not connected to the power grid, the no-load voltage at any point is
. The system’s voltage stiffness is the ratio of these two values and is more suitable for evaluating the voltage support effect of non-synchronous power sources.
Since the resistance in ultra-high-voltage direct-current (UHVDC) transmission lines is significantly smaller than the reactance, the typical situation where the Thevenin equivalent impedance of the power grid is purely inductive is analyzed, while the equivalent impedance of the grid-connected equipment is purely resistive, namely
= 0° and
= 90°. Then, the expression for
is simplified:
When the short-circuit ratio is 3, the voltage stiffness is 0.95. It is generally considered that when the is greater than 3, i.e., the voltage stiffness is greater than 0.95, the connection point SYS is a robust grid-interfacing node. This is because the voltage drop under load conditions is less than 5% of the rated voltage, indicating strong system voltage support capability that can ensure system voltage stability during faults.
In the planning stage, it can be judged whether the system voltage support capability is sufficient to guarantee the system voltage stability through the calculation of the system voltage stiffness index. If it is not satisfied, it is necessary to consider adopting a type of DC converter station with a voltage support capability.
Based on the AC/DC strong-weak balance principle, combined with the operating characteristics such as power flow and the short–circuit current of the AC/DC hybrid transmission section, the location of the new DC line, the capacity of the DC line, and the type of DC converter are selected. A planning scheme for the new DC in the AC/DC hybrid transmission section is proposed, leaving sufficient margin for power flow, short-circuit current, and stability.
5. AC-to-DC Conversion Planning Scheme
When multiple DC systems are assessed to be in a strongly coupled state, network reconfiguration planning is required. DC transmission lines based on line-commutated converters (LCCs) are prone to commutation failures and power interruptions during faults in the receiving-end grid. In multi-infeed DC systems, the tight AC electrical coupling between DC connection points can cause significant voltage drops at multiple converter buses during a single AC fault, leading to simultaneous commutation failures in multi-DC systems. This security issue is particularly prominent in strongly coupled multi-infeed DC systems.
To mitigate the problem of simultaneous commutation failures in AC/DC hybrid systems, embedded DC lines can be added to reduce the electrical coupling between DC connection points. The following discussion uses the PageRank algorithm to identify key nodes in the system, thereby zoning the power grid and DC systems, selecting AC-to-DC conversion lines, and proposing a complete embedded DC layout scheme. The detailed content is given below.
5.1. Critical Grid Node Identification Based on the PageRank Algorithm
5.1.1. The Base Idea of PageRank Algorithm
The PageRank algorithm is based on the idea that a node with more connections is more important and thus has a higher PageRank value. Suppose there are M nodes in the power grid; then, the PageRank score for each node can be iteratively calculated using the formula below. Here,
represents the PageRank vector at the
k-th iteration, consisting of the PageRank values of all nodes.
where
represents the PageRank vector at the
i-th iteration. An M-order square matrix
G is the Google matrix, where M denotes the total number of nodes.
α is a scalar within the interval (0,1), and is typically set to 0.85.
e is an M-dimensional column vector of all ones.
a is the dangling node vector, and
a(
i) = 1 if node i has no outgoing links; otherwise, it is 0.
H is the hyperlink matrix, defined such that
H(
i,
j) = 1/
if nodes
i and
j are connected; otherwise, it is 0, where
represents the number of nodes linked to node
i.
5.1.2. Identification of the Critical Grid Nodes
The power system has certain similarities to the Internet, resembling a weighted directed network [
26]. In this analogy, web pages correspond to buses in the power grid, hyperlinks correspond to transmission lines, the linking relationships between web pages represent power flow and network topology parameters, page visits correspond to node load levels, and page quality corresponds to the importance of power system nodes. However, in power systems, the distribution of PageRank values among nodes is closely related to power flow and line impedance, rather than being allocated uniformly or randomly. Therefore, the standard PageRank algorithm designed for web connections needs to be modified for application in power systems.
Therefore, the electrical adjacency matrix will be modified as follows.
The degree of connectivity between nodes is represented by the reciprocal of the line impedance, analogous to hyperlink relationships between web pages. The greater the impedance between nodes, the closer the connectivity in the network. Accordingly, the electrical connectivity matrix of the network is defined as follows.
where
E′ is the electrical connectivity matrix of the network,
EM×1 is the extended column vector of matrix
E,
represents the elements of the connectivity matrix
E, and
denotes the elements of the extended column vector
.
Therefore, the electrical transmission transfer matrix of the network is obtained as follows.
where
G′ is the electrical transmission transfer matrix, representing the proportion of information transfer between nodes in the power system, i.e., the distribution ratio of the PageRank values. The PageRank algorithm is thus expressed as follows.
After k iterations, it is assumed that the iterative process has converged. The iterative computation continues until the PageRank value of each node no longer changes. After obtaining the final PageRank values, all nodes are ranked in descending order based on their values. The top K nodes with the highest PageRank values are then selected as critical nodes.
5.2. Determining Partitioning of DC Infeed Points
The K critical nodes are designated as clustering centers for the power grid. After calculating the shortest electrical distance between each remaining node and these clustering centers, each node and its critical nodes with the shortest distance between it are clustered together. In cases where a node has the same distances as multiple critical nodes, it is necessary to prioritize the one with the shortest electrical distance as the basis for classification. Through the above mentioned processing, the power grid is partitioned into multiple zones, and then the partition to which the DC infeed point belongs is determined. The criteria for grid partitioning and DC zoning are determined according to the following formula.
where
represents the number of power grid partitions;
β is the PageRank threshold; Count is the counting function;
denotes the i-th DC system;
represents the
j-th partition;
is the voltage interaction impact factor between DC system i and partition
j;
is the voltage variation of the commutation bus of
; and AU represents the average function for voltage variations in each critical node in the partition. If
is minimized, then
, completing the DC partitioning.
5.3. Constructing the Severity Assessment Indicator for Simultaneous Multi-HVDC Commutation Failures
The proportion of DC power loss caused by short-circuit faults serves as a critical metric for evaluating the severity of commutation failures from the perspective of power. In addition to the magnitude of power loss, the duration of commutation failures constitutes a critical concern. For an ultra-high-voltage direct-current (UHVDC) system, prolonged failure to restore rated power following commutation failures induced by short-circuit faults will undoubtedly have significant impacts on both the voltage stability and frequency stability of the AC system. Considering the two-dimensional impacts of power and duration, a calculation method for the energy loss due to commutation failure is proposed from the perspective of energy.
Assume that the initial operating DC power is
. When commutation failure occurs, the DC power drops to 0. The duration of the commutation failure is
, after which the DC power starts to recover, and the recovery process lasts for
. The energy loss due to DC commutation failure is defined as shown in Equation (27).
where
is the energy loss due to commutation failure of the
i-th DC line, and
is a function of DC power varying with time.
For a multi-infeed HVDC receiving-end grid, a single short-circuit fault typically triggers simultaneous commutation failures in multi-DC systems. Therefore, for a short-circuit fault at node
j, the total energy loss caused by this is expressed as the sum of the energy losses due to the commutation failures of each DC line, as shown in Equation (28).
where
represents the system energy loss caused by the short-circuit fault at node
j, and
indicates that the short-circuit fault at node
j will cause commutation failure in the
i-th DC line.
The magnitude of energy loss can reflect the severity of commutation failure in the system, when the larger
is, the greater the energy impact on the system due to DC commutation failure. However, under the same energy loss, the threat to a large-scale power system is far smaller than that to a small-scale power system. As an absolute quantity,
does not intuitively reflect the relationship between the energy loss and the system scale. Therefore, the indicator shown in Equation (29) is adopted to replace the energy loss.
where
is the ratio of the energy loss due to commutation failure to the maximum releasable kinetic energy,
is the number of units,
is the maximum allowable released rotor kinetic energy of unit
i,
is the moment of inertia of unit
i,
is the rated rotational speed, and
is the allowable minimum rotational speed.
5.4. Selecting AC-to-DC Lines
Through simulation calculations, fault conditions are obtained where commutation failures occur simultaneously in multi-DC systems, and even continuous commutation failures in multi-DC systems lead to a large amount of power loss in the system. First, it is necessary to clearly identify the partitions where the DC systems experiencing simultaneous commutation failures are located, respectively, and then discover the AC lines between these partitions. Then, one must calculate the change in the indicator
brought about by converting AC lines into DC lines. It is necessary to select the AC line for conversion into DC each time to bring about a greater change in the indicator
per unit capacity, until the situation of simultaneous commutation failures in multi-DC systems can meet the requirements of safety and stability. The formula for selecting AC lines is shown in Equation (31).
where
is the number of the AC line to be converted into a DC line,
represents the change in the indicator
caused by converting the AC line into DC, and sbase denotes the rated capacity of the line. The rated capacities of the AC line before conversion and the DC line after conversion remain consistent.
Therefore, the approach for determining the AC-to-DC conversion lines in the power system network is shown in
Figure 2 below.
6. Coordinated Planning Strategies for AC/DC Hybrid Section
Based on the comprehensive planning schemes for new DC lines and AC-to-DC conversion, and in accordance with the AC/DC strong-weak balance principle, the capacities of the AC and DC systems are rationally matched. From the perspective of system stability, the topology and parameter configuration of the hybrid section are adjusted to develop coordinated planning strategies for the AC/DC hybrid section.
6.1. Determining the Actual Power on the AC Transmission Lines of AC/DC Hybrid Section
Considering system frequency stability, the system frequency stability is checked by calculating the maximum possible power imbalance under faults to determine the maximum transmitted power of AC lines that satisfies the allowable maximum frequency deviation of the system.
6.1.1. Maximum Allowable Power Shortage Under Frequency Constraint
In view of the frequency impact caused by the power imbalance between the two ends of the power grid under the fault conditions, the maximum frequency change rate
, the maximum frequency deviation
and the quasi-steady-state frequency deviation
index are commonly used in the actual power grid to check the frequency stability. According to the maximum frequency impact that the power grid can withstand, the maximum allowable power shortage
is determined.
where
is the maximum rate of system frequency change.
is the system frequency under normal operating conditions.
is the system inertia value.
ζ is the system damping ratio parameter.
is the system natural oscillation angular frequency.
T is the system equivalent inertia time constant.
D is the system load damping coefficient.
K is the speed regulation gain of the unit governor, and
is the time from the start of the fault until the frequency deviation reaches its maximum value.
6.1.2. Determining the Transmission Power of AC Line
For the AC/DC hybrid section, when all AC lines fail, the system may have a maximum power imbalance = .
6.2. Determining AC/DC Hybrid Section Planning Scheme of Adding New DC Lines and AC-to-DC Conversion
Based on the AC/DC strong–weak balance principle, and by integrating the coupling characteristics between AC/DC systems and among multi-DC systems, the location of the new DC lines is determined, the capacity of DC lines is allocated, and the type of DC converter is selected. A planning scheme for new DC lines in the AC/DC hybrid section is proposed, leaving sufficient margins for power flow, short-circuit current, and stability.
To mitigate the risk of simultaneous commutation failures in multi-DC systems, AC-to-DC conversion planning is carried out in accordance with the multi-DC coupling degree evaluation system and methods for identifying key nodes and selecting DC infeed points. This yields the basic topology of the AC/DC hybrid section.
6.3. Determining the Technology Route of DC Systems
When the coupling degree among multiple DC systems is relatively low, the AC-to-DC conversion planning scheme can effectively mitigate the risk of simultaneous commutation failures. However, due to constraints such as network topology, channel resources, and engineering parameters, it is sometimes difficult to find feasible points for AC-to-DC conversion between DC systems experiencing simultaneous commutation failures. In some cases, converting AC lines between DC partitions does not result in a significant improvement in the energy loss indicator per unit capacity, as shown in Equation (29), and the converted lines still fail to prevent simultaneous commutation failures due to strong coupling. Consequently, energy losses are not significantly reduced, and system stability requirements remain unmet. As a result, the system may encounter scenarios where no feasible AC-to-DC conversion points can be identified, indicating that relying solely on AC-to-DC schemes cannot fully prevent simultaneous commutation failures in multiple DC systems.
In situations where no feasible AC-to-DC conversion points exist, the risk of simultaneous commutation failures can be mitigated by changing the technical route of the DC lines. Conventional DC systems use thyristor-based line-commutated converters (LCCs), which rely on the AC grid voltage to complete commutation. When the AC system experiences disturbances such as short-circuit faults or voltage fluctuations, voltage sags may occur, resulting in insufficient commutation voltage. This may cause the current not to transfer within the commutation period, leading to commutation failure.
In contrast, modular multilevel converter (MMC)-based DC technology employs fully controllable devices and uses pulse width modulation (PWM) to actively control commutation, without depending on the phase of the AC grid voltage. In this way, this technology eliminates the risk of commutation failure.
Therefore, in scenarios where conventional DC systems are prone to simultaneous commutation failures that cannot be tolerated, adopting MMC-DC technology can effectively prevent the risk of simultaneous commutation failures in multiple DC systems.
6.4. Determining the Connection States of DC Lines
Considering the system’s synchronous stability, measures can be taken to enhance it during the planning phase and the real-time protection phase, respectively.
On the one hand, during the planning phase, it is necessary to design sufficient transmission capacity for AC lines to maintain power balance, and the situation of “strong DC and weak AC” must be avoided. To determine whether the AC/DC hybrid section in the AC/DC transmission channel meets the strength balance requirement, the phase difference indicator
is used at both ends of the line, as shown in Equation (33).
In the equation, denotes the phase angle difference across the AC tie line, and represents the maximum allowable phase angle difference for stable system operation.
When < , the system satisfies the AC/DC strong–weak balance principle and exhibits sufficient synchronous stability. A larger indicates weaker system synchronization. Therefore, if exceeds , the AC link should be disconnected to force the sending-end and receiving-end grids to operate independently in an asynchronous manner.
On the other hand, during the real-time protection phase, the active disconnection regulation and control strategy is an important protective measure for frequency and synchronous stability. By monitoring the power angle difference, when this indicator reaches the allowable maximum value of the system, the protection device will cut off the AC tie line to avoid system instability.
6.5. Checking the System Operation Stability
After the planning of AC-to-DC conversion and the adding new DC lines, the operational stability of the AC/DC hybrid system is checked, ensuring the stable operation of the AC/DC hybrid system with multi-infeed HVDC under different operating conditions.
Based on the principle of balancing the strength of AC and DC, we propose coordinated planning strategies suitable for the AC/DC hybrid system with multi-infeed HVDC. With the assistance of certain operational control references, this scheme can improve the power flow control ability, reduce the risks of short-circuit current exceeding the standard and line overload under faults, and at the same time ensure the stability of the system frequency, voltage, and operational synchronization.
7. Case Study
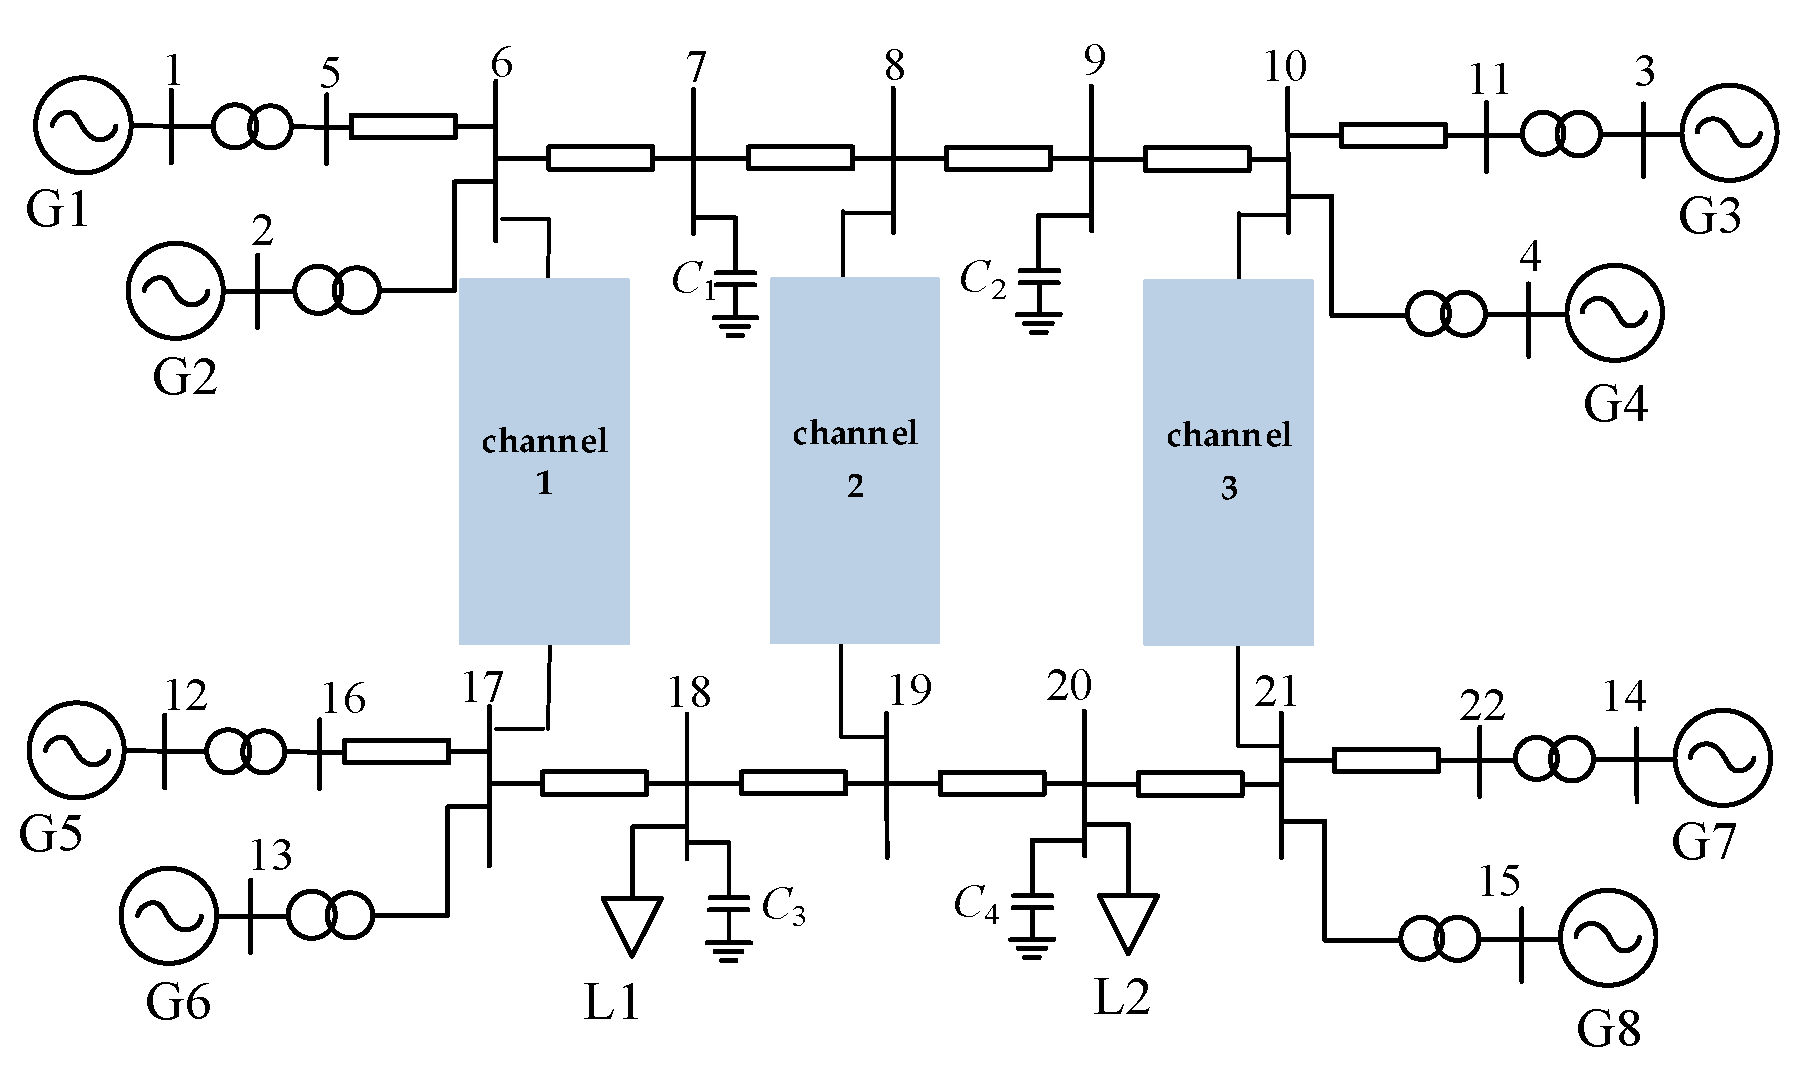
A typical case study of an AC/DC hybrid grid framework is constructed based on the IEEE two-area four-machine system. The two IEEE four-machine systems are interconnected via three transmission channels, and the case structure is illustrated in
Figure 3. Based on this system, the coordinated planning strategies of AC/DC hybrid interconnection section are analyzed.
Firstly, based on the power system structure shown in
Figure 3, Channel 1 and Channel 2, which have relatively close landing points, are selected as the LCC-DC transmission systems. Under two conditions of normal operation and a short-circuit fault at the sending-end AC grid, the transmission power of LCC 2 and the variation in
VPRS parameters between the two DC systems are observed and analyzed when LCC 1 operates at different transmission power levels. The results are shown in
Table 1.
Under both normal and short-circuit fault conditions, the transmission power of the DC system LCC 1 is regulated. It is observed that as the output power of LCC 1 gradually increases from 1000 MW to 4000 MW, the reduction in the output power of LCC 2 becomes more significant, and the impact on the voltage of LCC 2 intensifies. The VPRS values between the two DC systems show an increasing trend, which is positively correlated with the transmission power of the DC system. An increase in the VPRS value indicates that the reactive power regulation of LCC 1 has a stronger influence on the voltage of LCC 2, reflecting the enhanced coupling between the two systems and the greater propagation of voltage disturbances.
When a short-circuit fault occurs in the system, the transmission power of LCC 1 remains positively correlated with the VPRS value. However, the VPRS values are higher than under normal conditions, indicating the stronger propagation of voltage disturbances in the system. According to Equation (7), the values of the Jacobian matrix elements are mainly determined by the system structure and electrical parameters such as voltage and current. Under fault conditions, the equivalent electrical distance between the two DC systems is reduced, making disturbances more likely to propagate and enhancing the coupling, thereby increasing the VPRS value. This aligns with the simulation results and effectively quantifies the strength of interactive disturbances between DC systems. Higher VPRS values can help identify highly coupled multi-infeed DC areas, providing a basis for future AC/DC hybrid system planning strategies, such as optimizing converter station locations and defining AC/DC partition zones, thereby improving overall system coordination and control synergy.
7.1. Constructing Structure and Parameters of the Test Case
7.1.1. System Structure
Then, by adjusting the system load levels, the total inter-area power transfer achieves 4000 MW. In the test system, some synchronous generators are replaced by wind turbines. The total load increases from 6124 MW to 8165 MW, each load increases in equal proportion, and the power factor remains unchanged at 0.95. In order to ensure the balance of supply and demand, the output power of power supplies is proportionally increased on the basis of the original data. The installed capacity proportion values of wind power and thermal power in the system are 53% and 47%, respectively.
The transmission grid structure is determined to achieve short-circuit current minimization by maximizing the number of DC transmission channels. However, at least one AC line in the interconnection section must be retained as a power flow linkage channel to ensure power balance between sending and receiving grids during contingencies. Specifically, one channel is selected as an AC channel, with the remaining two configured as DC channels. The minimum node short-circuit current margins under all AC/DC configuration combinations are calculated, as shown in
Table 2. Following the maximization principle, the optimal configuration is identified, with Channel 2 as the AC line and Channels 1 and 3 as DC lines, ensuring the highest short-circuit current margin across critical nodes.
7.1.2. System Parameters
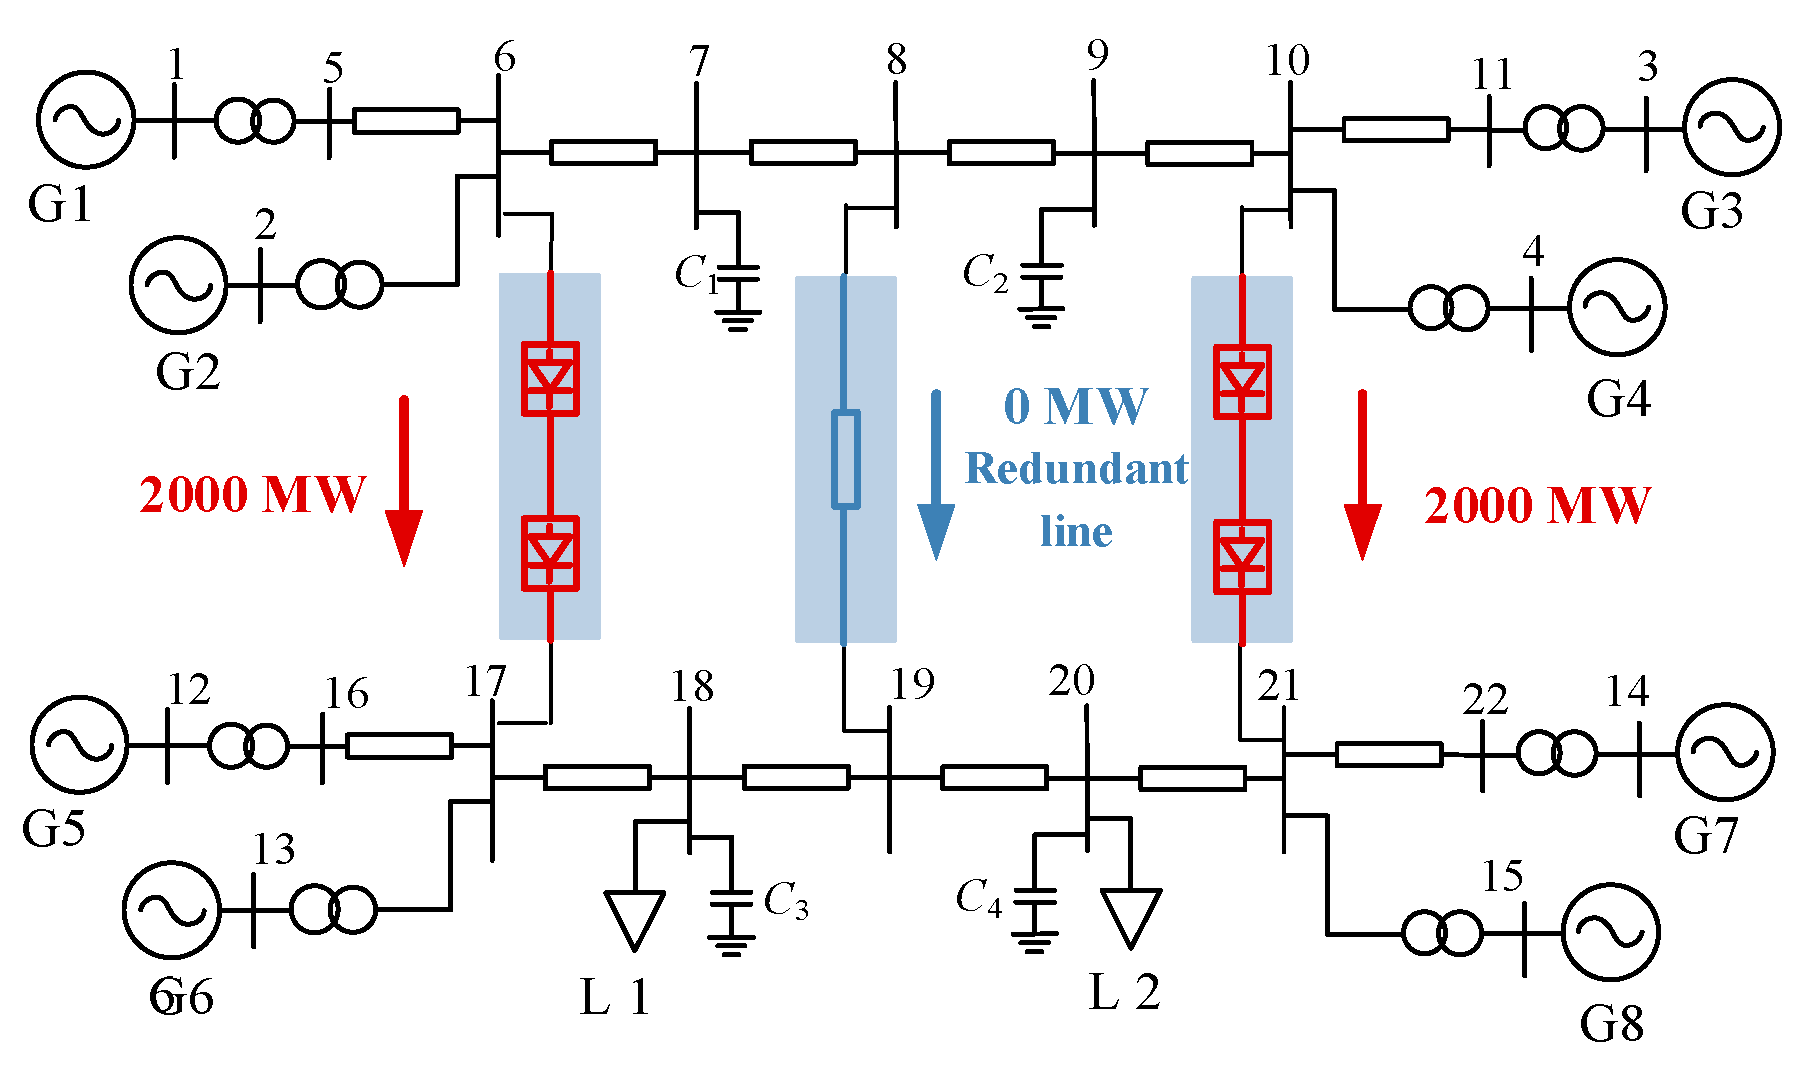
Channels 1 and 3 employ ±500 kV bipolar conventional DC transmission technology. To maximize transmission line utilization, both DC channels operate at identical power flows of 2000 MW, while AC Channel 1 has a rated capacity of 3200 MW. To achieve maximum N-1 contingency resistance capability for the interconnection section, the AC lines are configured with the transmission structure shown in
Figure 4.
7.2. Analysis of the System Stability
Under these parameter settings, when any DC line fails, the AC channel can take over the power flow of the faulty line. Therefore, the system structure can meet the power flow and short-circuit current characteristics in both normal and fault conditions. Then, the operational stability of this AC/DC hybrid system is simulated and analyzed.
7.2.1. Synchronization Stability Analysis of AC/DC Hybrid System
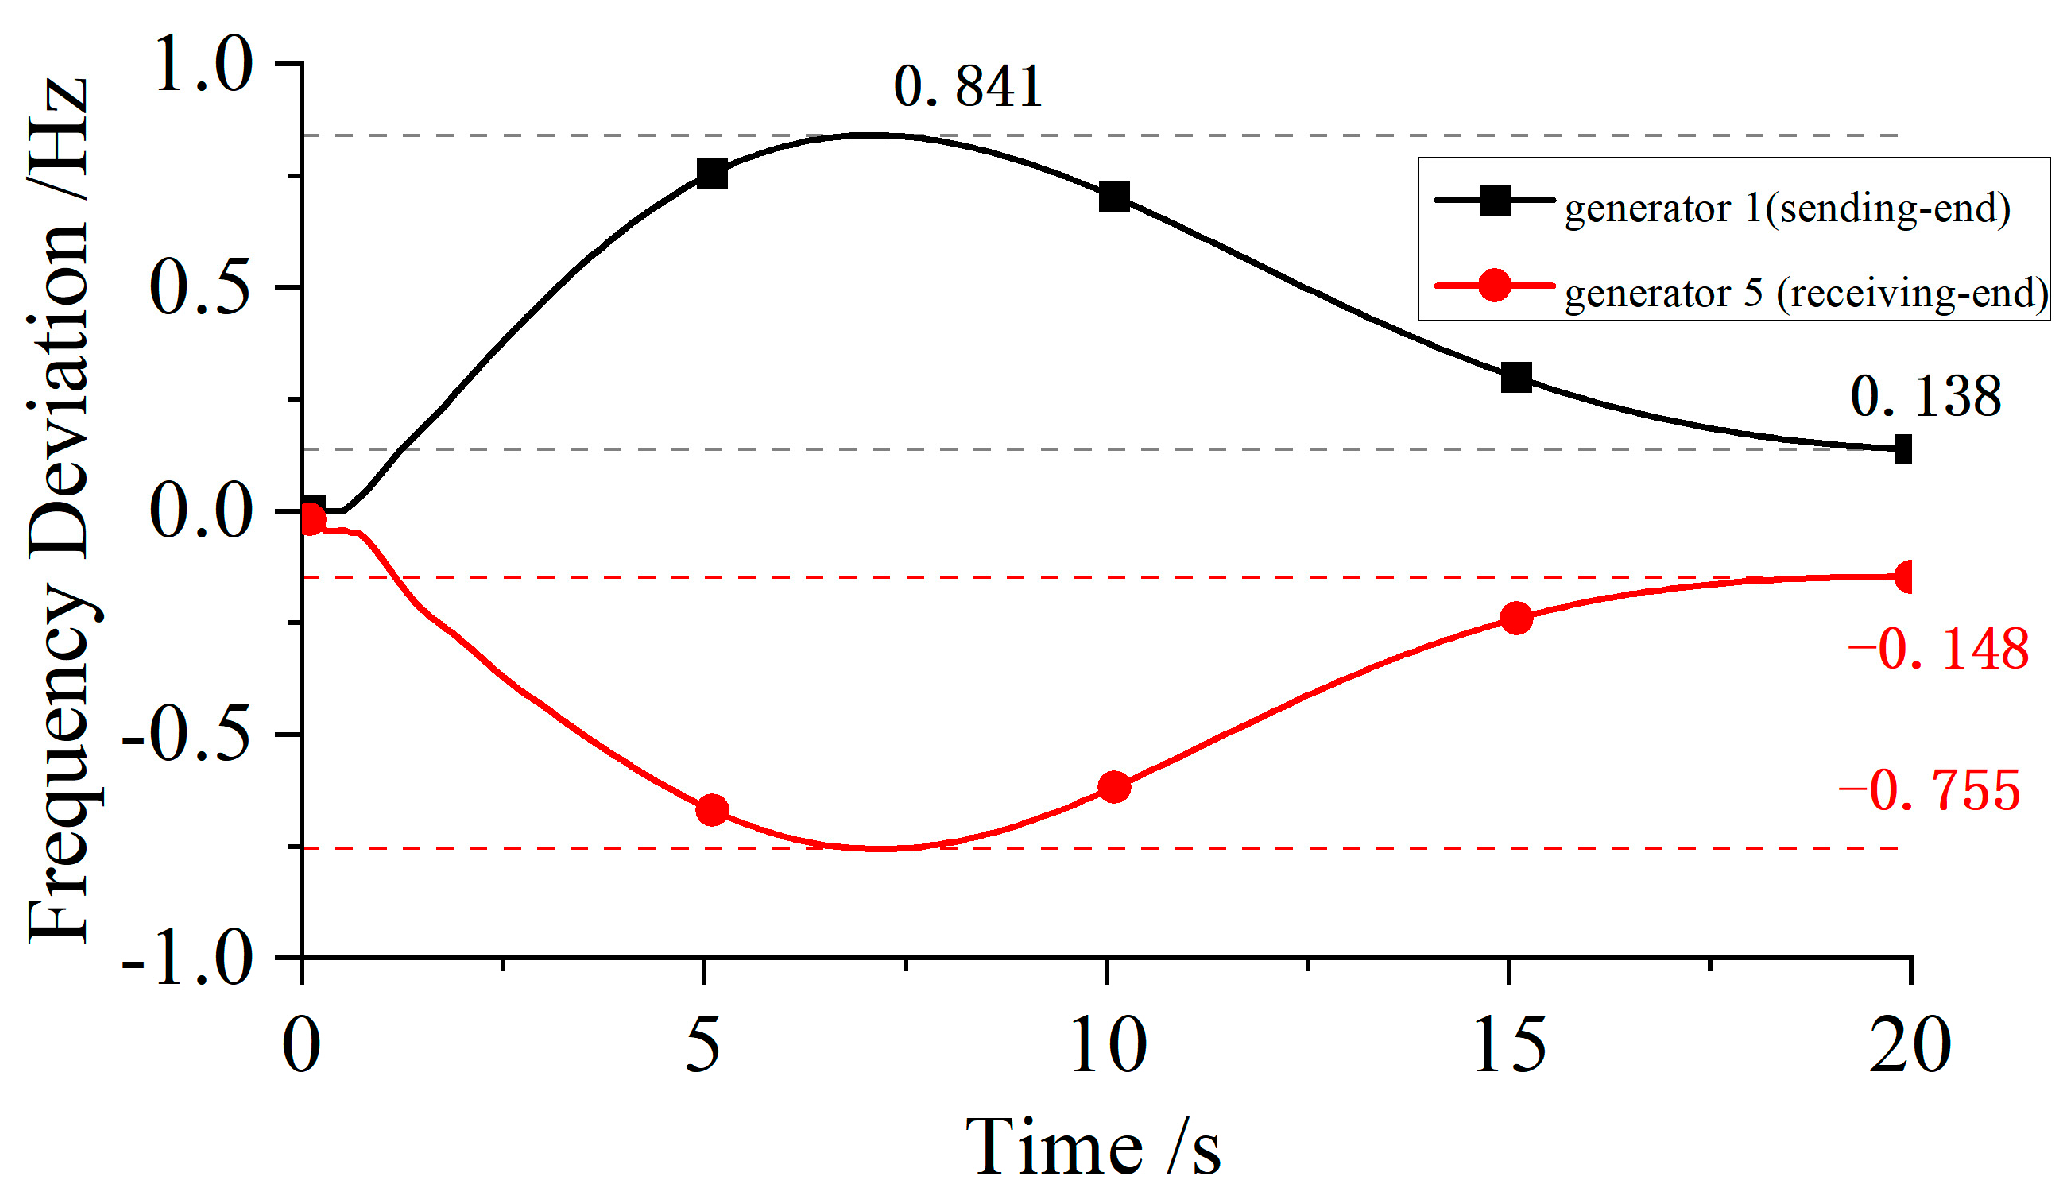
Firstly, the frequency stability of the system is analyzed under the AC/DC hybrid transmission structure. In the AC/DC hybrid transmission structure and the DC transmission structure system, the DC fault is set at HVDC1 at 0.5 s and the DC line is blocked. The frequency deviation between the sending-end and receiving-end units, shown in
Table 3, is observed and analyzed.
The frequency fluctuation curves of the AC-DC hybrid system and the fully DC system under DC block fault conditions are shown in
Figure 5 and
Figure 6.
In the AC/DC hybrid transmission system, after HVDC1 DC blocking, the power flow of the fault DC line is carried by the AC line. After a period of frequency fluctuation, the frequency difference between the sending and receiving units is very small, being close to the rated value. Compared with the DC transmission system, the frequency fluctuation peak of the sending and receiving units is larger, and due to the lack of AC lines, the difference between the frequency and the rated value of the sending and receiving units is still large under the influence of unbalanced power. Therefore, the AC line plays a crucial role in mitigating power disturbances, contributing to the superior frequency stability of the AC/DC hybrid structure.
7.2.2. Frequency Stability Analysis of AC/DC Hybrid System
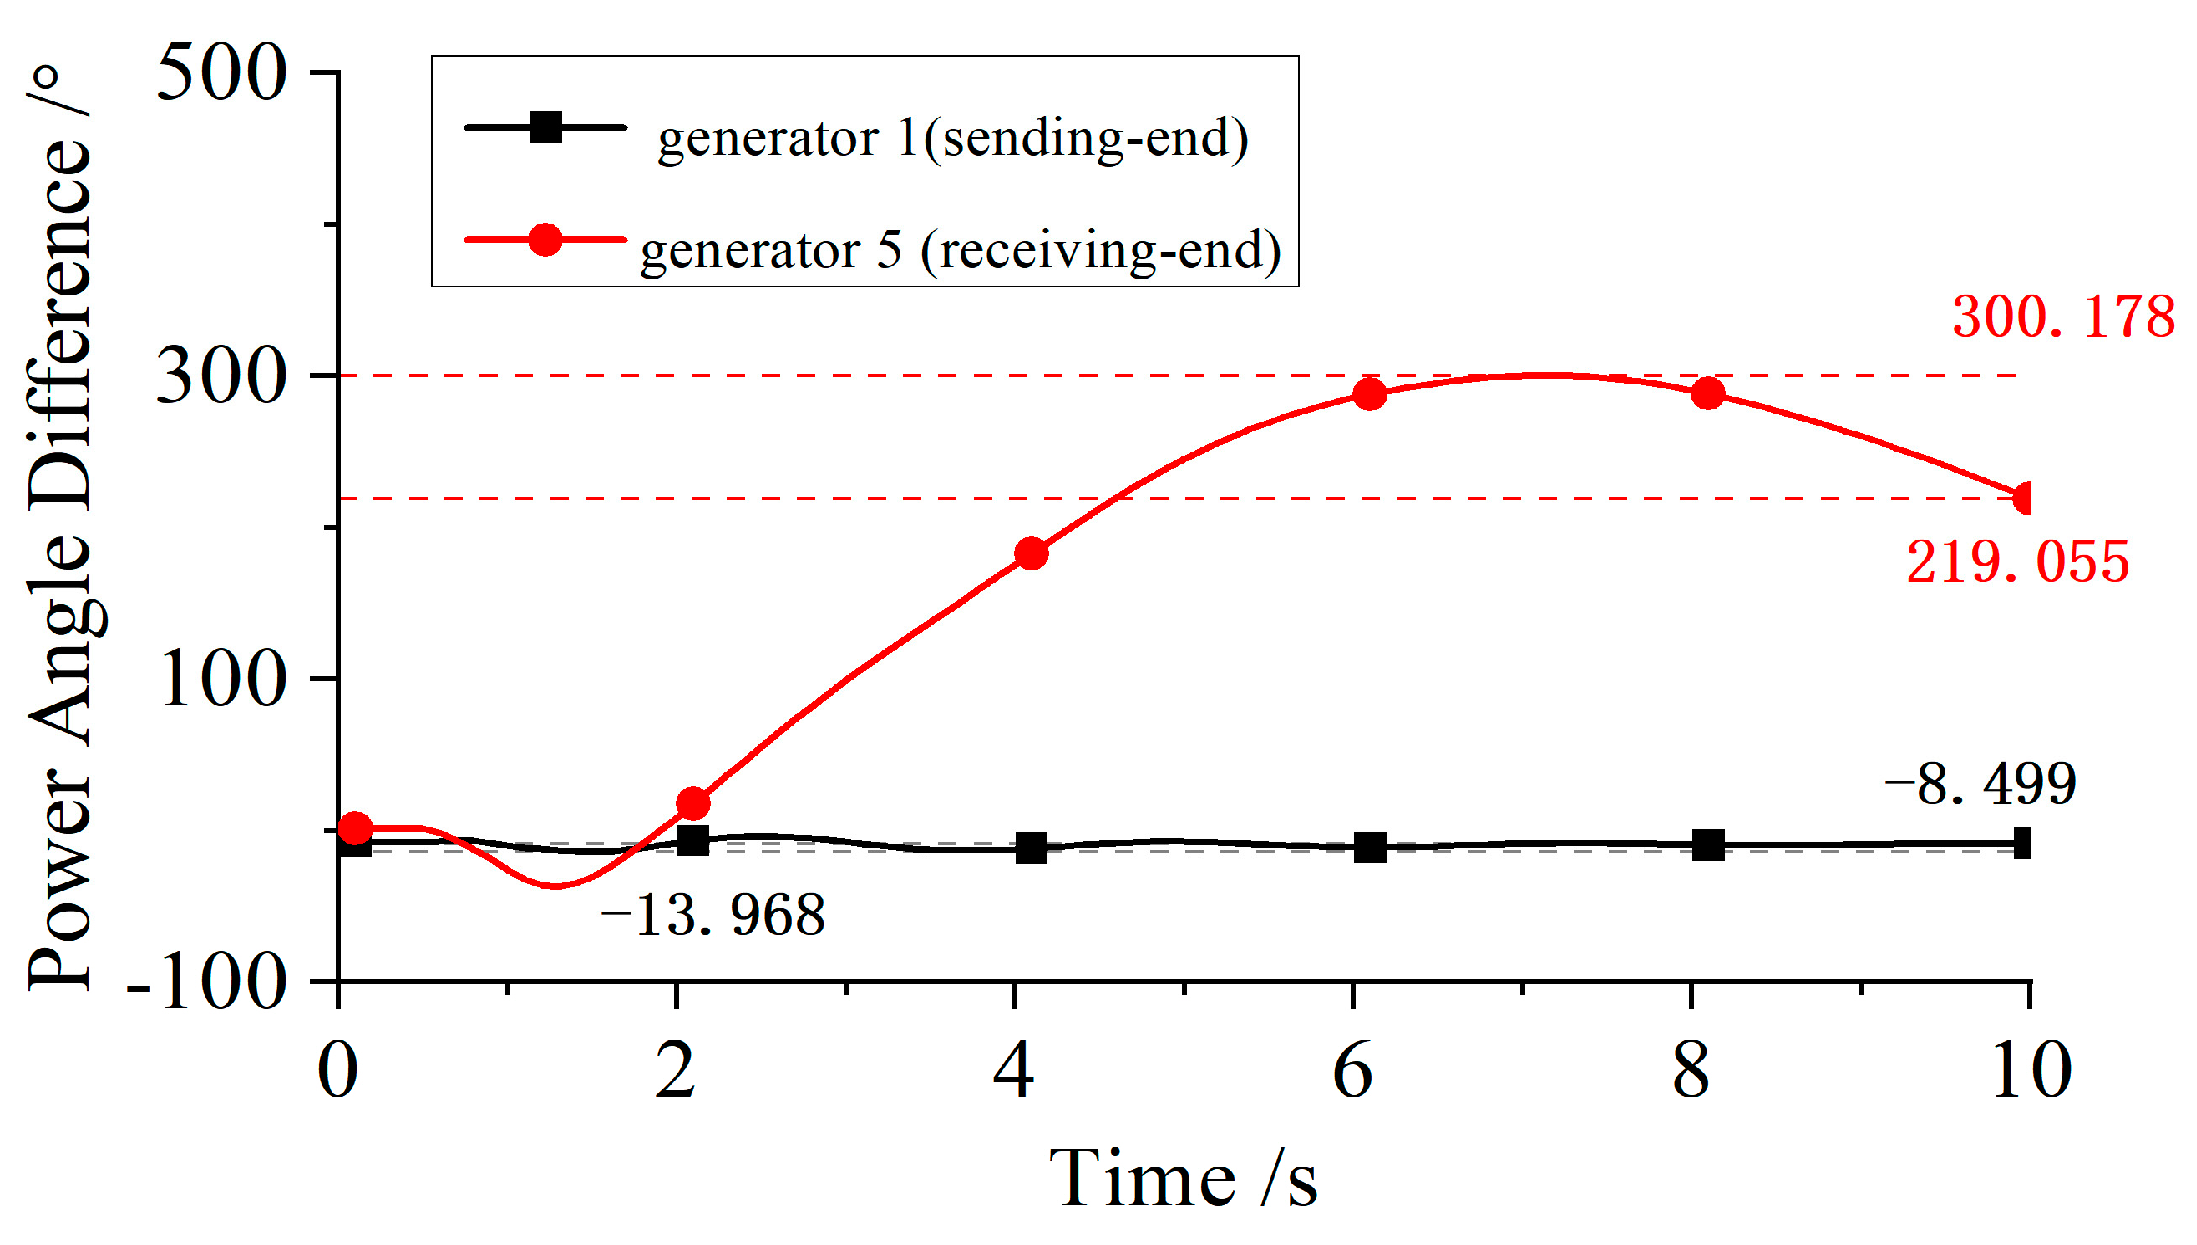
The synchronization stability of the system is analyzed before and after the active disconnection coordinated control strategy is set up. A short-circuit fault is applied to the sending-end system for 0.1 s, and then the fault is cleared. The power angle difference between the sending-end and receiving-end units shown in
Table 4 is observed.
In the absence of any protection measures in the system, the short-circuit fault will cause the power angle difference between the sending and receiving units to continue to increase, and finally the power angle of the unit becomes unstable. The system adopts the active splitting coordinated control strategy, and after setting the splitting power angle threshold, the same fault is applied. It is found that when the power angle difference between the sending-end and receiving-end units reaches the threshold, the protection device disconnects all the AC connections between the sending and receiving ends in time. After a period of internal adjustment of the system, the power angle and frequency of the unit are close to the rated value. Therefore, with the help of the active splitting coordinated control strategy, the rapid change in the transmission section structure can be realized, the influence of the fault can be isolated, and the synchronous stability of the system can be improved.
Under short-circuit fault conditions, the unit power angle response curves at both ends of the transmission line in the AC/DC hybrid transmission section are shown in
Figure 7 and
Figure 8.
Based on the comprehensive analysis of the example, after the section planning of the AC/DC hybrid grid for the two-area four-machine system is carried out according to the methods described above, there is no risk of the short-circuit current exceeding the standard or the line N-1 overload in the grid. With the active decoupling coordinated control strategies as an auxiliary, the system’s voltage, frequency, and synchronous stability are significantly improved.
7.3. Analysis of Commutation Failure Improvement Effect
Based on the multi-infeed DC coupling degree evaluation method described earlier, the coupling degree between DC line 6–17 and DC line 10–21 is calculated as 0.83. Since the coupling index of DC line 10–21 exceeds 0.8, it exhibits strong coupling characteristics, posing a high risk of simultaneous commutation failure. However, due to system stability constraints and the requirements for maintaining AC interconnections between corridors, no feasible AC-to-DC conversion points were found between the two DC partitions. As a result, the technical routes of the two DC lines were changed from conventional LCC-based DC to MMC-based flexible DC, while maintaining the same transmission capacity.
A fault scenario that causes significant energy loss due to commutation failure in both DC lines was selected. The fault type chosen was a three-phase metallic short circuit. The comparison of energy loss due to commutation failure before and after the technical route adjustment is shown in
Table 5 below.
From the data in
Table 5, it can be seen that by changing the DC system from LCC to MMC, the energy loss caused by simultaneous commutation failures in multiple DC systems is significantly reduced, thereby effectively improving the security and stability of the receiving-end grid. This verifies the scientific validity of the DC system technical route adjustment plan.


