Article

Device Identity Recognition Based on an Adaptive Environment for Intrinsic Security Fingerprints

1
School of Computer Science and Engineering, Nanjing University of Science and Technology, Nanjing 210094, China
2
State Grid Laboratory of Power Cyber-Security Protection and Monitoring Technology, Nanjing 210003, China
3
State Grid Smart Grid Research Institute Co., Ltd., Nanjing 210003, China
4
School of Cyber Science and Engineering, Shanghai Jiao Tong University, Shanghai 200240, China
*
Author to whom correspondence should be addressed.
Electronics 2024, 13(3), 656; https://doi.org/10.3390/electronics13030656
Submission received: 2 January 2024 / Revised: 31 January 2024 / Accepted: 2 February 2024 / Published: 5 February 2024
(This article belongs to the Special Issue Knowledge Information Extraction Research)

Abstract

:
A device’s intrinsic security fingerprint, representing its physical characteristics, serves as a unique identifier for user devices and is highly regarded in the realms of device security and identity recognition. However, fluctuations in the environmental noise can introduce variations in the physical features of the device. To address this issue, this paper proposes an innovative method to enable the device’s intrinsic security fingerprint to adapt to environmental changes, aiming to improve the accuracy of the device’s intrinsic security fingerprint recognition in real-world physical environments. This paper initiates continuous data collection of device features in authentic noisy environments, recording the temporal changes in the device’s physical characteristics. The problem of unstable physical features is framed as a restricted statistical learning problem with a localized information structure. This paper employs an aggregated hypergraph neural network architecture to process the temporally changing physical features. This allows the system to acquire aggregated local state information from the interactive influences of adjacent sequential signals, forming an adaptive environment-enhanced device intrinsic security fingerprint recognition model. The proposed method enhances the accuracy and reliability of device intrinsic security fingerprint recognition in outdoor environments, thereby strengthening the overall security of terminal devices. Experimental results indicate that the method achieves a recognition accuracy of 98% in continuously changing environmental conditions, representing a crucial step in reinforcing the security of Internet of Things (IoT) devices when confronted with real-world challenges.

1. Introduction

With the rapid development of the Internet of Things (IoT), the widespread application of various IoT devices has become an indispensable part of our daily lives. These devices play crucial roles in diverse fields, including industrial automation, smart homes, energy management, and many other application domains [1]. However, the data carried by these devices may include critical information related to device operations, control, and the privacy of users. Therefore, ensuring the security and authentication of these devices has become paramount.
The current realm of the IoT confronts primary security challenges that include the protection of data privacy, device authentication, and the defense against network attacks [2]. In recent years, the field of IoT security has witnessed significant advancements, encompassing the development of cutting-edge security protocols, encryption technologies, and intrusion detection systems [3,4,5].
Device intrinsic security fingerprint recognition, as an authentication method, has garnered considerable attention in the security domain. It relies on the unique hardware features of a device to authenticate users or devices. In comparison to traditional authentication methods, device intrinsic security fingerprint recognition utilizes the physical characteristics of a device, such as physical processor features and sensor performance parameters, to uniquely identify the device, providing a higher level of security for IoT terminals [6].
This method maximizes the use of hardware parameters, exploiting small variations present during the device production process and making the physical characteristics of each device unique. Consequently, device intrinsic security fingerprint recognition ensures the uniqueness of device identity, making it resistant to traditional security risks such as password leaks and identity spoofing attacks. By relying on physical characteristics, this technology provides more reliable and secure identity authentication for users and devices, offering an additional layer of protection for IoT terminals and enhancing the overall security of the system.
Despite its significant potential, device intrinsic security fingerprint recognition faces challenges, particularly in dynamic outdoor environments where factors such as dynamic physical conditions, noise, lighting variations, temperature changes, and other constantly changing elements may impact the accuracy and reliability of device intrinsic fingerprints. To overcome these challenges, an innovative approach is needed to address dynamic environmental changes and enhance the performance of device intrinsic security fingerprint recognition systems.
To address these issues and improve the accuracy and reliability of device intrinsic security fingerprint recognition in dynamic environments, this paper presents a novel method in the realm of IoT terminal device security and identity authentication. This method adapts to environmental uncertainties and noise fluctuations through the utilization of an aggregated hypergraph neural network architecture. This architecture processes the temporally changing physical features, allowing the system to acquire aggregated local state information from the interactive influences of adjacent sequential signals, constructing an adaptive environment-enhanced device intrinsic fingerprint recognition model.
The proposed method enhances the performance of intrinsic fingerprint recognition systems, meeting the stability and security demands for user identity authentication, even in dynamically changing environmental conditions. The main contributions of this paper are outlined as follows:
  • Real-time data collection in authentic outdoor environments, capturing the dynamic changes in physical features used to construct device intrinsic fingerprints;
  • Introduction of the Gramian angular field transformation, processing collected data to map it to a high-dimensional feature space, capturing the spatiotemporal characteristics of intrinsic fingerprints.
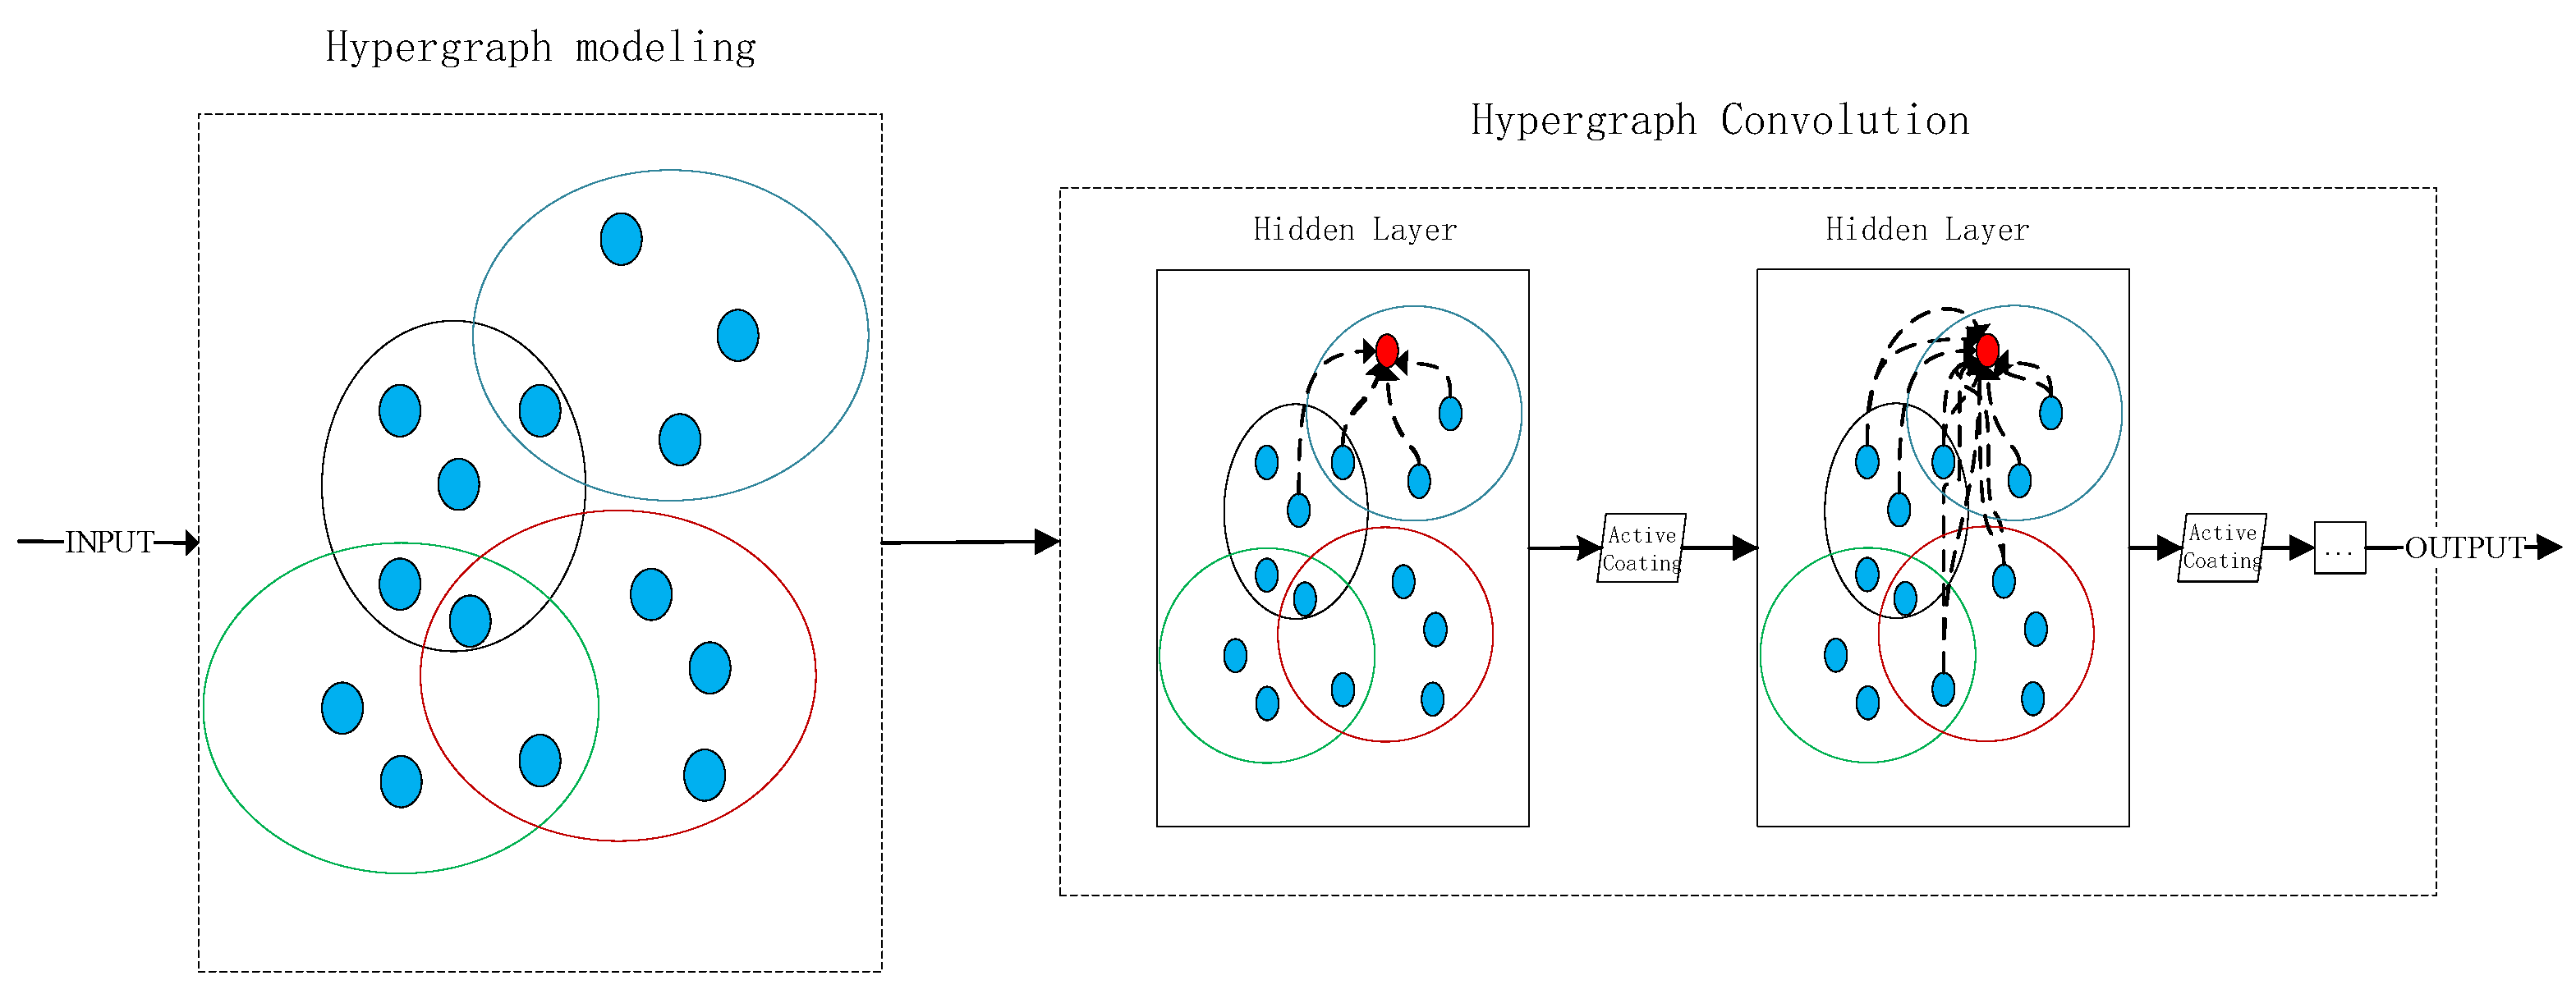
  • Design and application of a hypergraph neural network to extract and learn continuous spatiotemporal features of device intrinsic security fingerprints in real-world environments.
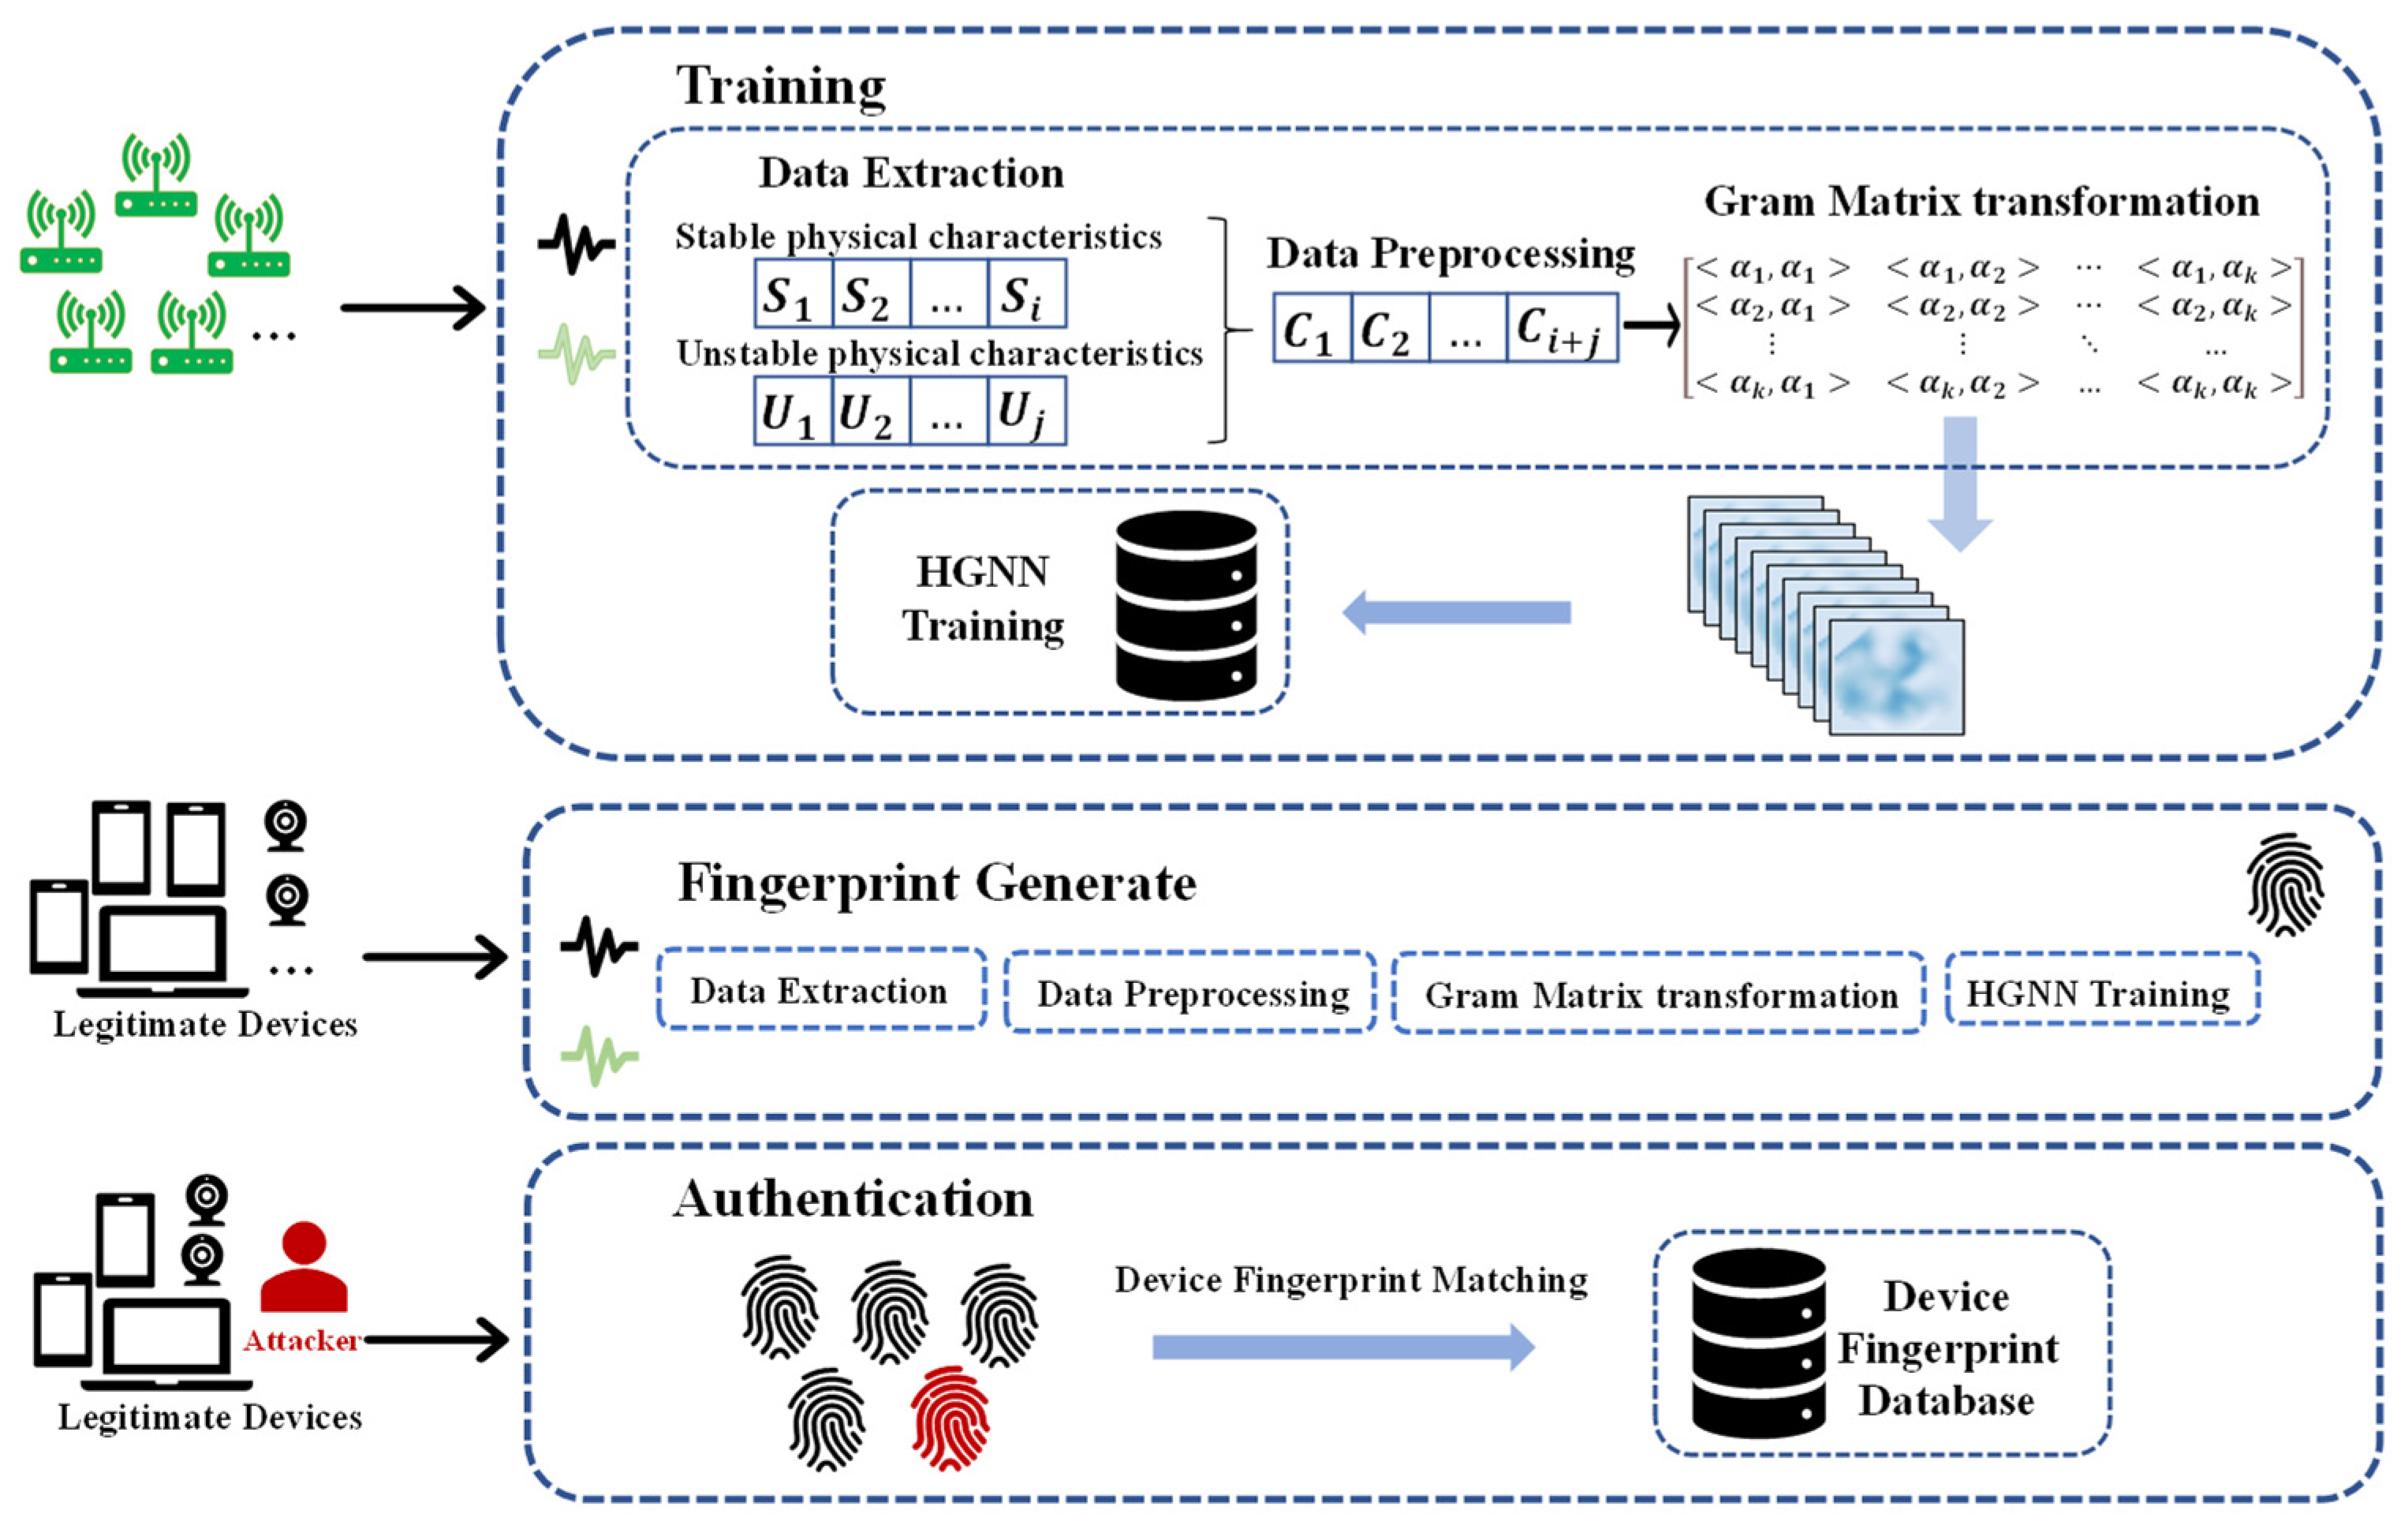
Experimental results demonstrate that the proposed adaptive environment-enhanced device intrinsic security fingerprint recognition system significantly improves accuracy and reliability in outdoor environments. The method effectively addresses the impact of constantly changing physical factors on device intrinsic fingerprints, presenting a breakthrough in the field of mobile device security and authentication. The comprehensive recognition accuracy of the proposed method reaches 98% in continuously changing environmental conditions.
The remainder of this paper is organized as follows: Section 2 provides an overview of the system. Section 3 introduces the extraction of the device’s physical features and data processing methods. Section 4 details the construction process of the hypergraph neural network for building device intrinsic security fingerprints. Section 5 presents extensive experimental results to showcase system performance. Section 6 and Section 7, respectively, introduce related works and summarize the paper.

2. System Overview

To address the impact of environmental physical noise fluctuations on the intrinsic security fingerprints within devices, this paper proposes the design of an adaptive environment-aware intrinsic security fingerprint recognition system. The overall system architecture is illustrated in Figure 1, comprising three main stages: model training, fingerprint generation, and identity recognition.

2.1. Model Training

During the model training phase, the system initially records data in a real physical environment. The adaptive environment-aware intrinsic security fingerprint recognition system collects a series of continuous data on the terminal’s physical features under different environmental conditions. These features include stable clock deviation information unaffected by time changes and channel state information susceptible to environmental interference and varying over time.
The system proceeds with feature extraction, employing the least squares fitting method to extract clock deviation information. Simultaneously, channel estimation is used to extract the amplitude values from the channel state information, and both are recorded to capture their temporal variations. In the data processing stage, the Gramian angular field [7] is introduced for feature transformation, converting temporal data into a two-dimensional format. This transformation provides richer input information to the neural network, enabling the model to consider the temporal changes in the terminal’s physical features as crucial parameters. The two-dimensional data are then fed into the hypergraph neural network (HGNN) [8] for model construction, enhancing adaptability to environmental changes. The training phase of the model covers diverse real-world environmental data, ensuring robust performance under various conditions.
In the model evaluation phase, an independent test set is utilized to validate performance, with a particular focus on fingerprint recognition accuracy in outdoor environments. Through multiple rounds of adjustment and optimization, the model’s high reliability in real environments is ensured. The goal is to construct an intrinsic fingerprint recognition model adaptable to diverse environments, ultimately improving fingerprint recognition accuracy in outdoor settings.

2.2. Fingerprint Generation

In the fingerprint generation phase, the system collects and records the physical features of multiple legitimate devices. Utilizing the pre-trained model, unique intrinsic security fingerprints representing each legitimate device are generated and stored in the device’s intrinsic security fingerprint database.

2.3. Identity Recognition

In the identity recognition phase, the system, based on the physical features of a device attempting to connect to the system, extracts the intrinsic security fingerprint of that device. It then compares this fingerprint with the data in the device’s intrinsic security fingerprint database to determine whether the device is an authenticated legitimate device. As legitimate devices cannot modify their own physical features, the intrinsic security fingerprint of legitimate devices cannot be forged. Illegitimate devices are thus identified, enhancing the security of identity recognition.

3. Extraction of Physical Device Features

In the feature extraction phase, we employed statistical analysis methods to extract signal clock deviation as a stable feature for the fingerprint. Simultaneously, we utilized time-series analysis methods to extract the temporal patterns of channel state information. In this way, we obtained a comprehensive set of features to fully capture the dynamic changes in the intrinsic security fingerprint of the device.

3.1. Clock Deviation Fingerprint

Device clock deviation is a physical characteristic that can be understood as the operation of a clock based on a crystal oscillator with a small but measurable speed deviation. It can serve as a unique identifier for a device and is resistant to forgery by attackers.
In ordinary computer clocks (and in the operation of TSF timers in Wi-Fi chipsets), the clock signal is generated by crystal oscillators. The frequency of crystal oscillators is determined by their manufacturing characteristics (such as cutting angle) and the type of crystal. Even crystals of the same model, series, and production date, due to the imperfect mechanical precision in the manufacturing process, will inevitably have inherent inaccuracies, such as slight variations in cutting angles and directions, leading to small changes in frequency.
Clock deviation is typically measured in parts per million (ppm). The clock c calculates time steps starting from some initial point i c in real time. R c ( t ) denotes the timestamp reported by clock c at real time t, and it is given by R c t = t i c . Let e x be the ideal clock under perfect conditions, and its reported timestamp is given by R e x t = t i e x . However, since standard hardware does not use highly precise atomic clocks, there is an offset introduced, represented by o f f c t = R c t ( t i c ) , and its absolute value increases over time. Clock deviation is the first derivative of the offset.
Due to clock deviation being based on the aforementioned crystal oscillator hardware characteristics, it is not easily manipulated or altered by attackers. Moreover, even for IoT devices of the same model, clock deviation fingerprints can exhibit differences. Therefore, clock deviation can uniquely identify hardware devices, and its value is less susceptible to external factors such as temperature and location, demonstrating a certain degree of stability. Hence, we aim to achieve reliable device recognition by utilizing clock deviation as a part of the intrinsic security fingerprint features.
When collecting clock deviation information, it is typically obtained from Beacon frames during device communication. Beacon frames are data frames used in wireless communication to transmit basic system information, including details about the network, channel, bandwidth, signal strength, and other critical information. Within Beacon frames, there is a TimeStamp field 8 bits in size that is used to synchronize client devices connected to the wireless network and measured in milliseconds. Besides the TimeStamp field being time-related, another time-related field can be obtained when capturing Beacon frames: the capture time. The generation of TimeStamp is mainly related to the hardware construction and drivers of IoT devices, while the capture time can be influenced by channel load. Both are time-related variables. The capture time of Beacon frames can be considered as the independent variable, and the TimeStamp field can be considered as the dependent variable. Using the least squares linear fit, the linear relationship between the capture time of Beacon frames and the TimeStamp field can be determined, which is also referred to as clock deviation.
Two mathematical methods are commonly used to estimate device clock deviation: the linear programming method (LPM) and the least squares fitting method (LSF). However, LSF is more sensitive to a small number of outliers compared to LPM. Therefore, when LSF is employed for clock deviation estimation and device identification, it exhibits higher sensitivity. In this paper, we adopt the least squares fitting method (LSF) to estimate device clock deviation.
For example, consider a set of data from a group of Beacon frames with a sliding window of size n: t 1 , T 1 , t 2 , T 2 , , t i , T i , , t n , T n , where t i represents the reception time of the i Beacon frame, and T i represents the TimeStamp field in the i-th Beacon frame. When employing the least squares method to handle timestamps and the capture time of Beacon frames, in order to eliminate differences introduced by the time between each set of data, preprocessing is applied to these two attributes. The preprocessing methods are expressed as Formulas (1) and (2):
x i = t i t 0
y i = T i T 0
With each set having the corresponding timestamp and capture time variables ( x i , y i ) , the least squares method is employed to extract the linear relationship for each set of corresponding ( x , y ) data. Assuming a linear relationship y = α x + β , where α and β are the parameters to be determined, the objective is to minimize the sum of squared distances between this linear relationship and all ( x i , y i ) pairs. This is expressed in Formula (3):
i = 1 n y i α t i β 2
The least squares fitting algorithm is used to calculate α and β .
Analyzing the clock deviation obtained through the least squares fitting computation for Beacon frames from different IoT devices reveals significant differences in clock deviation among various IoT devices. Moreover, the values of α and β for the same device are remarkably stable. Clock deviation emerges as a relatively stable discriminative fingerprint feature, minimally affected by external environmental factors. Only the capture time experiences slight fluctuations due to changes in channel load. Therefore, clock deviation can be considered one of the stable physical features of the intrinsic security fingerprint of a device.

3.2. Channel State Information

The wireless channel is an abstract representation of the communication link between the transmitter and receiver in wireless communication. Due to multipath propagation issues, the signal received in a wireless environment is, in reality, the sum of an infinite number of original transmitted signals, each subject to attenuation, delay, and phase shift. Interference occurs among the various delay paths. Additionally, the relative movement of mobile terminals and changes in the environment can alter the paths, leading to random fluctuations in signal amplitude and phase. These variations are user-specific, providing a valuable resource for physical layer security.
Furthermore, the wireless channel exhibits characteristics such as randomness, time variation, unpredictability, and uniqueness. The randomness of channel features is inherent to the channel itself. Time variation in the channel refers to rapid changes in channel state over time, resulting in independent channel characteristics within time intervals greater than the channel coherence time. Channel unpredictability arises from the random changes in the channel due to environmental variations. Channel uniqueness refers to the distinctiveness of channel features in different spatial locations.
These physical characteristics of the wireless channel serve as the foundation for research in physical layer security. In this study, we leverage the Channel State Information (CSI) of the wireless channel, comparing the estimated CSI of the current instance with the previous CSI as a part of the intrinsic security fingerprint. CSI is one of the features of the wireless channel, representing the frequency response of the wireless channel at the sampling points of each subcarrier in an Orthogonal Frequency Division Multiplexing (OFDM) system.
In OFDM systems, the CSI, composed of the fading, scattering, and transmission distance of subcarriers, can be utilized to depict the channel state between the transmitter and receiver [9]. Its frequency-domain model is represented as
Y = H X + N
In the frequency-domain model, where X is the transmitted signal, Y is the received signal, H is the channel frequency response, and N is Gaussian white noise.
The expression for the Channel Frequency Response (CFR) can be easily obtained through the pilot part of each OFDM symbol:
H = k K h k · e j · φ k
The magnitudes and phases of signals on each subcarrier are denoted as h k and φ k , respectively.
Channel State Information (CSI) is typically acquired through channel estimation methods in wireless communication. In wireless transmission, signals emitted by the transmitter propagate along multiple wireless paths to reach the receiver, forming a wireless multipath channel utilized for device communication. CSI commonly refers to the Channel Frequency Response (CFR) of this wireless multipath channel. Thus, when the transmission frequency is f , CSI can be expressed as:
H f = n N a n e j 2 π f τ n
According to Equation (6), CSI reflects the overall amplitude attenuation and phase shift of the wireless channel. In practical wireless communication, each propagation path constituting the wireless channel experiences distinct amplitude attenuation and time delay. As wireless signals arrive at the receiver via different paths, signals with different amplitudes and phases superimpose to form the final received signal. CSI, in turn, reflects the amplitude attenuation and phase shift resulting from the superposition of multiple propagation paths.
In Orthogonal Frequency Division Multiplexing (OFDM) wireless networks, a set of CSI data is generated for each antenna pair. Each set of CSI data is an array with a length equal to the number of CSI values in the subcarriers of the OFDM mechanism. Each CSI value in the array represents the sampled value of the channel frequency response at the center frequency of the corresponding subcarrier, as expressed in the mathematical representation of each set of CSI data:
C S I k = c s i k e j c s i k , k = i , , 1,1 , , i
where c s i k represents the magnitude of the CSI value, and C S I k represents the phase of the CSI value. This paper adopts the magnitude of CSI as the fingerprint feature.
To mitigate the negative impact of amplitude variations on fingerprint recognition performance, each CSI magnitude sequence undergoes maximum–minimum normalization. When a 1 , a 2 , , a k represents a set of CSI magnitudes, let a m a x = m a x a 1 , a 2 , , a k , a m i n = m i n a 1 , a 2 , , a k . The maximum–minimum normalization method is then expressed as:
c i = a i a m i n a m a x a m i n .
The normalized CSI magnitude sequence is denoted as CSI fingerprint; C F P = c 1 , c 2 , , c k . The normalized CSI magnitude sequence exhibits smaller dispersion compared to the unprocessed CSI magnitude sequence.

4. Feature Transformation and Model Construction

There are numerous methods for extracting Channel State Information [10]. After a thorough comparison, we have opted to utilize Nexmon as our CSI extraction tool, owing to its more convenient extraction process and superior extraction efficiency [11].
In dynamic environments, the CSI (Channel State Information) fingerprints of devices exhibit temporal variations. These fluctuations, primarily due to environmental changes, necessitate a robust model capable of adapting to these variations. We address this challenge by employing an aggregated hypergraph neural network architecture.
The proposed model processes temporal CSI data by transforming it into a format suitable for hypergraph neural networks. This transformation involves the use of Gramian angular fields (GAF), a technique that converts time series data into a structured format. GAF represents the temporal relationships within CSI data, capturing the essence of its dynamic nature. Environmental factors such as temperature, humidity, and signal interference cause significant changes in CSI fingerprints. These changes are crucial in model construction as they directly affect the reliability of device identification. We analyze these factors, detailing how they influence CSI data over time and, consequently, the model’s adaptation to these changes.
The hypergraph architecture excels in handling the localized information structure of CSI data. By aggregating local state information from adjacent sequential signals, the model adapts to the evolving nature of CSI fingerprints. This approach ensures that the intrinsic device fingerprint recognition remains reliable, even in fluctuating environmental conditions.

4.1. Gramian Angular Fields

Univariate time series, to some extent, may not adequately capture the commonality and latent states in the data. To address this limitation, a common approach involves employing transformation equations to map the original one-dimensional sequence into a high-dimensional form. However, most mapping methods tend to overlook the transformation of the time variable, which contains information about the timing and sequence of events. Consequently, after mapping, the temporal dependencies in the time series tend to disappear.
To better handle these extracted features, we introduce Gramian angular fields (GAFs) [12] for feature transformation. The use of Gramian angular fields enables the conversion of time series data into an image-like format, effectively capturing complex relationships between features and providing richer input information for subsequent hypergraph neural network models.
When encoding time series with Gramian angular fields, as time progresses, positions move from the upper-left corner to the lower-right corner, encoding the time dimension into the geometric structure of the matrix. This preserves temporal dependencies to the maximum extent. Therefore, in this study, we utilize Gramian angular fields to replace the original one-dimensional sequence with a more comprehensive representation. The Gramian matrix is defined as the matrix composed of the pairwise inner products of any k vectors in n-dimensional Euclidean space:
Δ α 1 , α 2 , , α k = γ ( α 1 , α 1 ) γ ( α 1 , α 2 ) γ ( α 1 , α k ) γ ( α 2 , α 1 ) γ ( α 2 , α 2 ) γ ( α 2 , α k ) γ ( α k , α 1 ) γ ( α k , α 2 ) γ ( α k , α k )
Here, γ ( α i , α j ) is a newly defined function used to calculate the relationship between vectors α i and α j . This relationship encompasses more than just the simple inner product; it includes the direction and magnitude of the vectors, as well as the angle information between them. When ω i , j is the angle between the two vectors and assuming that all vectors in Equation (9) are unit vectors, we have
Δ α 1 , α 2 , , α k = cos ω 1,1 cos ω 1,2 cos ω 1 , k cos ω 2,1 cos ω 2,2 cos ω 2 , k cos ω k , 1 cos ω k , 2 cos ω k , k
As evident from the above equation, the Gramian matrix is a positive semi-definite matrix. Conversely, every positive semi-definite matrix is the Gramian matrix of some vectors. The Gramian matrix encompasses the angles and orientation relationships between vectors. The collective term for GAFs includes Gramian Summation Angular Field (GASF) and Gramian Difference Angular Field (GADF). Equations (11) and (12), respectively, provide the definitions of GASF and GADF:
G A S F = η ( θ 1 , θ 1 ) η ( θ 1 , θ 2 ) η ( θ 1 , θ k ) η ( θ 2 , θ 1 ) η ( θ 2 , θ 2 ) η ( θ 2 , θ k ) η ( θ k , θ 1 ) η ( θ k , θ 2 ) η ( θ k , θ k )
G A D F = ξ ( θ 1 , θ 1 ) ξ ( θ 1 , θ 2 ) ξ ( θ 1 , θ k ) ξ ( θ 2 , θ 1 ) ξ ( θ 2 , θ 2 ) ξ ( θ 2 , θ k ) ξ ( θ k , θ 1 ) ξ ( θ k , θ 2 ) ξ ( θ k , θ k )
Here, η and ξ are new functions for the sum of angles and the difference of angles, respectively. They can be any suitable nonlinear functions, such as variants of the sine and cosine functions. These functions are capable of capturing complex patterns and features in time series data more effectively. In the feature extraction step, it is essential to extract features of the device over a specific period. A vector V i = [ A , c 1 , c 2 , , c k ] is formed by combining the clock deviation feature value A extracted at time t i with the processed CSI amplitudes. To meet the requirements of the model construction, a considerable amount of feature data is collected over a certain period, and the data is grouped into sets of n entries, which are then input into the Gramian angular field.
Before this, various processes such as normalization and quantization encoding are applied to the elements of V i . Eventually, each element is transformed into a binary sequence of m bits, resulting in the formation of a vector T i = [ b 1 , b 2 , , b m ( k + 1 ) ] , where b i equals either 0 or 1. The specific steps for temporal multi-dimensionalization of Gramian angular fields are outlined as follows:
Step 1: Normalization Processing:
Given a one-dimensional sequence X = {x1, x2, …, xn}, employ Equation (13) to perform min-max normalization on the sequence.
x ~ i = ( x i max ( X ) + ( x i min ( X ) ) max ( X ) min ( X )
Step 2: Coordinate Transformation:
If the time units corresponding to the sequence are considered as radii, the time sequence in Cartesian coordinates can be transformed into a time sequence in polar coordinates:
ω = arccos ( x ~ i ) , 1 x ~ i 1 , x ~ i X ~ r = t i N , t i N
where ti represents a time point, and N is a constant polar coordinate span.
Step 3: Inner Product Calculation:
Define the inner product < x , y > = f x , y = x · y 1 x 2 · 1 y 2 and < x , y > = 1 x 2 · y x · 1 y 2 . Substituting Equations (13) and (14) yields the Gram matrix < x 1 ~ , x 1 ~ > :
G G A S F = [ f ( θ i + θ j ) ]
G G A D F = [ g ( θ i θ j ) ]
G G A S F and G G A D F represent the relative relationships between different vectors in terms of superimposition and difference over time intervals, reflecting their temporal dependencies [12].
Further obtaining the input Gramian angular field (GAF) data as < T 1 , T 2 , T n > , the Gram matrix for these n vectors is obtained as
Δ T 1 , T 2 , , T k = f ( T 1 , T 1 ) f ( T 1 , T 2 ) f ( T 1 , T k ) f ( T 2 , T 1 ) f ( T 2 , T 2 ) f ( T 2 , T k ) f ( T k , T 1 ) f ( T k , T 1 ) f ( T k , T k )
Each element of the Gram matrix for these n vectors can be regarded as a pixel on the graph. Therefore, the generated Gram matrix can be used as training samples for the hypergraph neural network. By collecting a large amount of data samples and feeding them into the hypergraph neural network to generate the device’s intrinsic security fingerprint model, the robustness and accuracy of the model can be improved.
Furthermore, to reduce the dimensionality of Gram Angular Fields (GAFs) and decrease computational complexity, we employ Piecewise Aggregation Approximation (PAA). This method calculates the piecewise aggregate average, preserving the trend-change characteristics of the sequence. In the context of continuously sampled Channel State Information (CSI) fingerprints, the integration of CSI into the GAF transformation is depicted as follows:
G A F C S I t = c o s θ t , t 1 c o s θ t , t n c o s θ t n , t 1 c o s θ t n , t n
where θ t i , t j is the cumulative angular difference between H t i X t i + N t i and H t j X t j + N t j . Here, H t represents the channel frequency response at time t , X t is the transmitted signal, and N t is the noise. This function θ calculates the cumulative angular difference for the CSI fingerprints transformed through the channel response over time. This integrated approach provides a comprehensive view of how CSI data, influenced by channel characteristics and noise, is transformed into a meaningful GAF matrix, capturing the temporal dynamics essential for security fingerprint recognition.

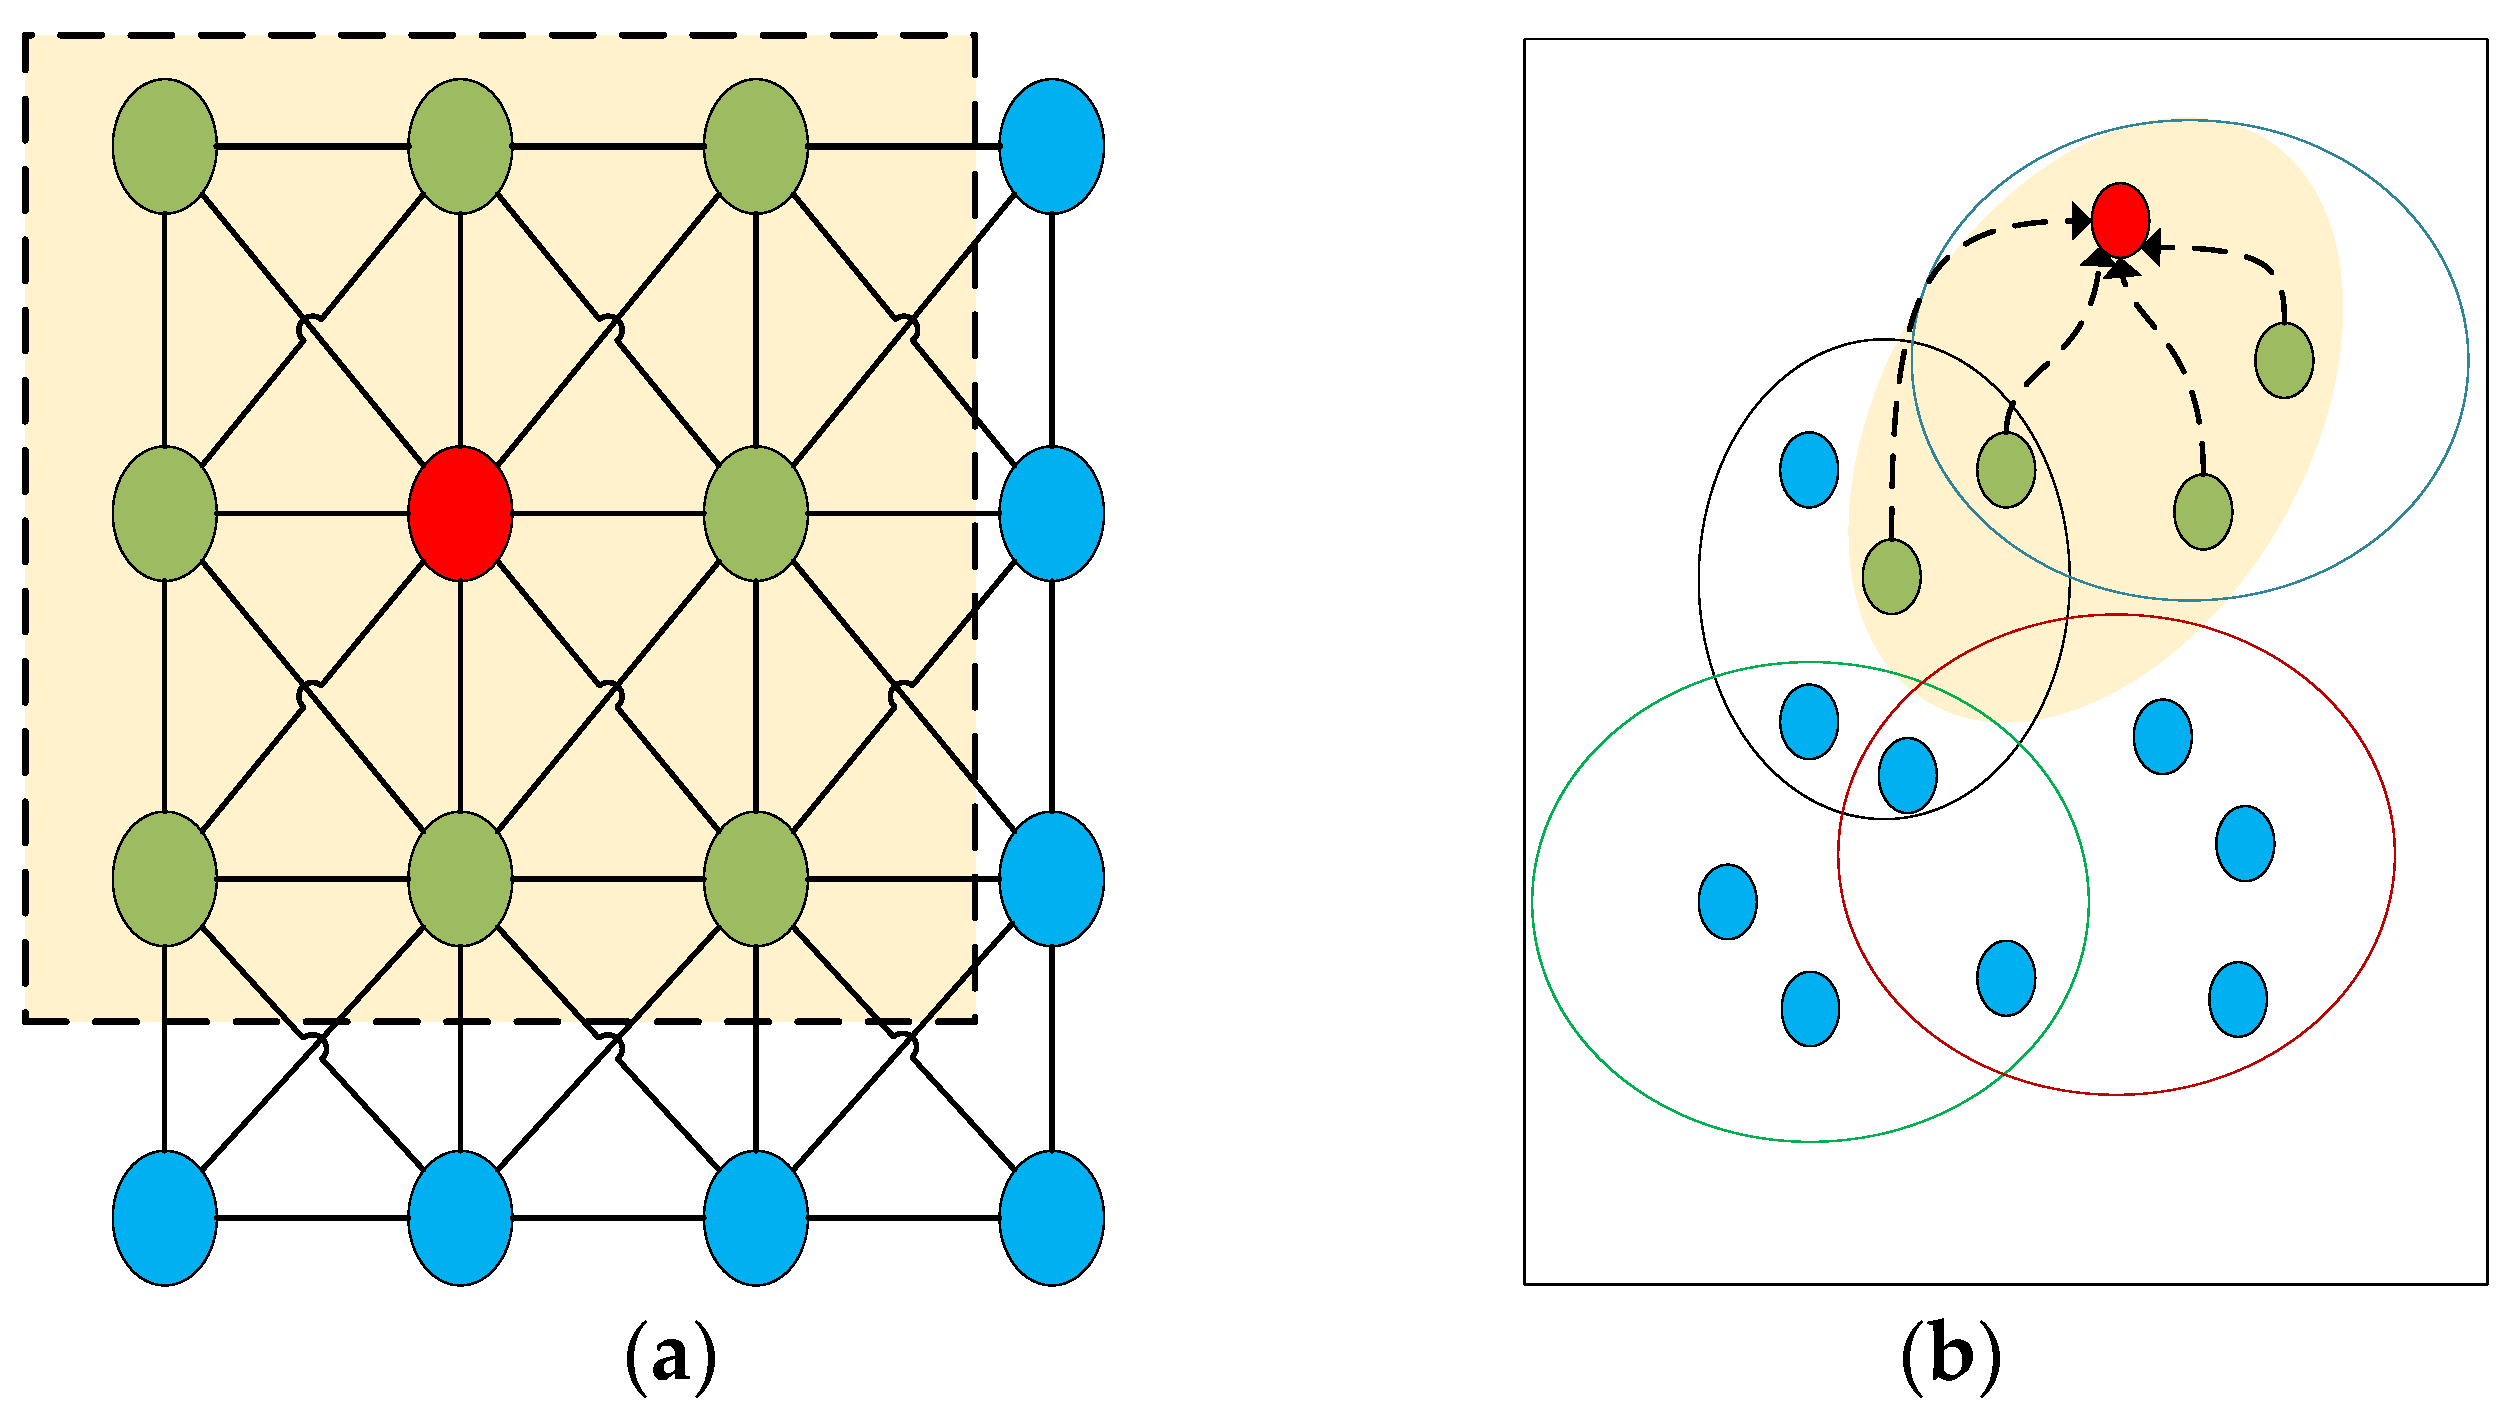
4.2. Hypergraph Neural Networks

Next, we employ a hypergraph neural network (HGNN) for model construction [4], leveraging the open-source code provided in the referenced paper to process experimental data. In the realm of machine learning, especially in context-specific scenarios, handling complex data structures is often essential. In this study, the intricacies lie in the relationships between data points within the acquired two-dimensional graph structure and between adjacent graph-structured data. These relationships not only reflect the correlations among device physical features but also capture the dynamic changes in intrinsic security fingerprints over time in real-world environments—changes that are fundamental to defining intrinsic security fingerprints.
Particularly, the sensitivity of HGNN to specific fingerprint features, identified in the preceding section, plays a pivotal role in the training of the fingerprint model. This sensitivity allows HGNN to efficiently process and analyze fingerprint data, thereby enhancing the adaptability of the model to environmental changes. During the model training phase, it is crucial to include input samples that encompass continuous data from various real-world environments, ensuring the model’s robustness under different conditions.
In practical scenarios, representing a group of intricately correlated objects merely as a graph model may be inadequate. To address this, Berge [13] introduced hypergraphs in 1970 as an extension of graph methods. Hypergraphs are adept at considering multi-adic relations between objects, making them a suitable choice for modeling collaborative networks and complex interactions between data. This suitability is especially apparent in our application, where the hypergraph model effectively captures and processes the complex interactions inherent in device security fingerprint data.
According to Berge’s hypergraph definition, let V = { v 1 , v 2 , , v N } be a finite set. A hypergraph on ν is defined by E = { e 1 , e 2 , , e E } of hyperedges. Each hyperedge e i is a non-empty subset of ν , satisfying
i = 1 E e i = V , e i i = 1,2 , , E
Incorporating clock deviation (CD), Channel State Information (CSI), and GAF parameters, the association matrix H and hyperedge weight equation ω e are redefined:
h v i , e j ; δ C D , Θ C S I , γ G A F = 1 + α δ C D v i + β Θ C S I v i + γ γ G A F v i 0 ,
Here, γ G A F represents the GAF parameters influencing the hypergraph structure. The weights α , β , and γ are adjustment factors for clock deviation, CSl, and GAF parameters, respectively. This formulation enables the hypergraph model to capture the intrinsic security fingerprints of devices more accurately, considering the influence of clock deviations, wireless channel responses, and GAF-transformed features.
Figure 2 illustrates the general framework of the hypergraph neural network, comprising two main modules: hypergraph modeling and hypergraph convolution.
The hypergraph neural network also follows a neighborhood aggregation scheme, calculating the vector representation of the central node through recursive aggregation and transformation of the neighborhood node representations [14]. This process is accomplished by convolutional operators. In traditional neural networks, the convolutional kernel operates within an ordered, fixed-size neighborhood of nodes, as shown in Figure 3a. Hypergraph convolution, as illustrated in Figure 3b, aggregates the features of the red node and its neighborhood (i.e., nodes connected by dashed lines) through weighted aggregation. The neighborhood of nodes in the hypergraph is unordered and variable in size, making it challenging to obtain a unified convolutional kernel for convolutional operations.
Neural networks fundamentally possess the ability to learn from data, typically consisting of training and testing datasets. The network initially learns a model from the training set and then evaluates the practical predictive capability of the obtained model using the test data. Both hypergraph neural networks and traditional neural networks utilize forward propagation to compute output values and employ backward propagation to adjust weights and biases. During forward propagation, the input signals and their corresponding weights are multiplied, and an activation function is applied to the sum of these products to enhance the model’s expressive power. Backward propagation enables the training of deep neural networks by first calculating the network’s error, determining the gradients of the parameters through optimization methods, and finally updating parameter values in the opposite direction of the loss function gradient.
To ensure the robustness of the model under different environmental conditions, a specific time period T is defined. In this period, a novel approach is employed to handle the data points corresponding to adjacent graph structures collected at intervals of t. These n graphs are connected into a hyperedge, forming a hypergraph where nodes represent data points, and edges capture relationships between adjacent time points. Such a hypergraph structure within a specific time period T serves as a sample, providing a more comprehensive reflection of the temporal evolution of the data and the complex relationships between nodes.
Next, a hypergraph neural network (HGNN) is introduced to process and learn from the hypergraph. During the training phase, initial features are assigned to each node in the hypergraph, which may originate from the information obtained during the feature transformation step. Through hypergraph convolution layers, HGNN effectively considers higher-order relationships between nodes and the evolution between adjacent time points, thereby better capturing the dynamic characteristics of the data.
Emphasis is placed on the importance of adaptive training during the model training process, ensuring that the model exhibits robustness under different environmental conditions. This implies that our model needs to take as input hypergraphs composed of continuous data from various real-world environments, enhancing its adaptability to different environmental changes.
Ultimately, the trained HGNN model can be applied to various tasks, including predicting the states of nodes at future time points and learning higher-order relationships. This versatility demonstrates the strong potential of our approach in fields such as dynamic system modeling and time series prediction.

5. Experimental Conclusions

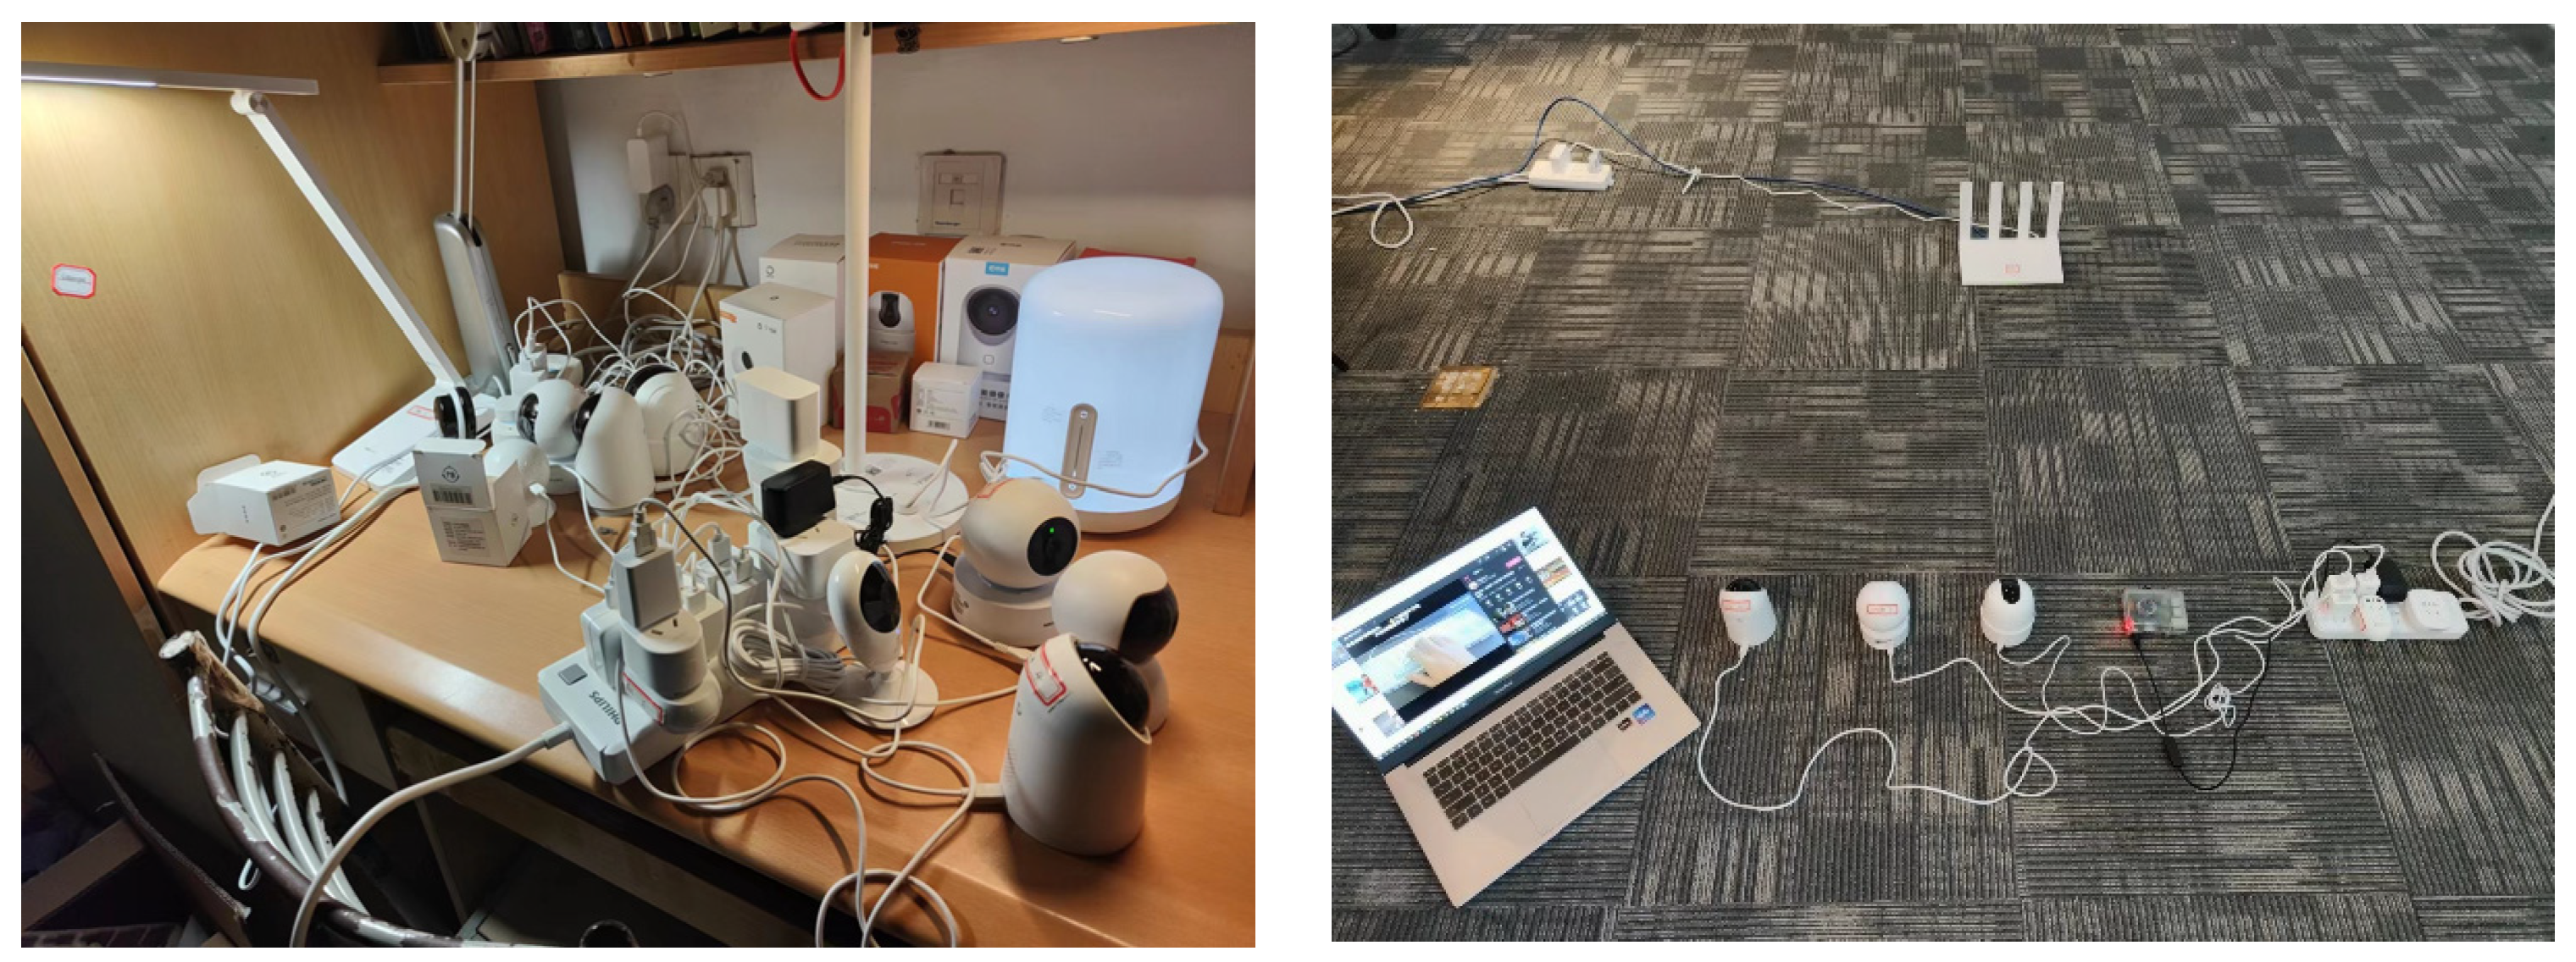
5.1. Experimental Setup and Evaluation Methods

During the model evaluation phase, an independent test set was utilized to validate the model’s performance, with a specific focus on its fingerprint recognition accuracy in outdoor environments. By analyzing the model’s output results, we assessed not only accuracy but also the model’s robustness and stability. Based on the analysis outcomes, multiple rounds of model adjustments and optimizations were performed to ensure the model’s high reliability in practical applications within real-world environments.
We employed two common performance metrics in machine learning, precision and recall, to evaluate the classification model. Precision and recall are defined as follows:
P r e c i s i o n = T P T P   +   F P
R e c a l l = T P T P + F N
Precision refers to the proportion of samples predicted as positive by the model that are indeed positive. High precision indicates accurate positive predictions by the model.
Recall represents the proportion of actual positives that the model successfully predicted as positive. High recall indicates the model’s ability to capture actual positives.
There is a trade-off between these two metrics. Improving precision may lead to a decrease in recall and vice versa. Therefore, to comprehensively consider both metrics, we used the F1 Score, which is the harmonic mean of precision and recall:
F 1 = 2 × P r e c i s i o n   ×   R e c a l l P r e c i s i o n   +   R e c a l l
In this study, a diverse array of physical characteristics from various IoT devices was amassed in real-world settings for experimental analysis. Post data preprocessing, these attributes were input into a hypergraph neural network model. The implementation took place on a personal computing device running Ubuntu 20.04 and equipped with a 3.20 GHz CPU and 16.00 GB RAM. The device ensemble included wireless cameras, smart sockets, intelligent desk lamps, Raspberry Pi, and STM32 microcontrollers, among others, forming a broad spectrum of IoT and industrial control devices, as depicted in Figure 4. It is noteworthy that Figure 4 illustrates merely a subset of the devices engaged in this study.
The experimental setup incorporated meticulous environmental controls to simulate varying conditions. This was achieved through the deployment of humidifiers and heaters strategically positioned to modulate ambient temperature and humidity levels. These conditions were precisely monitored using hygrometers, ensuring a controlled yet dynamic experimental environment. Such measures were pivotal in evaluating the IoT devices’ performance and resilience under different environmental scenarios.
In our experiment, the use of humidifiers and heaters was pivotal for creating specific environmental conditions. Humidifiers were set to maintain a relative humidity ranging from 50% to 70%, depending on the scenario, simulating conditions from moderately dry to extremely humid environments. Heaters, on the other hand, were used to create temperature variations from 10 °C to 30 °C, replicating both cool and hot conditions. For instance, to simulate a tropical environment, the humidifier was adjusted to maintain a humidity of approximately 65%, and the heater was set to 25 °C. The environmental conditions were continuously monitored using digital hygrometers, ensuring precise control. These settings were crucial to assess the functionality and resilience of IoT devices under varying climatic conditions.

5.2. Analysis of Experimental Results

In the context of our experimental paradigm, consistent environmental conditions were meticulously maintained. This included a controlled ambient temperature of 20 °C and a relative humidity of 70%. Critically, the duration for each Channel State Information (CSI) collection was set at 20s, aligning with our earlier discussion on the Gram–Schmidt process for CSI transformation. A series of trials were conducted across diverse electronic devices, rigorously evaluating the model’s precision, recall, and F1 score metrics. The ensuing results are succinctly encapsulated in Table 1.
The experiments indicate that our model demonstrates highly reliable performance in recognizing the intrinsic security fingerprints of devices amid the comprehensive challenges posed by physical noise fluctuations in the environment. The combined assessment of precision and recall highlights the model’s outstanding accuracy and recall capabilities in recognizing device-specific intrinsic security fingerprints, particularly in outdoor environments. This underscores its adaptability to complex conditions in real-world settings.
Furthermore, this paper analyzes the ROC curves and AUC of the authentication results for Device 1 in three typical environments, as shown in Figure 5:
In Figure 5, we explicate the ROC curves for Device 1 authentication across three carefully delineated environments. Environment 1, denoted by the blue line, illustrates a quintessential laboratory setting meticulously maintained at a constant temperature and shielded from electromagnetic disturbances, thereby providing a benchmark for optimal device performance. Environment 2, represented by the orange line, mimics an industrial milieu with prevalent electronic disruptions and thermal fluctuations, challenging the device’s identification fidelity. Lastly, Environment 3, shown in green, embodies an outdoor landscape, subject to the whims of nature, with variable weather patterns and the potential for erratic signal interference, testing the limits of the device’s discriminating abilities. The AUC values, alluding to proximity with unity, affirm the model’s exceptional aptitude in distinguishing true positives from false positives within these multifarious conditions. This suggests the model’s high efficacy for the classification task at hand.
The paper conducted recognition accuracy tests for device-specific intrinsic security fingerprints under different temperature and humidity conditions:
The experimental results depicted in Figure 6 articulate the model’s recognition accuracy for device intrinsic security fingerprints under varying room temperatures and humidity conditions. The comparison table presented below contrasts these data with the accuracy obtained from traditional direct CSI fingerprint recognition methods. It highlights the superiority of the proposed model in terms of adaptability and robustness across diverse environmental scenarios, from cold and dry to hot and humid, offering robust support for real-world applications under fluctuating climatic conditions.
The bar chart in Figure 7 provides a detailed comparison of recognition accuracies for intrinsic security fingerprints between two methodologies: the direct Channel State Information (CSI) method (indicated by blue bars) and the enhanced model proposed by this research (represented by red bars).
For ‘Cold and Dry’ conditions, the direct CSI method shows an accuracy of 87%, which is significantly improved to 95% by the proposed model. In ‘Cold and Humid’ scenarios, the direct CSI recognition stands at 89% accuracy, whereas the proposed model achieves a notable increase to 97%. The trend of improvement continues in ‘Hot and Dry’ conditions, where the direct CSI method records an accuracy of 90%, and the proposed model registers a higher accuracy of 96%. Lastly, under ‘Hot and Humid’ conditions, the direct CSI method’s accuracy is 88%, while the proposed model demonstrates a marked improvement with an accuracy of 94%.
This comparative illustration clearly demonstrates the superior performance of the proposed model across all tested environmental conditions. The marked improvements in accuracy, particularly in extreme conditions, emphasize the robustness of the proposed model and its suitability for diverse operational scenarios.
To comprehensively evaluate the stability and reliability of our method in real-world environments, we conducted an extensive three-day continuous test using multiple devices, with device authentication being performed every 30 min. These devices were deployed across various IoT application scenarios to maximally simulate real-world environmental changes and interactions. Table 2 presents the performance of each device during the testing period, including metrics such as precision, recall, and F1 score. These indicators reflect the consistency and robustness of our method across different devices.
Based on the above experimental results, it can be observed that we have constructed an endogenous fingerprint recognition model using a hypergraph neural network, which adapts well to diverse environments and improves fingerprint recognition accuracy in outdoor settings. The hypergraph network demonstrates significant advantages in endogenous security fingerprint feature recognition. Firstly, it effectively handles complex nonlinear correlations, capturing correlated high-order features in the inherent security fingerprints of devices. Secondly, the hypergraph network adapts to dynamic environments by capturing the interactive influences of adjacent sequential signals, thereby enhancing the accuracy and reliability of the fingerprint recognition system in practical environments. Lastly, the network handles high-dimensional data, aiding in capturing the spatiotemporal features of inherent security fingerprints, thus enhancing the system’s adaptability to dynamic environments. Considering these advantages, the hypergraph network proves to be an effective tool for fingerprint feature recognition in dynamic environments.
The proposed solution in this paper constructs a robust and adaptable endogenous fingerprint recognition model in real environments. It not only performs exceptionally well under laboratory conditions but also, through multiple rounds of adjustments and optimizations, ensures high reliability in real-world applications.

6. Relate Works

Device intrinsic security fingerprint recognition is an identity verification method that utilizes the hardware features of mobile or terminal devices to identify and verify the identity of users or devices. As a component of intrinsic security, device intrinsic security fingerprint recognition is regarded as the practical application of intrinsic security strategies, embedding uniqueness and non-forgeability into the device itself.
The concept of intrinsic security was initially proposed by Jiang Weiyu and others [15]. Its objective is to reduce or eliminate dependence on external security measures and protect data and resources by constructing security within the system itself. In this field, there is a wealth of related research applied to the study of biometrics-based authentication methods, mobile device security, exploration of hardware security, investigation of device recognition and identity verification under dynamic environmental conditions, improvement of the performance of intrinsic fingerprint recognition systems using machine learning and deep learning methods, and research on enhancing the security of Internet of Things (IoT) devices [16].
Previous research primarily focused on the performance of intrinsic fingerprint recognition in static environments. These studies utilized traditional feature extraction and machine learning methods, typically tested and validated under controlled environmental conditions [17,18]. However, the performance of these methods may be affected when faced with dynamic environments, such as outdoor settings, fluctuations in temperature, changes in humidity, and variations in lighting conditions [19]. This is because intrinsic fingerprints often rely on device hardware features, which may change in continuously evolving environments.
To enhance the performance of intrinsic fingerprint recognition in dynamic environments, this paper adopts real-time data collection and introduces the Gram angle field transformation and hypergraph neural network to better capture the spatiotemporal characteristics of intrinsic fingerprints. The Gram angle field theory was initially proposed by Hungarian scientist, engineer, and physicist Dennis Gabor in 1946 [20]. The Gram angle field is a mathematical tool based on Gabor transformations used to analyze the texture and structural features of images. This method was initially employed in signal processing and communication fields and later became widely used in texture analysis, feature extraction, and image recognition tasks, especially in biometric recognition and image processing fields [21,22]. The Gram angle field is a local feature extraction method that uses kernel functions of different scales and directions, enabling it to capture features of different spatial frequencies and directions in sample data. It possesses a certain degree of rotation invariance, meaning it can recognize texture features with different orientations without being influenced by object rotation. The Gram angle field achieves a good balance between frequency and spatial domains, making it widely applicable in various applications.
Graph convolutional networks (GCN) and hypergraph neural networks are both branches of graph neural networks, with GCN providing the foundation for the development of hypergraph neural networks [23]. In graph theory and mathematics, a hypergraph is a generalized graph data structure used to represent relationships between sets. Unlike traditional graphs where edges connect two nodes, the edges (commonly referred to as hyperedges) of a hypergraph can connect multiple nodes. This flexibility allows hypergraphs to represent many-to-many relationships more effectively, making them suitable for modeling complex relationship networks. Hypergraph neural networks are a type of deep learning model designed to handle complex hypergraph data structures, not just traditional graph data [24]. Hypergraph neural networks extend the scope of traditional graph neural networks to accommodate the characteristics of hypergraph data.

7. Conclusions

This paper proposes an innovative approach that successfully constructs an adaptive device intrinsic security fingerprint recognition system capable of handling environmental changes through real-time data collection, Gram angle field transformation, and hypergraph neural networks. The system effectively extracts spatiotemporal features of device intrinsic security fingerprints in real outdoor environments, significantly improving the accuracy and reliability of device intrinsic security fingerprint recognition in dynamic settings. Experimental results demonstrate that the proposed method achieves satisfactory outcomes in outdoor environments, achieving a device intrinsic security fingerprint recognition accuracy of 99.5%. Through testing under different environmental conditions, the robustness of the model to temperature and humidity variations has been verified, providing strong support for practical applications.
The success of this study overcomes the challenges of device intrinsic security fingerprint recognition in dynamic environments, bringing significant advancements to the security and authentication of mobile and Internet of Things (IoT) devices. Future research directions may focus on further enhancing the model’s performance and considering its application in broader scenarios. By continuously improving the robustness and performance of device intrinsic security fingerprint recognition systems, we aim to provide more trustworthy and secure means of identity verification for IoT terminal devices, addressing the continuously changing real-world environmental conditions.

Author Contributions

Conceptualization, Z.X.; methodology, Z.X.; writing—review and editing, Z.X. and B.Z.; visualization, T.Z.; supervision, G.Z.; project administration, T.Z. All authors have read and agreed to the published version of the manuscript.

Funding

This work was supported by the National Key R&D Program of China [2022YFB31043001].

Data Availability Statement

We confirm that the data supporting the findings of this study are available within the article Additional data that support the findings of this study are available from the corresponding author upon reasonable request.

Acknowledgments

We would like to acknowledge the collective efforts of all the authors in this study.

Conflicts of Interest

Zesheng Xi, Bo Zhang and Tao Zhang are employed by State Grid Smart Grid Research Institute Co., Ltd. The authors declare no conflicts of interest. The funders had no role in the design of the study; in the collection, analyses, or interpretation of data; in the writing of the manuscript; or in the decision to publish the results.

References

  1. Kaur, B.; Dadkhah, S.; Shoeleh, F.; Neto, E.C.P.; Xiong, P.; Iqbal, S.; Lamontagne, P.; Ray, S.; Ghorbani, A.A. Internet of things (IoT) security dataset evolution: Challenges and future directions. Internet Things 2023, 22, 100780. [Google Scholar]
  2. Jurcut, A.; Niculcea, T.; Ranaweera, P.; Le-Khac, N.A. Security considerations for Internet of Things: A survey. SN Comput. Sci. 2020, 1, 193. [Google Scholar]
  3. Dean, A.; Agyeman, M.O. A study of the advances in IoT security. In Proceedings of the 2nd International Symposium on Computer Science and Intelligent Control, Stockholm, Sweden, 21–23 September 2018; pp. 1–5. [Google Scholar]
  4. Malhotra, P.; Singh, Y.; Anand, P.; Bangotra, D.K.; Singh, P.K.; Hong, W.C. Internet of things: Evolution, concerns and security challenges. Sensors 2021, 21, 1809. [Google Scholar]
  5. Rachit, B.S.; Ragiri, P.R. Security trends in Internet of Things: A survey. SN Appl. Sci. 2021, 3, 121. [Google Scholar]
  6. Xu, K.; Fu, S.; Li, Q.; Liu, B.; Jiang, W.; Wu, B.; Feng, X. Research Progress on the Architecture of Endogenous Security System on the Internet. J. Comput. Sci. 2021, 44, 2149. [Google Scholar]
  7. Garibo-i-Orts, Ò.; Firbas, N.; Sebastiá, L.; Conejero, J.A. Gramian angular fields for leveraging pretrained computer vision models with anomalous diffusion trajectories. Phys. Rev. E 2023, 107, 034138. [Google Scholar]
  8. Feng, Y.; You, H.; Zhang, Z.; Ji, R.; Gao, Y. Hypergraph neural networks. In Proceedings of the AAAI Conference on Artificial Intelligence, Honolulu, HI, USA, 27 January–1 February 2019; Volume 33, pp. 3558–3565. [Google Scholar]
  9. Zhang, D.; Wu, D.; Niu, K.; Wang, X.; Zhang, F.; Yao, J.; Jiang, D.; Qin, F. Practical issues and challenges in CSI-based integrated sensing and communication. In Proceedings of the 2022 IEEE International Conference on Communications Workshops (ICC Workshops), Seoul, Republic of Korea, 16–20 May 2022. [Google Scholar]
  10. Gringoli, F.; Schulz, M.; Link, J.; Hollick, M. Free your CSI: A channel state information extraction platform for modern Wi-Fi chipsets. In Proceedings of the 13th International Workshop on Wireless Network Testbeds, Experimental Evaluation & Characterization, Los Cabos, Mexico, 25 October 2019; pp. 21–28. [Google Scholar]
  11. Schulz, M.; Wegemer, D.; Hollick, M. Nexmon: Build your own wi-fi testbeds with low-level mac and phy-access using firmware patches on off-the-shelf mobile devices. In Proceedings of the 11th Workshop on Wireless Network Testbeds, Experimental Evaluation & Characterization, Snowbird, UT, USA, 20 October 2017; pp. 59–66. [Google Scholar]
  12. Wang, J.; Li, S.; Ji, W.; Jiang, T.; Song, B. A T-CNN time series classification method based on Gram matrix. Sci. Rep. 2022, 12, 15731. [Google Scholar]
  13. Berge, C. Graphes; Gauthier-Villars: Paris, France, 1983. [Google Scholar]
  14. Yu, J.; Tao, D.; Wang, M. Adaptive hypergraph learning and its application in image classification. IEEE Trans. Image Process. 2012, 21, 3262–3272. [Google Scholar]
  15. Jiang, W.; Liu, B.; Wang, C. Endogenous Security Network Architecture. Telecommun. Sci. 2019, 35, 20–28. [Google Scholar]
  16. Yu, J.; Hu, A.; Li, G.; Peng, L. A robust RF fingerprinting approach using multisampling convolutional neural network. IEEE Internet Things J. 2019, 6, 6786–6799. [Google Scholar]
  17. Christin, N.; Safavi-Naini, R. Financial cryptography and data security. In Proceedings of the 18th International Conference, Christ Church, Barbados, 3–7 March 2014. [Google Scholar]
  18. Abbas, S.; Nasir, Q.; Nouichi, D.; Abdelsalam, M.; Abu Talib, M.; Abu Waraga, O.; Khan, A.U.R. Improving security of the Internet of Things via RF fingerprinting based device identification system. Neural Comput. Appl. 2021, 33, 14753–14769. [Google Scholar]
  19. de Souza, C.A.; Westphall, C.B.; Machado, R.B.; Loffi, L.; Westphall, C.M.; Geronimo, G.A. Intrusion detection and prevention in fog based iot environments: A systematic literature review. Comput. Netw. 2022, 214, 109154. [Google Scholar]
  20. Gabor, D. Electrical engineers-part III: Radio and communication engineering. J. Inst. 1946, 93, 39. [Google Scholar]
  21. Tang, W.; Jia, F.; Wang, X. Image Large Rotation and Scale Estimation Using the Gabor Filter. Electronics 2022, 11, 3471. [Google Scholar]
  22. Miao, Y.; Jeon, J.Y.; Kong, Y.; Park, G. Phase-based displacement measurement on a straight edge using an optimal complex Gabor filter. Mech. Syst. Signal Process. 2022, 164, 108224. [Google Scholar]
  23. Vashishth, S.; Sanyal, S.; Nitin, V.; Talukdar, P. Composition-based multi-relational graph convolutional networks. arXiv 2019, arXiv:1911.03082. [Google Scholar]
  24. Jin, D.; Huo, C.; Dang, J.; Zhu, P.; Zhang, W.; Pedrycz, W.; Wu, L. Heterogeneous graph neural networks using self-supervised reciprocally contrastive learning. arXiv 2022, arXiv:2205.00256. [Google Scholar]
Figure 1. Overall architecture diagram.
Electronics 13 00656 g001
Figure 2. Schematic diagram of the hypergraph neural network model.
Electronics 13 00656 g002
Figure 3. Difference in convolution between regular data and hypergraph structure data. (a) Convolution on regular data in Euclidean space; (b) convolution on hypergraph.
Electronics 13 00656 g003
Figure 4. Partial experimental devices.
Electronics 13 00656 g004
Figure 5. ROC curves in different environments.
Electronics 13 00656 g005
Figure 6. Recognition accuracy of device intrinsic security fingerprints.
Electronics 13 00656 g006
Figure 7. Fingerprint recognition accuracy under variable environmental conditions.
Electronics 13 00656 g007
Table 1. Precision, recall, and F1 score for different devices.
DevicesPrecision (%)Recall (%)F1
Device-197.897.80.978
Device-298.196.70.974
Device-398.097.50.97
Device-497.298.00.976
Device-597.397.10.972
Table 2. Precision, recall, and F1 score for devices in a continuous test.
DevicesPrecision (%)Recall (%)F1 (%)
Device-196.393.494.5
Device-294.092.193.0
Device-394.893.094.5
Device-497.195.096.0
Disclaimer/Publisher’s Note: The statements, opinions and data contained in all publications are solely those of the individual author(s) and contributor(s) and not of MDPI and/or the editor(s). MDPI and/or the editor(s) disclaim responsibility for any injury to people or property resulting from any ideas, methods, instructions or products referred to in the content.

