Abstract
Cardiovascular disease is a typical chronic disease. The incidence of cardiovascular disease in the elderly population has grown to exceed 50%. The further aging of the current population has brought additional pressure on public health services. Therefore, to reduce the service pressure of medical institutions, accurate prediction of cardiovascular disease risk has become an essential task in intelligent elderly care. In order to achieve accurate prediction of cardiovascular disease risk, we propose a cardiovascular disease risk prediction model Acdim (a cardiovascular disease risk prediction model) based on ResNet (Residual Network), zebra optimization algorithm (ZOA), TabNet (Attentive Interpretable Tabular Learning), and AdaBoost (Adaptive Boosting) algorithms. In training the Acdim model, we used the dat set of the World Health Organization (WHO) Behavioral Risk Factor Monitoring System records. In the experiment, the Acdim model achieved an accuracy of 96%, a precision of 94%, a recall of 93%, a specificity of 95%, an F1 score of 91%, and an AUC of 95%. The experimental results show that the proposed Acdim model can enable elderly care institutions to accurately predict the risk of cardiovascular disease in the absence of doctors.
1. Introduction
Cardiovascular disease is one of the leading causes of death worldwide and is a significant public health service issue. Nearly 20 million people die from cardiovascular disease each year worldwide [1]. Studies have found that the leading causes of cardiovascular disease include stress from health, work, and family, as well as arterial blockage, heart attack, stroke, failure, and peripheral arterial disease [2]. Cardiovascular disease is a common disease among the elderly, which brings much pain to the elderly. At the same time, the aging population also puts tremendous pressure on public health services [3]. The latent period of cardiovascular disease is long, so timely prediction of the risk of cardiovascular disease in the elderly can support the timely detection of the risk of cardiovascular disease and corresponding treatment provision for the elderly [4].
According to our research, in the application scenarios of elderly care, elderly care institutions lack professional doctors and medical testing equipment, making it impossible for elderly care institutions to conduct real-time assessments of the cardiovascular disease risk of the elderly. Our study found that with the medical testing equipment available, it is difficult for elderly care institutions to collect comprehensive physiological test values for the elderly. However, some sample data of pathogenic factors such as smoking, diabetes, height, weight, BMI value, etc., can be obtained generally by elderly care institutions. Therefore, in order to reduce the service pressure on medical institutions due to the aging population and improve the ability of elderly care institutions to predict cardiovascular disease risks, we propose a cardiovascular disease risk prediction model Acdim (a cardiovascular disease risk prediction model) based on ResNet (Residual Network), zebra optimization algorithm (ZOA), TabNet (Attentive Interpretable Tabular Learning), and AdaBoost (Adaptive Boosting) algorithms. The Acdim model can use the sample data of pathogenic factors obtained by the nursing home to predict cardiovascular disease risks.
Our study’s dataset comprises state data on health-related risk behaviors, chronic health conditions, and preventive service use of US residents from the CDC. This dataset includes 19 characteristic variables related to individual lifestyle factors that may lead to any form of cardiovascular disease risk [5]. The application scenario of the Acdim model is shown in Figure 1.
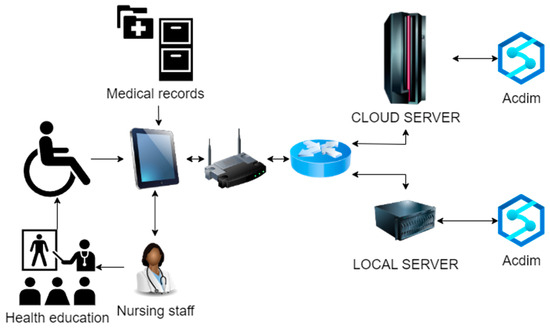
Figure 1.
Acdim model application scenario.
As shown in Figure 1, the cardiovascular disease risk prediction model Acdim will be deployed on the cloud server and local server of the nursing home at the same time. In the daily nursing work, the nursing staff of the nursing home collects the data of factors related to the cardiovascular disease risk of the elderly and the relevant data of the elderly in the medical records, and these are transmitted through the network to the local Acdim model and the cloud Acdim model. The system preferentially receives the response data of the local server where the Acdim model is deployed. If the response of the server where the local Acdim model is located times out, it receives the response data of the remote server where the Acdim model is deployed. After receiving the analysis results of the Acdim model, the nursing staff will carry out relevant health intervention and health education work and ultimately realize the early detection of cardiovascular disease risks, which will increase treatment opportunities for the elderly and improve their quality of life.
In this research work, our goal is that in the application scenario of elderly care, the Acdim model can make accurate predictions about the cardiovascular disease risk of the elderly based on the feature data collected by the nursing home. To accurately predict cardiovascular disease risk, we first use the ResNet model to extract the features of the sample data. Secondly, the zebra optimization algorithm is used to optimize the parameters of the TabNet algorithm and the AdaBoost algorithm. Then, the inverse variance method is used to calculate the weights of the two prediction results of the TabNet algorithm and the AdaBoost algorithm. Finally, the prediction results of the Acdim model for cardiovascular disease risk are output. In the process of our research on cardiovascular disease risk prediction for innovative elderly care, we took the following steps:
- To enhance the model’s ability to obtain sample features, we used the ResNet model to extract sample features in the Acdim model.
- To improve the efficiency of model training, we used the zebra algorithm to optimize the classifier’s parameters in the Acdim model.
- To improve model prediction accuracy, we integrated the TabNet algorithm and the AdaBoost algorithm into the Acdim model to achieve accurate classification of the target.
The Introduction section describes the background of our research in detail. The Related Work section describes the research content related to our research in detail. The Methodology section describes the relevant algorithms referenced in our research and the Acdim model structure we designed in detail. The Experiment section describes the sample data, evaluation indicators, and experimental results we used in detail. The Conclusions section describes our research results and outlines the future research prospects.
2. Related Works
There are many studies on cardiovascular disease risk prediction. For example, N. Mostafa et al. determined the model of cardiovascular disease in the population by analyzing some common physiological attributes [6]. Then, based on this model, they judged whether a person was at risk of cardiovascular disease. This model used the dataset of the UCI data storage platform. In the experiment, the accuracy of the performance of the support vector machine (SVM) and k-nearest neighbor (KNN) algorithms reached 97.03%. A. -Z. S. Bin Habib et al. proposed an integrated complex voting model for cardiovascular disease prediction using a classifier composed of logistic regression (LogReg) [7], random forest (RF), multilayer perceptron (MLP), and Gaussian naive Bayes (GNB). The test accuracy of this model in the experiment reached 88%. S. Rawat et al. used the UCI medical dataset to evaluate the performance of disease prediction based on decision trees, K-NN, naive Bayes, SVM, and random forest regarding recall, precision, accuracy, and F1 score [8]. Among them, the prediction accuracy based on a decision trees, SVM, and random forest reached 95.85%, 87.46%, and 98.32%, respectively. P. V and J. V developed a prediction model based on the naive Bayes algorithm to predict cardiovascular disease [9]. The accuracy of this model exceeded 80% in the experiment.
G. Someshwaran et al. analyzed the research on predicting fetal heart disease (FHD) based on machine learning and deep learning [10]. The analysis showed that predicting fetal heart disease (FHD) based on the random forest algorithm had the highest accuracy of 97.6285%. H. Calero-Diaz et al. used feature selection technology and data-driven models to identify relevant prognostic factors associated with cardiovascular disease risk and designed a model for early prediction [11]. The dataset used in the experiment was a public dataset from the Steno Diabetes Center in Gentofte, Denmark. M. A. Tanisik et al. designed a model for predicting cardiovascular disease based on naive Bayes, logistic regression, multilayer perceptron, and random forest algorithms to predict early heart disease [12]. Among them, the model based on the naive Bayes algorithm achieved an accuracy of 88.5% in the experiment. S. Tyagi et al. proposed a model for predicting the possibility of heart disease based on logistic regression to achieve early prediction of the progression of heart disease [13]. The model used in the experiment was a dataset from UCL. The K-fold cross-validation method was used in the experiment, and the average accuracy of the model reached 86%, with a standard deviation of 10%.
T. Afrose et al. found ten parameters from the pathology report benchmark database. They designed a combined algorithm based on K-means, fuzzy C-means (FCM), support vector machine (SVM), fuzzy inference (FIS) clustering and multivariate linear regression (MLR), and neural network (NN) to detect heart disease [14]. This combined algorithm achieved an accuracy of 94% in the experiment. N. Koshiga et al. used a dataset from the UCI machine learning library to develop a prediction model based on logistic regression (LR) and the random forest classifier (RFC) to achieve efficient prediction of heart disease [15]. This model achieved an accuracy of 98.36% in the experiment. A. J. Abidin et al. proposed a prediction model based on combining random forest and gradient boosting technology and a random forest and KNN combination method to predict heart disease using the patient’s medical variables as inputs [16]. The dataset used in the experiment is the “heart failure prediction dataset” from Kaggle. The accuracy of this model in the experiment reached 90%. N. Prakash et al. designed a heart risk assessment system based on the logistic regression algorithm using datasets including age, gender, resting blood pressure, cholesterol range, fasting blood glucose, resting electrocardiogram (ECG), maximum heart rate, exercise-induced angina, exercise-induced ST segment decrease relative to rest, peak exercise ST segment, X-ray blood vessel range, constrictive pericarditis, and thalassemia to achieve early detection of heart disease risk [17]. The system achieved an accuracy of 86.89% in the experiment.
D. Rai et al. used a diverse dataset containing clinical, demographic, and lifestyle factors to comprehensively analyze the effectiveness of classic machine learning and ensemble learning techniques in predicting heart disease [18]. In the experiment, the model’s accuracy based on the Gradient Boost algorithm reached 88.69%, and the recall rate reached 89.71%. K. Lu et al. proposed a diagnosis model based on a time-to-text converter to predict cardiovascular diseases and classify their subtypes [19]. This multimodal deep learning model consists of two networks, cvdGNN and cvdHierBERT. The two networks use knowledge from individual time vital signs and text reports. The dataset used in this model in the experiment is MIMIC-III. K. Seeboruth et al. used the Framingham Heart Study dataset to accurately, reliably, and quickly detect cardiovascular diseases early and built a cardiovascular disease prediction model based on supervised learning algorithms such as logistic regression, random forests, and support vector machines [20]. The model proposed based on random forest (RF) achieved an accuracy of 95.13%, a precision of 98.60%, a sensitivity of 91.56%, a specificity of 98.70%, and an F1 score of 95.10% in the experiment. Abhishek et al. developed a machine learning model based on the CatBoost classification algorithm to predict cardiovascular disease risk using a benchmark dataset to predict patients with early cardiovascular disease [21]. This model achieved an accuracy of 91% in the prediction of the Hungarian dataset.
S. Charkha et al. designed a prediction model to predict whether a patient has cardiovascular disease accurately [22]. This model uses a recurrent neural network (RNN) to train the model and uses long short-term memory (LSTM) to select variables. The accuracy of this model in the experiment reached 98.37%. S. Patil et al. used the UCI machine learning database to design technology for predicting heart disease based on the complementary naive Bayes probability method [23]. W. Rahman et al. used the clonal selection algorithm (CSA) and maximum relevance minimum redundancy (mRMR) technology to identify the most prominent features in cardiovascular disease detection [24]. S. S. Aishee et al. designed a system for predicting early-stage heart disease based on integrated feature selection and machine learning technology [25]. This system used the station-Cleveland-Hungary combined dataset in the experiment, and based on the stacked ensemble ML model, the accuracy obtained using the meta-learner “random forest” was 91.7%. S. C. Tassi et al. used the SMARTool dataset to design a method for labeling the most informative data points using a weighted set of Gaussian processes [26]. This method achieved an excellent performance in cardiovascular disease reasoning. H. K. S K et al. used hospital data to design a heart disease prediction model based on XGBoost and random forest [27].
In order to make up for the limitations of cardiovascular disease prediction based on physiology, Y. Long et al. introduced an XGB-LCE model for cardiovascular disease prediction from individual vital factors [28]. This model first uses the XGBoost algorithm to identify the contribution of each feature to the prediction result and then inputs the optimal feature set into the LCE model for cardiovascular disease prediction. The accuracy of this model in the experiment was 94.1%, AUROC was 97.1%, and AUPR was 98.4%. D. Mušić et al. proposed a model for diagnosing cardiovascular disease [29]. This model uses the FastTree algorithm to minimize the classification error at each step by recursively dividing the feature space into regions. This model’s accuracy, specificity, and sensitivity in the experiment reached more than 98%. S. N. Reddy et al. proposed a method for predicting cardiovascular risk based on an integrated stacking classifier to improve the treatment effect and medical resource utilization of patients with cardiovascular disease [30]. The integrated stacking classifier combines multiple basic classifiers, including logistic regression, decision tree, nearest neighbor, and advanced machine learning algorithms. The prediction accuracy of this method in the experiment reached 85%. M. N. Tousif et al. used the Cleveland dataset in the UCI repository to predict heart disease based on KNN, random forest, naive Bayes, AdaBoost, decision trees, and logistic regression machine learning algorithms [31]. In the experiment, the accuracy of heart disease prediction based on the KNN algorithm reached 93%. S. R. Fardibha et al. used the Cleveland heart disease dataset and the Framingham Heart Study dataset to propose a method for predicting heart disease based on a support vector machine (SVM) [32]. This method achieved an accuracy of 93% in the experiment.
From the above statistics of some of the research on disease risk prediction (Table 1), it can be surmised to have achieved good results. The accuracy of cardiovascular disease prediction reached 97.03%, and the accuracy of heart disease prediction reached 98.36%. However, when using a support vector machine (SVM), K-nearest neighbor algorithm (KNN), Naive Bayes, logistic regression, random forest, and XGBoost to predict cardiovascular disease risk, each algorithm has many limitations. SVM is computationally complex when processing large-scale data, is sensitive to the choice of kernel function, and has poor model interpretability. KNN is highly sensitive to noise and outliers, performs poorly in high-dimensional data, and consumes many computing resources. Naive Bayes relies on the feature independence assumption and has difficulty capturing complex associations between features. Linear decision boundaries limit logistic regression and are susceptible to multicollinearity. Although random forest has high accuracy, the model is complex, lacks interpretability, and is sensitive to noise. Although XGBoost has a superior performance, its parameter tuning is complex, the training time is long, and there is a risk of overfitting. These limitations require careful consideration of algorithm selection and optimization strategies in practical applications to improve the accuracy and reliability of predictions.

Table 1.
Related research statistics.
In this article, we focus on assisting nursing homes in accurately predicting the risk of cardiovascular disease in the application scenario of elderly care. To achieve this goal, we use the ResNet model in the Acdim model to extract sample features, use the zebra algorithm to optimize the classifier’s parameters, and integrate the TabNet algorithm and AdaBoost algorithm to classify the target accurately. From the experimental results, it is observed that the Acdim model we propose in this article strongly supports nursing homes’ accurate prediction of cardiovascular disease risks.
3. Methodology
This section mainly describes the relevant technologies used in the cardiovascular disease risk prediction model Acdim proposed in this article. It also describes the Acdim model in detail.
3.1. Preliminaries
ResNet stands for Residual Neural Network, a deep convolutional neural network architecture proposed by Kaiming He et al. in 2015 [33]. Its core idea is to solve the gradient vanishing and degradation problems in deep neural networks through residual learning to make the network more profound and perform better. In ResNet, the layers are not simply connected sequentially but also have jump connections; that is, the input of a particular layer is directly transmitted to the output of a deeper layer. This connection method can effectively alleviate the gradient vanishing problem, making it easier for the gradient to propagate in the deep network. This design prevents the performance of the deep network from degrading due to too many layers and instead shows better results. Traditional deep neural networks directly learn the mapping H(x) from input to output. At the same time, ResNet introduces the residual module, which does not directly learn this mapping but learns the difference (residual) between input and output, that is, F(x) = H(x) − x. This way, the original mapping can be expressed as H(x) = F(x) + x. This residual form makes the network easier to optimize because learning the residual (i.e., the change between input and output) is more straightforward than directly learning a complex input-to-output mapping.
The zebra optimization algorithm (ZOA) is a new optimization algorithm inspired by the group behavior of zebras [34]. The algorithm solves complex optimization problems by simulating the social behavior, foraging strategy, and escape from predators of zebras. Similar to other bionic optimization algorithms (such as particle swarm optimization algorithm, ant colony optimization algorithm, etc.), ZOA belongs to the category of swarm intelligence algorithms. Zebras usually live in groups, and they increase the success at foraging and avoiding predators through group cooperation. ZOA simulates the cooperative relationship in this zebra group. Multiple individuals (zebras) explore the solution space by learning from each other and sharing information, gradually approaching the optimal solution or close to the optimal solution. ZOA considers exploration and exploitation by imitating the behavior of zebras in finding food. Exploration in the optimization algorithm can avoid falling into the local optimum, while exploitation can improve the accuracy of the local solution. Zebras need to make survival decisions by avoiding predators in nature. ZOA introduces a mechanism to avoid wrong solutions (similar to the behavior of avoiding danger), which helps the algorithm jump out of bad areas and search for better solutions. Zebra stripes can act as camouflage in nature through visual confusion. This phenomenon is manifested in the algorithm as preventing the algorithm from converging to the local optimal solution too early.
The steps of the ZOA algorithm are as follows: first, initialization is performed; that is, in the initial stage of the algorithm [34], a group of zebra individuals (i.e., candidate solutions) are randomly generated, and each zebra represents a potential solution to a problem. The second is fitness evaluation; that is, each zebra (solution) is evaluated according to the fitness function, the design of which depends on the specific optimization problem. The movement rules of zebras are based on the simulated behavior of zebra groups. A single zebra will adjust its position according to specific movement rules. The movement process is affected by its neighbor individuals (social learning), environmental conditions, and experience. Then, the leader is selected; that is, the zebra with the highest fitness value is selected as the leader, and the leader guides the direction of the entire group to move toward a better area. Finally, convergence is performed. After multiple iterations, in which the zebra group constantly adjusts its position, it gradually tends to the optimal solution. The algorithm stops when a specific termination condition is met (such as reaching the maximum number of iterations or finding a converged solution).
TabNet is a deep learning model designed for processing tabular data, proposed by the Google Cloud team in 2019 [35]. It differs from most deep learning models (such as CNN and RNN), which are more suitable for processing image, audio, or text data. In contrast, tabular data has always been the strong point of traditional machine learning algorithms (such as decision trees, XGBoost, etc.). TabNet is unique in combining deep learning with attention mechanisms, giving the model strong performance and interpretability when processing tabular data. The components of TabNet include the input feature network, attention transformer network, feature transformation and decision network, mask generation, and sparsity control. The input feature network passes the input tabular data into the network and performs preliminary feature processing. The attention transformer network uses a sparse attention mechanism to select which features are used in the current decision step. It ensures that the model focuses on the most essential features by filtering and adjusting feature weights layer by layer. Feature transformation and decision networks perform nonlinear transformations on the selected features to generate decisions. Each layer makes a small decision contribution and generates the final output through multi-level decision merging. Mask generation and sparsity control are achieved through a unique sparsity control mechanism. TabNet can dynamically select the features to be used to ensure sparsity.
TabNet uses a mechanism called sparse attention, where at each decision step, the model automatically selects the most important features for the current prediction task. TabNet can selectively focus on specific data without processing all input features. Through this mechanism, the model can assign different weights to different features, and the feature weights are gradually and dynamically changed as the decision is made. This helps improve the interpretability of the model, and users can observe which features contribute most to the model’s decision.
TabNet is similar to the behavior of a decision tree model, which generates the final output through multiple layers of sequential decisions. Each layer makes a small partial decision, and the model gradually merges each layer’s contributions to generate the final prediction. This approach simulates the hierarchical decision-making process of a decision tree and takes advantage of the expressive power of deep learning. The TabNet model can simultaneously perform feature selection and feature learning when processing data. The sparse attention mechanism automatically selects the most important features for the current task instead of processing all features like traditional neural networks [35].
TabNet uses a sparse attention mechanism to activate each feature only when needed. This sparsity not only improves the computational efficiency of the model but also makes the model more interpretable. Users can understand how the model makes decisions by analyzing the model’s attention weights. TabNet is an end-to-end learning model, which means it does not rely on feature engineering like other models such as XGBoost or LightGBM. It can directly process raw tabular data and perform feature selection and learning through its hierarchical structure and attention mechanism.
3.2. Acdim Model
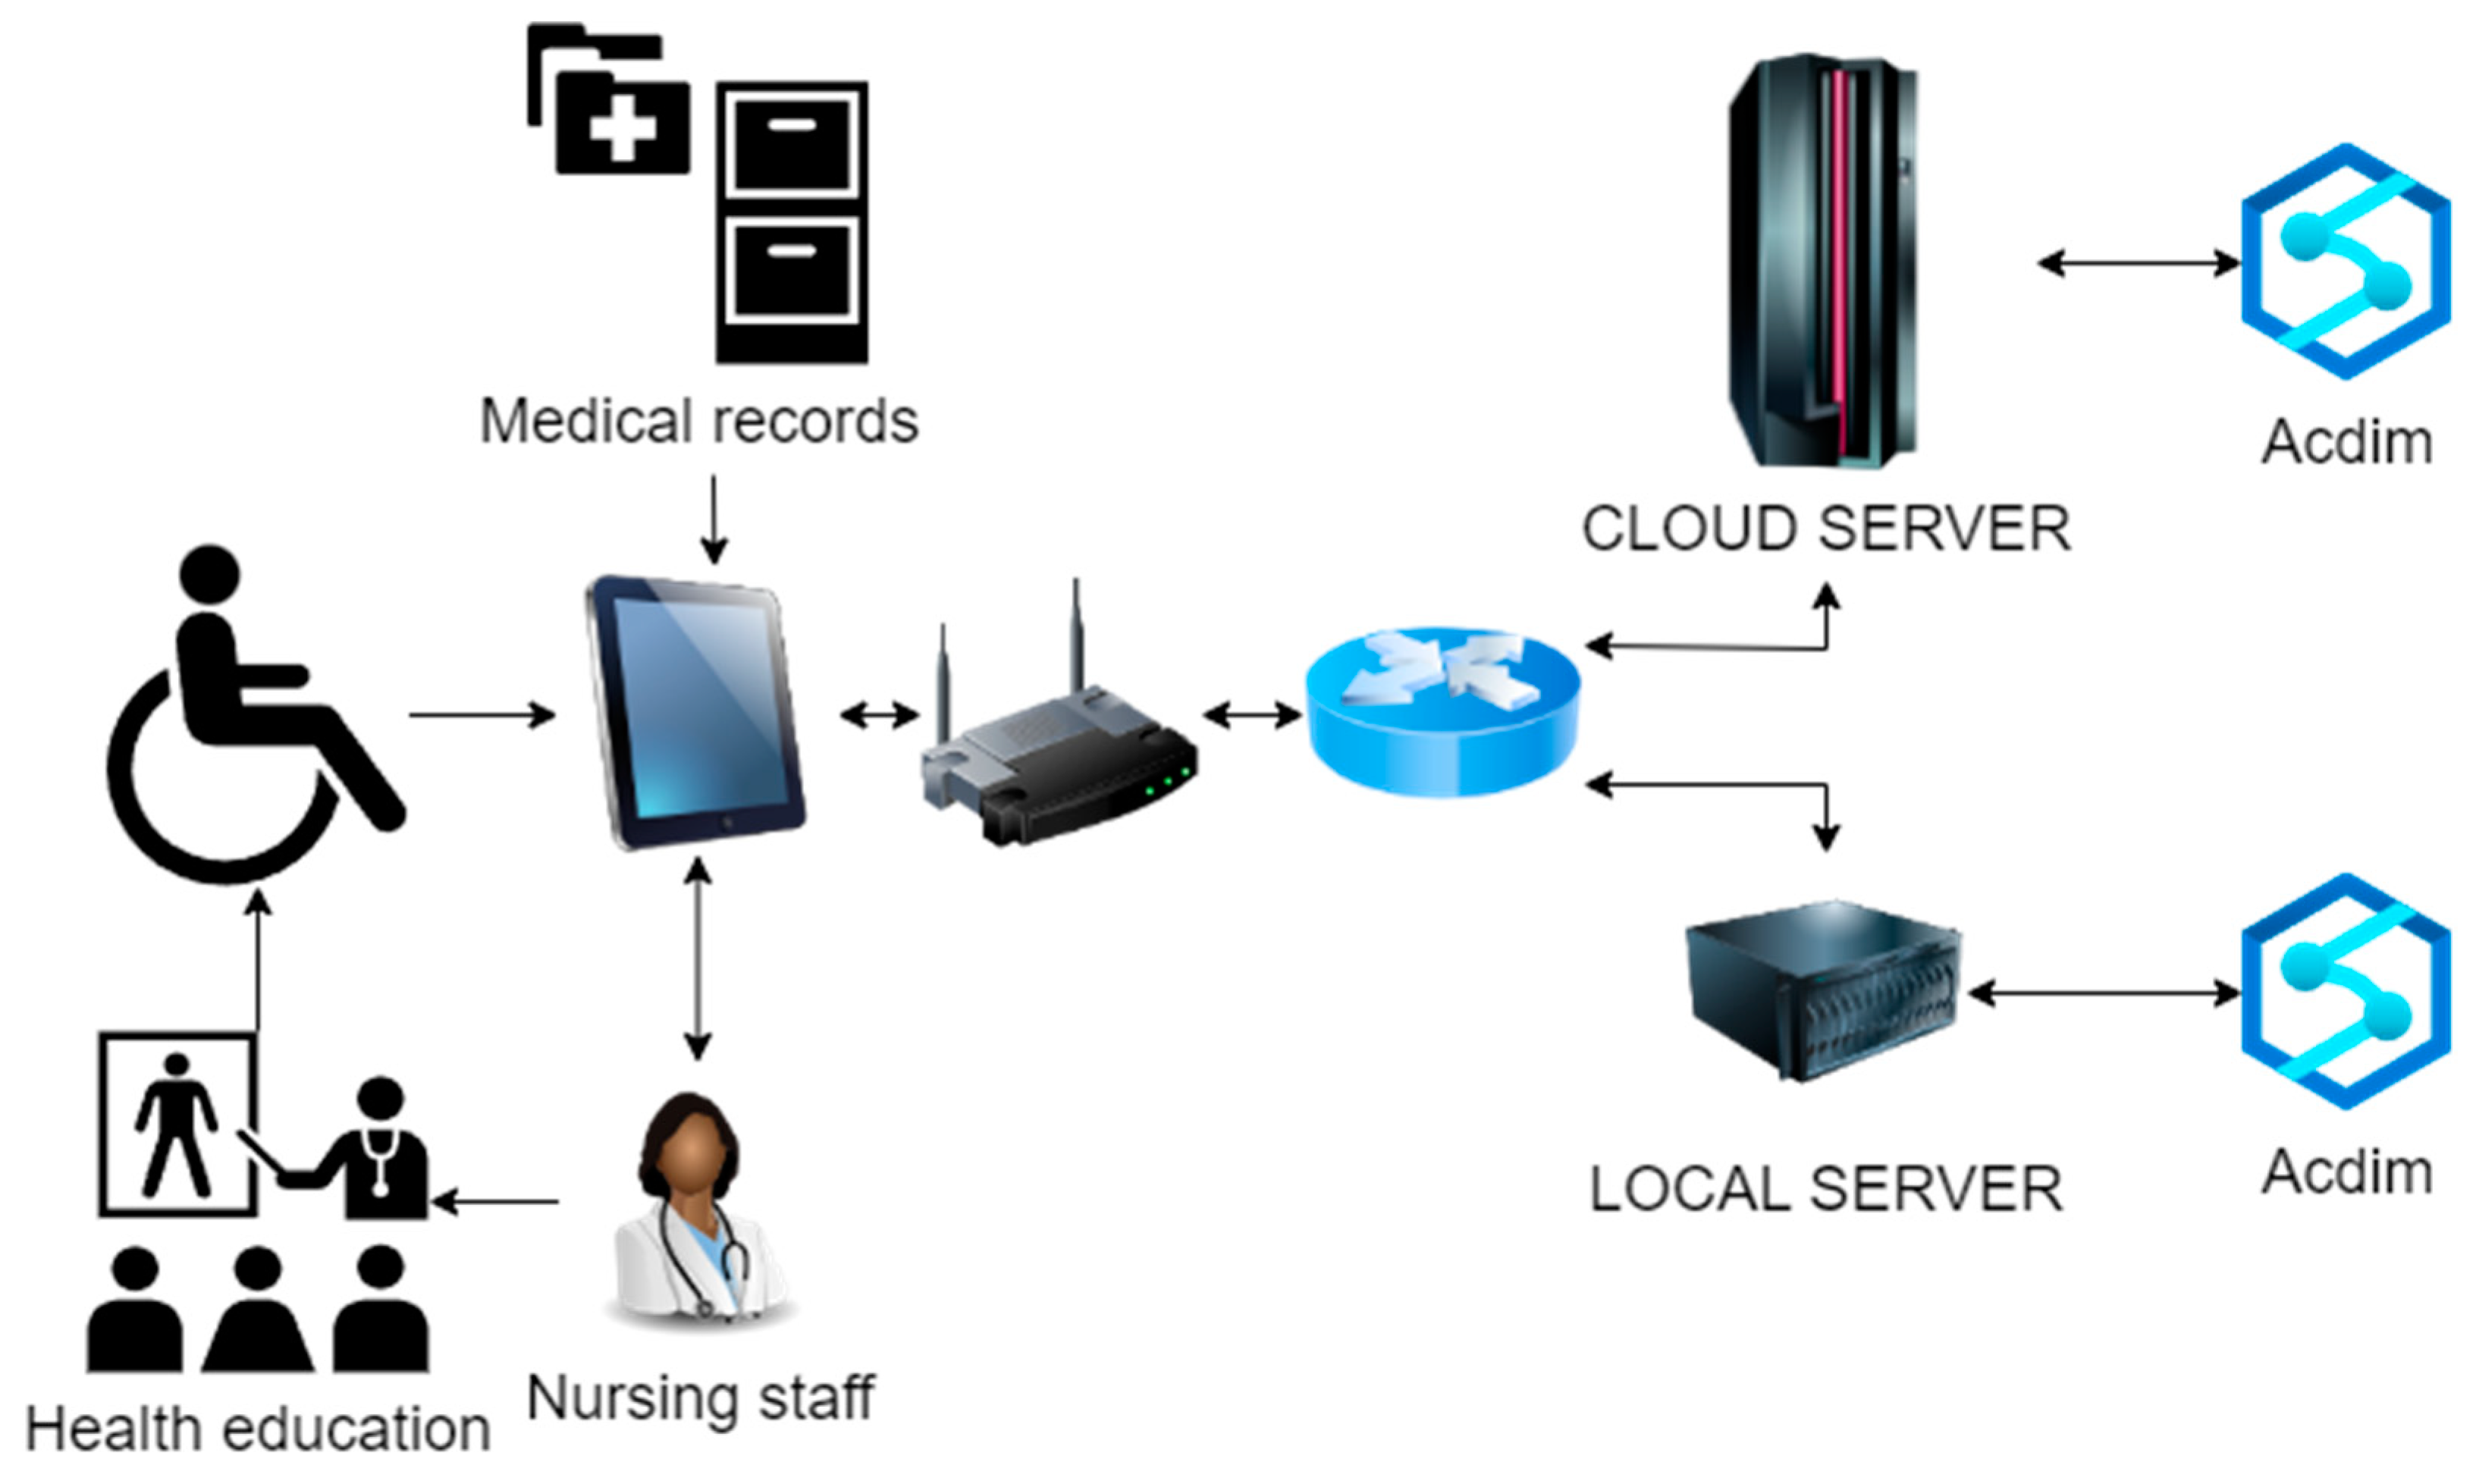
In order to enable nursing homes to predict cardiovascular disease risks in the application scenario of competent elderly care, we proposed a prediction model based on ResNet, ZOA, TabNet, and AdaBoost. The structure of this model is shown in Figure 2.

Figure 2.
The Acdim model structure.
As shown in Figure 2, the Acdim model we propose first normalizes the BRFSS Dataset and divides the dataset. Secondly, the convolution layer is used to extract sample features, and the pooling layer is used to reduce the dimensionality of sample features. Then, the fully connected layer is used to map sample features. The classifiers are trained using TabNet and AdaBoost, respectively, and the ZOA algorithm is used to optimize the relevant parameters of the two classifiers. When receiving the prediction results output from the two classifiers, the inverse variance method is used for weighted average calculation. Finally, the final prediction result of the model is output.
3.3. Model Algorithm
This paper summarizes the cardiovascular disease risk prediction model algorithm based on TabNet and AdaBoost, as shown in Algorithm 1.
| Algorithm 1: Acdim model algorithm | |||
| Input: BRFSS Dataset. | |||
| Output: Acdim model | |||
| 1 | BRFSS Dataset | ||
| 2 | |||
| 3 | |||
| 4 | |||
| 5 | |||
| 6 | for to do | ||
| 7 | |||
| 8 | |||
| 9 | |||
| 10 | if Accuracy ≥ and Precision ≥ and Recall ≥ and Specificity ≥ and AUC ≥ : | ||
| 11 | Output Acdim model | ||
| 12 | break | ||
| 13 | else | ||
| 14 | |||
| 15 | Output the parameters of the Acdim model with the highest accuracy, precision, recall, specificity, and AUC values. | ||
In Algorithm 1, represents the training sample data, represents the validation sample data, and represents the test sample data. represents the feature extraction function, represents the sample data, represents the extracted feature representation, represents the number of samples, and represents the number of features of each sample. represents the weight matrix of feature extraction, represents the dimension of low-dimensional features, represents the convolution kernel (filter), and ∗ represents the convolution operation. represents the number of training iterations, represents the classifier function, represents the activation function, and represents the model parameters. represents the learning rate, represents the gradient of the loss function to the model parameters, and represents the weighted average calculation. represents the accuracy threshold, which is preset to 96% in this article. represents the precision threshold, which is preset to 94% in this article. represents the recall threshold, preset to 93% in this article. represents the specificity threshold, preset to 95% in this article. represents the AUC value threshold, which is preset to 95% in this article.
3.4. TabNet Parameter Optimization
In proposing the Acdim model, this paper uses the ZOA algorithm to optimize the parameters of TabNet as follows.
First, we define the hyperparameters that must be optimized in the TabNet model. The hyperparameters include the learning rate parameter that controls the step size of the gradient update, the batch size of the number of samples used each time the model parameters are updated, the dropout rate used to prevent overfitting, the regularization parameter of the regularization term that controls the complexity of the model, and specific parameters of TabNet, such as (the number of decision steps) and , (decision dimension and attention dimension). Let these hyperparameters form a vector , which is the target we want to optimize through ZOA.
Secondly, the initial population of zebras will be randomly generated, and each zebra will represent a set of possible hyperparameter combinations. The position of each zebra is represented as a hyperparameter combination, initialized to a random value, taken from a predefined parameter range. Then, according to the zebra’s current position (i.e., the hyperparameter combination), we configure and train the TabNet model. We evaluate the performance of the model on the validation set. Common evaluation indicators include accuracy, precision, recall, specificity, and AUC (area under the curve). The performance of the validation set is used as the zebra fitness value.
Then, in each iteration, we use ZOA to simulate the zebra foraging behavior to update the zebra’s hyperparameter combination. The hyperparameter combination is updated, and the zebra with the optimal solution for cooperative foraging and is further explored. In order to ensure that the updated solution of the zebra group is valid, we limit the updated hyperparameters to the predefined upper and lower limits. After each update, we retrain TabNet according to the new hyperparameter combination and calculate its performance on the validation set as the new fitness value. If the new fitness value is better than the current global optimal solution, the global optimal solution is updated.
Finally, the termination condition that needs to be set during the iteration process and the change in the hyperparameter combination no longer bring a significant performance improvement (fitness value convergence). When the termination condition is reached, ZOA will output the best-performing hyperparameter combination on the validation set and use this hyperparameter combination as the optimized TabNet model parameters.
3.5. AdaBoost Parameter Optimization
In proposing the Acdim model, this paper uses the ZOA algorithm to optimize the parameters of AdaBoost as follows.
First, we select the hyperparameters that must be optimized in the AdaBoost model. The hyperparameters include the base classifier type, the maximum depth of the base classifier, the learning rate η used to scale the weight update of each weak classifier, and the number of weak classifiers.
Second, we initialize the zebra population. In ZOA, the zebra population is represented as a set of random hyperparameter combinations. Each zebra represents a possible hyperparameter combination (i.e., candidate solution). In this process, the population size is set, and a set of hyperparameter combinations is randomly generated for each zebra, with the range set according to predefined upper and lower limits.
Then, we define the fitness function, which measures the performance of a specific hyperparameter combination. Here, the fitness function can be defined as the validation set performance of the AdaBoost model. After the AdaBoost model trains each zebra position (i.e., hyperparameter combination), the fitness value is calculated on the validation set. In the process of hyperparameter updating, ZOA updates the hyperparameter combination of zebras by simulating the foraging behavior of zebras; that is, the zebras first update their positions by following the best-performing individuals in the group and then find better solutions through competition with other individuals. The updated hyperparameter combination is limited to the predefined upper and lower limits. After each position update, the AdaBoost model is retrained, and the fitness value of the new hyperparameter combination is evaluated on the validation set.
Finally, when the termination condition is reached, the ZOA algorithm outputs the best hyperparameter combination on the validation set: the position of the overall optimal zebra. This combination is the hyperparameter of the optimized AdaBoost model.
3.6. ZOA Optimization Process
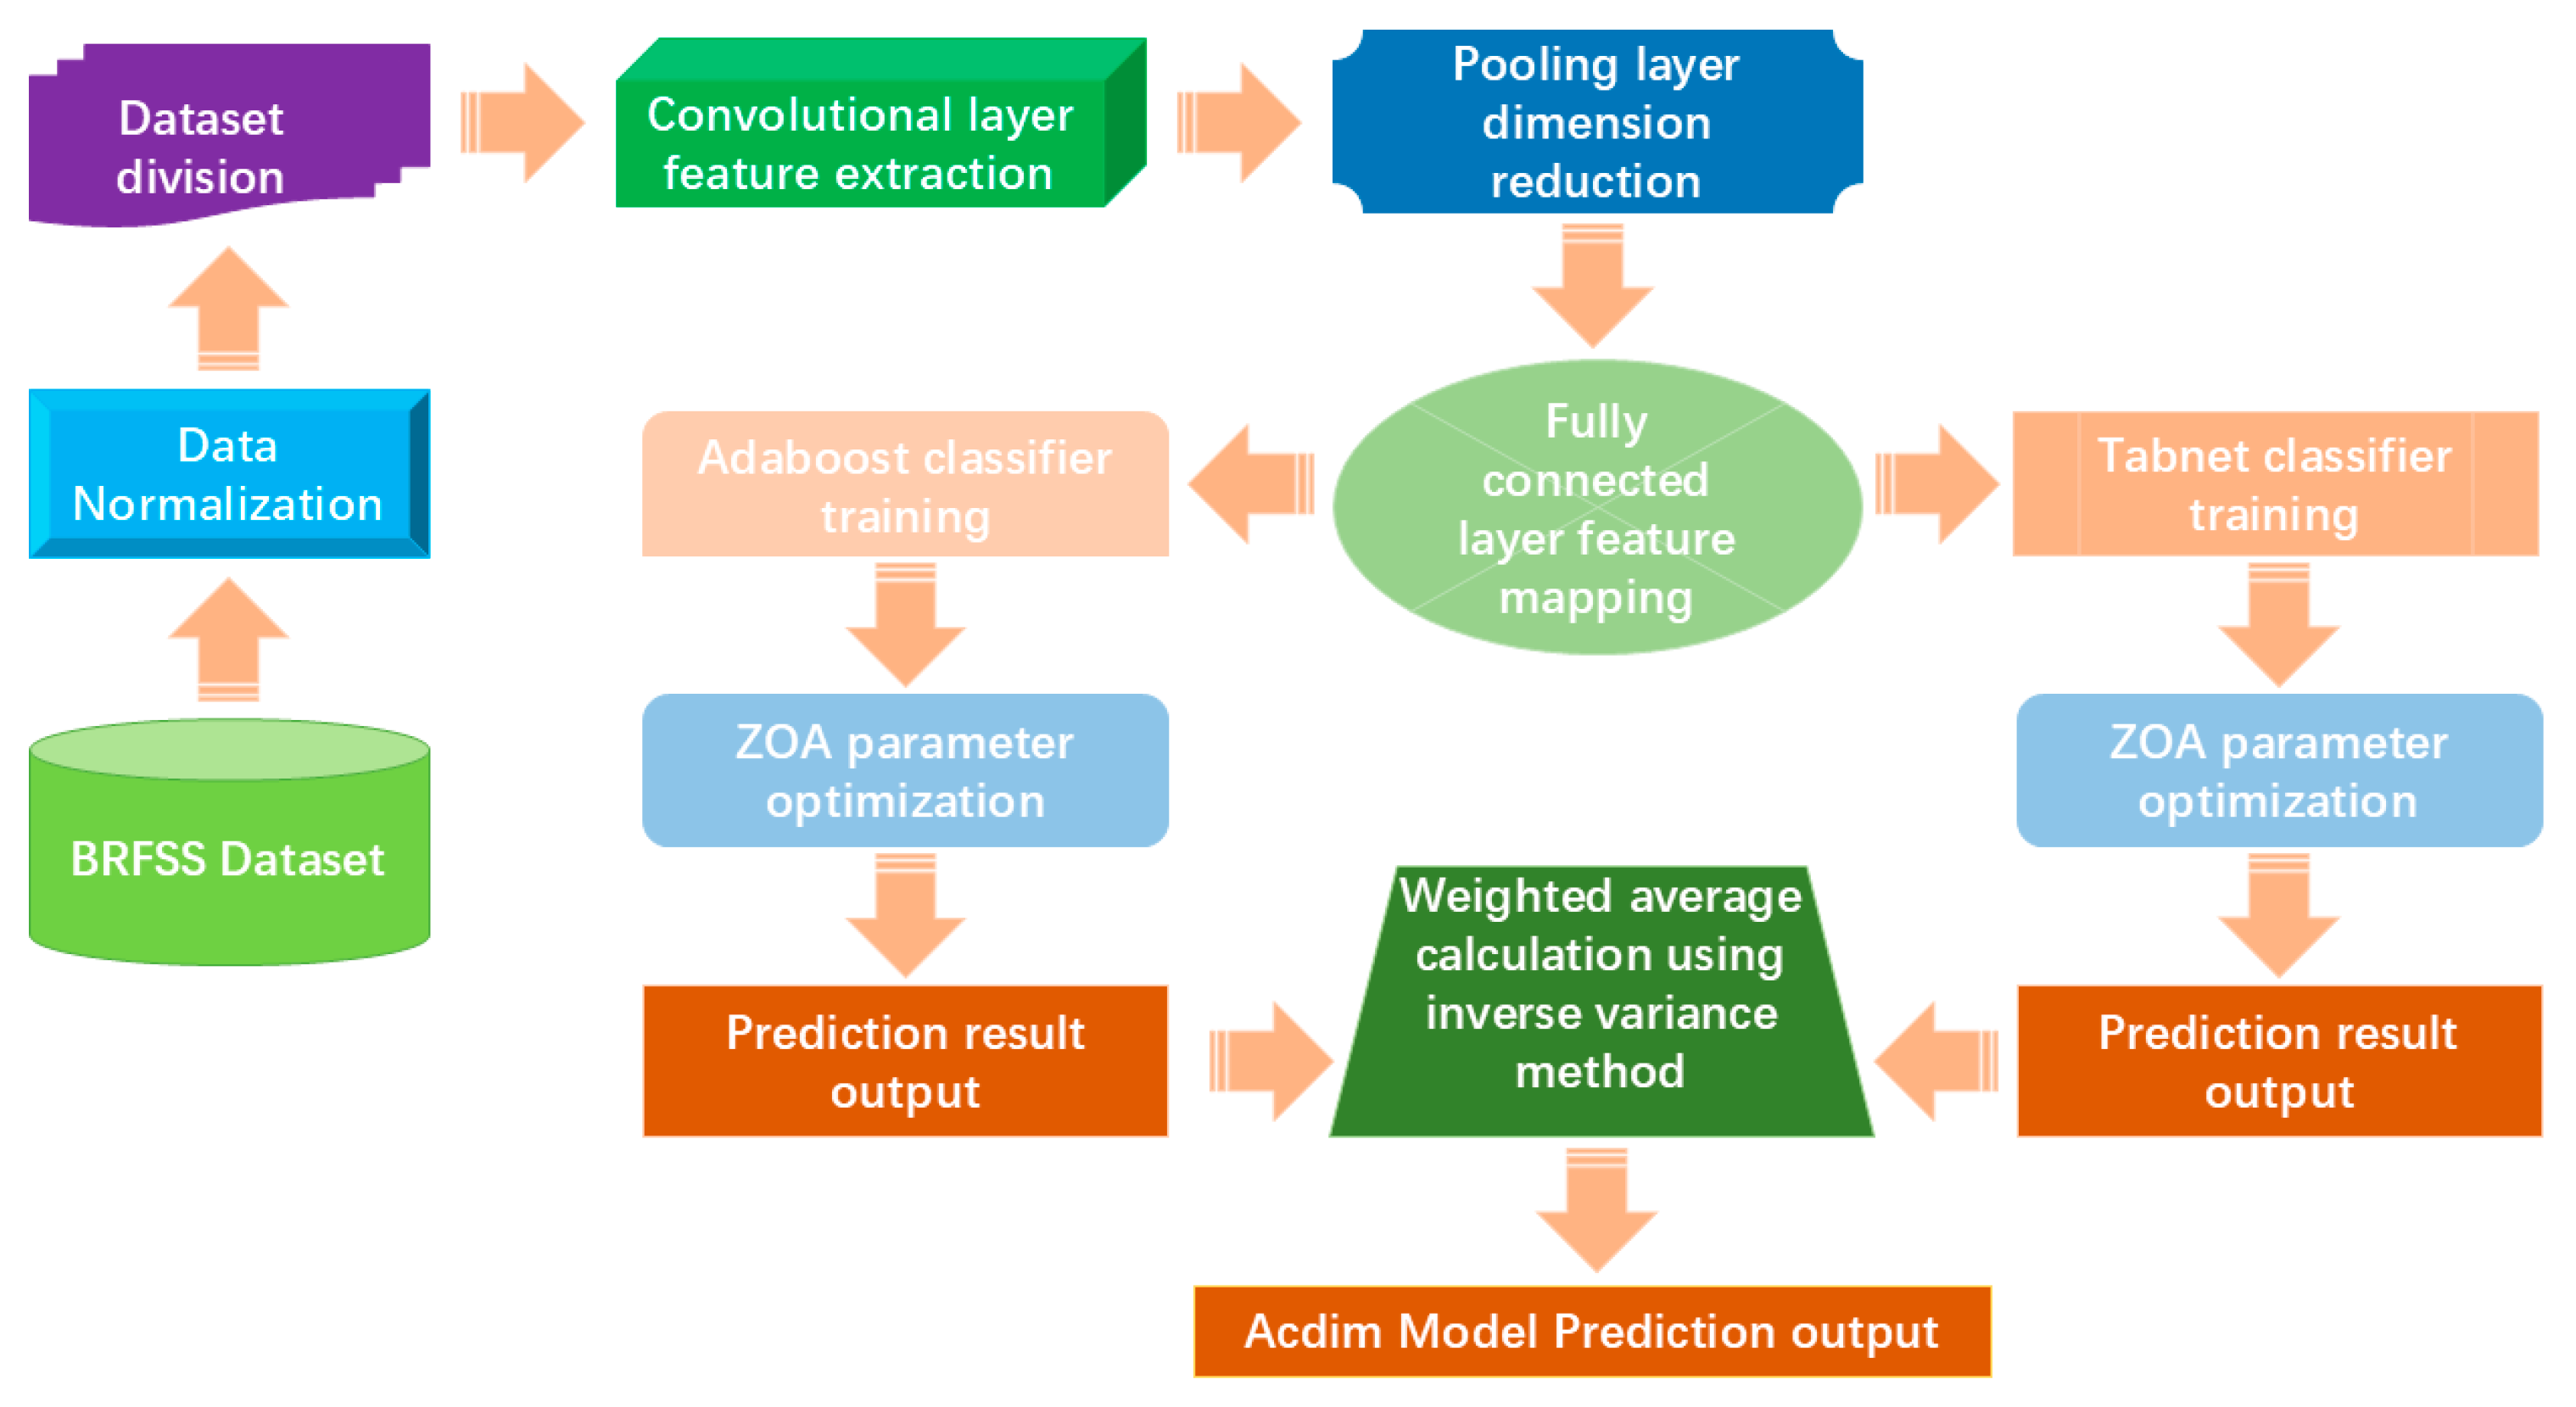
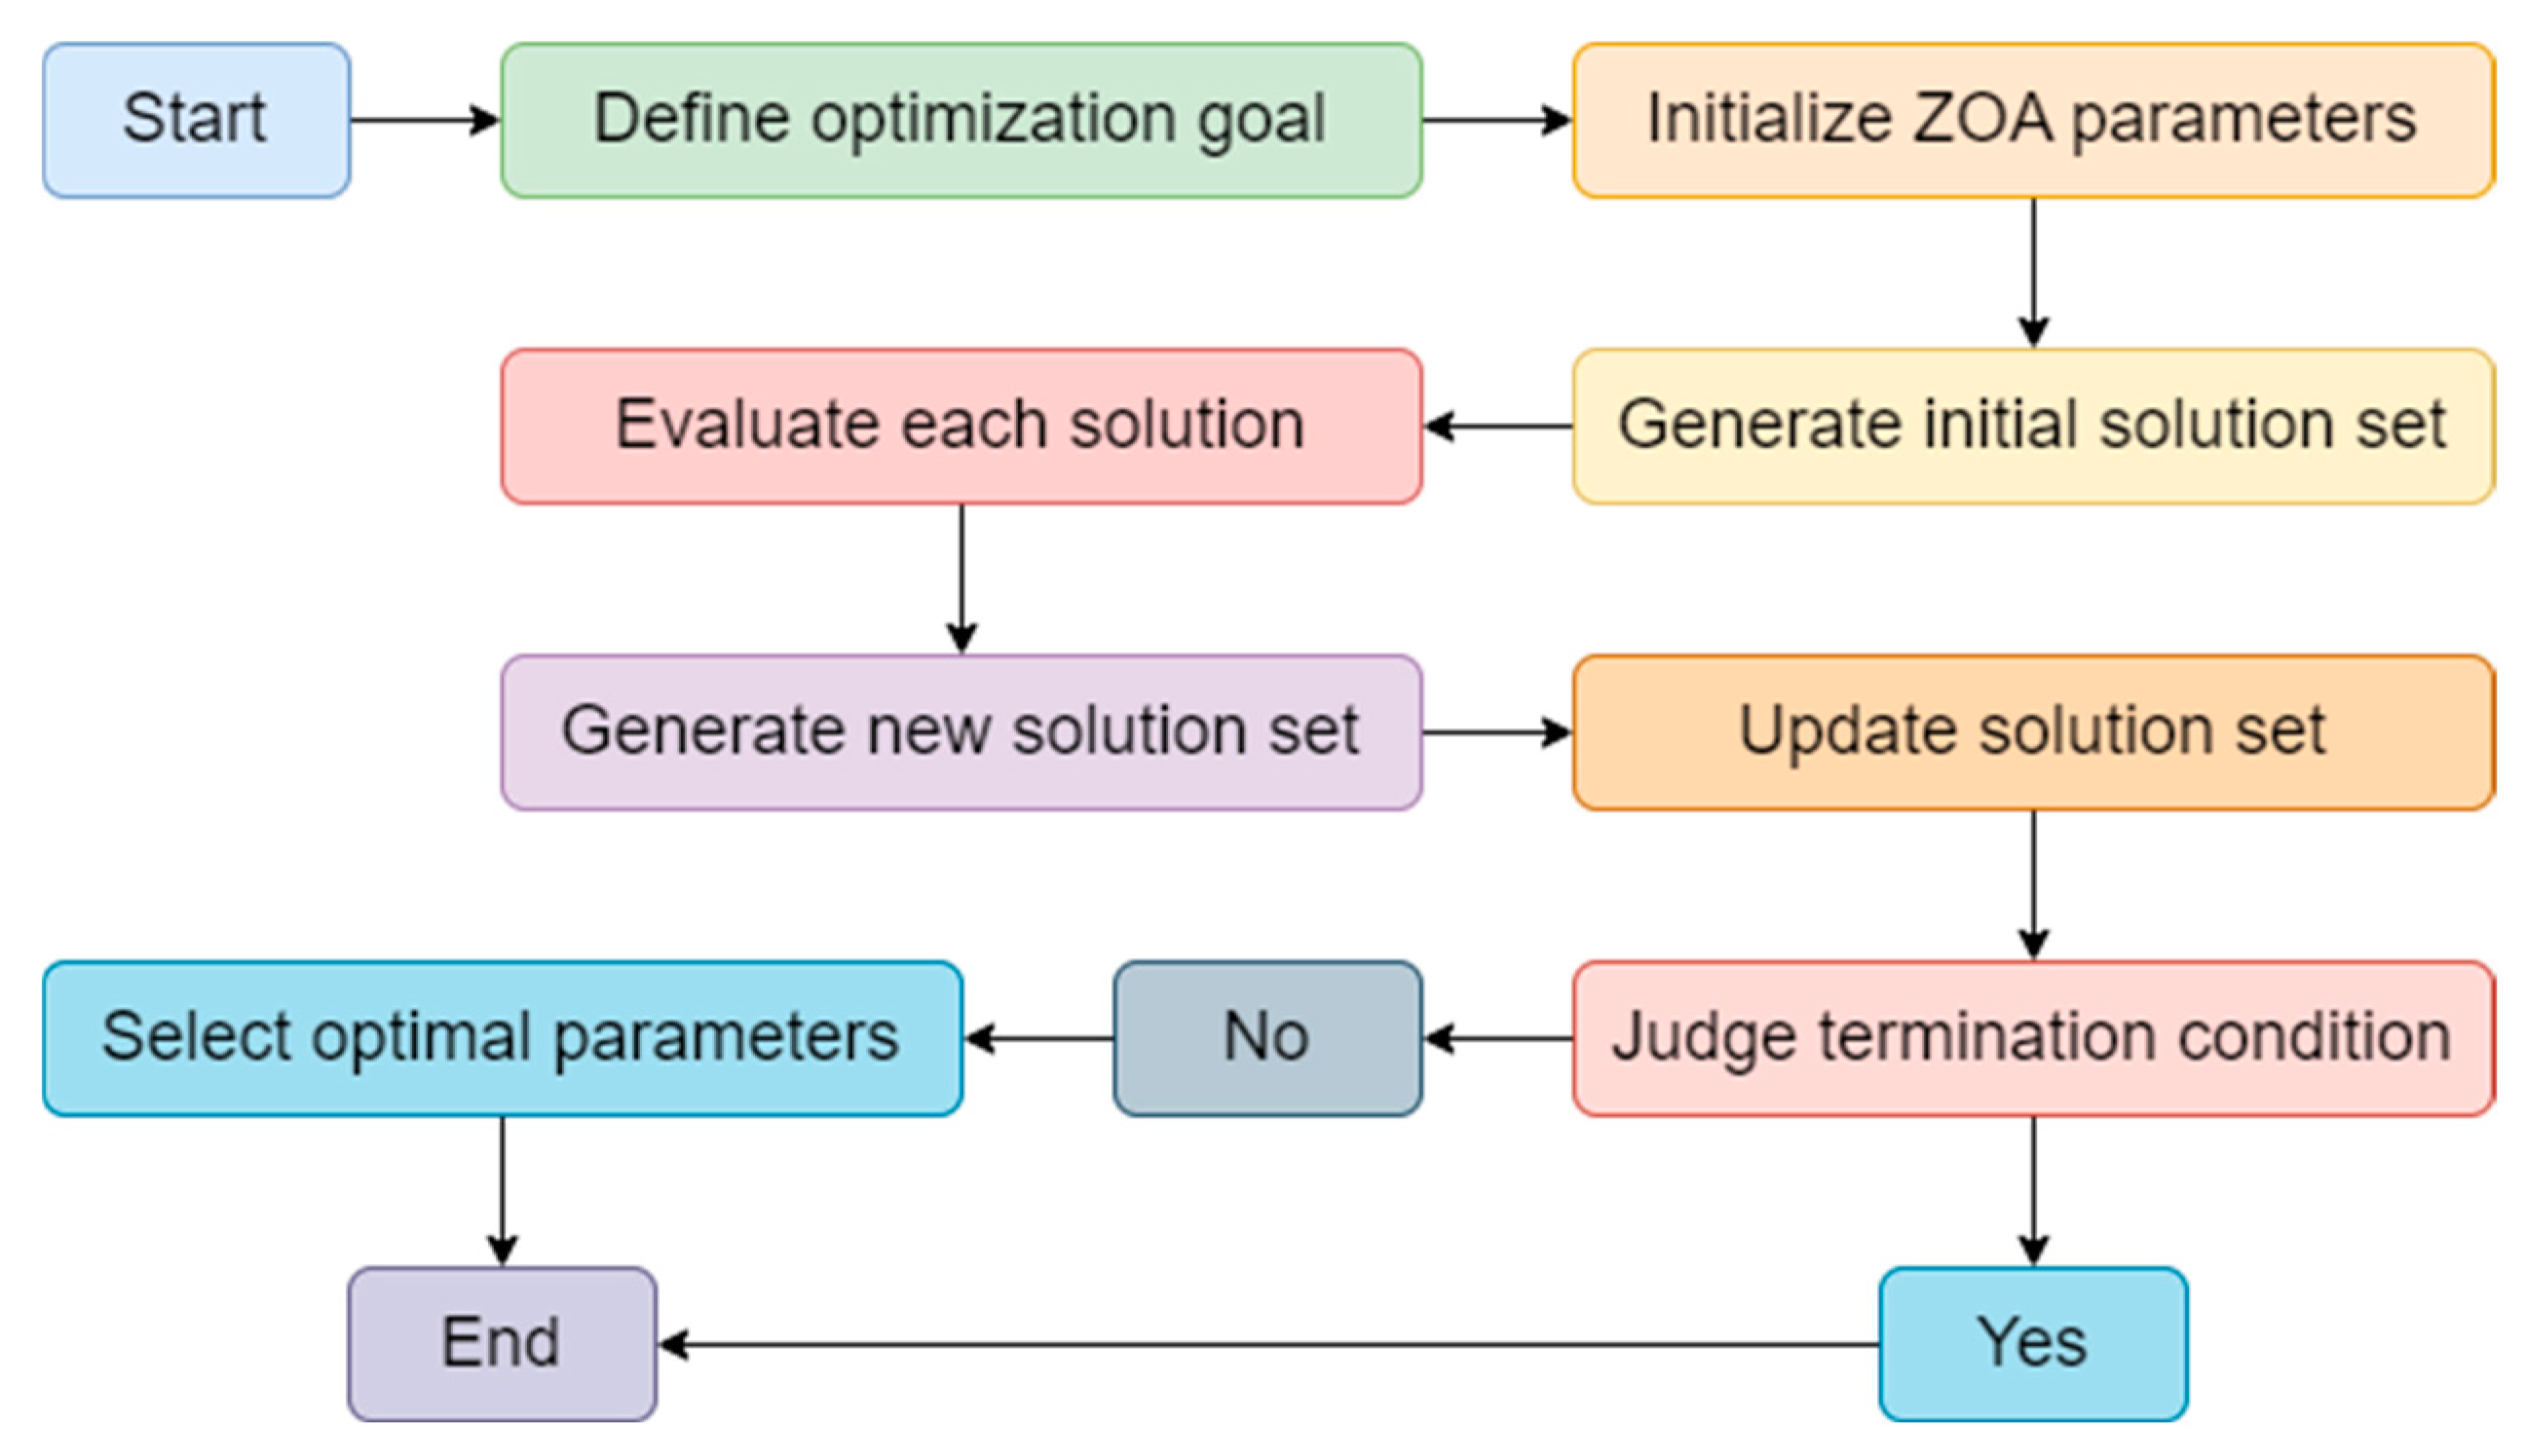
In this paper, we use ZOA to optimize the parameters of TabNet and AdaBoost. The optimization process is shown in Figure 3.

Figure 3.
The ZOA optimization process structure.
As shown in Figure 3, in our proposed Acdim model, the ZOA algorithm is used to optimize TabNet’s and AdaBoost’s hyperparameters to improve cardiovascular disease risk prediction accuracy. ZOA effectively explores complex parameter spaces by iteratively searching different parameter combinations, such as the number of decision steps and feature dimensions of TabNet, as well as the learning rate and number of base learners of AdaBoost. This zero-order optimization method does not require gradient information. It is suitable for the nonlinear relationship between TabNet and AdaBoost, ensuring that TabNet can automatically select key features, while AdaBoost enhances model performance by integrating multiple classifiers. Ultimately, ZOA optimization significantly improves the accuracy and generalization capabilities of the Acdim model, providing reliable support for personalized health management.
4. Experimental Results and Analysis
This section mainly describes the sample data, evaluation indicators, comparative experimental results, ablation experimental results, and optimization experimental results of the Acdim model during the experiment.
4.1. Sample Data
The Behavioral Risk Factor Surveillance System (BRFSS) is the premier health-related telephone survey system in the United States, collecting state data on health-related risk behaviors, chronic health conditions [5], and preventive service use of U.S. residents. The sample data used in this article are a preprocessed and cleaned BRFSS dataset totaling 308,800. Of the 304 unique variables, 19 variables related to a person’s lifestyle factors that may contribute to the risk of any form of cardiovascular disease were selected. These 19 variables are General_Health, Checkup, Exercise, Heart_Disease, Skin_Cancer, Other_Cancer, Depression, Diabetes, Arthritis, Sex, Age_Category, Height_(cm), Weight_(kg), BMI, Smoking_History, Alcohol_Consumption, Fruit_Consumption, Green_Vegetables_Consumption, and FriedPotato_Consumption. Among them, General_Health has three labels, namely Very Good, Good, and Poor. When dividing the data set, the training set, test set, and validation set have a ratio of 6:2:2.
The dataset covers approximately 400,000 to 500,000 respondents, with the exact number fluctuating depending on the state’s participation and the survey size. The dataset covers a wide range of health-related topics, including the following characteristics: demographic information (age, gender, race and ethnicity, education level, income level, marital status), health behaviors (smoking status, drinking habits, physical activity, dietary habits), health conditions (chronic diseases, mental health, weight and height), preventive measures (vaccinations, health screenings, health insurance), health service utilization (frequency of medical visits, medical satisfaction, routine medical visits), and environmental and social factors (living environment, social support, work and financial pressures).
4.2. Comparison of Different Learning Rates
In evaluating the cardiovascular disease risk prediction model Acdim, we used seven indicators, Accuracy, Precision, Recall, Specificity, F1 score, AUC value, and MCC (Matthews correlation coefficient), for evaluation.
In the above formula [36], TP means true positive [37], TN means true negative, FP means false positive, and FN means false negative [38]. The AUC (area under the ROC curve) is based on the confusion matrix. In drawing the ROC curve, the false positive rate (FPR) is used as the horizontal axis, and the actual positive rate (TPR) is used as the vertical axis [39].
4.3. Comparison Experimental Results
In the study of tabular data classification, standard algorithms include Advanced kNN, SaR-SVM-STV, XGBoost, LightGBM, and Catboost. In building the Acdim model, we used these algorithms as base classifiers and compared the experimental results obtained with those obtained by the Acdim model. In the comparative experiments, we used the following evaluation indicators: accuracy and standard deviation of accuracy, precision and standard deviation of precision, recall and standard deviation of recall, specificity, MCC, and AUC value. The specific comparative experimental results are shown in Table 2.
Table 2.
Comparison of experimental results of Acdim model with other algorithms on public datasets.
It can be concluded from Table 2 that the models constructed based on Advanced kNN, SaR-SVM-STV, XGBoost, LightGBM, and Catboost, respectively, achieved good experimental results in the experiment. The Acdim model constructed based on TabNet and AdaBoost achieved an accuracy of 96%, a precision of 93%, a recall of 92%, a specificity of 95%, and an AUC of 95% in the experiment. Based on the comparative experimental results, Acdim performed best. To further verify the Acdim model, we used the nursing home subject dataset to test the Acdim model. The test results are shown in Table 3.
Table 3.
Comparison of experimental results of Acdim model with other algorithms on subject datasets.
It can be concluded from Table 3 that in the experiment using the nursing home subject dataset for comparison, the Acdim model we propose achieved the best results in the five evaluation indicators of accuracy and standard deviation of accuracy, precision and standard deviation of precision, recall and standard deviation of recall, specificity, and AUC value.
4.4. Ablation Experiment Results
In order to gain a deeper understanding of the Acdim model we propose based on TabNet and AdaBoost, we conducted a comparative experiment on the components of the Acdim model. In this experiment, we used the sample data introduced in this article and five different methods to build classifiers. The first method is to use only ResNet, TabNet, and ZOA; the second method is to use only ResNet, AdaBoost, and ZOA; the third method is to use only TabNet and ZOA; the fourth method is to use only AdaBoost and ZOA; and the fifth method is to use ResNet, TabNet, AdaBoost, and ZOA. In this comparative experiment, we used accuracy and standard deviation of accuracy, precision and standard deviation of precision, recall and standard deviation of recall, specificity, and AUC values to statistically analyze the experimental results. The details are shown in Table 4.
Table 4.
Statistics of ablation experiment results on public datasets.
It can be concluded from Table 4 that the Acdim model we propose produced better results after using ResNet to extract sample data features and then performing classification training than the model without using ResNet to extract sample data features. The Acdim model we propose achieved the best experimental results when using TabNet and AdaBoost for classification training simultaneously and then using the inverse variance method for weighted average calculation.
4.5. Optimizing Experimental Results
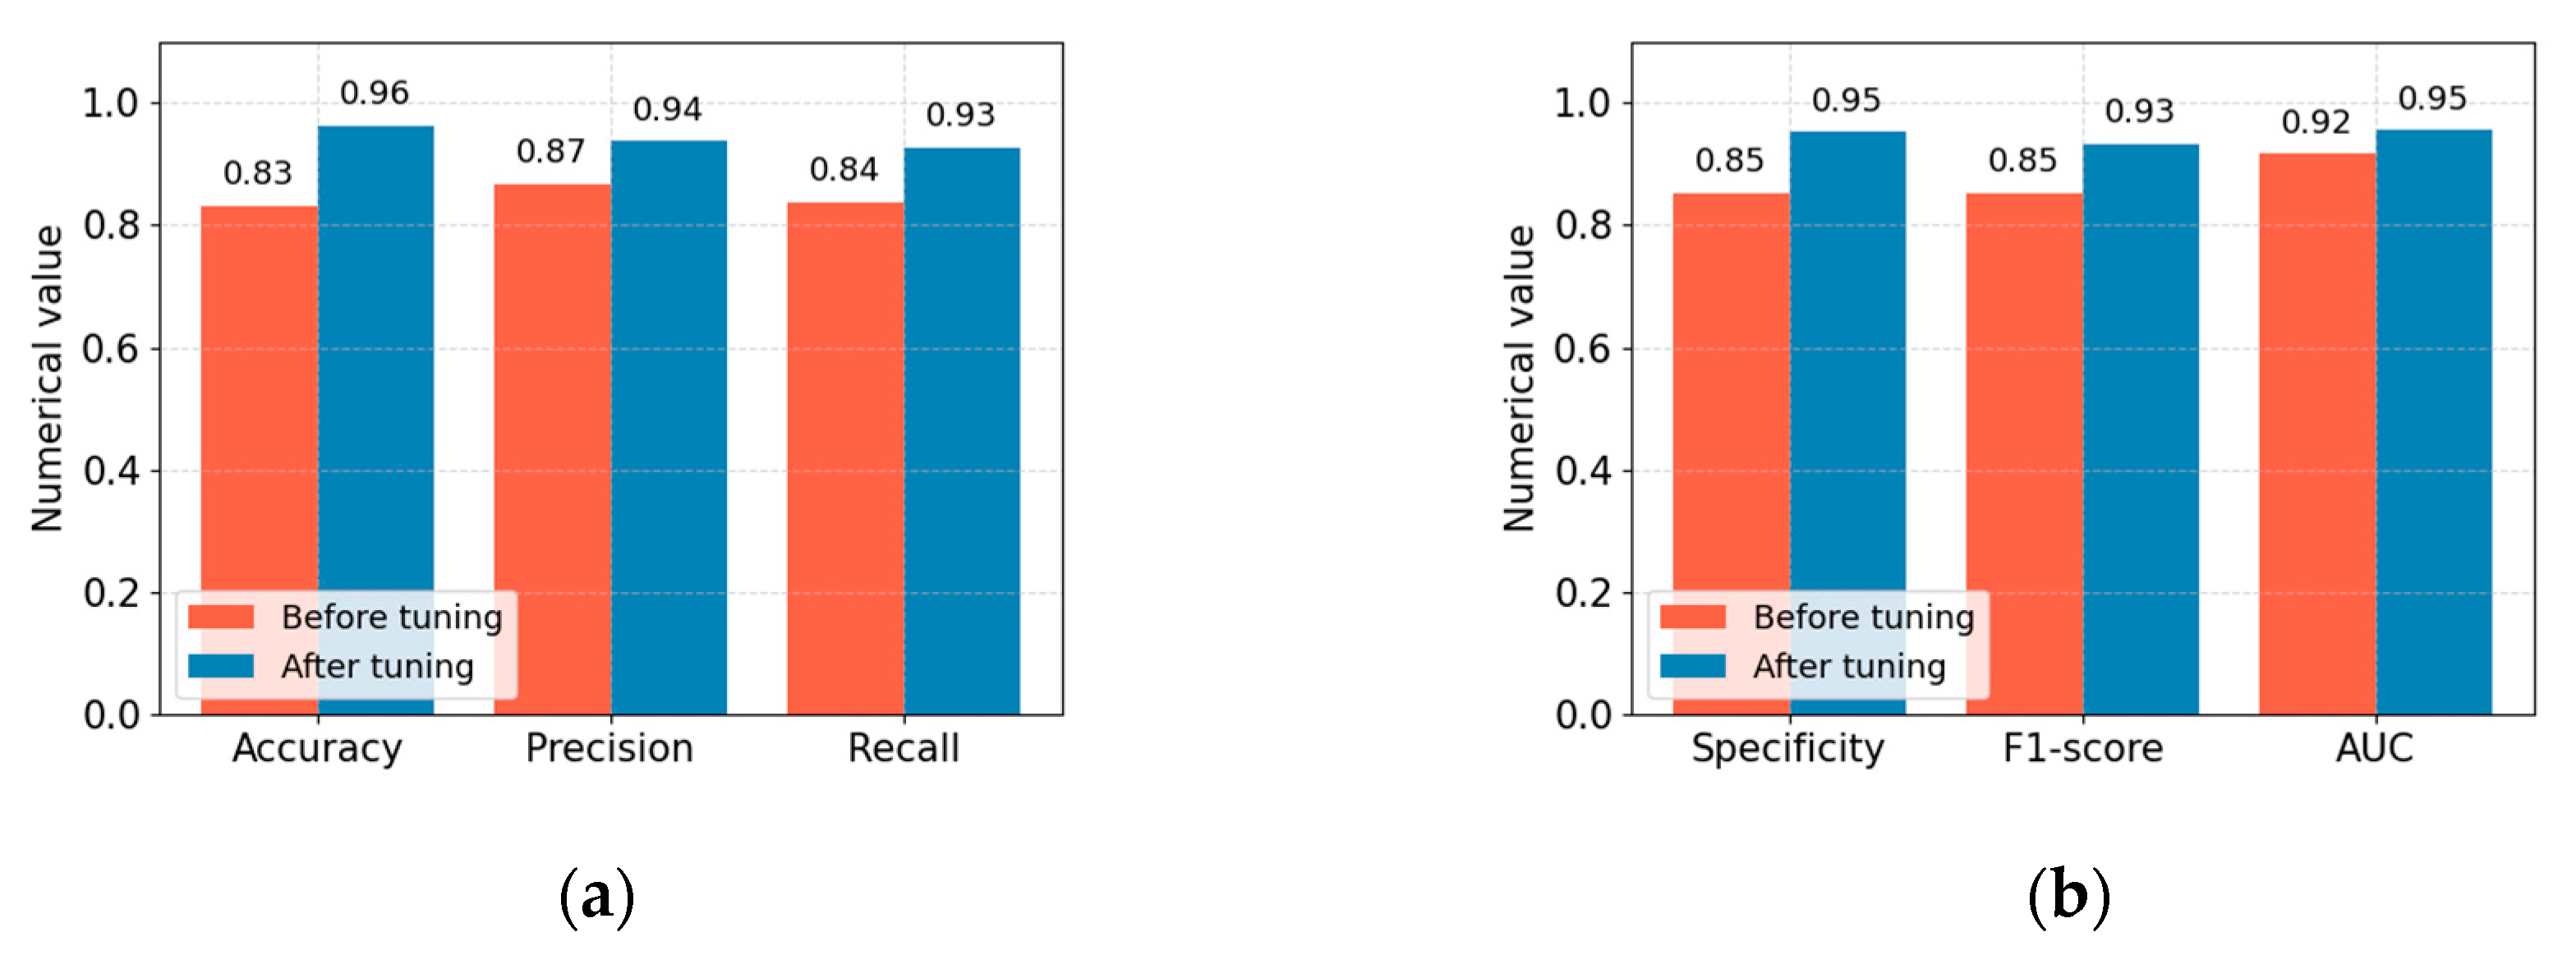
To gain a deeper understanding of the experimental effect of model parameter optimization, we compared the performance values of the proposed Acdim model before and after model parameter optimization using the ZOA algorithm. In this comparative experiment, we used the following evaluation indicators: accuracy, precision, recall, specificity, F1 score, and AUC value. The optimization comparison experiment results are shown in Figure 4.

Figure 4.
Comparison of accuracy, precision, recall, specificity, F1 score, and AUC value before and after optimization of the Acdim model. (a) Comparison of accuracy, precision, and recall. (b) Comparison of specificity, F1 score, and AUC value.
From the comparative experimental results in Figure 4, we can see that after the parameters of the Acdim model are optimized using the ZOA algorithm, the accuracy, precision, recall, specificity, F1 score, and AUC value of the Acdim model are improved accordingly. This effect is achieved because we use the zero-order optimization algorithm (ZOA) to optimize the parameters of TabNet and AdaBoost, which can efficiently explore complex hyperparameter spaces. For TabNet, ZOA can optimize parameters such as the number of decision steps, feature dimensions, and sparse regularization to improve the model’s feature selection and interpretability performance. For AdaBoost, ZOA can adjust the number of base learners, the learning rate, and the decision tree depth to enhance the integrated model’s overall performance. The ZOA method does not rely on gradient information and is suitable for models such as TabNet and AdaBoost with complex and discontinuous parameter relationships. By iteratively evaluating the model’s performance on the validation set, ZOA can dynamically adjust the search strategy to find the optimal parameter combination, thereby improving the accuracy and generalization ability of the cardiovascular disease risk prediction model.
4.6. Model Application Scenarios and Challenges
Applying the cardiovascular disease risk prediction model Acdim to nursing homes can significantly improve health management and nursing quality. The early warning function helps caregivers identify risks before disease symptoms appear and take timely intervention measures to reduce the occurrence of diseases. Personalized care develops a customized health plan for each older adult by predicting the results, to improve the quality of life. At the same time, resource optimization enables nursing homes to allocate medical resources and the workforce more effectively to ensure necessary support is provided at critical moments. Data-driven decision-making promotes scientific management, helps identify health trends, develops long-term health strategies, and improves overall operational efficiency and the happiness of the elderly.
Although the cardiovascular disease risk prediction Acdim model has many advantages in nursing home applications, it also faces significant challenges. Data quality and completeness are primary issues, and missing or inaccurate data can affect model performance and decision-making reliability. A lack of model interpretability also makes it difficult for caregivers to understand and trust the prediction results of complex models, limiting its application. Technology integration requires overcoming barriers such as system compatibility and user training to ensure that models fit seamlessly into existing care processes. In addition, data privacy and security must strictly adhere to regulations to protect sensitive health information of the elderly. Ethics and responsibility issues must balance technology applications and privacy rights to ensure that humanistic care is not ignored. Finally, the cost and resource investment will high, and nursing homes must evaluate the return on investment to ensure the sustainability of technology applications.
The contribution of this paper is that in the application scenario of elderly care, elderly care institutions cannot predict cardiovascular disease risks. Based on ResNet, TabNet, and AdaBoost, a model for predicting cardiovascular disease risks is proposed. This model can provide cardiovascular disease risk prediction for the elderly in elderly care institutions based on relevant sample datasets that can be easily collected when there is a lack of doctors in elderly care institutions.
The Acdim model proposed in this article shows significant novelty when using tabular data. The Acdim model automatically selects key features through its unique attention mechanism, reducing the need for manual feature engineering and improving the model’s ability to capture complex data patterns. Combined with AdaBoost, the model can integrate multiple weak classifiers to enhance the overall prediction performance and robustness. The zero-order optimization algorithm (ZOA) is used to efficiently optimize the hyperparameters of TabNet and AdaBoost, further improving the accuracy and generalization ability of the model and achieving more accurate risk assessment.
This model makes important contributions to the field of cardiovascular disease risk prediction. Relying only on tabular data means it is easy to implement in healthcare facilities such as nursing homes. The self-explanatory feature transparentizes the model decision-making process, enhancing clinicians’ trust and willingness to apply it. High accuracy and stability help the early identification of high-risk individuals, optimize the allocation of nursing resources, and improve the health management level of the elderly. This model promotes the development of medical prediction technology based on tabular data and provides practical tools and methods for public health management.
The model Acdim we propose based on ResNet, TabNet, and AdaBoost focuses on cardiovascular disease risk prediction and integrates deep learning and integrated learning technology to achieve a high accuracy and interpretability. Like xSiGra’s interpretive analysis of single-cell spatial data [42], Acdim automatically selects key clinical features through TabNet’s self-attention mechanism to provide transparent risk assessment. At the same time, for example [43], SpaRx analyzes the spatial heterogeneity of drug responses, and Acdim uses AdaBoost to optimize model performance and support personalized health management. Acdim complements xSiGra and SpaRx in multi-dimensional data processing and interpretability to jointly promote the development of personalized medicine.
This section has described the experimental process of the Acdim model from five perspectives: sample data, evaluation indicators, comparative experimental results, ablation experimental results, and optimization experimental results. The experimental results in this section demonstrate that the Acdim model we propose can make up for the ability of elderly care institutions to predict cardiovascular disease risks when there is a lack of doctors.
5. Conclusions
In order to enable nursing homes to predict cardiovascular disease risks in the absence of doctors, this paper proposes a model for cardiovascular disease risk prediction based on ResNet, TabNet, and AdaBoost. In the experimental results based on the BRFSS dataset, the model achieved 96% accuracy, 94% precision, 93% recall, 95% specificity, a 91% F1 score, and a 95% AUC value. In the Acdim model we propose, we use ResNet to extract sample data features, TabNet and AdaBoost to train classifiers, and the ZOA algorithm to optimize the relevant parameters of the two classifiers. Then, the inverse variance method is used for the weighted average calculation to obtain the prediction results of the model finally. In the experimental part, we conducted different comparative experiments on the Acdim model from the perspectives of different algorithms, different architectures, and different optimization methods. The results of various comparative experiments show that the Acdim model can predict cardiovascular disease risks for nursing homes. Due to objective factors such as the research time period and dataset, this paper’s research results have certain limitations. The central restriction is that the Acdim model proposed in this paper can only enable nursing homes to predict the risk of cardiovascular disease; however, in the application scenario of elderly care, the elderly in nursing homes will also have other disease risks that must be predicted. Therefore, in future research, we will extend the model to predict more disease risks. In multi-disease risk prediction, algorithms based on ResNet, TabNet, and AdaBoost must focus on multi-label classification. The model needs to integrate the advantages of these algorithms, handle the correlation between labels, optimize the feature fusion strategy, and apply an appropriate loss function to support multi-label output. In addition, to ensure the prediction’s reliability and practicality, the model’s interpretability and the handling of class imbalance are also key directions of our research. In addition, due to the limitations of the BRFSS dataset itself, in the following research work, we will cover more population datasets and further optimize the model to make it more widely applicable.
Author Contributions
F.Z. and S.H., wrote the main manuscript text, Z.L. and X.D. provided the idea. T.Z. and Y.Z. and H.Z. prepared the data and figures. All authors reviewed the manuscript. All authors have read and agreed to the published version of the manuscript.
Funding
The work of this paper is supported by the National Natural Science Foundation of China (42075134).
Data Availability Statement
The “Cardiovascular Diseases Risk Prediction Dataset” dataset is from https://www.kaggle.com/datasets/alphiree/cardiovascular-diseases-risk-prediction-dataset/data. Accessed on 13 August 2024.
Acknowledgments
Thanks to Rongjian Zhang, former attending physician of the Aviation Disease Rehabilitation Department of the Air Force Hangzhou Sanatorium, and Aimin Li, former attending physician of the Air Force Hangzhou Aviation Medical Identification and Training Center, for their medical guidance and cooperation.
Conflicts of Interest
The authors declare no conflict of interest.
References
- Cheung, C.Y.; Xu, D.; Cheng, C.Y.; Sabanayagam, C.; Tham, Y.C.; Yu, M.; Rim, T.H.; Chai, C.Y.; Gopinath, B.; Mitchell, P.; et al. A deep-learning system for the assessment of cardiovascular disease risk via the measurement of retinal-vessel calibre. Nat. Biomed. Eng. 2021, 5, 498–508. [Google Scholar] [CrossRef] [PubMed]
- Matsushita, K.; Ballew, S.H.; Wang, A.Y.M.; Kalyesubula, R.; Schaeffner, E.; Agarwal, R. Epidemiology and risk of cardiovascular disease in populations with chronic kidney disease. Nat. Rev. Nephrol. 2022, 18, 696–707. [Google Scholar] [CrossRef]
- Targher, G.; Corey, K.E.; Byrne, C.D. NAFLD, and cardiovascular and cardiac diseases: Factors influencing risk, prediction and treatment. Diabetes Metab. 2021, 47, 101215. [Google Scholar] [CrossRef] [PubMed]
- Lee, H.; Lee, Y.H.; Kim, S.U.; Kim, H.C. Metabolic dysfunction-associated fatty liver disease and incident cardiovascular disease risk: A nationwide cohort study. Clin. Gastroenterol. Hepatol. 2021, 19, 2138–2147. [Google Scholar] [CrossRef] [PubMed]
- Lupague, R.M.J.M.; Mabborang, R.C.; Bansil, A.G.; Lupague, M.M. Integrated Machine Learning Model for Comprehensive Heart Disease Risk Assessment Based on Multi-Dimensional Health Factors. Eur. J. Comput. Sci. Inf. Technol. 2023, 11, 44–58. [Google Scholar] [CrossRef]
- Mostafa, N.; Azim, M.A.; Kabir, M.R.; Ajwad, R. Identifying the risk of cardiovascular diseases from the analysis of physiological attributes. In Proceedings of the 2020 IEEE Region 10 Symposium (TENSYMP), Dhaka, Bangladesh, 5–7 June 2020; IEEE: Piscataway, NJ, USA, 2020; pp. 1014–1017. [Google Scholar]
- Habib, A.Z.S.B.; Tasnim, T. An ensemble hard voting model for cardiovascular disease prediction. In Proceedings of the 2020 2nd International Conference on Sustainable Technologies for Industry 4.0 (STI), Dhaka, Bangladesh, 19–20 December 2020; IEEE: Piscataway, NJ, USA, 2020; pp. 1–6. [Google Scholar]
- Rawat, S.; Kashyap, D.; Kumar, A.; Rawat, G. Comparative analysis of various classification models on disease symptom prediction dataset. In Proceedings of the 2021 Innovations in Power and Advanced Computing Technologies (i-PACT), Kuala Lumpur, Malaysia, 27–29 November 2021; IEEE: Piscataway, NJ, USA, 2021; pp. 1–4. [Google Scholar]
- Pavithra, V.; Jayalakshmi, V. Comparative Study of Machine Learning Classification Techniques to Predict the Cardiovascular Diseases Using HRFLC. In Proceedings of the 2021 5th International Conference on Intelligent Computing and Control Systems (ICICCS), Madurai, India, 6–8 May 2021; IEEE: Piscataway, NJ, USA, 2021; pp. 1–6. [Google Scholar]
- Someshwaran, G.; Sarada, V. A research review on fetal heart disease detection techniques. In Proceedings of the 2022 6th International Conference on Intelligent Computing and Control Systems (ICICCS), Madurai, India, 25–27 May 2022; IEEE: Piscataway, NJ, USA, 2022; pp. 1674–1681. [Google Scholar]
- Calero-Diaz, H.; Chushig-Muzo, D.; Fabelo, H.; Mora-Jiménez, I.; Granja, C.; Soguero-Ruiz, C. Data-driven cardiovascular risk prediction and prognosis factor identification in diabetic patients. In Proceedings of the 2022 IEEE-EMBS International Conference on Biomedical and Health Informatics (BHI), Ioannina, Greece, 27–30 September 2022; IEEE: Piscataway, NJ, USA, 2022; pp. 1–4. [Google Scholar]
- Tanisik, M.A.; Yaman, E.; Almisreb, A.; Tahir, N.M. Diagnosis of Cardiovascular Diseases Using Classification Algorithms. In Proceedings of the 2022 IEEE Symposium on Wireless Technology & Applications (ISWTA), Kuala Lumpur, Malaysia, 17–18 August 2022; IEEE: Piscataway, NJ, USA, 2022; pp. 57–61. [Google Scholar]
- Tyagi, S.; Sirohi, P.; Maheshwari, P. Predicting Cardiovascular Disease in Patients with Machine Learning and Feature Engineering Techniques. In Proceedings of the 2022 5th International Conference on Signal Processing and Information Security (ICSPIS), Dubai, United Arab Emirates, 7–8 December 2022; IEEE: Piscataway, NJ, USA, 2022; pp. 107–112. [Google Scholar]
- Afrose, T.; Hossen, M.; Islam, M.I. Heart Diseases Prediction Using Multiple Machine Learning Techniques. In Proceedings of the 2022 4th International Conference on Sustainable Technologies for Industry 4.0 (STI), Dhaka, Bangladesh, 17–18 December 2022; IEEE: Piscataway, NJ, USA, 2022; pp. 1–5. [Google Scholar]
- Koshiga, N.; Borugadda, P.; Shaprapawad, S. Prediction of Heart Disease Based on Machine Learning Algorithms. In Proceedings of the 2023 International Conference on Inventive Computation Technologies (ICICT), Lalitpur, Nepal, 26–28 April 2023; IEEE: Piscataway, NJ, USA, 2023; pp. 713–720. [Google Scholar]
- Abidin, A.J.; Borhan, R.; Akhter, A.; Jahan, S.; Based, M.A.; Zilany, A.K. A Voting Ensemble based Machine Learning Approach to Predict Cardiovascular Disease. In Proceedings of the 2023 26th International Conference on Computer and Information Technology (ICCIT), Cox’s Bazar, Bangladesh, 13–15 December 2023; IEEE: Piscataway, NJ, USA, 2023; pp. 1–6. [Google Scholar]
- Prakash, N.; Mahesh, M.; Gouthaman, P. Cardiovascular Disease Risk Assessment using Machine Learning. In Proceedings of the 2023 International Conference on Inventive Computation Technologies (ICICT), Lalitpur, Nepal, 26–28 April 2023; IEEE: Piscataway, NJ, USA, 2023; pp. 249–256. [Google Scholar]
- Rai, D.; Agrawal, J.; Pandey, D.; Pandey, D.; Jain, M. Clinical Efficacy of Ensemble Learning for Cardiovascular Disease Prediction: A Comparative Analysis with Traditional Machine Learning Classifiers. In Proceedings of the 2023 International Conference on Modeling, Simulation & Intelligent Computing (MoSICom), Dubai, United Arab Emirates, 7–9 December 2023; IEEE: Piscataway, NJ, USA, 2023; pp. 565–569. [Google Scholar]
- Lu, K.; Zhao, F.; Gu, P.; Wang, H.; Zang, T.; Wang, H. TetraCVD: A Temporal-Textual Transformer based Model for Cardiovascular Disease Diagnosis. In Proceedings of the 2023 IEEE International Conference on Bioinformatics and Biomedicine (BIBM), Istanbul, Türkiye, 5–8 December 2023; IEEE: Piscataway, NJ, USA, 2023; pp. 2129–2132. [Google Scholar]
- Seeboruth, K.; Wen, L.Z.; Hameed, V.A.; Wah, A.Y.; Rajadorai, K.P.; Rana, M.E. Utilizing Machine Learning Approaches for Cardiovascular Disease Forecasting. In Proceedings of the 2023 IEEE 21st Student Conference on Research and Development (SCOReD), Kuala Lumpur, Malaysia, 13–14 December 2023; IEEE: Piscataway, NJ, USA, 2023; pp. 39–42. [Google Scholar]
- Bhagat, H.V.; Singh, M. A Machine Learning Model for the Early Prediction of Cardiovascular Disease in Patients. In Proceedings of the 2023 Second International Conference on Advances in Computational Intelligence and Communication (ICACIC), Puducherry, India, 7–8 December 2023; IEEE: Piscataway, NJ, USA, 2023; pp. 1–5. [Google Scholar]
- Charkha, S.; Zade, A.; Charkha, P. Cardiovascular Disease (CVD) Prediction Using Deep Learning Algorithm. In Proceedings of the 2023 International Conference on Integration of Computational Intelligent System (ICICIS), Pune, India, 1–4 November 2023; IEEE: Piscataway, NJ, USA, 2023; pp. 1–6. [Google Scholar]
- Patil, S.; Lutimath, N.M.; Jogish, D.; Patil, B.S. Prediction of Heart Disease Using Hybrid Naïve Bayes Technique. In Proceedings of the 2023 22nd International Symposium on Communications and Information Technologies (ISCIT), Sydney, Australia, 16–18 October 2023; IEEE: Piscataway, NJ, USA, 2023; pp. 1–5. [Google Scholar]
- Rahman, W.; Aneek, R.H.; Moinuddin, M.; Sakib, M.S.; Iqbal, M.S.; Rahman, M.M. Cardiovascular Disease Prediction Utilizing Machine Learning and Feature Selection with Clonal Selection Algorithm. In Proceedings of the 2023 5th International Conference on Sustainable Technologies for Industry 5.0 (STI), Cox’s Bazar, Bangladesh, 13–15 December 2023; IEEE: Piscataway, NJ, USA, 2023; pp. 1–6. [Google Scholar]
- Aishee, S.S.; Chowdhury, S.K.; Mahmud, F.; Suha, S.A. Design and Development of an Ensemble Feature Selection and Machine Learning Based Cardiac Disease Prediction System. In Proceedings of the 2023 26th International Conference on Computer and Information Technology (ICCIT), Cox’s Bazar, Bangladesh, 13–15 December 2023; IEEE: Piscataway, NJ, USA, 2023; pp. 1–6. [Google Scholar]
- Tassi, S.C.; Polyzos, K.D.; Fotiadis, D.I.; Sakellarios, A.I. Gaussian Process-based Active Learning for Efficient Cardiovascular Disease Inference. In Proceedings of the 2023 IEEE International Conference on Bioinformatics and Biomedicine (BIBM), Istanbul, Türkiye, 5–8 December 2023; IEEE: Piscataway, NJ, USA, 2023; pp. 3188–3193. [Google Scholar]
- SK, H.K.; Praveen, A.; Kowshik, G.; Lokeshwaran, T.; Prasanna, K.M. Heart Disease Prediction using XGBoost and Random Forest Models. In Proceedings of the 2024 5th International Conference on Mobile Computing and Sustainable Informatics (ICMCSI), Lalitpur, Nepal, 18–19 January 2024; IEEE: Piscataway, NJ, USA, 2024; pp. 19–23. [Google Scholar]
- Long, Y. Using the XGB-LCE Model for Cardiovascular Disease Prediction from Individual Pivotal Factors. In Proceedings of the 2024 4th International Conference on Consumer Electronics and Computer Engineering (ICCECE), Guangzhou, China, 12–14 January 2024; IEEE: Piscataway, NJ, USA, 2024; pp. 399–402. [Google Scholar]
- Mušić, D.; Karajić, M.; Hećo, L.; Osmanović, E. Model for diagnosing cardiovascular diseases using AI. In Proceedings of the 2024 International Congress on Human-Computer Interaction, Optimization and Robotic Applications (HORA), Istanbul, Türkiye, 23–25 May 2024; IEEE: Piscataway, NJ, USA, 2024; pp. 1–4. [Google Scholar]
- Reddy, S.N.; Krishna, D.V.; Asritha, I.; Charitha, L. Ensemble Stacking Classifier for Cardiovascular Risk Prediction. In Proceedings of the 2024 International Conference on Inventive Computation Technologies (ICICT), Lalitpur, Nepal, 24–26 April 2024; IEEE: Piscataway, NJ, USA, 2024; pp. 534–540. [Google Scholar]
- Tousif, M.N.; Ushan, M.N.R.; Akhter, R.; Mahmud, S.; Rashid, S.; Mohammad, S. Performance Analysis of Heart Disease Detection Using Different Machine Learning Approaches. In Proceedings of the 2024 6th International Conference on Electrical Engineering and Information & Communication Technology (ICEEICT), Dhaka, Bangladesh, 2–4 May 2024; IEEE: Piscataway, NJ, USA, 2024; pp. 939–944. [Google Scholar]
- Fardibha, S.R.; Basha, P.H.; Sriharsha, V. Prediction of Heart Diseases using Advanced Learning and Data Analytics Approach. In Proceedings of the 2024 International Conference on Inventive Computation Technologies (ICICT), Lalitpur, Nepal, 24–26 April 2024; IEEE: Piscataway, NJ, USA, 2024; pp. 460–465. [Google Scholar]
- Zhou, F.; Hu, S.; Du, X.; Lu, Z. Motico: An attentional mechanism network model for smart aging disease risk prediction based on image data classification. Comput. Biol. Med. 2024, 178, 108763. [Google Scholar] [CrossRef] [PubMed]
- Trojovská, E.; Dehghani, M.; Trojovský, P. Zebra optimization algorithm: A new bio-inspired optimization algorithm for solving optimization algorithm. IEEE Access 2022, 10, 49445–49473. [Google Scholar] [CrossRef]
- Arik, S.Ö.; Pfister, T. Tabnet: Attentive interpretable tabular learning. In Proceedings of the AAAI Conference on Artificial Intelligence 2021, Virtually, 2–9 February 2021; Volume 35, No. 8. pp. 6679–6687. [Google Scholar]
- Zhou, F.; Hu, S.; Du, X.; Wan, X.; Lu, Z.; Wu, J. Lidom: A Disease Risk Prediction Model Based on LightGBM Applied to Nursing Homes. Electronics 2023, 12, 1009. [Google Scholar] [CrossRef]
- Zhou, F.; Hu, S.; Du, X.; Wan, X.; Wu, J. A Lightweight Neural Network Model for Disease Risk Prediction in Edge Intelligent Computing Architecture. Future Internet 2024, 16, 75. [Google Scholar] [CrossRef]
- Zhou, F.; Hu, S.; Wan, X.; Lu, Z.; Wu, J. Diplin: A Disease Risk Prediction Model Based on EfficientNetV2 and Transfer Learning Applied to Nursing Homes. Electronics 2023, 12, 2581. [Google Scholar] [CrossRef]
- Zhou, F.; Hu, S.; Wan, X.; Lu, Z.; Wu, J. Risevi: A Disease Risk Prediction Model Based on Vision Transformer Applied to Nursing Homes. Electronics 2023, 12, 3206. [Google Scholar] [CrossRef]
- Hao, Y.; Usama, M.; Yang, J.; Hossain, M.S.; Ghoneim, A. Recurrent convolutional neural network based multimodal disease risk prediction. Future Gener. Comput. Syst. 2019, 92, 76–83. [Google Scholar] [CrossRef]
- Zhou, F.; Du, X.; Li, W.; Lu, Z.; Wu, J. NIDD: An intelligent network intrusion detection model for nursing homes. J. Cloud Comput. 2022, 11, 91. [Google Scholar] [CrossRef]
- Budhkar, A.; Tang, Z.; Liu, X.; Zhang, X.; Su, J.; Song, Q. xSiGra: Explainable model for single-cell spatial data elucidation. Brief. Bioinform. 2024, 25, bbae388. [Google Scholar] [CrossRef] [PubMed]
- Tang, Z.; Liu, X.; Li, Z.; Zhang, T.; Yang, B.; Su, J.; Song, Q. SpaRx: Elucidate single-cell spatial heterogeneity of drug responses for personalized treatment. Brief. Bioinform. 2023, 24, bbad338. [Google Scholar] [CrossRef]
Disclaimer/Publisher’s Note: The statements, opinions and data contained in all publications are solely those of the individual author(s) and contributor(s) and not of MDPI and/or the editor(s). MDPI and/or the editor(s) disclaim responsibility for any injury to people or property resulting from any ideas, methods, instructions or products referred to in the content. |
© 2024 by the authors. Licensee MDPI, Basel, Switzerland. This article is an open access article distributed under the terms and conditions of the Creative Commons Attribution (CC BY) license (https://creativecommons.org/licenses/by/4.0/).