Abstract
In the field of industrial big data, the key issue in discovering data value lies not in overcoming the bottlenecks formed by analysis methods and data mining algorithms but in the difficulty of providing data element resources that meet business analysis needs. Due to the surge in data volume and the increasing reliance of enterprises on data-driven decision-making, future data management strategies are constantly evolving to meet higher quality and efficiency requirements. Data metadata resources that meet business analysis needs require high-quality data integration, standardization, and metadata management. The key is to ensure the consistency and availability of data to support accurate analysis and decision-making. By leveraging automation and machine learning, organizations can more effectively integrate and manage data metadata resources, thereby improving data quality and analytical capabilities. The multi-value chain data space is a digital ecological platform for organizing and managing industrial big data. Research on optimizing the supply of its business data resources is a significant topic. This paper studies the evaluation index system of data quality and data utility, constructs an evaluation matrix of business data resources, and addresses the issues of data sparsity and cold start in evaluation calculations through a data quality-utility-based evaluation model of business data resources. It investigates a business data resource algorithm based on collaborative filtering, forming a recommendation set of similar data quality-utility data resources to provide to data analysis users. Finally, using actual production datasets, the paper validates the business data resource evaluation model, compares the performance and effectiveness of three business data resource recommendation algorithms based on collaborative filtering, empirically demonstrates the recommendation accuracy and stability performance of the combined improved data quality-utility collaborative filtering algorithm (CFA-DQU), and provides technical research recommendations for optimization of business data resources.
1. Introduction
Data are a crucial production factor that promotes value chain collaboration and enables full-factor production [1]. Therefore, in the era of digital transformation, the importance of data is becoming increasingly prominent. To better and faster uncover data value, analysts from Daimler–Chrysler, SPSS, and NCR jointly developed the Cross Industry Standard Process for Data Mining (CRISP-DM), providing a methodology for data mining and knowledge discovery [2]. In CRISP-DM, “business understanding and data understanding” are placed at the forefront. In other words, in the field of big data for industry/manufacturing, the key issue in uncovering data value is not the bottleneck caused by analytical methods and data mining algorithms, but the difficulty in providing data elements that meet business analysis needs [3,4].
Data space, as a next-generation data management concept (focusing not on the storage structure and data structure themselves but on the value and application of the data), aligns with the management and service requirements for business data resources within the multi-value chain collaborative system, effectively addressing this shortcoming [5].
The main function of a data space is to process data into higher quality and more valuable data resources, transforming them into data assets, which data consumers can then access to meet their business analysis needs with the support of the data space. The multi-value chain data space is a cloud platform-based system that integrates multi-value chain business logic data, physical logic data, and data resource mapping relationships, providing an effective data management tool for retrieving business data resources. It serves as the foundational platform for multi-value chain business analysis in dynamic enterprise alliances within the industrial ecosystem, and as an enabling tool for shifting from business-driven to data-driven decision-making [6]. As the business collaboration network among enterprises in the multi-value data space continues to expand, the resulting business data resources are growing explosively [7].
However, in the field of multi-value chain business analysis, the uncertainty of cross-enterprise value chain business analysis imposes higher demands on data resources themselves. Determining what type of data resources are needed in the current context becomes the primary question facing data consumers. Against this backdrop, enhancing data quality and utility to strengthen the support for data analysis, based on the characteristics of business data resources and the requirements of business analysis, and evaluating and optimizing business data resources to provide enterprises’ data consumers with business data resources that meet the needs of business analysis, constitutes the primary focus of this study.
Currently, the evaluation of business data resources in a multi-value chain data space mostly involves judging and evaluating data consistency and data missingness based on physical structure logic. However, this method only assesses data resources from the dimension of data quality management. The requirements for data quality vary in different fields and scenarios, resulting in poor comparability of evaluation results [8]. Existing data quality evaluation methods mostly focus on data completeness, accuracy, and consistency, with insufficient attention to data timeliness, relevance, and applicability [9]. Meanwhile, research on data resource recommendation requires mining a large amount of usage experience data to achieve [10]; data sparsity and cold start issues are also major obstacles to the recommendation of data resources [11].
Data analysis is a process that requires repeated experimentation and tuning of analytical algorithm models, involving substantial pre-processing work such as data extraction and acquisition. In the business analysis scenario of multi-value chain collaboration, how to quickly and efficiently provide business data resources in the data space is the core of this research. To address these needs, this paper will study the optimal model framework based on the evaluation and recommendation of business data resources from the perspectives of business logic and physical logic. We proposed an optimal selection technology for business data resources in a multi-value chain data space and, finally, verified the effectiveness and feasibility of the proposed methods and technologies through empirical research.
Fricker S.A. and Maksimov Y.V. [12] conducted research on a pricing model for data resources based on data quality. This article approaches the issue from the perspective of data transactions, analyzing the impact of quality levels on data analysis, but it does not address the impact of data utility on data analysis. Xiao Yunlong et al. [13] proposed a data selection method based on data utility evaluation to address the issue of unstable data utility. The primary goal of this method is to improve the recognition rate of data during selection. However, it overlooks the impact of data quality on data analysis. In current research on data resource optimization, data quality and data utility are often treated as separate aspects, with frameworks and models developed independently. There is a lack of research that integrates data quality and utility into a unified perspective. This paper constructs an evaluation model based on “data quality utility” and conducts research on recommendation algorithms for business data resources, aiming to provide users of multi-value chain data spaces with data resources that meet their business needs.
The multi-value chain data space is a data-driven enabling platform. This paper addresses issues such as low data quality, low utility value, and imprecise matching of business data resource supply in the multi-value chain data space by proposing an optimal model framework for business data resources driven by data requirements. The framework is divided into two modules: a business data resource evaluation module and a recommendation module. The evaluation module employs a combination of quantitative and qualitative methods, along with dynamic evaluation updates, to address adaptability issues across multiple scenarios. It enables the evaluation of data quality, data utility, and the combined metric of data quality utility, laying a foundation for the supply of business data resources. Additionally, it employs collaborative filtering algorithms based on data quality, data utility, and the combined quality-utility metric to avoid the cold-start problem associated with user-preference-based collaborative filtering algorithms. The recommendation module compares the recommendation effects of three types of collaborative filtering algorithms: those based on data quality, data utility, and the combined quality-utility metric. Through comparisons in various scenarios, the applicability of the proposed model framework is demonstrated. The main contributions of this paper are summarized as follows:
- (1)
- A business data resource evaluation model combining quantitative and qualitative indicators of data quality and utility was established, and the evaluation of business data resources in the multi-value chain data space was completed.
- (2)
- Based on the evaluated business data resources, collaborative filtering research was conducted to address the issues of data sparsity and cold start in business data resource recommendation algorithms.
- (3)
- A combined optimal framework for the evaluation and recommendation of business data resources was constructed. The study developed business data resource recommendation algorithms based on data quality, data utility, and an improved combination of data quality utility. Using real datasets, a comparative analysis of the application effects of the three algorithms in different scenarios was conducted. The technical validation was successfully completed.
The organization of this paper is as follows:
Section 1 is the introduction, which provides an overview of the multi-value chain data space as a data-driven enabling platform, highlights its crucial role in proactive data management and services, analyzes the challenges in matching business data resource supply with demand, identifies the main issues to be addressed in this paper, and emphasizes the significance of studying optimal techniques for business data resources in a multi-value chain data space.
Section 2 reviews the research progress in related fields, analyzing the contributions and limitations of business data resource optimization research in four scenarios: business resource matching and recommendation, data quality and utility evaluation, business scenarios, and big data analysis. It points out the lack of research on proactive business data resource optimization techniques that meet data-driven decision-making needs.
Section 3 provides an overview of the optimal model framework and its main modules (the business data resource evaluation module and the recommendation module), clarifying that this framework serves as a proactive data management and service solution for multi-value chain data spaces.
Section 4 and Section 5 discuss the evaluation and recommendation modules for business data resources. Section 4 elaborates on the evaluation metrics, models, and dynamic update algorithms, while Section 5 provides a detailed explanation of three collaborative filtering-based recommendation algorithms.
Section 6 validates the overall optimization model and recommendation algorithms. Through experimental analysis, the evaluation results of business data resources were calculated. Based on these results, the paper verifies and analyzes the outcomes of three collaborative filtering algorithms based on data quality, data utility, and combined quality-utility evaluation.
Section 7 presents the conclusions of this paper.
2. Related Research Work
2.1. Multi-Value Chain Business Resource Matching and Recommendation
Third-party cloud platforms provide a means for integrating and sharing business data resources among enterprise clusters in multi-service value chains. As the number of enterprises on third-party platforms continues to increase, a large amount of business data resources is also accumulated. These business data resources are of great significance to enterprises in achieving cost reduction and efficiency improvement. However, faced with a large volume of business data resources, enterprises in the multi-value chain data space find it difficult to quickly and accurately obtain valuable and high-quality business data resources that meet their needs.
In response to the overload of business data resources in multi-service value chains, Wang Shuhai [14] employed recommendation algorithms to recommend high-quality business resources to different enterprise users, aiding in cost reduction and efficiency improvement. Yu Yang [15] proposed a bilateral matching model for business resources in multi-service value chains, which integrates the personalized business needs of both supply and demand sides. This model filters the most satisfactory data resources for the demand side from the vast information resources, optimizing the collaborative effect between the supply and demand sides.
The aforementioned research focuses on business needs and achieves inter-enterprise business collaboration through the matching of business data resources. Such collaborative enterprise decisions require analysts to have a comprehensive understanding of business operations to address and decide on inter-enterprise collaboration issues, limiting the ability to transfer the approach across scenarios. Moreover, the collaborative business needs between enterprises are often uncertain: if the business requirements are unclear, data-driven business collaboration is unlikely to occur. In the context of data-driven business decision-making, business decisions based on data insights represent the true need for enterprises to enhance operational efficiency. Therefore, the optimal model framework for business data resources proposed in this paper provides high-quality and high-value data foundational conditions for achieving effective data insights.
2.2. Optimal Selection of Data Resources Based on Data Quality and Utility Evaluation
In the context of digital transformation, the evaluation of data quality and data value is an important basis for the optimal selection of business data resources. Particularly, research on recommending data resources from the perspective of utility value has garnered increasing attention. Sadiq proposed a data quality management framework that covers multiple dimensions, such as completeness, accuracy, consistency, and timeliness [8]. This framework provides a systematic method for assessing the fundamental quality of data resources. However, the evaluation of data utility needs to consider more business value and application scenarios. Zhang studied the evaluation of data quality in collaborative information systems and proposed evaluation indicators that comprehensively consider data relevance and applicability [9]. These studies indicate that high-quality data should not only have basic accuracy and consistency but also high business relevance and applicability. From the perspective of utility value, researchers have proposed various data resource recommendation methods. Grover proposed a data utility evaluation framework that assesses the potential value of data by analyzing its actual application effects in different business scenarios [1]. This method emphasizes that the selection of data resources should be based not only on their quality but also on their contribution to actual business decisions. Chen further studied data resource recommendation methods based on machine-learning technologies [16]. They proposed dynamically adjusting data resource recommendation strategies by constructing data utility models and using historical data and business feedback. This research shows that combining machine-learning and data mining techniques can significantly improve the accuracy and effectiveness of data resource recommendations.
Despite significant progress in data quality and utility evaluation, there are still some problems and challenges in this field. First, the standards for data quality and utility are not yet unified. Different evaluation methods in research and application scenarios lead to poor comparability of results [8]. Second, data resource recommendation methods still face many challenges in practical applications, such as data privacy protection and imperfect data-sharing mechanisms [17]. Third, most studies propose evaluation metrics for data quality and data utility separately to assess data resources. This reflects a passive management approach to data resources, lacking a proactive service perspective to unlock data value.
Starting with the goal of maximizing the release of business data value, this paper compares and integrates data quality and data utility evaluation metrics. By combining quantitative and qualitative methods with dynamic evaluation updates, it addresses the adaptability issues in multi-scenario evaluations.
2.3. Research on Optimal Selection of Data Resources for Business Scenarios
Different business scenarios have different requirements for data resources. Therefore, the optimal selection of data resources must be analyzed in conjunction with specific application scenarios. In recent years, many studies have emphasized the importance of scenario needs in data selection. Kraus studied the data application needs in different business fields and pointed out that data types and sources differ significantly in the retail, manufacturing, and healthcare sectors [18]. For instance, in the retail industry, customer behavior data and sales data are key resources, while in manufacturing, production data and equipment sensor data are more important. Understanding the data needs in different scenarios helps to more accurately select and configure data resources.
In the field of smart manufacturing, Wang proposed a data resource optimization method based on scenario needs [19]. By analyzing the data flows and information requirements in smart manufacturing systems, they proposed a strategy for dynamically adjusting data resources to meet the needs of different production stages and tasks. This research provides practical guidance for data resource configuration in different scenarios. Similarly, in the financial sector, Liu studied the needs of financial institutions for real-time transaction data and market intelligence data and proposed a framework for the optimal selection of data resources to ensure that data resources can support fast and accurate financial analysis and decision-making [17].
Current research on data resource optimization for business scenarios primarily focuses on the business domain, emphasizing responsiveness to business needs while neglecting the evaluation of data quality and utility. Such studies often assume that the data quality and value are already sufficient. However, from the perspective of industrial practice, environments with low-quality, low-value, and fragmented data are the actual norm. Consequently, there remains a lack of comprehensive research on data resource optimization based on dynamic data evaluation.
2.4. Research on Optimal Selection of Data Resources for Big Data Analysis and Processing
The demand for data analysis directly influences the optimal selection of data resources. With the rapid development of big data technologies and machine-learning algorithms, the demand for high-quality data has become increasingly urgent. Recent studies show that the effectiveness of data analysis largely depends on data quality and suitability. For example, Janssen et al. (2017) [20] pointed out that high-quality data can significantly improve the accuracy and efficiency of decision-making (Emerald). Additionally, Bevilacqua and Ciarapica (2018) [21], through their research on big data analytics tools, emphasized the critical role of data adaptability in quality management, noting that improving data quality can directly optimize business decision-making (Life Science Alliance). These studies indicate that when enterprises rely on complex data ecosystems, the quality and adaptability of data are key factors in obtaining effective analytical results. Sun studied data preprocessing techniques in big data analysis and pointed out the importance of data cleaning, data integration, and data transformation in improving data quality and analysis accuracy [22]. Their research emphasizes that when selecting data resources, the analyzability of the data must be considered; that is, whether the data have been sufficiently preprocessed and prepared to support efficient analysis processes.
Furthermore, for the application of machine-learning and deep-learning models, Huang proposed a data selection framework to optimize the datasets for model training and testing [23]. Their research shows that the diversity and representativeness of data are crucial for building robust machine-learning models. Therefore, in the process of optimal data resource selection, attention should be paid to choosing datasets that cover a wide range of business scenarios and data characteristics, in order to enhance the model’s generalization ability and predictive accuracy.
The optimal selection of business data resources is a complex and multidimensional task. By combining data quality and value evaluation, the application needs of different scenarios, and the specific requirements of data analysis, a comprehensive and effective data resource optimization framework can be constructed. This not only enhances the effectiveness of data analysis but also provides strong support for business decision-making, thereby achieving data-driven business innovation and enhancing competitive advantages in industry collaboration. This raises specific requirements for data resource supply: the required data must be massive, multidimensional, high-quality, and highly adaptable. However, data resource optimization frameworks for big data analysis primarily focus on improving data quality and synthesizing data, with an emphasis on data model optimization, rather than directly unlocking the business value of the data.
From the review and analysis of various studies on business data resource optimization, it is evident that optimizing business data resources is a complex and multidimensional task. The aforementioned studies addressed the optimization issues of business data resources in terms of precise matching, data quality improvement, multi-scenario reuse, and model optimization from different perspectives. However, they lack a comprehensive solution for business data resource optimization under a data-driven decision-making paradigm. This paper integrates data quality and value evaluation, the application requirements of various scenarios, and specific data analysis needs to develop a comprehensive and effective data resource optimization framework. This framework not only enhances the effectiveness of data analysis but also provides strong support for business decision-making, serving as a technical reference for achieving data-driven business collaboration and innovation.
3. Optimal Model Framework for Business Data Resource Selection in Multi-Value Chain Data Spaces
The primary work of the optimal selection technology for business data resources in multi-value chain data spaces is conducted within the framework of the business data resource optimal model. By studying the evaluation system of data quality and data utility, a business data resource evaluation model based on data quality utility is constructed. Through the evaluation results of data quality, data utility, and data quality utility of business data resources, the current status of business data resources can be objectively understood. At the same time, an evaluation matrix of the business data resource recommendation algorithm is generated to obtain the recommendation set of business data resources.
The optimal model framework for business data resources in multi-value chain data spaces mainly consists of two modules: a business data resource evaluation model based on data quality utility and a business data resource recommendation algorithm based on collaborative filtering. The evaluation model extracts data from the multi-value chain data space and evaluates business data resources from the perspectives of data quality and data utility. The uncertainty of multi-value chain business analysis requirements results in difficulty in accumulating historical usage data, making it challenging to study recommendation algorithms by constructing “user-rating” or “user-item” matrices for the optimal selection of business data resources.
Therefore, it is necessary to start with the current state of data and provide business personnel with data resources that meet their needs as much as possible. Evaluating business data resources not only helps to understand the current status of these resources but also addresses the cold-start problem in the optimal recommendation. We can further study the business data resource recommendation algorithm based on collaborative filtering through the data quality evaluation matrix, data utility evaluation matrix, and data quality-utility evaluation matrix. The optimal model framework for business data resources is shown in Figure 1 below:
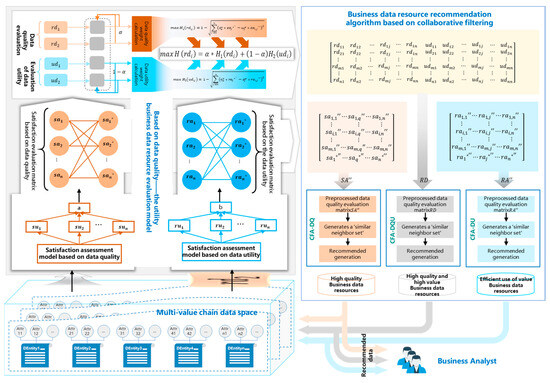
Figure 1.
The optimal model framework for business data resources oriented to multi-value chain data space.
4. Business Data Resource Evaluation Model Based on Data Quality-Utility
This paper aims to construct a comprehensive evaluation system for business data resources based on “data quality-utility”. It combines fuzzy theory, analytic hierarchy process (AHP), and entropy weight method to build the Business Data Resource Optimization Model (BDROM). Then, from the perspective of data quality-utility factors, BDROM is transformed into a multi-task optimization model based on data quality-utility factors. Finally, the “data quality-utility” evaluation matrix and its results are derived.
Definition 1.
The set of metadata quality factors
, where data quality factors include accuracy, completeness, availability of data, etc., represents the -th data quality factor, N-dimensional data quality factor index set, represents the -th dimension index; , is the index evaluation set corresponding to , represents the -th dimension index valuation; , represents the -dimensional evaluation ideal set corresponding to all indicators of business data resources, is the -th dimension indicator evaluation ideal value. The initial satisfaction matrix based on data quality factors is composed of the -dimensional data quality factor set , the -dimensional evaluation set corresponding to , and the -dimensional evaluation ideal set corresponding to all indicators of data quality attributes:
Definition 2.
The -dimensional business data resource set , where represents the -th business data resource, mainly including business data entities containing business domain, business process, and business entity mapping relationships; the -dimensional business data resource index set , where represents the -th dimension index; , is the index evaluation set corresponding to , represents the -th dimension index evaluation value; , represents the n-dimensional utility evaluation ideal set corresponding to all indicators of business data resources, is the -th dimension utility index evaluation ideal value. The initial satisfaction matrix based on data utility is composed of the -dimensional business data resource set , the -dimensional utility evaluation set corresponding to , and the -dimensional utility evaluation set corresponding to all indicators of business data resources:
The business data resource selection model aims to identify the business data resource with the highest comprehensive satisfaction based on data quality and business value factors. The construction process of the business data resource selection model, as shown in Figure 2, consists of four main parts: (1) constructing a satisfaction evaluation index system based on data quality and utility factors; (2) forming a normalized satisfaction evaluation matrix based on data quality and utility; (3) solving a multi-objective optimization model based on data quality and utility factors; and (4) outputting the optimal business data resource.
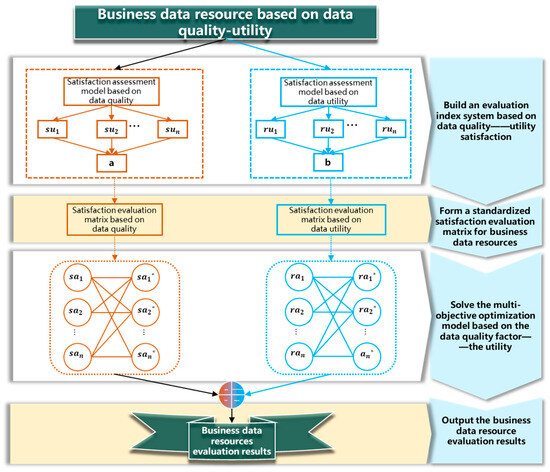
Figure 2.
The framework for constructing business data resource evaluation models.
4.1. Satisfaction Evaluation Index System for Data Quality and Utility
In a multi-value chain data space, BDROM needs to meet both the requirements of the demand side for business data resources and the supply side’s control over data quality factors. Therefore, this paper conducts an optimal analysis of business data resources from the perspectives of data quality and utility factors. The indicators are divided into quantitative and qualitative indicators based on their nature, and into positive/negative quantitative and qualitative indicators based on their type. For positive indicators, the larger the better, while for negative indicators, the smaller the better.
4.1.1. Satisfaction Evaluation of Business Data Resources
Based on data quality in the field of digital operations, the optimization of data quality is a crucial research topic. High-quality data are the foundation for ensuring the scientific nature of data analysis and decision-making. Researchers have systematically evaluated and optimized data quality from multiple dimensions, mainly including accuracy (Wang, R.Y., and Strong, D.M. proposed a data accuracy evaluation model focusing on the correctness and precision of data records [24]), completeness (Pipino, L.L., Lee, Y.W., and Wang, R.Y. studied data completeness issues and proposed a comprehensive method for detecting and filling data gaps [25]), consistency (Batini, C. and Scannapieco, M. proposed a data consistency checking framework capable of automatically detecting and fixing consistency issues in data [26]), timeliness (Ge, M. and Helfert, M. studied the impact of data timeliness on decision-making and proposed a real-time data quality monitoring system [27]), and accessibility (Oliveira, P., Rodrigues, F., and Henriques, P.R. proposed a data accessibility evaluation model that continuously optimizes data access paths and speeds through user feedback mechanisms [28]).
The main task of optimization based on data quality factors is to find the data that best meets business needs from the set of data quality factors. Combining the main research results in the current data quality evaluation, this paper determines the construction of a satisfaction evaluation index system based on data quality from the dimensions of completeness, accuracy, usability, and consistency, as shown in Table 1.

Table 1.
Satisfaction evaluation indicators for business data resources based on data quality.
The following explanations are provided for the quantitative index calculations in Table 1:
① represents data integrity, and its indicator value is calculated as the ratio of missing values of data items to the number of rows in the data entity, i.e., , where is the number of missing data items and is the number of rows in the business data entity. This metric measures the extent to which data elements are populated with values.
② represents data accuracy, and its indicator value is obtained through a composite calculation of and (). is calculated as the ratio of the number of data items exceeding the preset value range to the number of rows in the data entity, i.e., , where represents the number of data items exceeding the value range. The data type, range, length, and precision exceed the preset value range, and this metric measures the extent to which the described data entity reflects the true value. represents the duplication rate of the data entity, i.e., , where is the number of duplicate data entities and is the total number of data entities counted.
③ represents data availability, and its indicator value represents the success rate of data calls over a period of time. The higher the success rate, the higher the availability.
④ represents data consistency, and indicator value is qualitatively determined by whether the data conform to business standards and norms, i.e., , where is the number of failed data calls over a period of time and is the total number of data calls during that period. This metric primarily reflects the inconsistency rate of identical data items across different data entities at the same stage.
4.1.2. Satisfaction Evaluation of Business Data Resources Based on Data Utility
The utility evaluation of data resources is a crucial aspect of data management and data science, directly influencing the decision-making processes and competitiveness of enterprises and organizations. Olson John A. proposed the concept of “Data-as-a-Service” (DaaS) in 2010, emphasizing the value of data sharing and reuse [29]. When conducting business-oriented data analysis, business personnel engage in extensive trial and error in data selection, thereby forming experience in quickly selecting data resources. Evaluating business data resources based on this experience directly reflects the utility value of the data.
This paper understands that the essence of optimizing business data resources from the perspective of data utility is for the demand side to find the optimal business data resource that meets its business needs from a set of business data resources. To determine the evaluation indicators for data utility, Chen [16] quantified the business value of data by calculating its utility in different application scenarios. Drawing on this approach, this study identifies factors influencing data utility as follows: the quality of business data resources provided to customers, cost-utility, timeliness, access volume, data coverage, customer satisfaction, and data security. Therefore, the satisfaction evaluation index system for business data resources based on data utility is shown in Table 2.
Table 2.
Satisfaction evaluation indicators for business data resources based on data utility.
The following explanations are provided for the calculation of the indicators in Table 2:
① represents data quality, and its index value is determined by the accuracy, completeness, consistency, and usability of business data resources.
② represents maintenance cost, and its index value is primarily determined by the time cost of performing quality checks on business data resources, where , with representing the time expenditure for maintaining business data resources.
③ represents timeliness, and its index value is determined by the length of the business data update cycle and the number of updates within the cycle, where , with representing the length of the business data update cycle and representing the number of updates within the cycle.
④ represents access volume, and its index value is determined by the number of user clicks on business data resources, expressed as , with representing the number of user clicks on business data resources.
⑤ represents user satisfaction, and its indicator value is qualitatively determined by users’ satisfaction with data and services. The processing of this indicator is based on fuzzy theory, which quantifies fuzzy linguistic terms. The specific calculation process refers to Equation (2).
⑥ represents data security, and its indicator value is qualitatively determined by the confidentiality, integrity, and availability of business data resources. The calculation of these qualitative indicators follows the same process as .
4.2. Constructing a Normalized Evaluation Matrix Based on Data Quality and Utility
Due to the difficulty of integrating qualitative indicators such as data security and user satisfaction with other objective quantitative indicators for a comprehensive quantitative calculation of the utility of business data resources, this paper chooses to use fuzzy linguistic terms such as “very good”, “good”, “average”, “poor”, and “very poor” to subjectively describe user satisfaction and data security. The purpose of using fuzzy terms for subjective evaluation is to utilize fuzzy theory to handle the fuzziness of these indicators and quantify these qualitative indicators. The relevant concepts of fuzzy theory are defined as follows:
Definition 3.
With a domain , where the elements in the domain are , any mapping from to the closed interval is defined as follows:
Here, a fuzzy subset on the domain is referred to as a fuzzy set, and is called the membership degree. When varies within the domain U, is called the membership function of the fuzzy set (the membership function reflects the degree to which an element in the domain belongs to the set ). Similarly, the domain of qualitative indicators represents all qualitative indicator sets, where is the -th qualitative indicator in and .
Definition 4.
A hedonic operator is an operation or function that modifies the membership degree of a fuzzy set. It is used to alter or adjust the membership function . Using as a hedonic operator to quantitatively describe the membership function of a fuzzy set, the transformed membership function is , and the calculation formula is as follows:
Here, represents different levels of hedonic operator fuzzy linguistic terms, represents the number of users evaluating with the hedonic operator fuzzy linguistic terms, represents the total number of users evaluating , and represents the membership degree of the -level hedonic operator fuzzy linguistic terms. The membership degrees for different hedonic operator fuzzy linguistic term levels for each qualitative indicator are different, as shown in Table 3.
Table 3.
Membership degrees of different hedonic operator fuzzy linguistic terms.
The evaluation value of qualitative indicators is represented by the sum of the membership degrees of all fuzzy linguistic terms. The calculation formula is as follows:
where represents the evaluation value of the -th qualitative indicator.
According to the data utility evaluation indicator system, all qualitative indicators are positive qualitative indicators. Therefore, the qualitative indicators in the data utility factors are quantified using fuzzy theory on fuzzy linguistic terms.
Using the calculation formulas for , and Formulas (1) and (2), the initial satisfaction evaluation matrices based on data quality factors and based on data utility factors are quantified, resulting in the quantified satisfaction evaluation matrices and as follows:
Among them, is the satisfaction evaluation matrix based on data quality factors, represents the evaluated value of the -th dimension indicator of the -th business data resource after quantification, and is the ideal evaluated value of the -th dimension indicator after quantification; is the satisfaction evaluation matrix based on data utility, represents the evaluated value of the -th dimension indicator of the -th business data resource after quantification, and is the ideal evaluated value of the -th dimension indicator after quantification.
Due to the different dimensions of indicators in the satisfaction evaluation system for data quality-utility factors, in order to achieve the highest satisfaction in comprehensive indicator evaluation, eliminates the dimensional impact by non-dimensionalizing the indicator values. At the same time, to eliminate the impact of inconsistent indicator types, the reverse indicator values are converted to positive indicator values. This study adopts the non-dimensionalization of positive indicators (data compressed within the range) and reverse indicators (data compressed within the range and the data direction reversed). The non-dimensional values of positive and reverse indicators are obtained through Equations (3) and (4), and then the maximum value is used as the standard for evaluating the quality-utility factors of the data.
Among them, represents the value of the -th dimension indicator of the -th object, represents the maximum value of the -th dimension indicator of the -th object, represents the minimum value of the -th dimension indicator of the -th object, and represents the non-dimensional value of the -th dimension indicator of the -th object. These non-dimensionalized indicator values range within , with values closer to 1 being more favorable.
Therefore, the non-dimensionalized satisfaction evaluation matrices and are as follows:
Among them, is the non-dimensionalized satisfaction evaluation matrix based on data quality factors, represents the non-dimensionalized evaluation value of the -th dimension indicator of the -th business data resource, and is the ideal non-dimensionalized evaluation value of the -th dimension indicator. is the non-dimensionalized satisfaction evaluation matrix based on data utility, represents the non-dimensionalized evaluation value of the -th dimension indicator of the -th business data resource, and is the ideal non-dimensionalized evaluation value of the -th dimension indicator. This is used to solve the multi-task optimization model based on data quality utility.
The quantitative evaluation indicators of business data resources have clear numerical values (such as missing rate, duplication rate, access volume, etc.) with large data sample dispersion and a high degree of data quantification. The entropy weight method can automatically determine the weight of each indicator based on actual changes in the data, making it suitable for datasets with a high degree of quantification. Therefore, this paper adopts the entropy weight method [30] to calculate the objective weights of the evaluation indicators involved in data quality and data utility factors. The objective weights of these evaluation indicators are assigned as shown in Algorithm 1.
| Algorithm 1: Entropy Weight-Based Weight Allocation Algorithm for Quantitative Indicators. | |
| Input | |
| Output | for each indicator |
| Step 1 | |
| Step 2 | Calculate the information entropy weight of each indicator using the entropy value formula, |
| Step 3 | Normalize the weights to determine the final weights. The normalization formula is |
| Step 4 | Perform-weighted summation of scores to calculate the result of |
The dataset of qualitative indicators for business data resources consists of clearly defined descriptive levels, such as user satisfaction and data security. Users select their experience with the data based on categories like “excellent, good, average, poor, very poor”, which have already been clearly structured into hierarchical levels. Therefore, this paper chooses to use the Analytic Hierarchy Process (AHP) [31] to calculate the subjective weights of the evaluation indicators involved in data quality and utility factors. The construction process is shown in Algorithm 2.
| Algorithm 2: Principal Component Analysis-Based Weight-Allocation Algorithm for Qualitative Indicators. | |
| Input | Qualitative indicator elements of or |
| Output | Indicator weights and objective evaluation results for each indicator. |
| Step 1 | Extract elements from the qualitative indicator columns in and and construct a judgment matrix. |
| Step 2 | Calculate the eigenvector of the judgment matrix , where the eigenvector represents the weights of the indicators. |
| Step 3 | Normalize the weights to determine the final weights, |
| Step 4 | Calculate the consistency index and the consistency ratio to check the consistency of the judgment matrix.Where ( is the order of the judgment matrix), and is the random consistency index. |
| Step 5 | If the consistency check is not passed, adjust the judgment matrix using pairwise comparisons and then repeat Steps 2 to 4 until the consistency check is passed. |
| Step 6 | Perform weighted summation of scores to calculate the result of |
To adapt to the dynamic environment of business data resource evaluation, especially when the data’s missing rate increases or user satisfaction decreases over a certain period, the evaluation of business data resources is updated accordingly. The process of updating the indicator weight is shown in Algorithm 3.
| Algorithm 3: Indicator Weight Update Algorithm. | |
| Input | . |
| Output | . |
| Step 1 | Judging trigger conditions for the data update cycle. |
| Step 1.1 | Set the data update cycle T = 24. |
| Step 1.2 | . |
| Step 2 | Start Algorithm 1. |
| Step 3 | Start Algorithm 2. |
| Step 4 | Complete the recalculation of the indicator weights. |
4.3. Construction of a Business Data Resource Evaluation Model Based on Data Quality Utility
On the basis of and , solving the problem of maximizing satisfaction with data quality-utility factors is essentially a multi-objective optimization problem. Therefore, this paper transforms into a multi-objective optimization model based on data quality-utility factors. From the perspective of data quality-utility factors, it constructs the corresponding objective functions for the multi-objective optimization model and solves the multi-objective optimization model using a linear weighting method. In summary, this study uses subjective and objective weights to reflect the importance of each indicator and constructs based on the satisfaction evaluation matrices and .
Subject. to.
Subject. to.
Among them, represents the maximization of satisfaction with the data quality evaluation of business data resources, represents the subjective weight of the -th dimension indicator of data quality obtained through the primary analytic hierarchy process, and represents the objective weight of the dimension indicator of business data resources calculated by the demand side using the entropy weight method. represents the maximization of satisfaction with the data utility evaluation, represents the subjective weight of the -th dimension indicator of data quality factors obtained by the demand side through the primary analytic hierarchy process, and represents the objective weight of the dimension indicator of data quality factors calculated by the demand side using the entropy weight method.
This paper transforms into a multi-objective optimization model based on data quality utility. Equations (5) and (6) are the objective functions of the multi-objective optimization model. Then, the linear weighting method is used to handle the above objective functions, forming a new objective function, and the optimal result is obtained by solving the new objective function:
Subject. to.
Among them, represents the weight based on data quality factor matching, and represents the weight based on data utility matching. The weight can be obtained by referring to the entropy weight method shown in Algorithm 1.
5. Business Data Resource Recommendation Algorithm Based on Collaborative Filtering
The value of data analysis in supporting business operations is crucial. IBM emphasizes that high-quality data can help enterprises make better business decisions, improve operational efficiency, and enhance customer satisfaction [32]. Furthermore, McKinsey highlights that as companies increasingly rely on complex data ecosystems, evaluating the quality, availability, and reliability of data is essential for gaining valuable business insights. They also stress that data transparency and centralized data procurement can optimize the use of data resources, prevent redundant purchases, and increase the utility value of the data [33]. Therefore, in specific use cases, the demand for business data resources is diverse, but business personnel generally focus on the quality and utility value of the data resources. Collaborative filtering-based recommendation algorithms require a large amount of historical user data to function, making the cold-start problem a significant obstacle in data resource recommendation research. As a result, this paper focuses on studying recommendation algorithms based on evaluations of data resource quality and utility, with an emphasis on scenarios that prioritize the matching and optimization of data quality and utility.
The recommendation algorithm is the core module of the business data resource optimization model for multi-value chain data spaces, and it is crucial for optimizing the matching of data resources. This paper designs a collaborative filtering algorithm based on data quality and another based on data utility. Additionally, it improves and designs a combined recommendation algorithm to address the issues of cold start and data sparsity. Finally, by comparing these three recommendation algorithms, this paper demonstrates the effectiveness of the proposed business data resource optimization technology for multi-value chain data spaces.
5.1. Collaborative Filtering Algorithm Based on Data Quality
The research on the Collaborative Filtering Algorithm Based on Data Quality (CFA-DQ) aims to recommend business data resources with higher data quality to business analysts. Through collaborative filtering based on data quality, analysts can identify data with high scores in completeness, accuracy, and consistency, ensuring that high-quality data are prioritized for recommendation.
In Section 4.2, a satisfaction evaluation matrix based on data quality factors was constructed, which can serve as input data for CFA-DQ. The construction process of CFA-DQ is as shown in Algorithm 4.
| Algorithm 4: Outlines the Main Steps of CFA-DQ. | |
| Input | |
| Output | High-quality data resource recommendation results in Top-N set |
| Step 1 | Preprocess the data quality satisfaction evaluation matrix for business data resources; extract the data quality evaluation indicators of business data resources: data quality, data integrity, data accuracy, data availability, and data consistency. |
| Step 2 | Generate the “similar neighbors set”: by calculating the similarity of each data quality indicator of all data attributes, form the “similar neighbors set”; that is, calculate the data quality similarity between the target data attribute and other data attributes in. This algorithm uses cosine similarity to calculate the data quality similarity of data attributes. 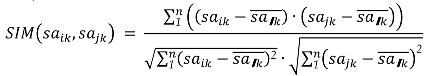 |
| Step 3 | Recommendation generation: Based on the generated “similar neighbors set”, recommend data attributes with highly similar data quality. Determine the accessible data attribute set from the columns of the “similar neighbors set” in the data quality satisfaction evaluation matrix . |
| Step 4 | Generating high-quality data resource recommendation results in Top-N set; select the top N ranked items that do not belong to the “similar neighbors set”. |
| Step 5 | Evaluate the accuracy of the recommendation results; calculate the Root Mean Square Error (RMSE) of the recommendation algorithm. |
The main issue with CFA-DQ is the cold-start problem. CFA-DQ calculates the quality similarity of data attributes to search for a “similar neighborhood set” of data quality, thereby recommending high-quality data. However, for data resources that have not yet been evaluated for data quality, this algorithm struggles to make ideal recommendations.
5.2. Collaborative Filtering Algorithm Based on Data
Recommending business data resources to business personnel from the perspective of data utility is a common scenario. This includes evaluations of user satisfaction, timeliness, and security of data resources, leading to better recommendation results. The research on the Collaborative Filtering Algorithm Based on Data Utility (CFA-DU) aims to recommend high-value business data resources to business personnel. The construction process of the data utility evaluation matrix is detailed in Section 4.2, and it can serve as input data for CFA-DU. The construction process of CFA-DU is as shown in Algorithm 5.
| Algorithm 5: The Main Steps of CFA-DU are Similar to Those of CFA-DQ. | |
| Input | |
| Output | High-utility value data resource recommendation results in Top-N set |
| Step 1 | Preprocess the data utility satisfaction evaluation matrix for business data resources; extract the data quality utility indicators of business data resources: data quality, maintenance cost, timeliness, access volume, user satisfaction, data security. |
| Step 2 | Generate the “similar neighbors set”; by calculating the similarity of each data utility evaluation indicator of all data attributes, form the “similar neighbors set”; that is, calculate the utility similarity between the target data attribute and other data attributes in . This algorithm uses cosine similarity to calculate the utility similarity of data attributes.
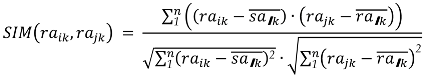 |
| Step 3 | Recommendation generation; based on the generated “similar neighbors set”, recommend data attributes with highly similar data utility. Determine the accessible data attribute set from the columns of the “similar neighbors set” in the data utility satisfaction evaluation matrix . |
| Step 4 | Generate high-utility data resource recommendation results in Top-N set; select the top N-ranked items that do not belong to the “similar neighbors set”. |
| Step 5 | Evaluate the accuracy of the recommendation results; calculate the Root Mean Square Error (RMSE) of the recommendation algorithm. |
Although CFA-DU uses historical usage performance indicators of data resources, to a certain extent, to address the cold-start problem and can filter and recommend individual utility indicator sets, the comprehensive utility evaluation of data is somewhat subjective, and the utility value is effective only in some similar datasets if the recommended data resources have low data.
5.3. Collaborative Filtering Recommendation Algorithm Based on Data Quality-Utility Combined Evaluation
Section 5.1 and Section 5.2, respectively, introduced collaborative filtering algorithms based on data quality and data utility. Each of these algorithms has its own advantages and disadvantages. To achieve better data resource recommendations, this paper proposes the Collaborative Filtering Recommendation Algorithm Combining Improved Data Quality and Utility (hereinafter referred to as CFA-DQU). CFA-DQU mainly includes constructing a business data resource evaluation matrix based on data quality and utility, calculating the similarity of data quality and utility, generating a “similar neighbor set” based on data quality and utility, and generating a recommendation set based on data quality and utility.
The design idea of the combined improvement algorithm is to comprehensively consider the evaluation of business data resources in terms of data quality and utility, construct a data quality-utility evaluation matrix, and build a collaborative filtering algorithm based on this to generate recommendation results. The following details are the construction algorithm of the business data resource evaluation matrix based on data quality and utility.
One of the core tasks of CFA-DQU is to solve datasets with similar data attribute qualities and utilities based on the evaluation matrix with the highest satisfaction of data quality-utility factors, thereby generating recommendations. Section 4.3 defines the business data resource evaluation score matrix based on data quality and utility. The flowchart of the business data resource evaluation algorithm based on data quality and utility is shown Figure 3.
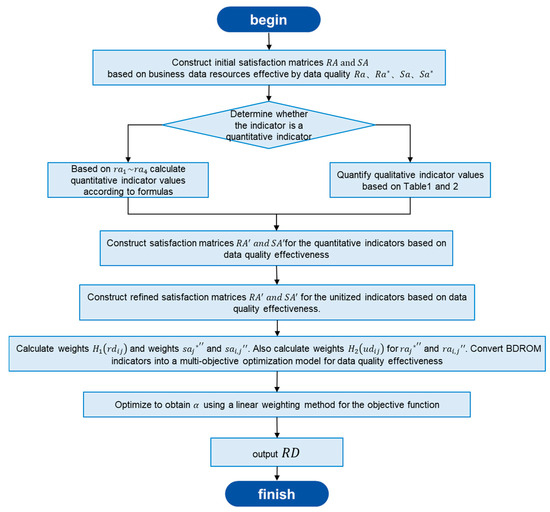
Figure 3.
Business data resource evaluation algorithm process based on data quality utility.
The business data resource evaluation process based on data quality and utility is shown in Algorithm 6.
| Algorithm 6: The Business Data Resource Evaluation Algorithm Based on Data Quality and Utility. | |
| Input | |
| Output | . |
| Step 1 | Construct the initial satisfaction matrix based on data utility quality. |
| Step 2 | If the nature of the indicator is quantitative, then quantify the quantitative indicator values according to the calculation formulas or else quantify the qualitative indicator values according to formulas (1) and (2); construct the satisfaction matrices after quantifying the data quality-utility factor indicators. |
| Step 3 | Using Equations (3) and (4) to non-dimensionalize the satisfaction matrix; construct the satisfaction matrices based on the quantification of data quality-utility factor indicators. |
| Step 4 | Using Equations (5) and (6), calculate the weights of and ; similarly, calculate the weights of ,. Transform BDROM into a multi-task optimization model based on data quality-utility factors. |
| Step 5 | Use the entropy weight method to obtain and form a new objective function, Equation (8), using the linear weighting method. |
| Step 6 | Solve the new objective function to complete the value assessment of business data resources and output the evaluation results RD for business data resources. |
At this point, the business data resource evaluation matrix based on data quality and utility is:
Using the business data resource evaluation matrix based on data quality and utility as data input, design the CFA-DQU.
The main steps of CFA-DQU are similar to those of Algorithm 5, as shown in Algorithm 7 below:
| Algorithm 7: Outlines the Main Steps of CFA-DQU. | |
| Input | |
| Output | High-quality and high-utility value data resource recommendation results in Top-N set. |
| Step 1 | Preprocess the business data resources to form the data quality-utility evaluation matrix; : extract the data quality-utility indicators of business data resources. |
| Step 2 | Generate a “similar neighbor set”; form the “similar neighbor set” by calculating the similarity of each data quality-utility evaluation indicator for all data attributes; that is, calculate the data quality-utility similarity between the target data attribute and other data attributes in . This algorithm uses cosine similarity to calculate the utility similarity of data attributes: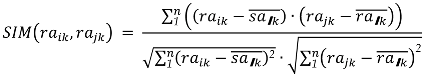 |
| Step 3 | Recommendation generation; based on the generated “similar neighbor set”, recommend data attributes with highly similar data quality utility. Determine the accessible data attribute set of the “similar neighbor set” from the columns in the data quality-utility satisfaction evaluation matrix RD. |
| Step 4 | Generate high-quality, high-utility data resource recommendation results in Top-N set; select the top N results that are ranked highest but do not belong to the “similar neighbor set”. |
| Step 5 | Evaluate the accuracy of the recommendation results; calculate the Root Mean Square Error (RMSE) of the recommendation algorithm. |
6. Experimental Calculations and Technical Validation
6.1. Dataset and Experimental Setup Description
The dataset for technical validation in this paper is sourced from the Value Chain Collaborative Cloud Platform [34]. It includes 22 business data entities from supply value chain, marketing value chain, parts (operation and maintenance) value chain, and after-sales service value chain, totaling 3486 data attributes. A single business data entity contains up to 397,962 rows of data. The dataset mainly includes records on data quality, user satisfaction, security, and access volume. Sample data are shown in Table 4 below:
Table 4.
Sample data content of dataset.
Since the multi-value chain data space provides basic preprocessing of business data, this paper focuses on the evaluation of data quality and data utility. The preprocessing is conducted directly according to the calculation instructions for each metric, yielding indicators such as the number of data rows, missing values, out-of-range data, data retrieval counts, data retrieval failure counts, and data inconsistencies, which are used to assess data quality and utility. The computer configuration used for the experiments includes cloud computing resources with a 3.1 GHz processor, 64 GB of memory, and 24 GB of video memory.
In order to directly validate the data resource optimization techniques proposed in this paper, the dataset was preprocessed according to the following steps. Figure 4 illustrates the process of duplicating and joining several data attribute tables of business data resources, constructing the dataset through data integration. The specific construction process is shown in Algorithm 8.
| Algorithm 8: The Process of Integrating Datasets | |
| Step 1 | Identify the data source . |
| Step 2 | Analyze the data schema of the data source and define the data model and partial mapping, . |
| Step 3 | Based on the partial data mapping, construct the semantic model,. |
| Step 4 | Perform the copy operation on the attributes of and create a full backup of the extracted attribute data. |
| Step 5 | Use the connect operation to join the similar attributes of, forming a data entity attribute set . |
| Step 6 | Aggregate the data entity attribute set to construct the data entity set D. |
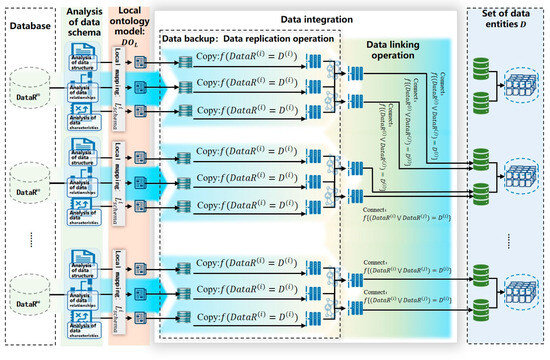
Figure 4.
Data preprocessing process based on data integration.
6.2. Business Data Resource Evaluation Calculation
Based on the business data resource evaluation model of data quality and utility, we evaluate the data quality, data utility, and the combination of data quality and utility of business data resources. This provides dimensional support for the construction and research of business data resource recommendation algorithm models.
6.2.1. Data Quality Evaluation Calculation
(1) Preprocess the dataset
First, preprocess the dataset by tallying the missing values, data duplication, and data calls for each business data entity. According to the indicator calculation rules, quantitatively calculate the data quality score. The highest score for each item is taken as the ideal value, converting the data quality score into a satisfaction evaluation matrix based on data quality factors. Finally, dimensionless processing is performed to obtain a dimensionless satisfaction evaluation matrix of data quality factors.
According to the data quality evaluation indicators of business data resources in Table 1, calculate the data integrity, accuracy, availability, and consistency of the dataset and its preprocessing results for business data resources. The calculation results are shown in Table 5.
Table 5.
Calculation results of data quality evaluation.
(2) Data Quality Satisfaction Evaluation Matrix
According to the calculation rules of data quality indicators, compute the data integrity, accuracy, availability, and consistency to obtain the data quality satisfaction evaluation matrix. The last row of the matrix represents the ideal values for data integrity, accuracy, availability, and consistency, with the ideal values being the maximum values of each indicator.
Based on Formulas (3) and (4), perform dimensionless calculations to obtain the dimensionless data quality satisfaction evaluation matrix.
(3) Data Quality Indicator Weight Calculation
Since the data quality evaluation indicators are all quantitative, the entropy weight method can be used to calculate the weights of the indicators.
Based on the data quality satisfaction evaluation matrix, standardize the indicator data using the following formula:
Here, represents the standardized data, represents the raw evaluation data of the -th row and -th column, and represents the sample size of the dataset.
Use the entropy formula to calculate the information entropy weight of each indicator. The calculation formula is as follows:
Here, represents the information entropy weight of the -th indicator.
Normalize the weights according to the column distribution of the data quality satisfaction evaluation matrix. The formula for calculating the normalized weights is as follows:
Through the sequential calculations of Formulas (10)–(12), the weights of the data quality evaluation indicators are obtained as follows:
(4) Business Data Resource Quality Evaluation Results
Perform a weighted sum of the dimensionless satisfaction evaluation scores of the business data resources to obtain the data quality evaluation results, as follows:
Here, represents the data quality evaluation score matrix.
Substitute the dataset into the above formulas to calculate the data quality scores of the business data resources. The data quality evaluation result of each business data entity is the average of its attributes, as shown in Table 6.
Table 6.
Data quality evaluation results of business data resources.
The highest data quality score for business data entity attributes is 1, the lowest score is 0.068, and the average score is 0.747; the highest data quality score for business data entities is 1, the lowest score is 0.140, and the average score is 0.803. Business data resources are expressed through business data entities and their attributes. The distribution of data quality evaluation scores for business data resources is shown in the form of a heatmap, as illustrated in Figure 5.
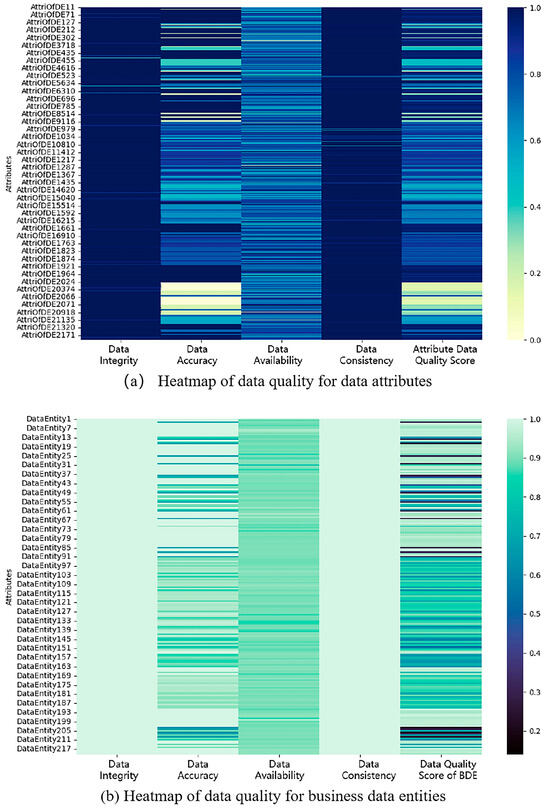
Figure 5.
Distribution of data quality for business data resources. e.g., (a) Heatmap of data quality for data attributes. (b) Heatmap of data quality for business data entities.
6.2.2. Data Utility Evaluation Calculation
(1) Data Utility Evaluation Calculation Score
According to the data utility evaluation indicators of business data resources in Table 2, calculate the data quality, maintenance cost, timeliness, and access volume for quantitative indicators, as well as user satisfaction and data security for qualitative indicators of the dataset and its preprocessing results, to obtain the evaluation results of data utility for business data resources. Quantitative indicators can be directly calculated based on the records of the dataset; qualitative indicators, such as user satisfaction and data security, need to be calculated according to Formulas (1) and (2). Table 7 shows the data utility evaluation results of some business data resources.
Table 7.
Calculation results of data utility evaluation.
(2) Satisfaction Evaluation Matrix of Data Utility
According to the calculation rules of data utility indicators, quantitative indicators such as data quality, maintenance cost, timeliness, and access volume, as well as qualitative indicators such as user satisfaction and data security, are calculated. Based on the results of data utility evaluation calculations, the satisfaction evaluation matrix of data utility can be directly obtained.
Dimensionless calculations are performed based on Formulas (3) and (4), resulting in the dimensionless satisfaction evaluation matrix of data utility.
(3) Calculation of Indicator Weights for Data Utility
Since the evaluation indicators of data utility include both quantitative and qualitative indicators, two algorithms are used for their weight calculations. This section will calculate the indicator weights for data utility based on the weight distribution algorithms for quantitative and qualitative indicators in Section 4.2 (Algorithms 1 and 2):
(4) Evaluation Results of Data Utility for Business Data Resources
The dimensionless scores from the satisfaction evaluation of data utility for business data resources are weighted and summarized to obtain the evaluation results of data utility, which are:
where is the evaluation score matrix of data quality.
Substituting the dataset into the above formulas for calculation, the data utility scores of business data resources are obtained. The evaluation results of data utility for business data entities are the mean values of their attributes. The evaluation results are shown in Table 8.
Table 8.
Evaluation results of data utility of business data resources.
The highest data utility score for the attributes of business data entities is 0.663, the lowest score is 0.041, and the average score is 0.219. The highest data utility score for business data entities is 0.581, the lowest score is 0.093, and the average score is 0.177. To visualize the evaluation scores of data utility, a heatmap is used to present the evaluation scores of some business data resources, as shown in Figure 6.
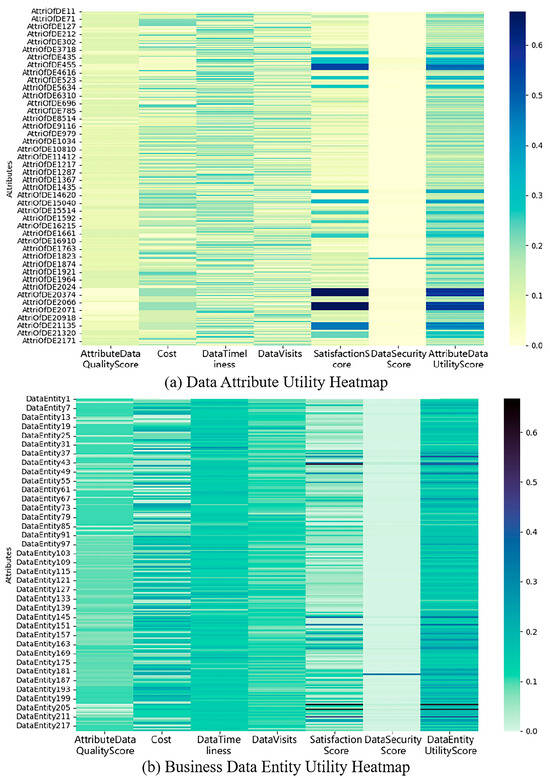
Figure 6.
Data Quality-Utility Evaluation Calculation. e.g., (a) Data Attributes Utility Heatmap. (b) Business Data Entity Utility Heatmap.
6.2.3. Data Quality-Utility Evaluation Calculation
According to Algorithm 4, the data quality-utility indicators for business data resources are calculated, while the values of and in Equation (5) and the values of and in Equation (6) are obtained. Further, the weight of in Equation (7) is determined based on the entropy weight method. Therefore, the evaluation results of business data resources based on data quality-utility evaluation can be expressed as:
By substituting the dataset and combining Equations , (6), and the data quality-utility evaluation result matrix for business data resources is calculated.
6.3. Evaluation and Analysis of Algorithm Recommendation Accuracy
Section 5 introduces three algorithms (CFA-DQ, CFA-DU, and CFA-DQU) to recommend business data resources, each capable of generating a Top-N recommendation list. To demonstrate the accuracy of these recommendation algorithms, we designed 10 scenarios to compare the recommendation accuracy of the three algorithms. These 10 scenarios correspond to different values of “similar neighbor set” size K, specifically set at 5, 8, 11, 14, 17, 20, 23, 26, 29, and 32. The recommendation accuracy is assessed by comparing the root mean square error (RMSE) values in each scenario.
RMSE is calculated based on the error between the predicted and actual quality/utility values of recommended data resources, with a lower RMSE indicating higher recommendation accuracy.
The RMSE calculation formula is as follows:
where is the number of data items, is the actual quality-utility value of the -th data item, and is the predicted quality-utility value of the -th data item.
6.3.1. Experimental Comparison Results
The RMSE of CFA-DQ, CFA-DU, and CFA-DQU under different similar neighbor set values are shown in Table 9.
Table 9.
RMSE calculation results of three algorithms.
The changes in RMSE are also presented in bar and line charts, as shown in Figure 7.
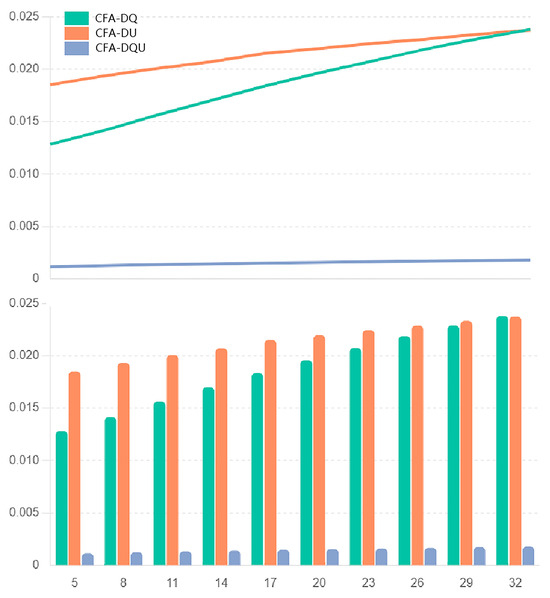
Figure 7.
RMSE trend chart of three algorithms.
6.3.2. Experimental Comparative Analysis
Experimental results indicate that when the similar neighbor set size is 5, the RMSE of CFA-DQU is the lowest (0.001132), followed by CFA-DQ (0.012835) and CFA-DU with the highest RMSE (0.018532). A comparison of the RMSE values for CFA-DQ, CFA-DU, and CFA-DQU across various similar neighbor set sizes (K = 5, 8, 11, 14, 17, 20, 23, 26, 29, and 32) demonstrates that CFA-DQU consistently achieves the highest recommendation accuracy and optimal recommendation performance. Although CFA-DQ is slightly less accurate than CFA-DQU, it still outperforms the CFA-DU algorithm. Further analysis led to the following conclusions:
First, the CFA-DQU algorithm has the lowest RMSE value and the highest recommendation accuracy for all similar neighbor set values.
Second, as the value of “similar neighbor sets” K increases, the RMSE values of the three algorithms rise, indicating that the recommendation accuracy decreases as the number of similar neighbor sets increases.
Third, the RMSE value of CFA-DQU increases the least, indicating that it has better stability when the number of similar neighbor sets increases.
Fourth, the line chart shows that the RMSE value curve of CFA-DQU is relatively flat, indicating that its performance is more stable under different similar neighbor set values, while the RMSE value curves of CFA-DQ and CFA-DU are steeper, indicating that their recommendation accuracy is more affected by the number of similar neighbor sets.
6.4. Performance Analysis of Different Recommendation Algorithms
(1) Design and Calculation of Performance Metrics for Recommendation Algorithms
To analyze the stability and scalability of the recommendation algorithms, we introduce metrics such as precision, recall, and H-mean to evaluate their performance. The corresponding calculation formulas are as follows:
① Precision
② Recall
③ H-mean
In the formulas, represents true positives, where positive cases are correctly predicted as positive; represents true negatives, where negative cases are correctly predicted as negative; represents false positives, where negative cases are incorrectly predicted as positive (false alarms); and represents false negatives, where positive cases are incorrectly predicted as negative (misses). The larger the , the better the corresponding performance.
The experimentally calculated values of performance metrics such as precision, recall, and H-mean for CFA-DQ, CFA-DU, and CFA-DQU under different values of the similar neighbor set are shown in Table 10.
Table 10.
Performance metric results for the three algorithms.
(2) Analysis of the Adaptability and Stability of Recommendation Algorithms
This paper assesses the stability and adaptability of the algorithms by calculating the standard deviation and mean values of their performance metrics.
① Adaptability
The adaptability of the algorithm is evaluated using the average values of precision, recall, and H-mean from multiple experimental runs. A higher average indicates better performance across different values of the similar neighbor set, reflecting stronger adaptability. High adaptability means that the algorithm can handle varied datasets more effectively, making it suitable for dynamic or unknown types of datasets.
In the formula, is the value from the -th experiment.
② Stability
We assess the stability of the algorithm by calculating the standard deviation of each performance metric (precision, recall, and H-mean) across multiple experiments. A smaller standard deviation indicates better stability. If one algorithm’s stability metric (standard deviation) is significantly lower than that of another, it suggests that this algorithm may be better suited to the same dataset.
where is the mean and is the value of the -th experiment.
Using the experimental evaluation metrics designed above, we calculate the standard deviation and mean values of all metrics (precision, recall, and H-mean) for each of the three algorithms to reflect each algorithm’s adaptability and stability, as shown in Table 11.
Table 11.
Evaluation of the adaptability and stability of three recommendation algorithms.
Under different values of the similar neighbor set, combinations of data quality, data utility, and data quality-utility formed distinct business data resource usage scenarios. The adaptability and stability performance of the three algorithms in different scenarios are as follows:
Adaptability Analysis of the Algorithms: CFA-DU performs relatively evenly across precision, recall, and H-mean, particularly outperforming the other two algorithms in recall and H-mean, indicating stronger adaptability and the best recommendation performance in scenarios focused on data utility. CFA-DQ performs strongest in Precision but has relatively lower recall and H-mean, indicating slightly weaker adaptability. CFA-DQU’s performance falls between the two, suggesting that CFA-DQU better balances recommendations focused on both data quality and utility across different scenarios.
Stability Analysis of the Algorithms: CFA-DU has the smallest standard deviation across all metrics, demonstrating extremely high stability. This indicates that, in different scenarios, the recommendation performance focused on data utility is more stable. CFA-DQ shows higher stability in precision but has greater fluctuations in recall and H-mean, resulting in overall weaker stability. CFA-DQU exhibits moderate stability but is still more stable than CFA-DQ. This suggests that CFA-DQU, while balancing recommendations focused on data quality-utility across different scenarios, also achieves relatively good algorithm stability.
7. Conclusions
The rapid and accurate selection of business data resources is the most time-consuming stage in the preprocessing phase of business analysis. It often requires multiple rounds of data retrieval for exploratory analysis to meet the data requirements for business analysis. Additionally, there are common issues of data sparsity and cold start in the evaluation and recommendation of business data resources.
Therefore, this paper addresses data quality and data utility evaluation by constructing an evaluation indicator system, resulting in an evaluation matrix for business data resources, thus solving the problems of data sparsity and cold start. Furthermore, using a collaborative filtering-based algorithm for business data resources, similar data quality-utility resources are formed into a recommendation set, provided to data analysis users.
Finally, through experimental calculations, evaluation results and recommendation results for business data resources and their attributes were obtained. Additionally, a comparison of three recommendation algorithms demonstrated the excellent performance of the combined improved collaborative filtering recommendation algorithm for data quality utility, leading to conclusions and recommendations. Additionally, this paper demonstrates the good scalability of the algorithms by calculating the adaptability and stability of the three algorithms across different scenarios.
In the face of fragmented and uncertain business demands, digital transformation has been regarded as a strategic imperative for enterprise development. Optimizing the supply of business data resources is a critical research topic for building data-driven organizations. Business data resources serve as the informational medium for business collaboration. The business data resource optimization framework proposed in this paper, based on a multi-value chain data space, provides enterprise data consumers with data resources that meet their business analysis needs. Moreover, this framework has been technically validated in business domains such as the supply chain, marketing value chain, parts (operations and maintenance) value chain, and after-sales service value chain in the automotive manufacturing industry. Therefore, this framework is adaptable to various value chain business collaboration scenarios within the discrete manufacturing industry. In the next step, we will focus on the study of business data resource models, aiming to solve the problem of synchronizing business data resource evaluation and recommendation in a dynamic data update environment.
Author Contributions
Conceptualization, B.F. and L.S.; methodology, B.F.; software, L.S.; validation, L.S.; formal analysis, D.T.; investigation, M.P.; resources, D.T.; data curation, L.S.; writing—original draft preparation, B.F.; writing—review and editing, B.F.; visualization, M.P.; supervision, B.F.; project administration, D.T.; funding acquisition, M.P. All authors have read and agreed to the published version of the manuscript.
Funding
The research in this paper has been supported by the National Key R&D Plan, China (No. 2023YFB3308600).
Data Availability Statement
The datasets used and analyzed during the current study are available from the corresponding author on reasonable request.
Acknowledgments
We would like to thank the National Key R&D Program of China for its strong support for this research.
Conflicts of Interest
Author Dong Tan and Meng Pan was employed by the company Chengdu Aerospace Science and Industry Big Data Institute Ltd., CASIC The remaining authors declare that the research was conducted in the absence of any commercial or financial relationships that could be construed as a potential conflict of interest.
References
- Grover, V.; Chiang, R.H.; Liang, T.P.; Zhang, D. Creating strategic business value from big data analytics: A research framework. J. Manag. Inf. Syst. 2018, 35, 388–423. [Google Scholar] [CrossRef]
- Chapman, P.; Clinton, J.; Kerber, R.; Khabaza, T.; Reinartz, T.; Shearer, C.; Wirth, R. CRISP-DM 1.0: Step-by-Step Data Mining Guide; SPSS Inc.: Chicago, IL, USA, 2000. [Google Scholar]
- Jiang, W.; Wu, X.; Zhuravkov, M.A.; Xue, Z.; Wang, J. A comprehensive review of theories, methods, and techniques for bottleneck identification and management in manufacturing systems. Appl. Sci. 2024, 14, 7712. [Google Scholar] [CrossRef]
- Raj, R.; Kumar, V.; Shah, B. Big data analytics adaptive prospects in sustainable manufacturing supply chain. Benchmarking Int. J. 2024, 31, 3373–3397. [Google Scholar] [CrossRef]
- Faroukhi, A.Z.; El Alaoui, I.; Gahi, Y.; Amine, A. An Adaptable Big Data Value Chain Framework for End-to-End Big Data Monetization. Big Data Cogn. Comput. 2020, 4, 34. [Google Scholar] [CrossRef]
- Peng, S.; Tian, Z.; Siqin, Z.; Xu, X. Construction of data quality evaluation index for manufacturing multi-value chain collaborative data space based on the whole life cycle of data. In Proceedings of the 2021 IEEE 7th International Conference on Cloud Computing and Intelligent Systems (CCIS), Virtual, 7–8 November 2021; IEEE: Piscataway, NJ, USA, 2021; pp. 315–323. [Google Scholar]
- Yu, Y.; Sun, L.; Wang, S. Multi-party dynamic data integration scheme of industrial chain collaboration platform in mobile computing environment. Wirel. Commun. Mob. Comput. 2022, 2022, 1550668. [Google Scholar]
- Sadiq, S.; Indulska, M.; Brohman, K. A framework for data quality management in emerging digital ecosystems. Inf. Syst. 2019, 84, 101–120. [Google Scholar]
- Zhang, X.; Chen, Y.; Li, D. Evaluating data quality in collaborative information systems: A comprehensive framework and metrics. Int. J. Inf. Manag. 2020, 52, 102–115. [Google Scholar]
- Roy, D.; Dutta, M. A systematic review and research perspective on recommender systems. J. Big Data 2022, 9, 59. [Google Scholar] [CrossRef]
- Adomavicius, G.; Tuzhilin, A. Toward the next generation of recommender systems: A survey of the state-of-the-art and possible extensions. IEEE Trans. Knowl. Data Eng. 2005, 17, 734–749. [Google Scholar] [CrossRef]
- Fricker, S.A.; Maksimov, Y.V. Pricing of data products in data marketplaces. In Proceedings of the Software Business: 8th International Conference, ICSOB 2017, Essen, Germany, 12–13 June 2017; pp. 49–66. [Google Scholar]
- Xiao, Y.; Gu, Y.; Wang, J.; Wu, T. A collaborative multi-modality selection method based on data utility assessment. In Proceedings of the 2019 IEEE SmartWorld, Ubiquitous Intelligence & Computing, Advanced & Trusted Computing, Scalable Computing & Communications, Cloud & Big Data Computing, Internet of People and Smart City Innovation (SmartWorld/SCALCOM/UIC/ATC/CBDCom/IOP/SCI), Leicester, UK, 19–23 August 2019; IEEE: Piscataway, NJ, USA, 2019; pp. 454–459. [Google Scholar]
- Wang, S.; Sun, L.; Zou, Y. Recommendation algorithm of business resources for multi-service value chain. Comput. Integr. Manuf. Syst. 2023, 29, 2397–2410. [Google Scholar]
- Yu, Y.; Sun, L.F.; Ren, C.H.; Han, M. Bilater matching model of business resources for multi-service value chain. Comput. Integr. Manuf. Syst. 2021, 27, 1397–1409. [Google Scholar]
- Chen, H.; Chiang, R.H.; Storey, V.C. Business intelligence and analytics: From big data to big impact. MIS Q. 2021, 45, 144–155. [Google Scholar] [CrossRef]
- Liu, Y.; Zhang, Y. Data-driven analytics and predictive modeling in finance: A critical review. J. Financ. Data Sci. 2020, 2, 11–28. [Google Scholar]
- Kraus, S.; Palmer, C.; Kailer, N.; Kallinger, F.L.; Spitzer, J. Digital entrepreneurship: A research agenda on new business models for the twenty-first century. Int. J. Entrep. Behav. Res. 2018, 24, 350–375. [Google Scholar] [CrossRef]
- Wang, S.; Wan, J.; Zhang, D.; Li, D.; Zhang, C. Towards smart factory for industry 4.0: A self-organized multi-agent system with big data-based feedback and coordination. Comput. Netw. 2019, 101, 158–168. [Google Scholar] [CrossRef]
- Janssen, M.; Van Der Voort, H.; Wahyudi, A. Factors influencing big data decision-making quality. J. Bus. Res. 2017, 70, 338–345. [Google Scholar] [CrossRef]
- Bevilacqua, M.; Ciarapica, F.E. Human factor risk management in the process industry: A case study. Reliab. Eng. Syst. Saf. 2018, 169, 149–159. [Google Scholar] [CrossRef]
- Sun, Z.; Wang, H.; Feng, X. Big data preprocessing technology for machine learning. J. Data Inf. Sci. 2019, 4, 20–37. [Google Scholar]
- Huang, S.; Han, J.; Liu, H. The role of data quality in machine learning applications. Data Sci. J. 2020, 19, 5–14. [Google Scholar]
- Wang, R.Y.; Strong, D.M. Beyond Accuracy: What Data Quality Means to Data Consumers. J. Manag. Inf. Syst. 2020, 36, 5–33. [Google Scholar] [CrossRef]
- Pipino, L.L.; Lee, Y.W.; Wang, R.Y. Data Quality Assessment. Commun. ACM 2019, 45, 211–218. [Google Scholar] [CrossRef]
- Batini, C.; Scannapieco, M. Data Quality: Concepts, Methodologies and Techniques. Data Knowl. Eng. 2020, 121, 1–15. [Google Scholar]
- Ge, M.; Helfert, M. A Framework for Data Quality Management in Business Intelligence and Analytics. Inf. Syst. 2021, 52, 246–256. [Google Scholar]
- Oliveira, P.; Rodrigues, F.; Henriques, P.R. Towards a User-Oriented Data Quality Model. J. Data Inf. Qual. 2020, 12, 1–33. [Google Scholar]
- Olson, A. Data as a Service: Are We in the Clouds? J. Map Geogr. Libr. 2010, 6, 76–78. [Google Scholar] [CrossRef]
- Wang, X.; Wang, H.; Zheng, J. Can Entropy Weight Method Correctly Reflect the Distinction of Water Quality Assessment? J. Environ. Manag. 2016, 180, 459–466. [Google Scholar]
- Wang, Z.; Zhang, Z.; Zhang, H. Principal Component Analysis and Related Methods for Investigating the Dynamics of Biological Macromolecules. J. Mol. Sci. 2020, 5, 298–317. [Google Scholar]
- Chatterjee, S.; Chaudhuri, R.; Kamble, S.; Gupta, S.; Sivarajah, U. Adoption of artificial intelligence and cutting-edge technologies for production system sustainability: A moderator-mediation analysis. Inf. Syst. Front. 2022, 24, 976–995. [Google Scholar] [CrossRef]
- Duan, Y.; Cao, G.; Edwards, J.S. Understanding the impact of business analytics on innovation. Eur. J. Oper. Res. 2020, 281, 673–686. [Google Scholar] [CrossRef]
- Southwest Jiaotong University; Chengdu Guolong Information Engineering Co., Ltd.; University of Electronic Science and Technology of China; China Association of Automobile Manufacturers. ASP/SaaS-Based Collaborative Platform for Manufacturing Industry Value Chain [OL]. Available online: http://www.autosaas.cn/ (accessed on 25 July 2024).
Disclaimer/Publisher’s Note: The statements, opinions and data contained in all publications are solely those of the individual author(s) and contributor(s) and not of MDPI and/or the editor(s). MDPI and/or the editor(s) disclaim responsibility for any injury to people or property resulting from any ideas, methods, instructions or products referred to in the content. |
© 2024 by the authors. Licensee MDPI, Basel, Switzerland. This article is an open access article distributed under the terms and conditions of the Creative Commons Attribution (CC BY) license (https://creativecommons.org/licenses/by/4.0/).