Abstract
Automatic and blind parameter estimation based on the inherent features of wireless signals is a major research area due to the fact that these techniques lead to the simplification of receivers, especially in terms of coarse synchronization, and more importantly reduce the signaling load at the control channels. Thus, in the literature, many techniques are proposed to estimate a vast set of parameters including modulation types and orders, data and chip rates, phase and frequency offsets, and so on. In this paper, a cyclostationary feature detection (CFD) based method is proposed to estimate the carrier numbers and carrier spacing of carrier-aggregated direct sequence spread spectrum (DSSS) cellular signals blindly. The particular chip rate of the signal is also estimated through the process jointly. The proposed CFD-based method unearths the inhered and hidden second-order periodicities of carrier-aggregated DSSS signals, particularly targeting repeated pseudorandom noise sequences of users over the carriers. Throughout the paper, after the proposed method is formulated, the measurement setup that is developed to collect the data for the validation of the method is introduced. The measurement results are post-processed for performance analysis purposes. To that end, the method is investigated in terms of signal-to-noise ratio (SNR) values, different channel conditions, and measurement durations. Furthermore, the performance of the proposed method is compared with that of energy detection. The measurement results indicate superior performance of the proposed method under significant wireless channel impairments and in low-SNR regions, e.g., for 0 dB the proposed method provides more than detection performance for the case of false alarm rate, while the performance of ED is under the same wireless channel impairments. The raw outputs of the method can be utilized to train a convolutional neural network to eliminate the statistical estimation process in future work.
1. Introduction
Through the time that every generation of wireless technologies is deployed, their penetration to all other sectors or domains also increases and more complex communications topology and scenarios emerge; human-to-human communications evolve machine-to-machine communications swiftly. To be able to support the diverse communications requirements of the age, wireless networks strive to become more adaptive, seamless, effective, robust, and intelligent. One of the main overheads and resource-consuming aspects of traditional wireless communications is the signaling overheads which make sure that the right information is shared with the right point [1]. Such overhead can be reduced significantly if intelligent receivers are able to estimate the existence of the user in the spectrum along with its signaling parameters blindly. Therefore, blind transmission parameter estimation is a critical component of modern wireless communication systems. To this end, extensive work has been conducted in the cognitive radio (CR) domain and spectrum sensing research, techniques based on energy detection (ED), match filtering, and cyclostationary feature detection (CFD) were developed [2].
One of the prominent means of accessing the wireless spectrum is through direct sequence spread spectrum (DSSS) access and when the works on parameter estimation of DSSS signals are considered, CFD becomes the prominent feature. Thus, second-order cyclostationary statistics are utilized to jointly estimate the phase, amplitude, and time delay of each uplink direct sequence code division multiple access (DS-CDMA) signals in a multi-user access setting based on minimum mean square error (MMSE) estimates of the parameters in one of the initial works [1]. Chip rate and carrier frequency estimation is achieved by utilizing adaptive transform domain filters for phase shift keyed DSSS signals in [3]. The proposed approach works on a single carrier setting and provides harmonic continuous wave and narrowband interference rejection. Air interface recognition via CFD is proposed for wireless cellular signals of single carrier time division multiple access (TDMA), orthogonal frequency division multiple access (OFDM), and single carrier code division multiple access (CDMA) signals in [4]. The simulation results based on binary hypothesis testing indicate successful separation (i.e., probability of detection above ) of air interfaces around 7 dB of the signal-to-noise ratio (SNR) for the probability of false alarm of . A time-domain blind phase, amplitude, and time delay estimation algorithm based on CFD is proposed for CDMA signals in [5]. Then, a detailed analysis of cyclostationarity for recognition of CDMA signals is provided in [6]. In this work, an explicit derivation of cyclic auto-correlation function (CAF) is provided first, then it is mathematically shown that as the number of multiplexing codes increases, cyclostationarity based on chip rate decreases. It is also revealed that the utilization of scrambling codes significantly deteriorates the cyclostationarity. Finally, simulation results illustrated that considering antenna diversity and including multiple adjacent channel CDMA signals in the decision process improves the detection probability.
CR is a technology that provides intelligence to wireless communications networks. With many other features of CR, the deployment of secondary users (SU) along with primary users (PU) in the wireless spectrum leads to the efficient utilization of resources in a dynamic manner. In this context, CFD is a spectrum sensing feature that benefits from the cyclic features of occupant signals and CFD is proposed to sense PU through multiple cyclic properties of symbol rate, the coding and modulation schemes, guard periods in [7]. A generalized likelihood ratio test (GLRT) is proposed for the detection of periodic statistical properties. The simulation results illustrate 1 dB detection gain per additional cycle frequency. Furthermore, the study considers a collaborative detection scheme with an improved probability of detection. In the same context, autocorrelative properties of pseudorandom noise (PN) sequences for DSSS signal detection are utilized in [8]. A time domain hypothesis test is proposed to achieve the decision. Simulation results indicate successful detection in the low-SNR regime for additive white Gaussian noise () channels. a comparative analysis of the performance of CFD for the separation of different wireless signals is provided, i.e., ultra-wideband (UWB), OFDM, and CDMA in [9]. Extensive simulation results indicate strong detection performance when compared to other signals for CDMA, mainly due to the significant cyclic property of the spreading sequences. For the given probability of false alarm of , CDMA signals have 5 dB performance improvement against OFDM and 10 dB against UWB for the same probability of detection. Thus, CDF emerges as an advantageous technique for the particular estimation of the parameters of DSSS signals.
As the multi-carrier systems emerged with the 3rd generation cellular systems, the detection of the number of carriers became an important issue in terms of coarse synchronization. Blind estimation of the number of sub-carriers of multi-carrier CDMA signals is proposed based on high-order cumulants in [10]. Raw experimental results led to successful carrier number estimation for MC-DS-CDMA and MC-CDMA signals for 5 db SNR. Carrier frequency and symbol rate estimation via CDF for single carrier multiple phase shift keying (MPSK) signals is proposed in [11]. Cyclic spectrum is constructed based on MPSK characteristics and normalized mean square error (NMSE) estimations indicate accurate estimation of the parameters under AWGN channel conditions. Cycle frequency domain profile (CDP) of single carrier analog and digital wireless modulations are fed to the Hidden Markov Model (HMM) for signal classification in [12]. Again under channel conditions, the proposed classifier managed to distinguish SSB-SC-AM, BPSK, b-FSK, MSK, and QPSK modulations in low-SNR regimes. As an application of an online unsupervised learning machine (LEAP), principal component analysis (PCA) of a general DSSS sequence is utilized for PN sequence estimation in [13]. The proposed LEAP technique is modified for PN sequence estimation in such a way that state transition matrices are normalized before their utilization. Furthermore, instead of fixed learning states, adaptive ones are implemented. The simulation results indicate a high probability of correct estimation increasing with a number of iterations for the network convergence. Also, an algorithm depending on turbo processing is proposed for the estimation of PN sequence and data bits of DSSS signals in [14]. The proposed method has better estimation performance when compared to eigenvalue decomposition (EVD) based methods. The turbo processing algorithm is designed to achieve the estimations of these parameters blindly, which is an important requirement of advanced wireless communications systems.
Wireless signal estimation and detection theory has flourished under the spectrum sensing methodology of CR systems. Three main spectrum sensing methods, which are aforementioned in the first paragraph, have comparative advantages against each other; while match filtering provides theoretically the best performance, it is highly dependent on the prior information. More importantly, it has the highest complexity and can be implemented on signals with bursts or frame structures. For instance, such a requirement makes it unsuitable for DSSS signals. On the other hand, CFD (Please note that the method utilized in this paper is a derivative of CFD) is in between match filtering and ED in terms of complexity, but it requires significant second-order periodicity manifolds inherited in the signal [15]. ED is a much simpler method when compared to the first two methods, simply considering the spectral density function (SDF) of a given signal for detection, assuming the SNR or noise levels are known to the receiver. On the other hand, ED is much more susceptible to wireless channel impairments when compared to the first two and highly dependent on sample size [16]. Each method is unique in its own way and suitable to be utilized for different scenarios.
As the wireless communications systems become more complex the multiplexing schemes also get complicated. For instance, to be able to support the high data rate requirements of next-generation networks, multi-carrier modes of access techniques are developed and introduced along with their additional procedures for acquisition. Estimating signal parameters without any prior knowledge at the receiver should be considered for these systems, considering the simplification requirements of the control plane. Therefore, blind carrier frequency, carrier number, and PN sequence estimation became important issues, particularly for cellular systems as implied by the research above. Considering the performance of CFD for DSSS signals, particularly for CDMA multiplexing [9], and the ability to implement CFD for multiple cycle frequencies [7], this paper proposes blind estimation of number of carriers and carrier spacing of multi-carrier CDMA signals along with the estimation of exact chip rate, leading to joint carrier number estimation and signal identification for multi-carrier CDMA access. CFD unearths second-order periodicities buried beneath the general structure of the wireless signals. Particular to the carrier-aggregated wireless signals, PN sequences assigned to the users are mapped to the aggregated carriers, leading to a set of second-order cyclostationarities that cannot be observed with techniques such as ED or match filtering. The proposed method benefits from this feature of carrier-aggregated signals. Comparison results with based on measurement results indicate significant performance gains, especially in low-SNR regions. For instance, under different wireless channel conditions, and for a false alarm rate of at 0 dB SNR, the proposed method constantly provides more than detection rate while ED struggles around detection rate.
Through the rest of the paper in Section 2, the signal model for the carrier-Aggregated DSSS signals is provided. In Section 3, general formulations of utilized CFD methodology are provided as prior information. In Section 4, the proposed method is introduced and proved through the cyclostationarity derivations over the signal model. A measurement setup is developed to validate the theoretical analysis. In Section 5, the measurement setup is described. In Section 6, the post-processing methodology for the measurements conducted is detailed along with the estimation method utilized. Then, a parametric assessment of the proposed method based on the measurements conducted is provided considering different values, wireless channel conditions, and measurement durations. Moreover, the proposed method is compared with that of ED. In Section 7 general discussion on the method along with possible future work concluded the paper.
2. Signal Model
DSSS downlink cellular systems can achieve carrier aggregation in (a) intraband contiguous; (b) intraband non-contiguous; (c) interband non-contiguous formats [17] under multiplexing schemes of High Speed Packet Access (HSPA), Evolved High Speed Data Packet Access (HSDPA), cdma2000 Evolution-Data Optimized (EV-DO)/1X Advanced, Long Term Evolution (LTE) Advanced or 5G New Radio (NR). Derived from the preliminary models in [18,19,20], the discrete-time intra-band contiguous signal at the output of the transmitter can be written as
where c is the carrier index, J is the number of spreading codes, which are per user, and is the amplitude of the corresponding code. is the user symbol to be modulated to the carrier, spread with the code. is normalized unity average energy, i.e., , is the spreading sequence for the symbol of the code which can be written in a vector form as , where is the chip process gain. Please note that is comprised of a predefined and periodic Walsh-Hadamard spreading sequence, which can be represented as and a base station specific scrambling sequence which is overlaid onto the Walsh-Hadamard sequence . Thus, the spreading sequence per bit becomes , . In Equation (1), T is the chip period, which is related to the symbol period through the chip process gain as , . Passing through a dispersive multi-path wireless channel the received signal can be described as
where represents the overall wireless channel impulse response along with the propagation delay per user. The open-form received signal is defined as
Since c carriers will be aggregated the complete received signal becomes
where C is the number of aggregated carriers and corresponds to with zero mean and variance of . Please note that cdma2000 EVDO Support of different RF channel bandwidths of the form MHz where , Evolved HSDPA . Since its initial release, LTE/LTE Advanced supports channel bandwidths of MHz, 3 MHz, 5 MHz, 10 MHz, 15 MHz, and 20 MHz, and in 5G NR, up to 16 carriers can be aggregated up-limited by 1 GHz of spectrum. The discrete form of the received signal can be obtained by .
3. Cyclostationarity Preliminaries
In wireless random signals, there are periodic processes that are not functions of time but stem from the signal’s statistical characteristics, which vary with time. These are called cyclostationary processes and these kinds of periodicities can be introduced due to coding, multiplexing, modulation, and sampling. Especially in the field of wireless communications, these processes are wide-sense cyclostationary with the mean and the autocorrelation is time invariant. Assuming that defined in Section 2 is stationary over time t, and is a power signal, the mean and autocorrelation of can be defined as
where denotes the expected value while * implies conjugation. Due to the wide-sense stationarity of , the mean and autocorrelation functions can be written in terms of time difference
and can be written in terms of time lag over a given time t as and . When these modifications are replaced on Equation (8)
The power spectral density of the time-invariant autocorrelation is given by its Fourier Transform as
3.1. Cyclic Autocorrelation Function
Since nonstationary cyclostationary signals exhibit time-varying behavior in terms of periodic time variation, their second-order moments can be represented by the Fourier series as follows
where is the cycle frequency. The periodic time variation of the cyclostationary signal is bound with the cycle frequency by , integers, and period. Since the cyclostationary signals are extended to the Fourier series through the cyclic autocorrelation function, the Fourier coefficients become
3.2. Spectral Correlation Function
Similar to the Fourier analysis between the autocorrelation function and its PSD, the spectral correlation function (SCF) becomes the Fourier transform for the cyclic autocorrelation function
and please note that SCF can also be interpreted as the correlation of the complex envelopes of multiple sub-bands of a signal, i.e., starting from the center frequency f, the separation between the center frequencies of the sub-bands are defined by .
4. Proposed Method
Combining Equations (6), (9) and (11), CAF can be written as
furthermore, a constant estimator of Equation (13) can be formulated by
where is the observation time interval. The autocorrelation of the recorded signal can be computed by
and note that since is zero mean variance process, it is eliminated through the averaging operation. If we focus on the extensive set of summations and multiplications in Equation (17) it is observed that the core subset of multiplications is
Due to the orthogonality of the spreading codes of DSSS signals since bit-by-bit multiplication and summation of PN sequences lead to zero, it can be written that if is the user information for the user at the time of n,
assuming all users are active, if and , otherwise 0, since PN sequences are assigned per user. Thus,
unless and . Which means that unless the user and code together are not the same expected value becomes zero. Therefore, (18) can be written for particular values of n, m, k, and l in terms of expectations of sums as
and it can be inferred from Equations (19) and (20) that for both and , Equations (21) or (22) becomes zero. Furthermore, the only case that provides non-zero can be written by
Therefore, the sums of multiplications in Equation (17) reduce down to
and since , and multiplications in the summations lead to non-zero results for a single case, Equation (24) can be written as
, and plugging Equation (25) into (16) leads to
which indicates that for the particular case of and the constant estimator of CAF given in (16) produces Fourier coefficients for each aggregated carrier of an intra-band contiguous downlink DSSS cellular signal, starting from the zero-lag correlation point of for the first carrier and so on. To that end, since the SCF of the sampled signal is given by [21]
where is the spreading sequence period, spectral implications of Equation (26) can be observed through the SCF based on [1,22] as
where is the Fourier transform of correlation of the corresponding spreading sequences over carrier.
5. Measurement Setup
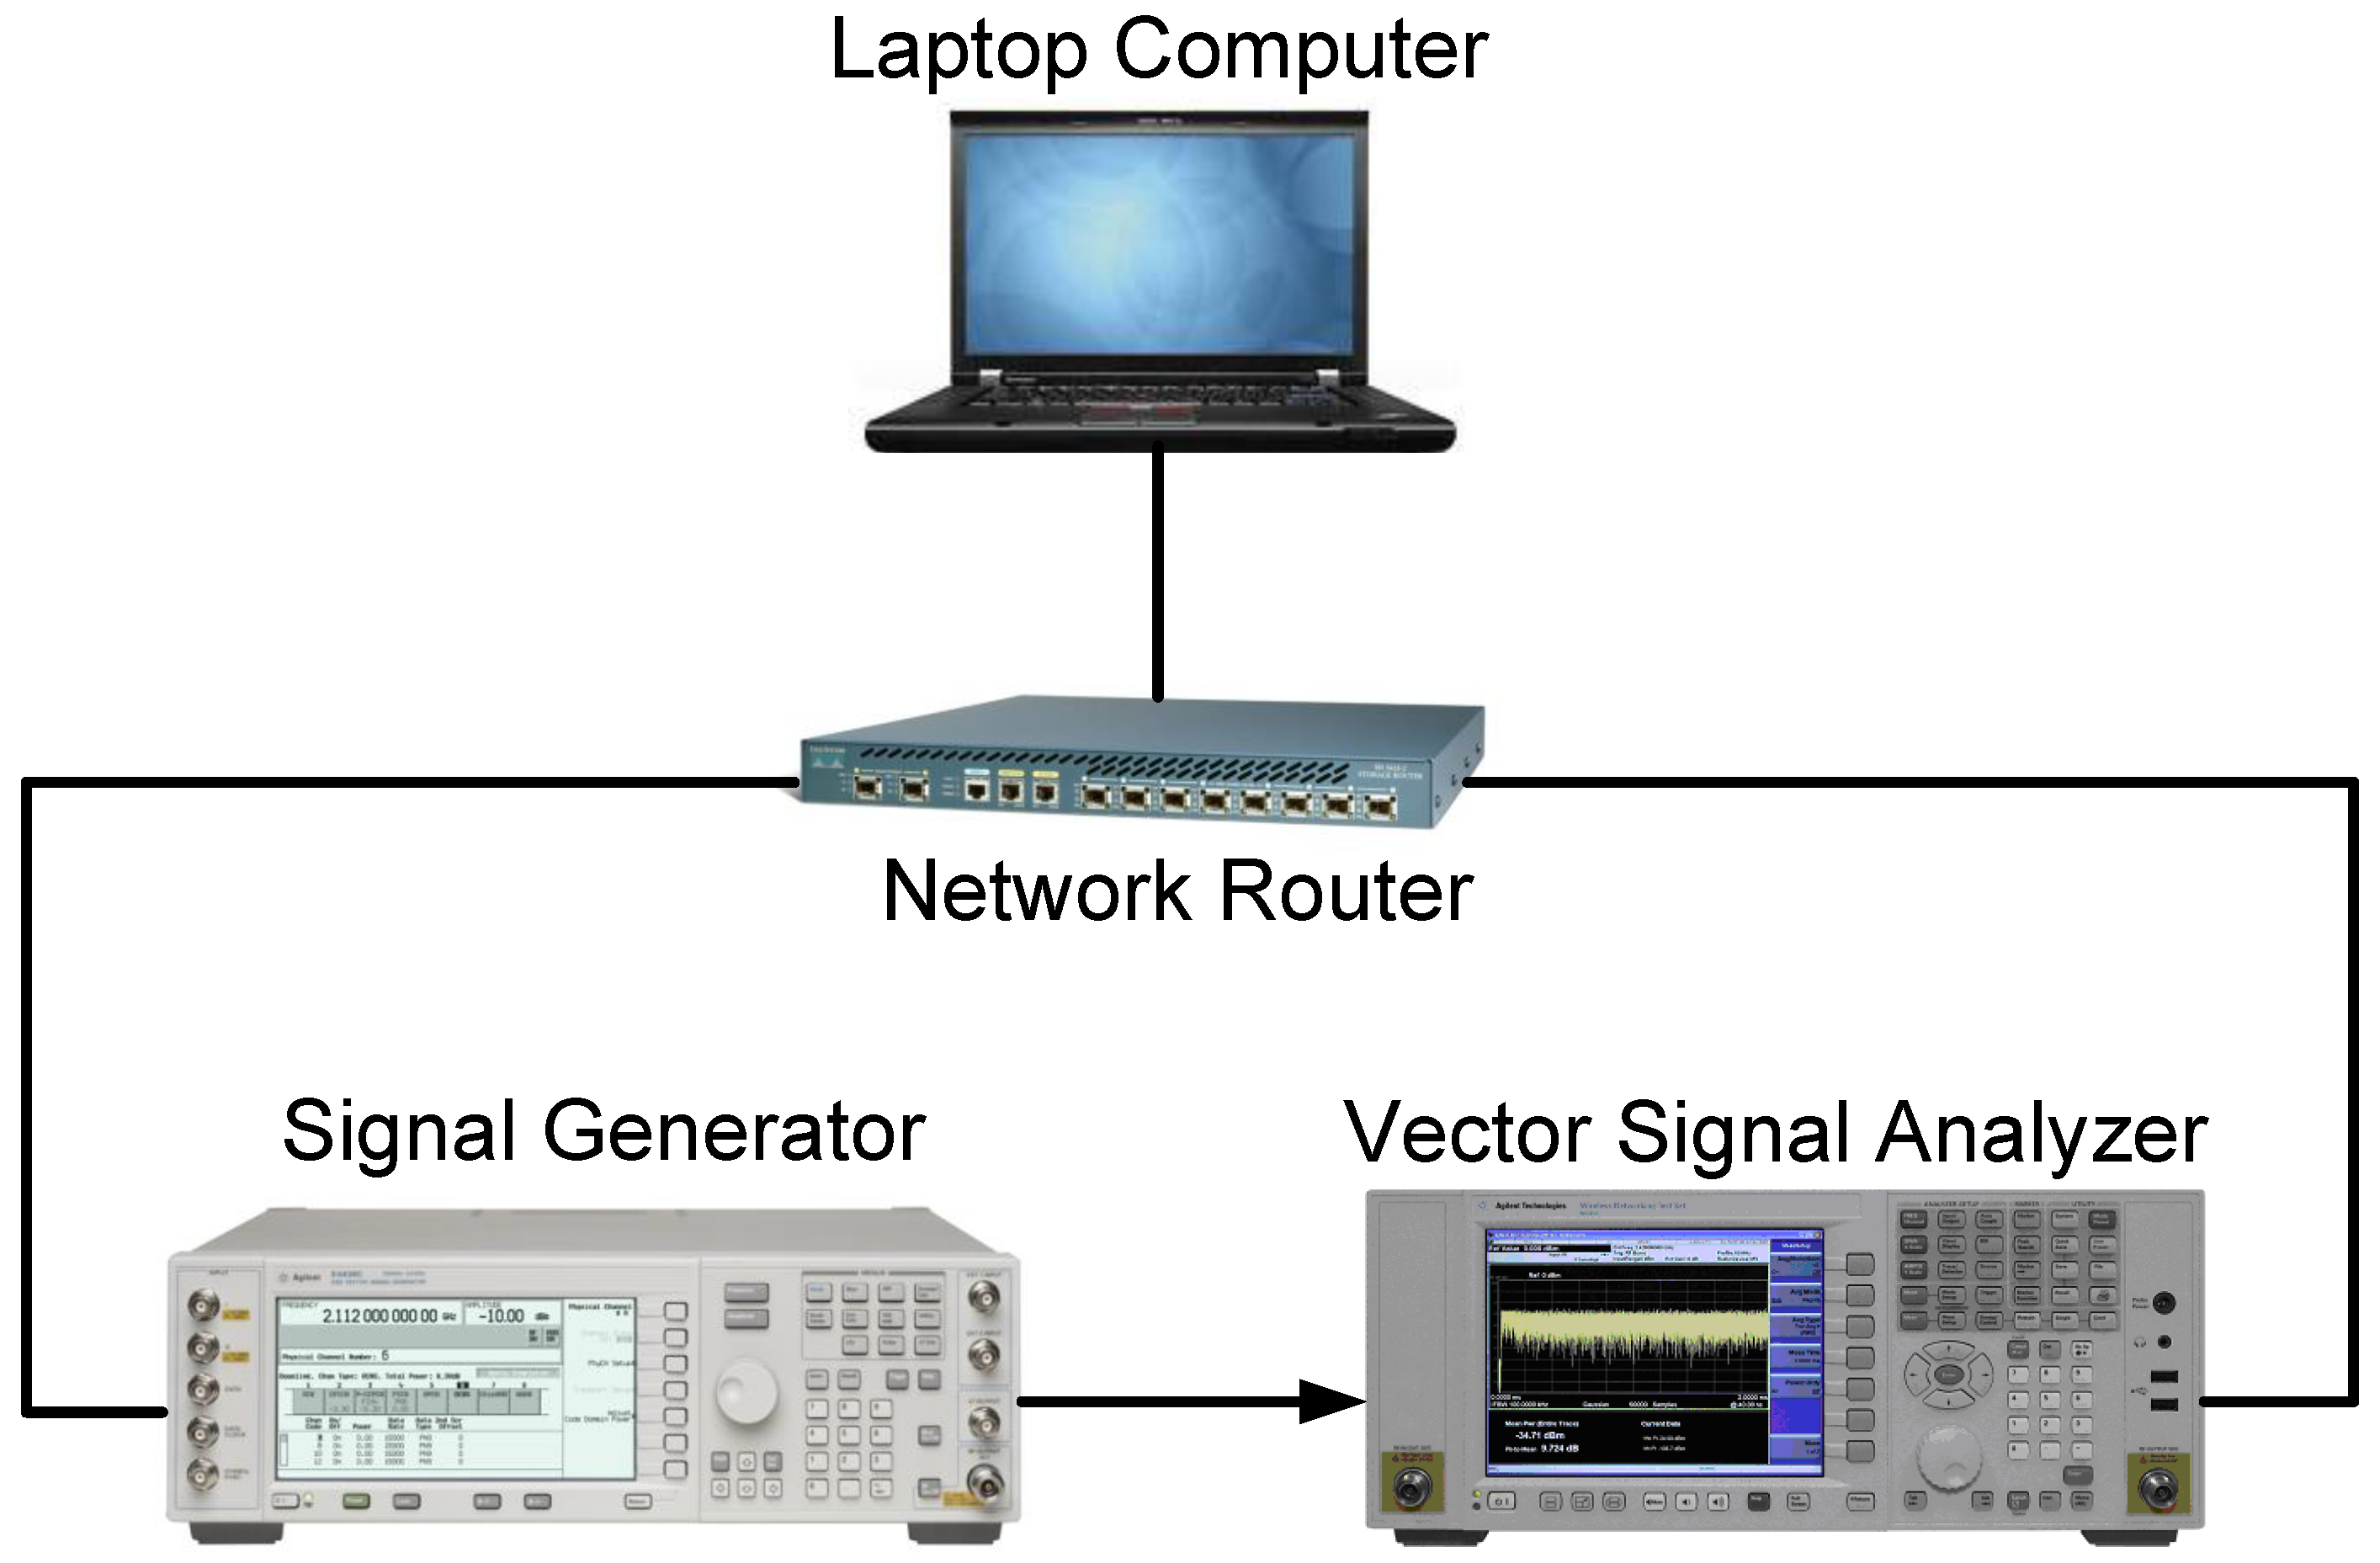
The estimation performance of the proposed method is investigated through the analysis of controlled measurements conducted on a measurement setup. The measurement system consists of an Agilent ESG E4438C signal generator to generate the standard-based cellular signals, an Agilent E4440A PSA series spectrum analyzer to receive the signals along with the accompanying vector signal analyzer (VSA) software v2.4 to make sure that the signals are recorded with limited distortion due to hardware impairments, and a laptop computer to implement and run the proposed method along with accompanying cables and connectors. The measurement processes are controlled by the laptop computer since all the devices are connected to each other through the network router utilizing transmission control and internet protocols. All the measurement parameters are set and controlled by the laptop computer and the recorded signals are also saved on the laptop hard disks. The setup is shown in Figure 1.
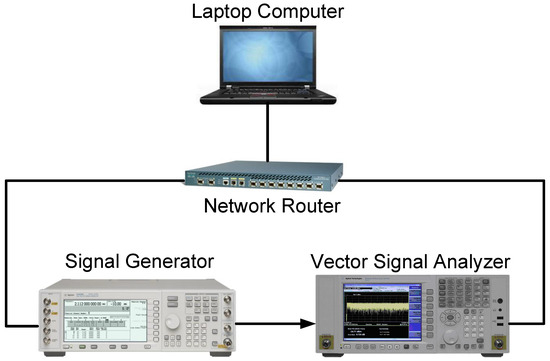
Figure 1.
Measurement setup: transmitter, receiver, laptop computer, router, and their connections.
Through the measurement process, signal parameters are adjusted by the software running on the laptop. Thus, the parametric analysis, which is based on measurement parameters such as the number of carriers (c), signal transmit power, signal type, protocol settings, and data length could be adjusted methodologically. Furthermore, the vendor-provided VSA software ensured the signal acquisition and recording quality as indicated before. Please note that since only the transmit power of the signal can be determined by the measurement system, the values of the received signal are determined by a software module developed along with the implemented proposed method. Therefore, all the signal transmission loop is controlled and completed on the laptop computer while the transmitter and the receiver are allocated in the laboratory.
Table 1 depicts the list of the parameters utilized during the measurement process. The measurements are repeated for 10 times with the aid of developed software. Please note that due to the limitations of the measurement devices, only the cdma2000 intra-band contiguous carrier aggregated signals were able to be generated by the measurement setup; thus, the validation of the proposed method is conducted through these recordings however the results obtained can be generalized to other cellular signals due to the fact that fundamental physical layer signal model are the same with that of other cellular intra-band carrier aggregated signals and spreading schemes are also standardized in the same way.

Table 1.
Signal Parameters Used Throughout The Measurements.
6. Measurement Results
After the measurements are taken, the recorded cdma2000 intra-band contiguous carrier aggregated signals are post-processed in MATLAB to adjust the values of the received signals observed at the receiver side and to be able to reflect the real-life impairments on the signals. The channel types utilized in this context are listed in Table 2. Please note that all the code division multiple access (CDMA) channel models deployed are 3GPP TR 25.943 V6.0.0 (2004-12) compliant.
Table 2.
Utilized Channel Types At The Measurement Post Processing.
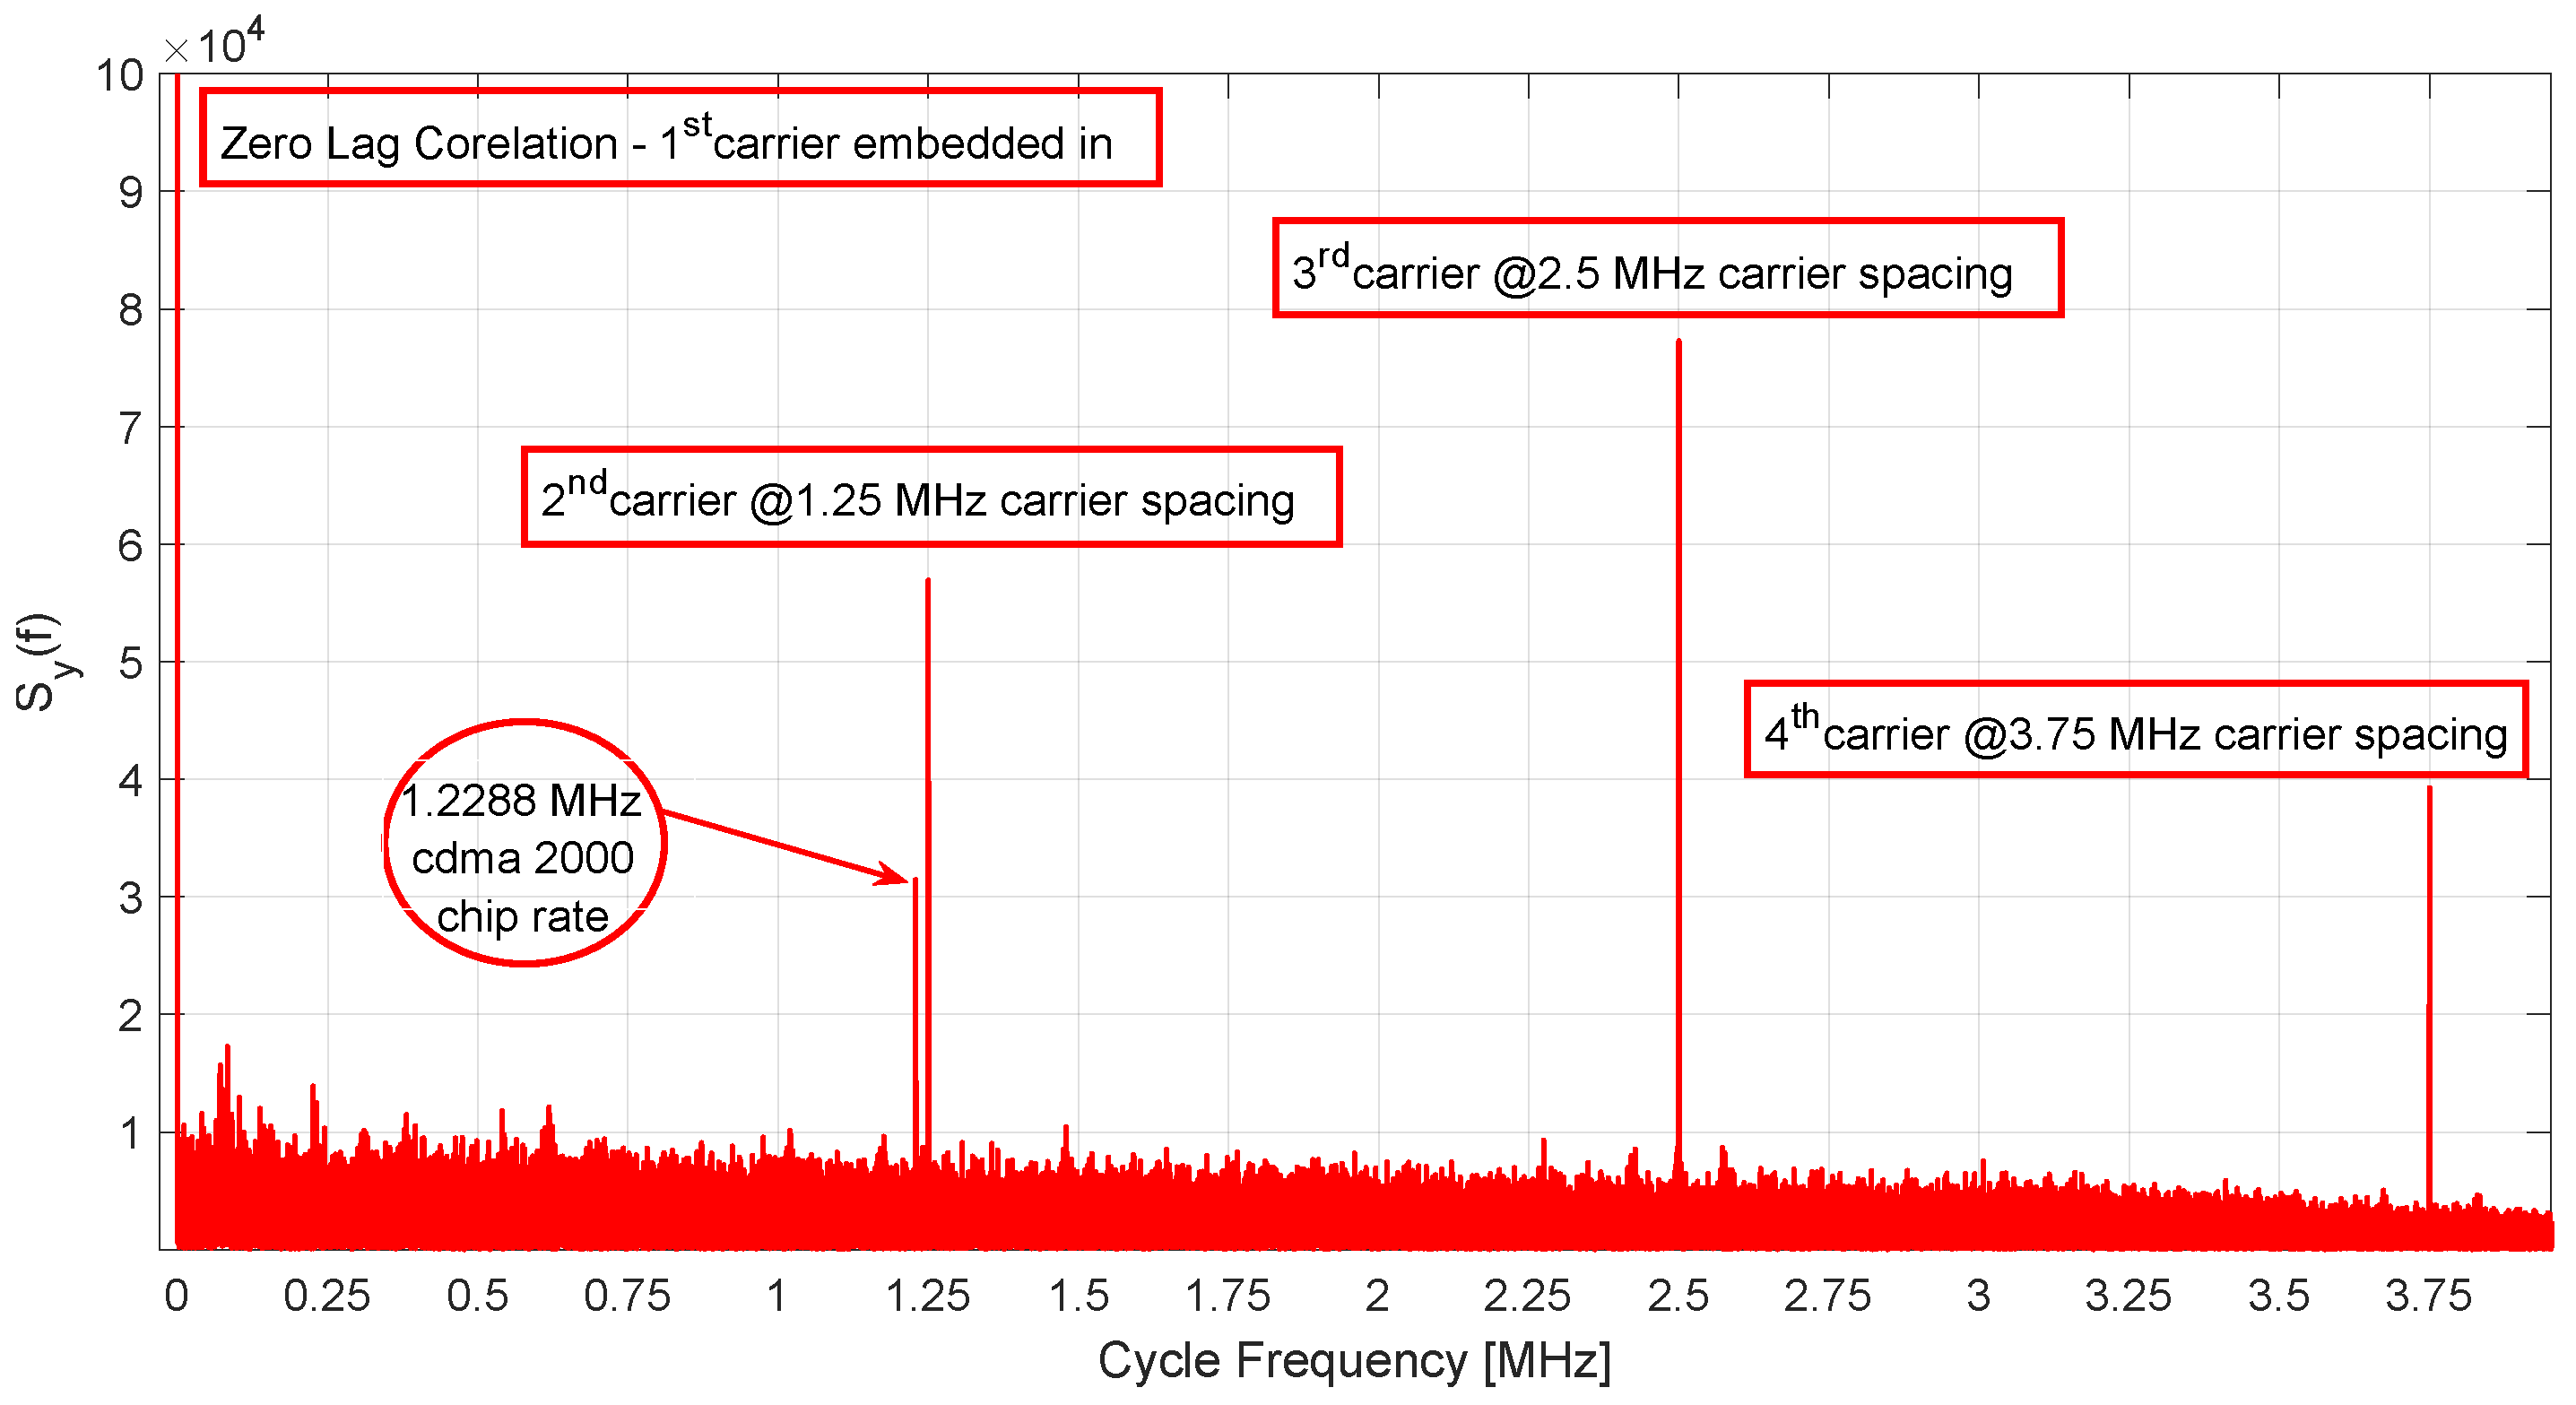
In this setting, utilizing an extensive post-processing methodology, each measurement is convoluted with random channel instances (for each channel type, the channel parameters such as tap intervals are assigned randomly) created from channel models listed in Table 2 and 500 measurements are obtained for each signal type, i.e., 3-carrier and 4-carrier signals ( and ), for each value and measurement duration in Table 1. As the data set is formed, first the proposed method is implemented through (26), and (27) on a baseline case, e.g., signals with dB are selected for both carrier types to observe the output of (28). Figure 2 shows the SCF spectrum for a 4-carrier signal. First, it should be noted that through the derivation a specific case for is considered and it is indicated that the first carrier will be observed at the zero-lag point in the spectrum. This outcome is consequently reflected in Figure 2 and the first carrier’s spectral components are combined with some other periodicities at . Since it is not possible to distinguish the components of the first carrier from the other periodicities, in this study, it is assumed that if the signal under observation has multiple carriers, these will be observed at incriminating carrier spacings and carriers following the first carrier are selected as the focus of observation. Please also note that, if the measurement performed belongs to a single carrier DSSS signal, only the chip rate which is also observed in Figure 2 would be present along with a strong zero-lag component. Thus, single-carrier DSSS signal detection and multi-carrier cases can be distinguished from each other in a simple way. Single carrier DSSS signal detection with cyclostationary signal analysis has been extensively studied in the literature and [23] can be consulted for detailed discussion.
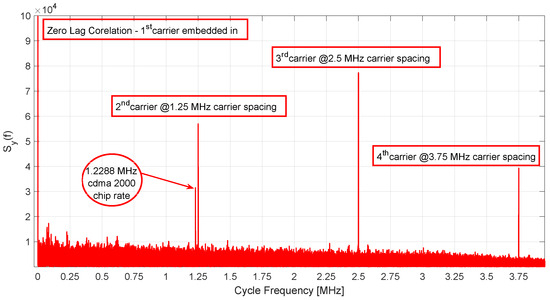
Figure 2.
The raw output of the proposed algorithm; joint estimation of carrier numbers, spacing and chip rate for four-carrier DSSS signal.
In Figure 2, cdma2000 chip rate of mega-chips per second, second carrier at the MHz carrier spacing, third carrier at the MHz, and fourth carrier at the MHz are distinguished particularly as the expected results of the proposed method, beyond the zero-lag correlations. In Figure 3 same results are observed to affirm the three-carrier case; besides the chip rate, only two spectral manifolds for the second and third carriers of the three-carrier signal are identified.
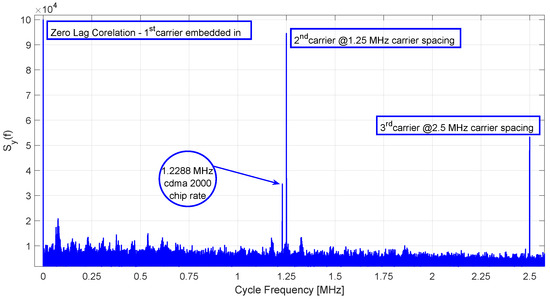
Figure 3.
The raw output of the proposed algorithm; joint estimation of carrier numbers, spacing and chip rate for three-carrier DSSS signal.
Next, a constant false alarm rate (CFAR) detector is implemented based on the method in [4] to be able to assess the performance of the proposed method. To that end, probability of detection () rates for the values of probability of false alarm () rates of , and are provided. The estimation process is established upon the CFAR detector through the binary hypothesis testing scheme which is applied to the spectrum as in [7].
where is the estimate of theoretical , which is calculated from the measurement results and is the estimation error. The detection performance of the proposed method is investigated next, utilizing the aforementioned methodology based on the defined data set.
6.1. Parametric Results
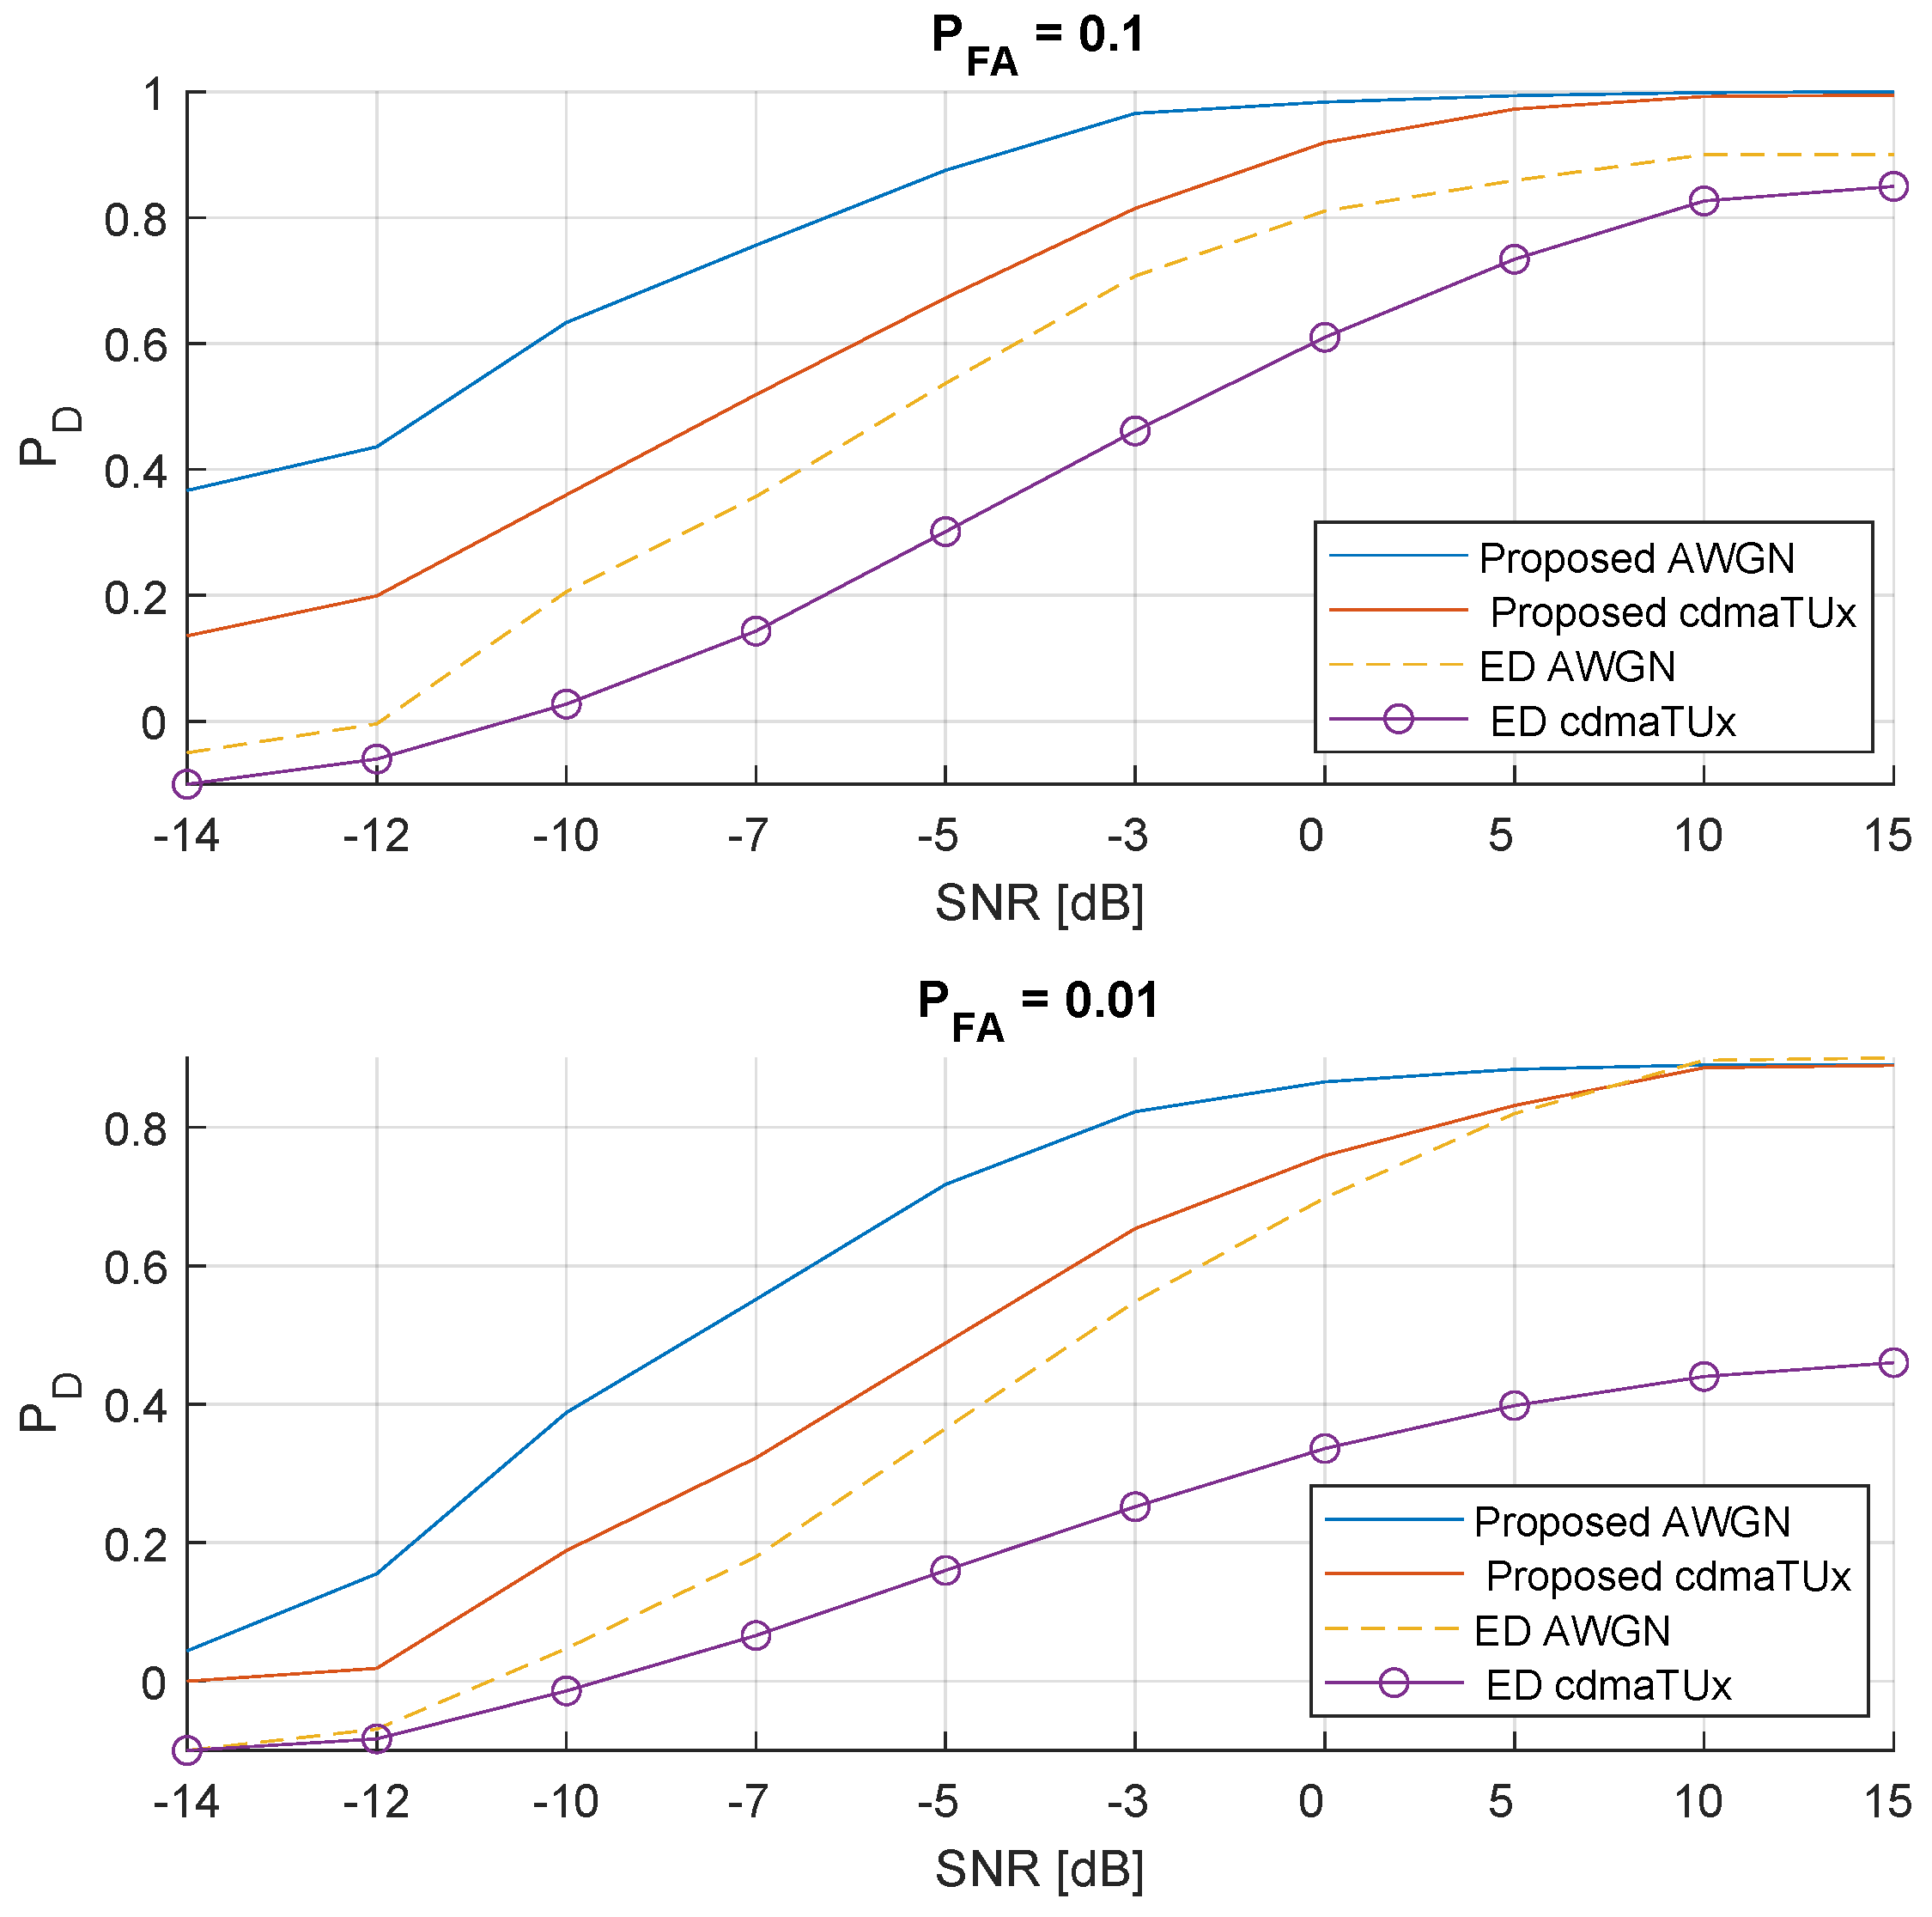
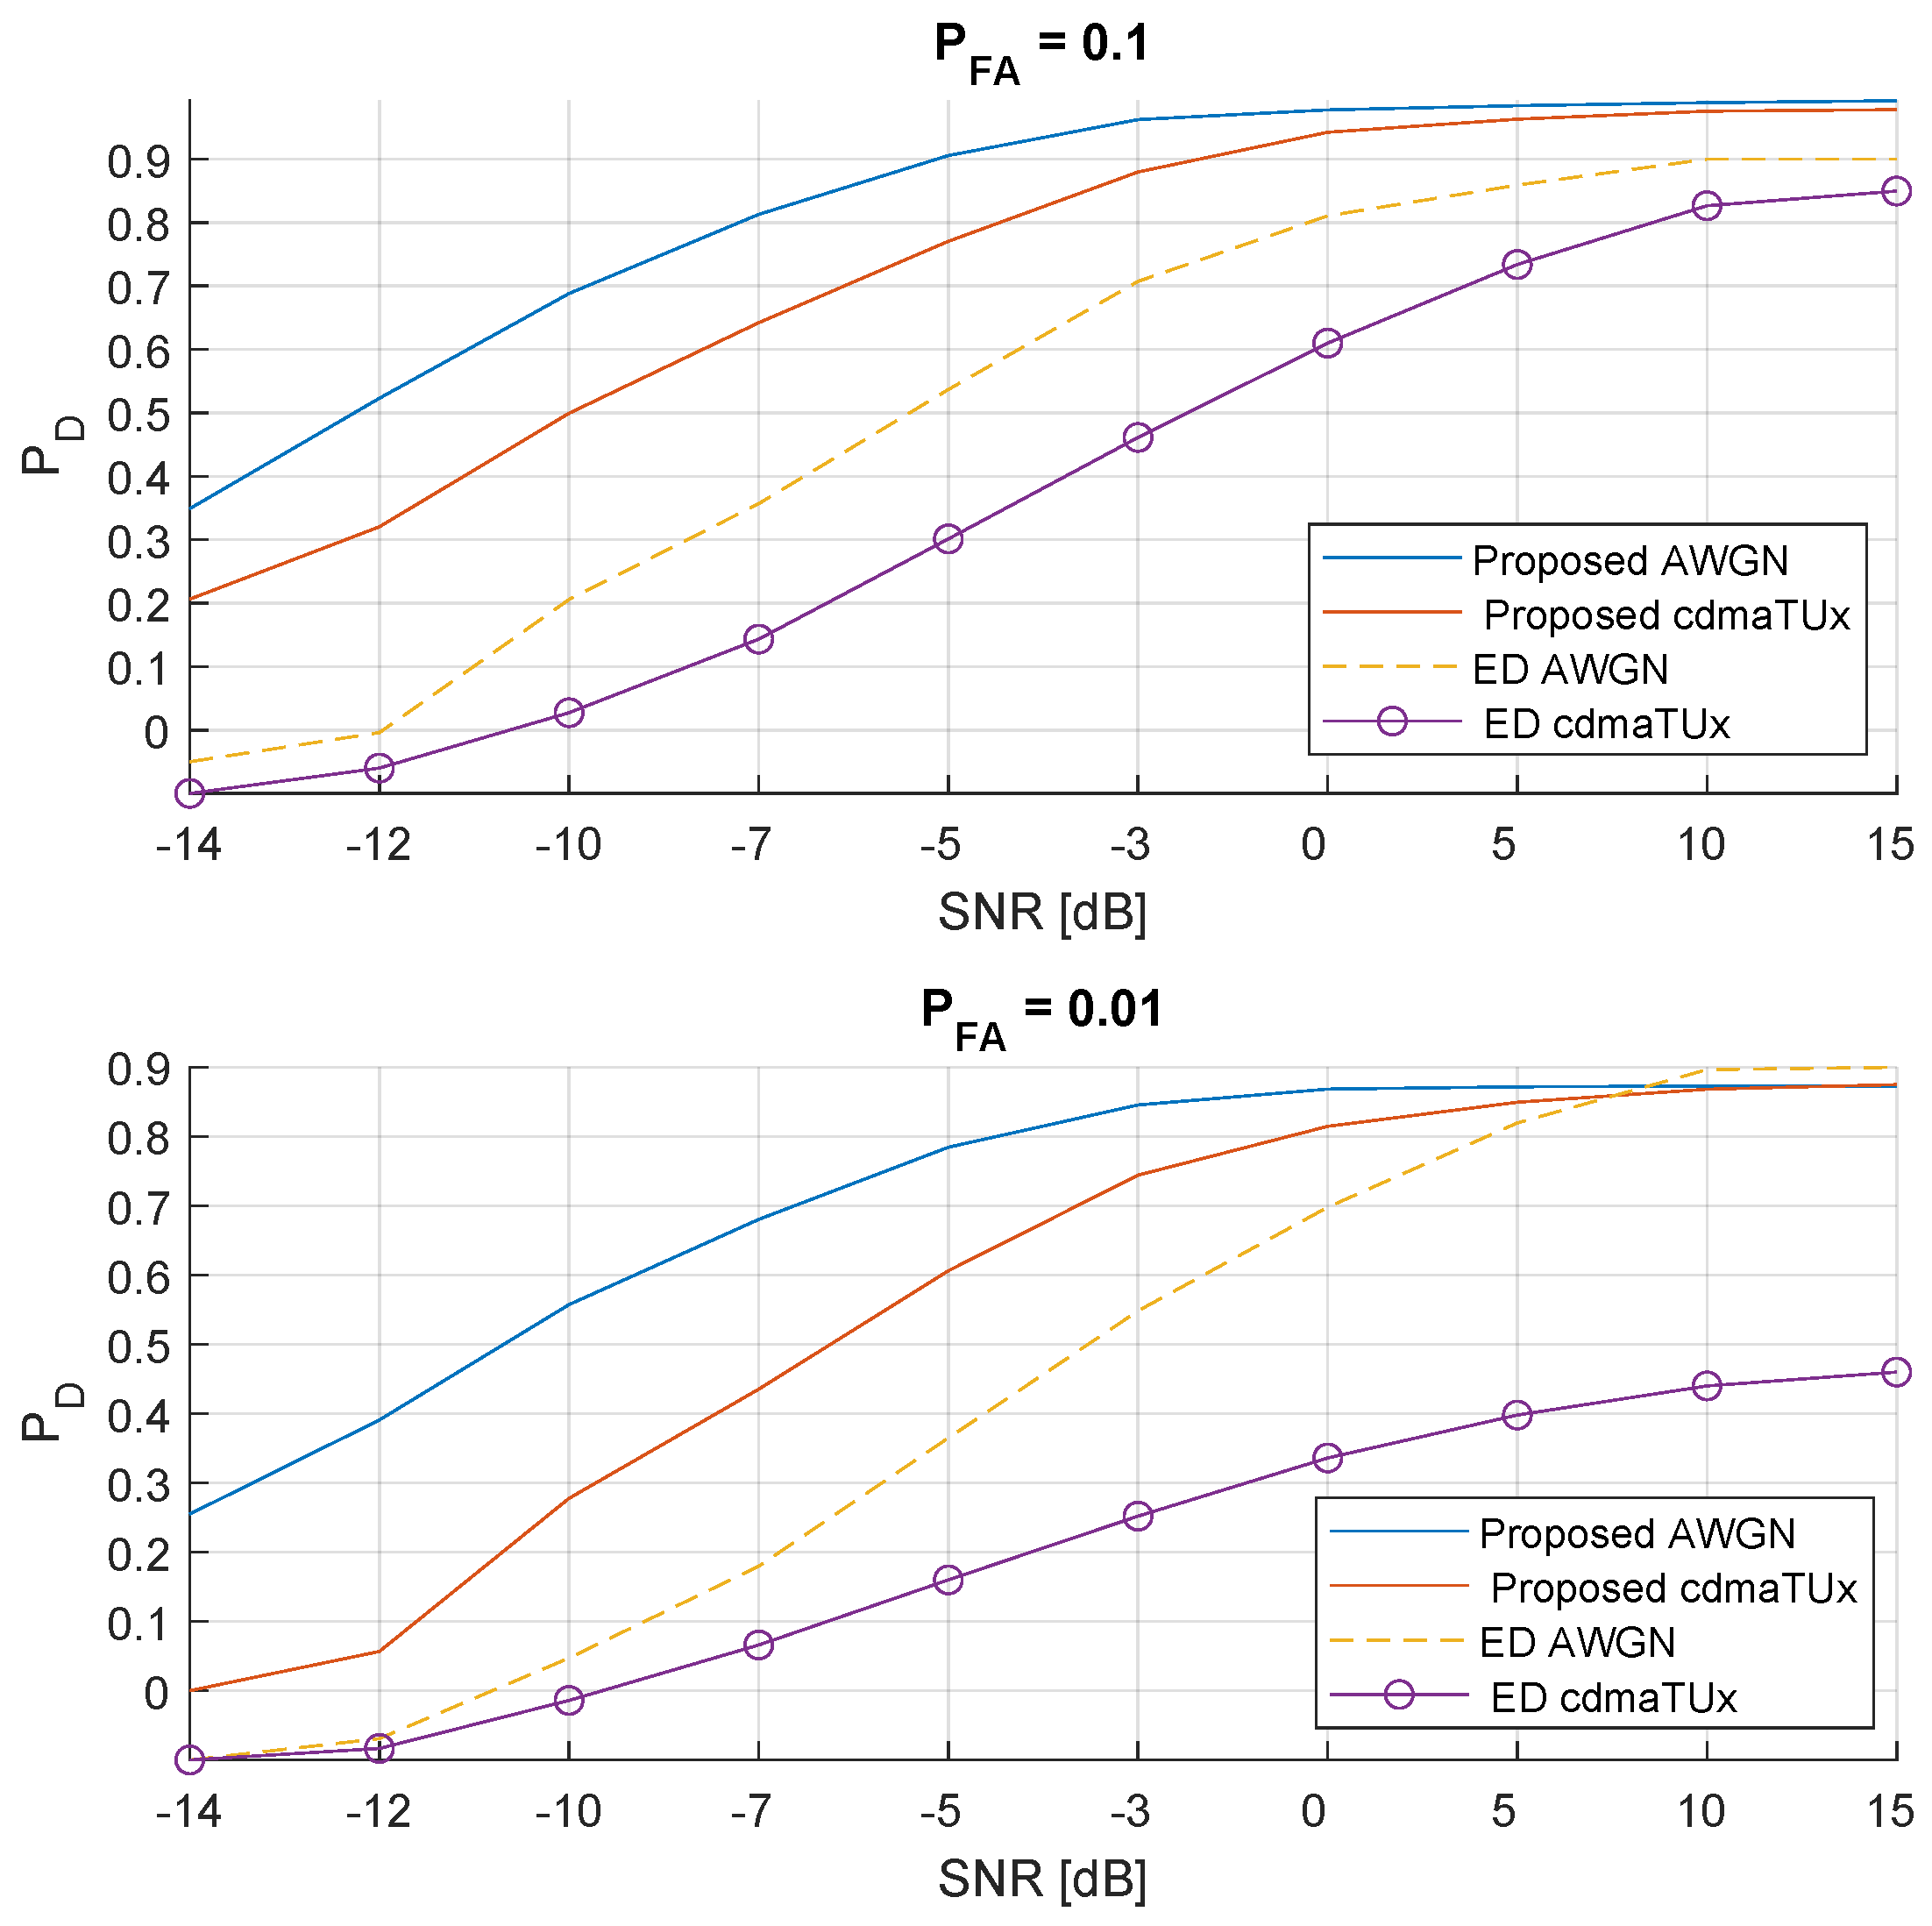
Figure 4 shows the performance for 4-carrier signals. The results obtained are based on implemented CFAR methodology, i.e., detection performance for varying SNR levels and (first sub-figure), and (second sub-figure). For the sake of simplicity, only the and typical urban CDMA () channels are considered in these plots. Furthermore, for comparison purposes, classical ED developed in [24] and detailed in [25] is also implemented. Thus, ED detection performance is also plotted along with the proposed method’s outputs. From both plots it can be inferred that the proposed method is superior to ED, especially in the low-SNR region; however, for the case, deteriorates faster than . It is notable that the proposed method provides strong statistics under a scattering-rich urban environment even at the dB region. These statistics can only be satisfied around 5dB region for . On the other hand, while the performance gap between the proposed method and ED is similar for the and cases at , the margin increases for channel in case of .
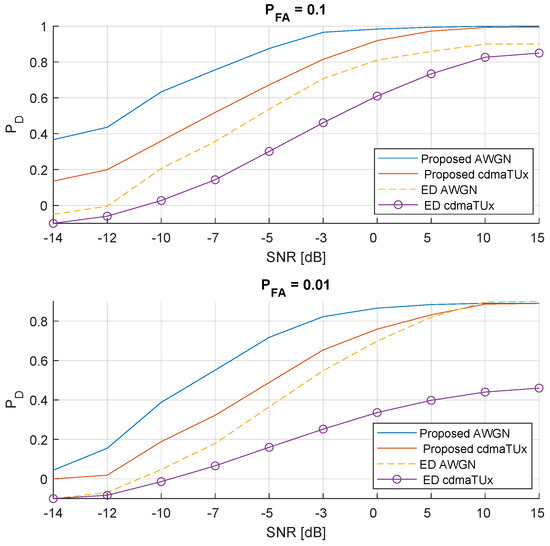
Figure 4.
The 4-carrier signal: The detection performance of the proposed method under and urban channel conditions. Comparison with energy detector for , and .
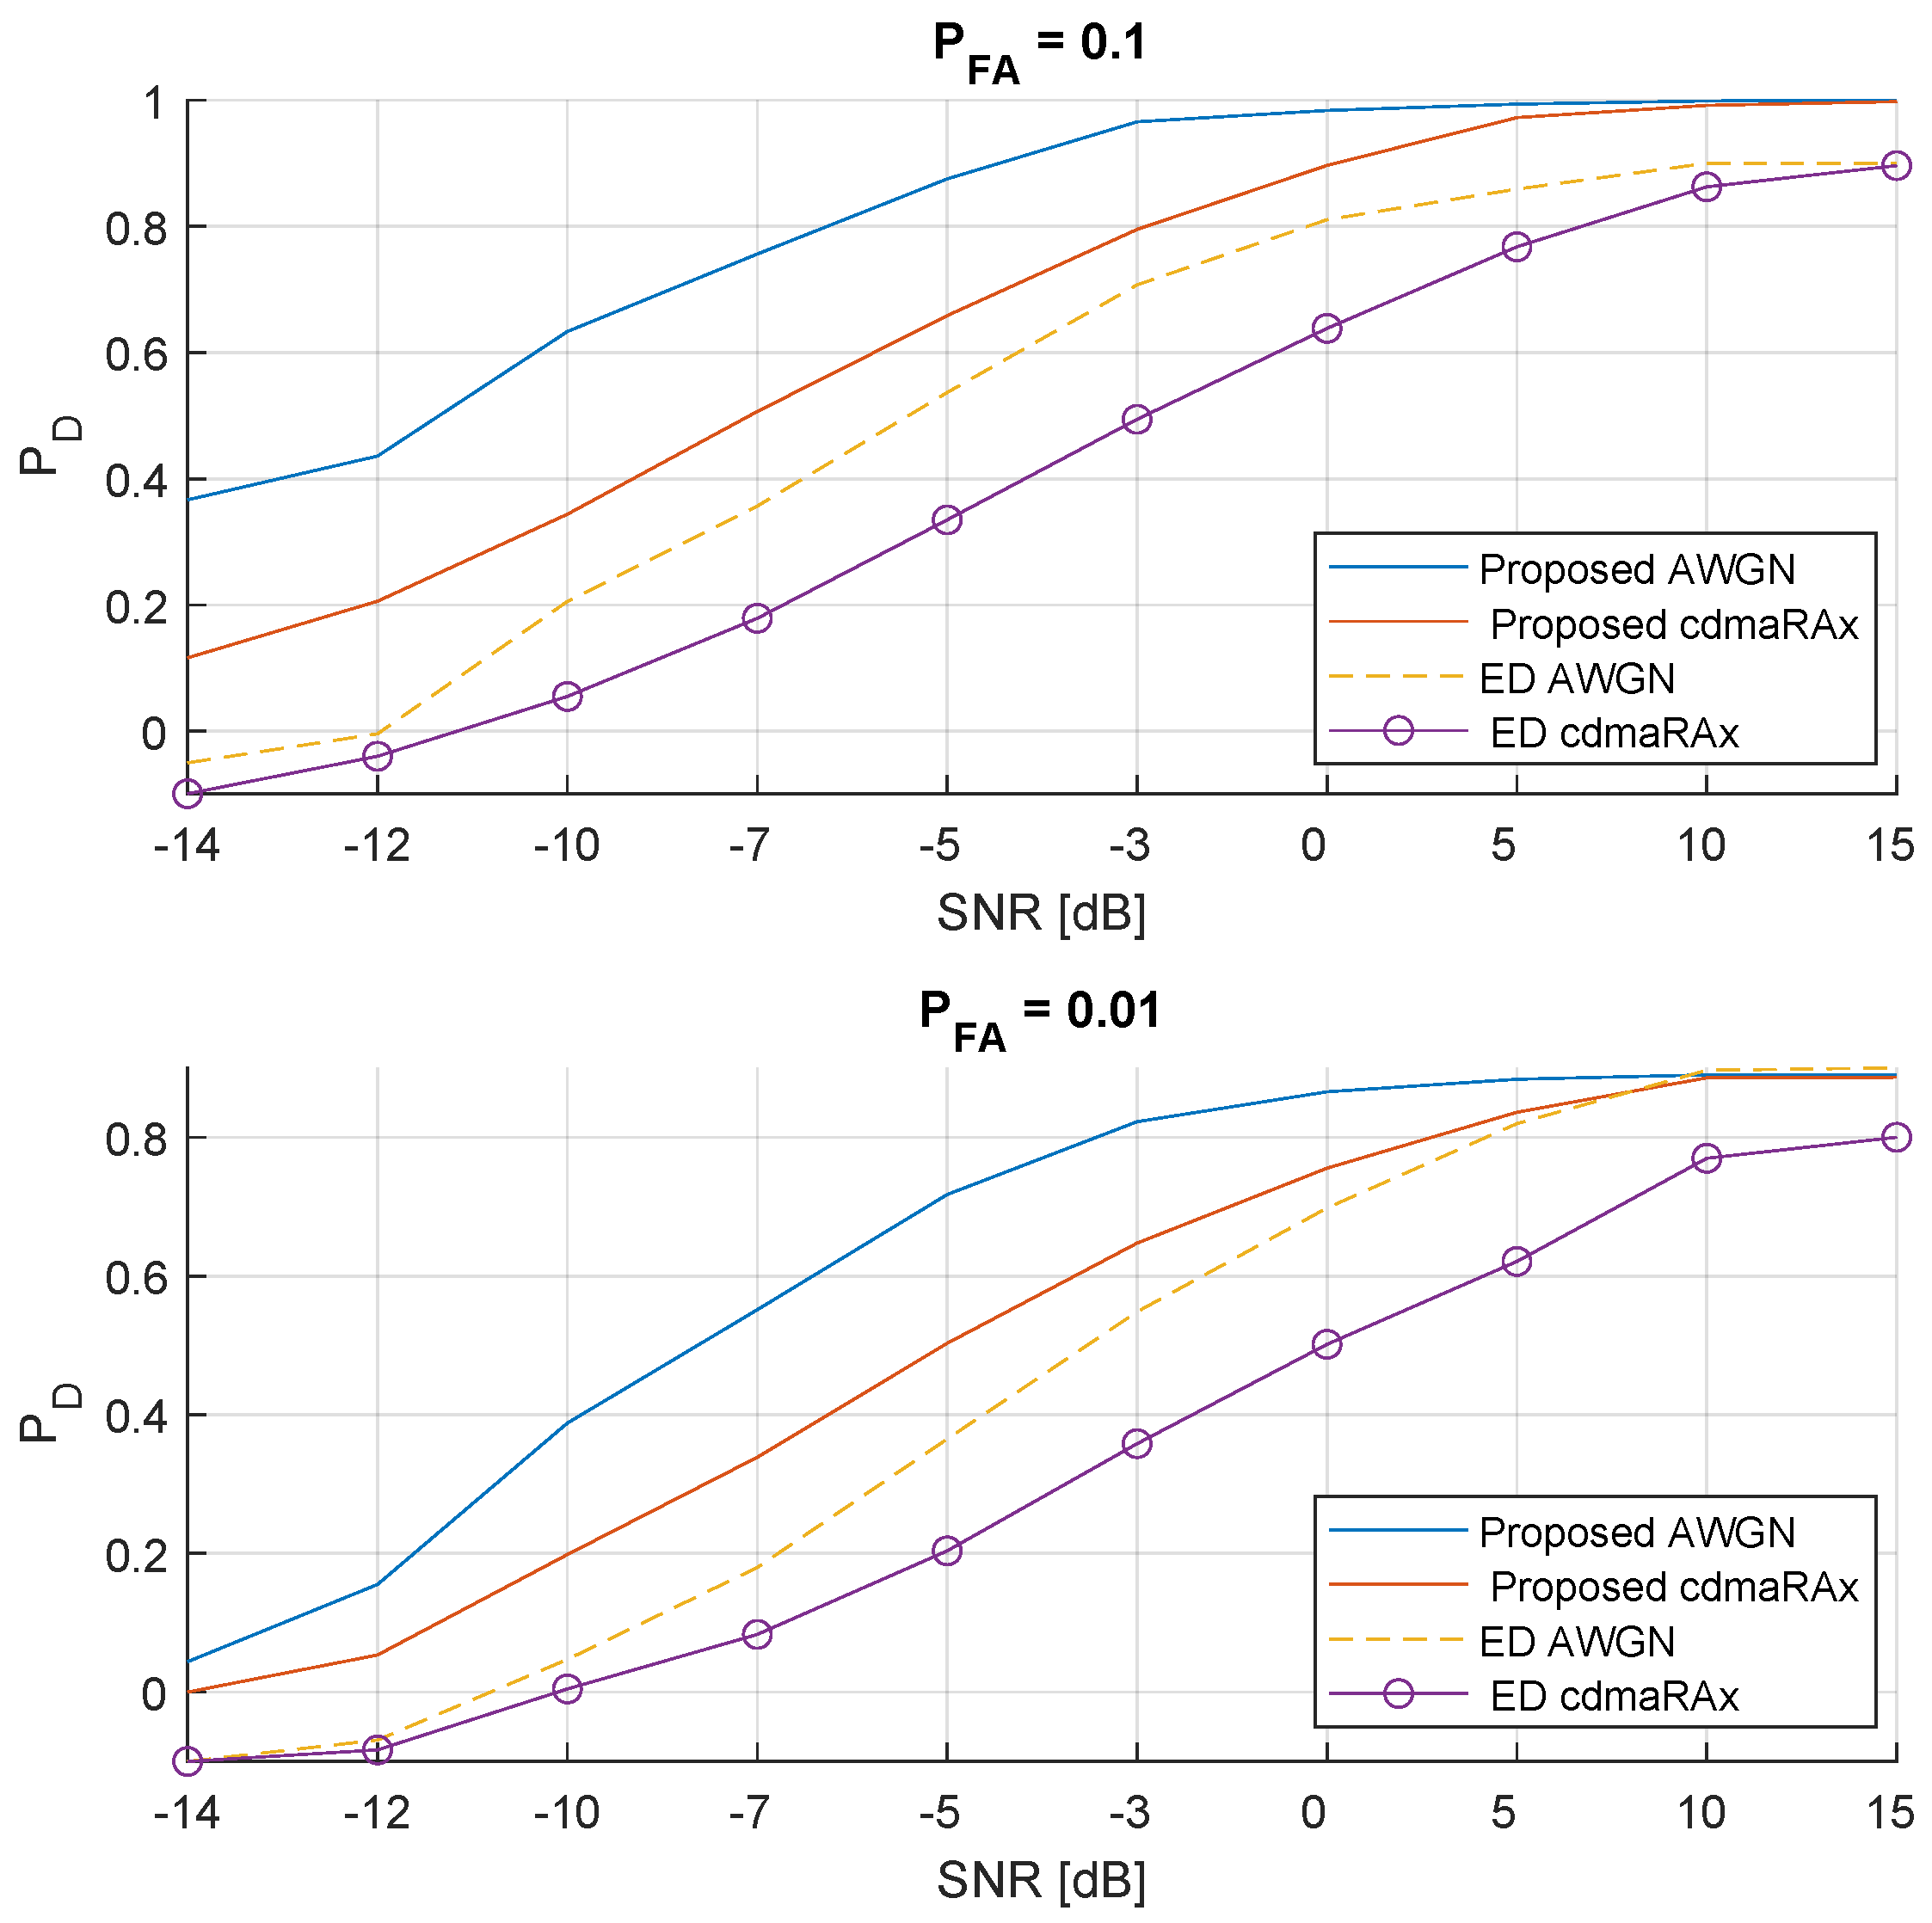
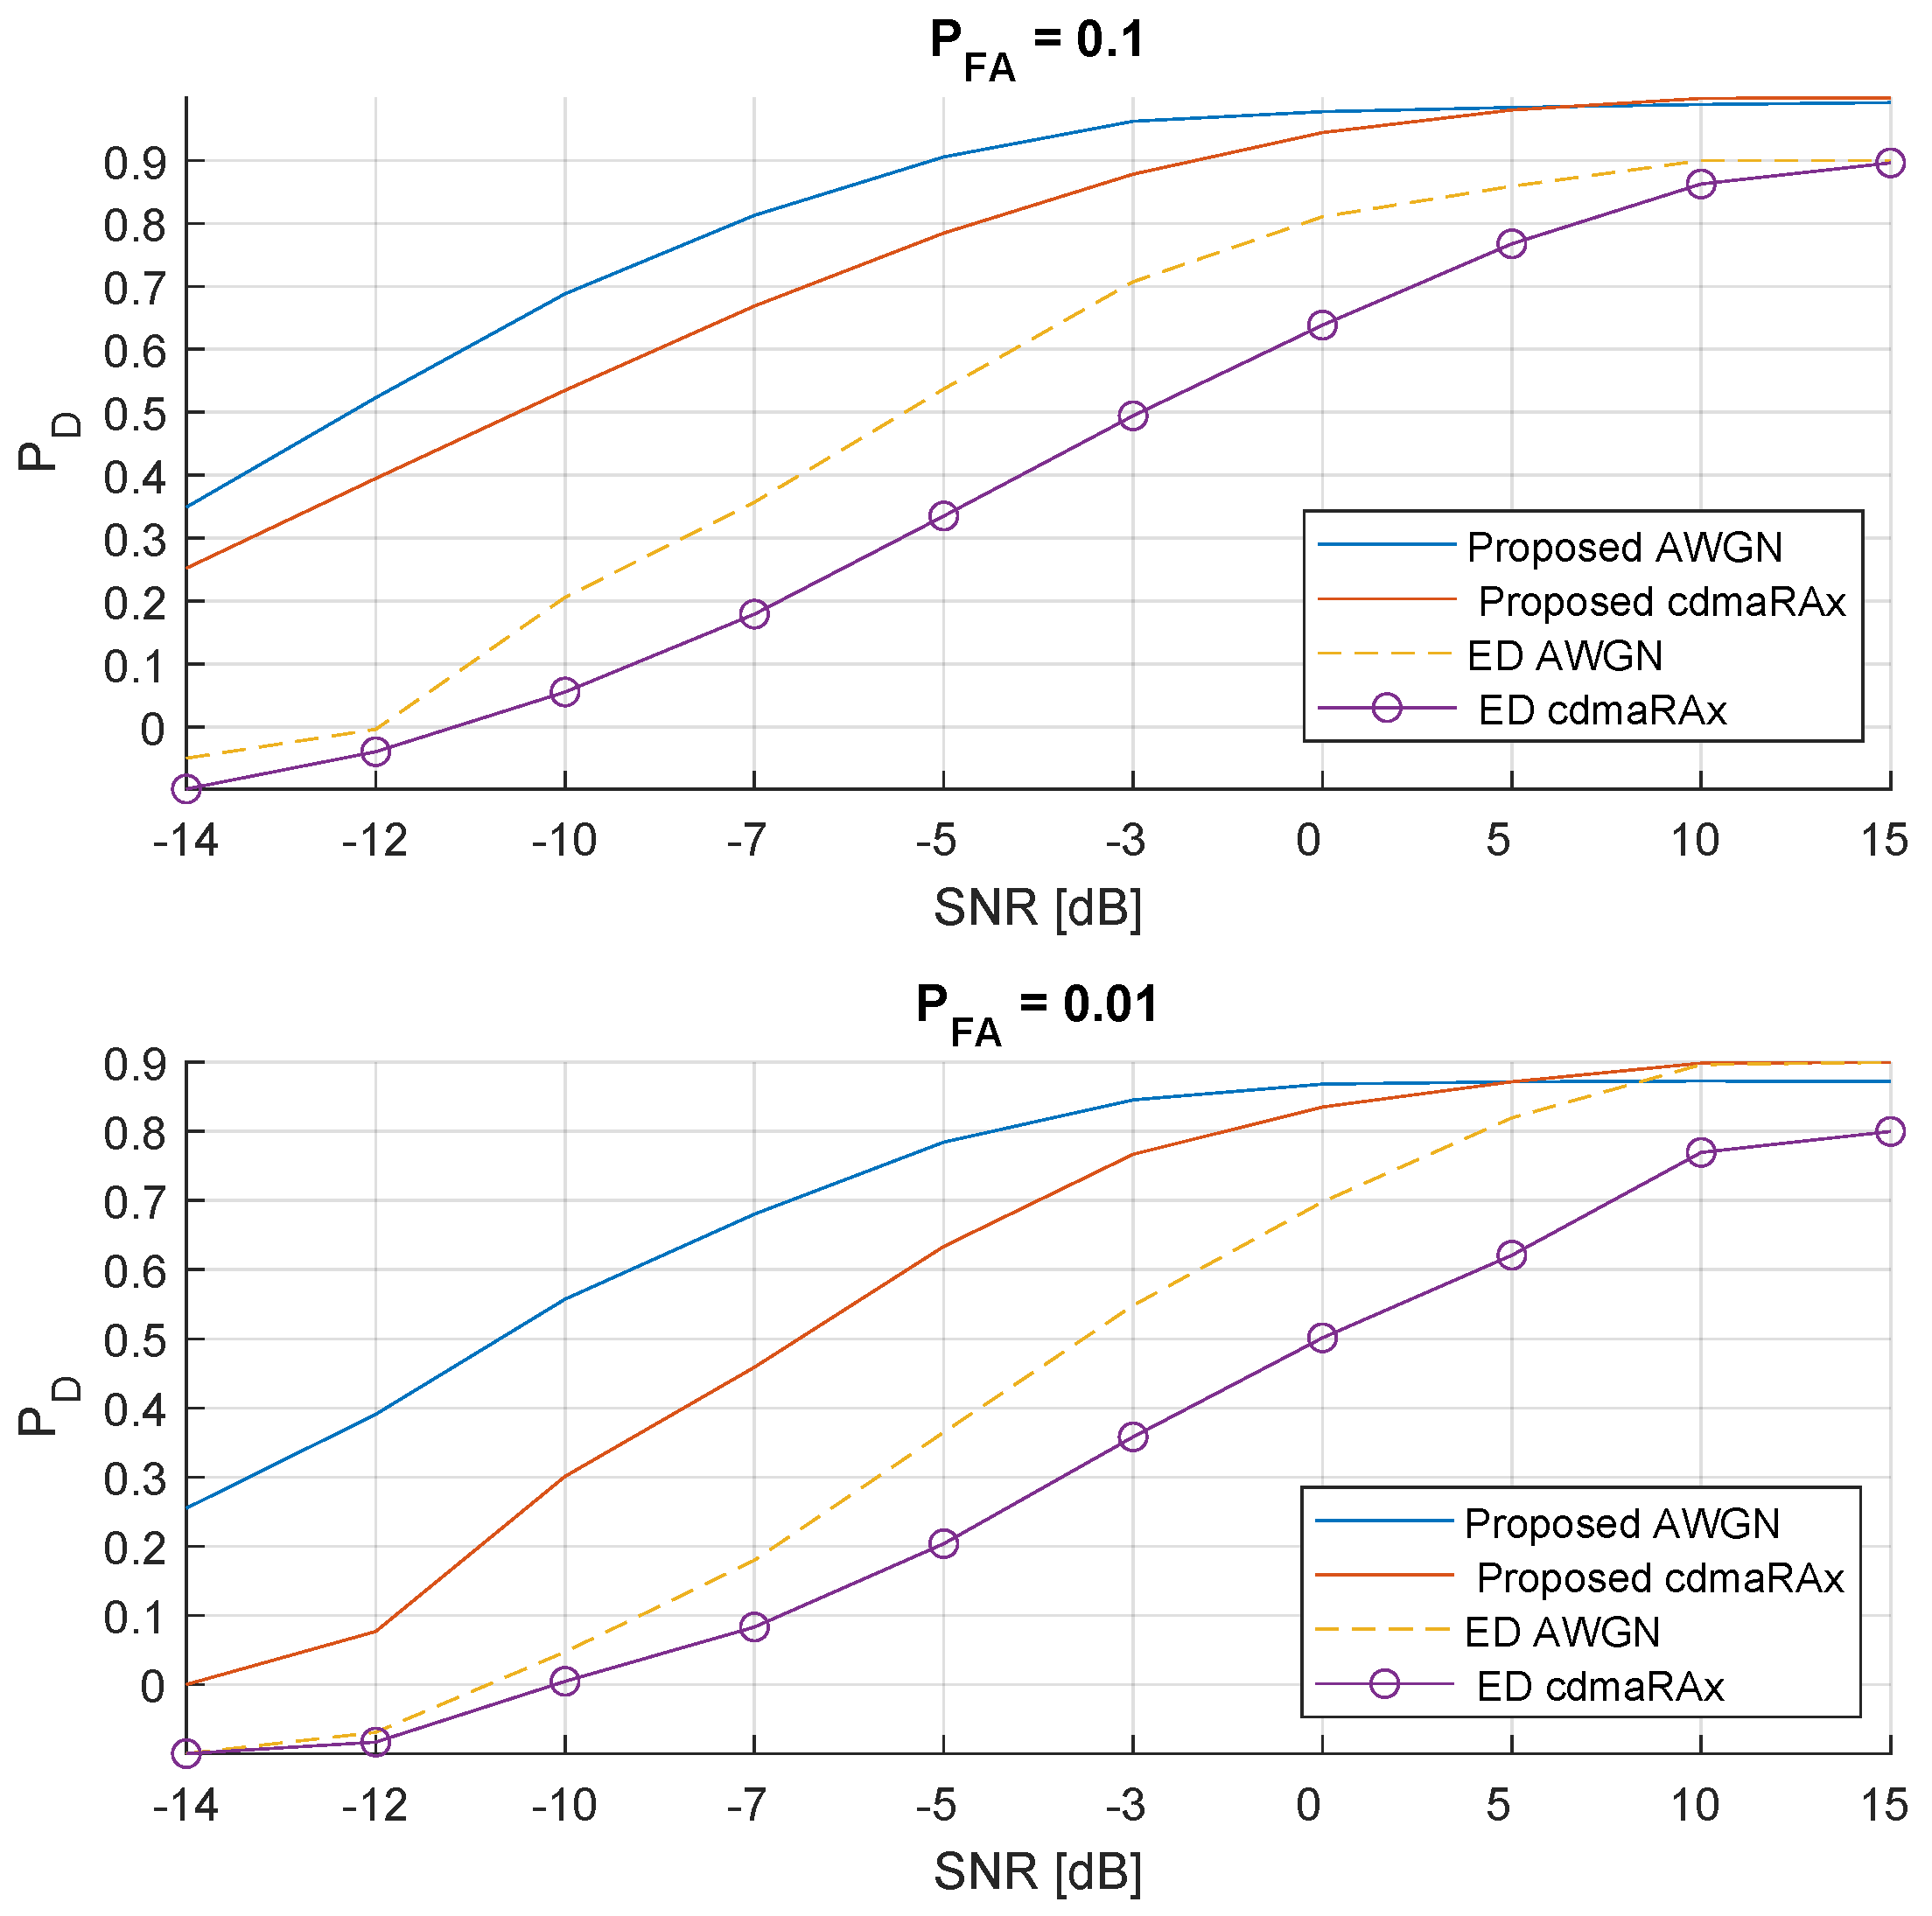
With a similar approach, in Figure 5, the performance of the proposed method is investigated particularly to the rural area CDMA () channel conditions, again along with the reference channels and in comparison with ED method. Even though the performance of the proposed method is slightly improved, it is observed that the ED performance for has significantly improved due to the less-deteriorating channel impairments of the rural environment. These results indicate that the susceptibility of the proposed method against varying channel conditions is insignificant.
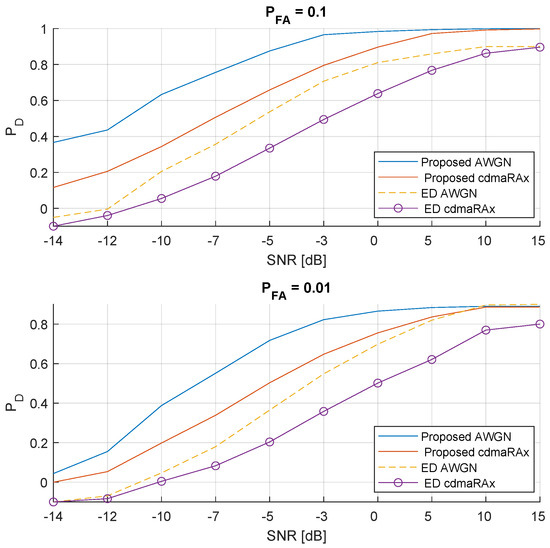
Figure 5.
The 4-carrier signal: The detection performance of the proposed method under and rural channel conditions. Comparison with energy detector for , and .
The same analysis is repeated to observe the 3-carrier signal detection performance of the proposed method. These results are illustrated in Figure 6 and Figure 7. Besides observing results that are similar to that of 4-carrier signals, in the 3-carrier case, it is observed that the gap between the detection performance of the proposed method for and channels is wider than the 4-carrier signals. This result is due to the fact that wider band signals are less susceptible to the changes in the channel conditions when compared to narrower signals.
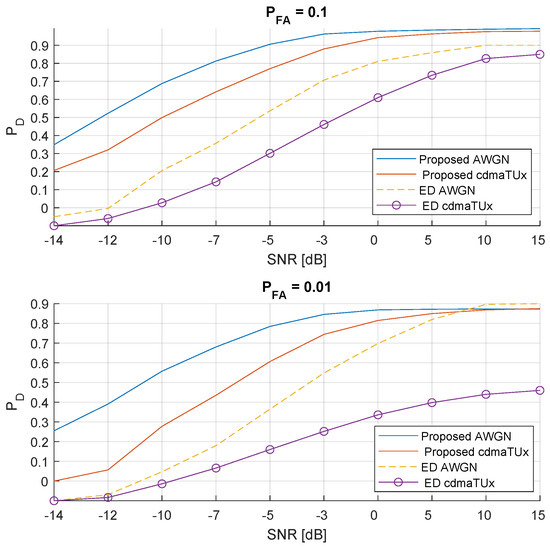
Figure 6.
The 3-carrier signal: The detection performance of the proposed method under and urban channel conditions. Comparison with energy detector for , and .
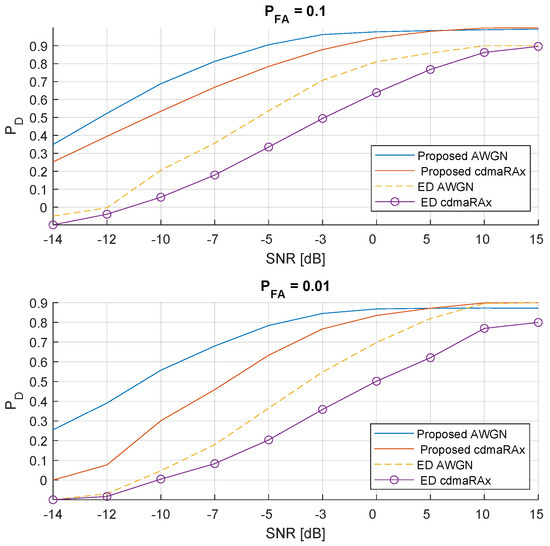
Figure 7.
The 3-carrier signal: The detection performance of the proposed method under and rural channel conditions. Comparison with energy detector for , and .
Besides the channel characteristics and values, another performance-determining parameter is the number of symbols, or chips in the case of DSSS signals, that are involved in the process. A general analysis of the effect of sample size on ED and cyclostationary analysis can be found in [26,27]. In parallel to these works, in this paper, the effect of measurement duration is considered in terms of the performance analysis of the proposed method. Therefore, measurements with indicated durations in Table 1 are taken during the measurement campaign and the proposed method is implemented over these signals.
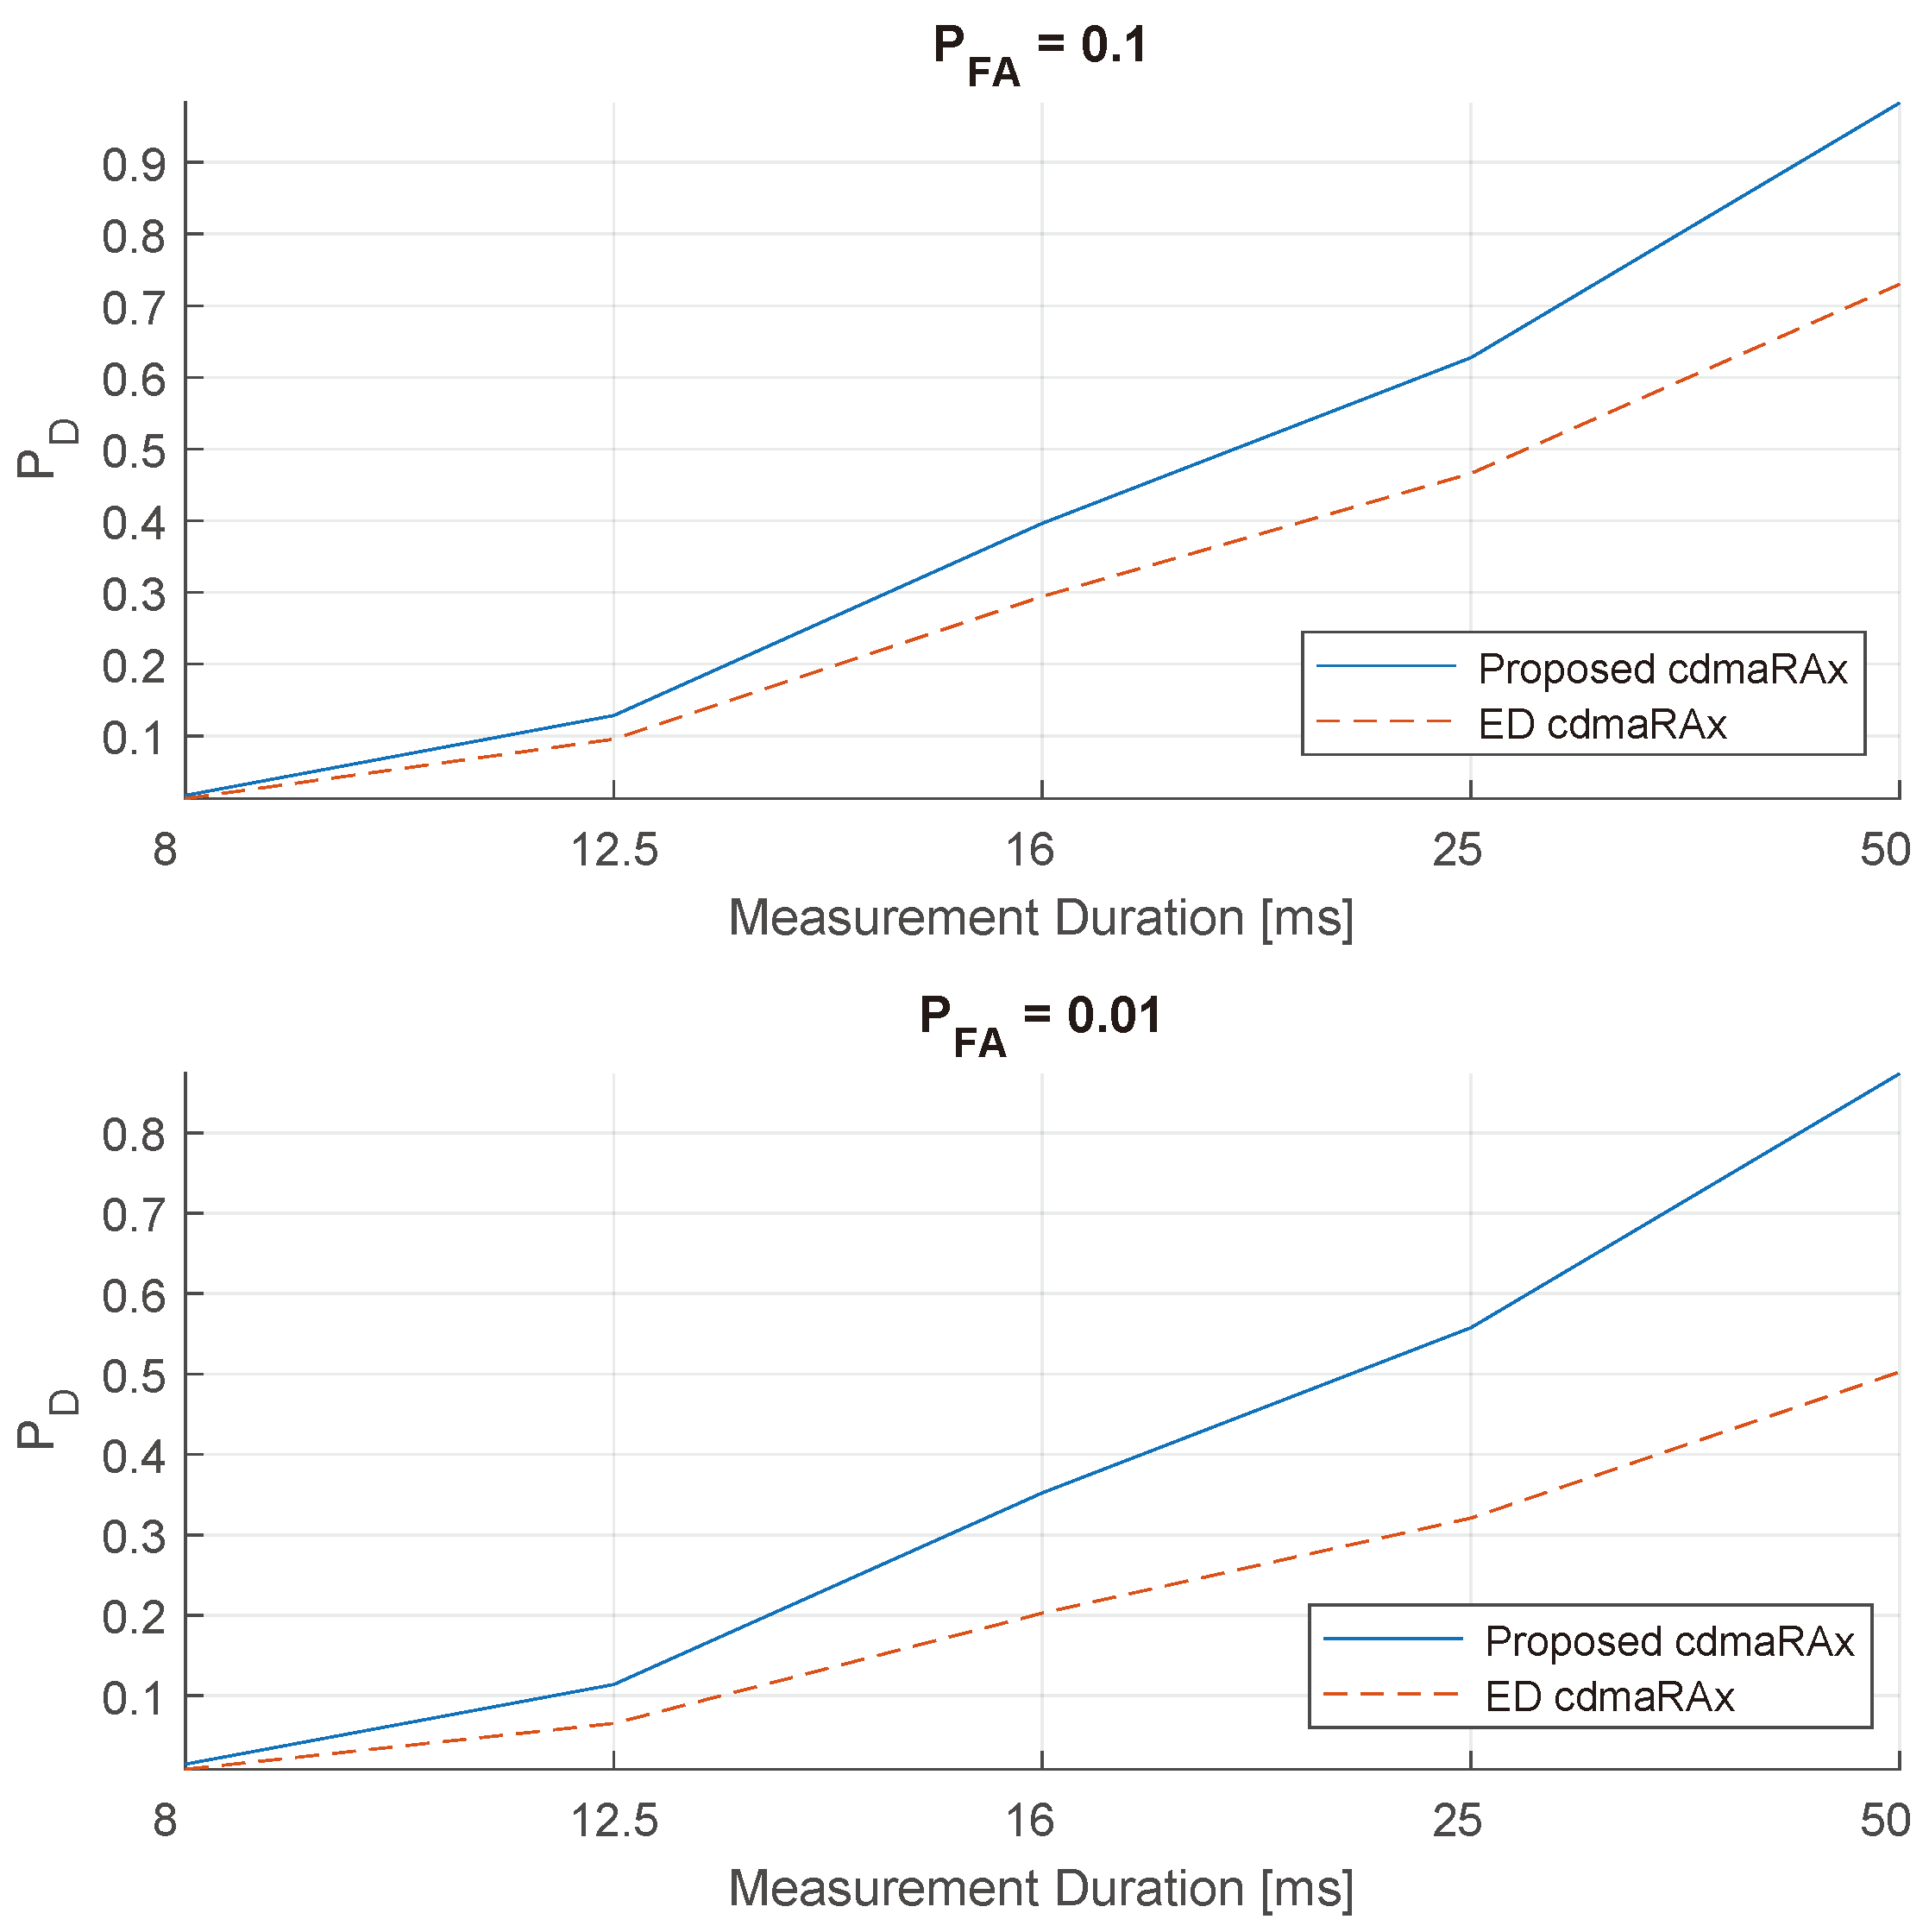
Focusing on the 4-carrier signals, in Figure 8, the performance of the proposed method and ED are considered for different measurement durations, particularly for the case of dB and channel. For each case, i.e., , , performance degradation is at the first halving of the data, and even more, around at the second halving which is from 25 ms to 12.5 ms. ED follows a similar trend even though it performs poorer when compared to the proposed method. However, particularly at the , the performance difference becomes much more obvious. Please note that the same trend with corresponding values is observed for other SNR levels and channel characteristics with some minor deviations. Therefore, a single snapshot case is considered sufficient to observe the general trend.
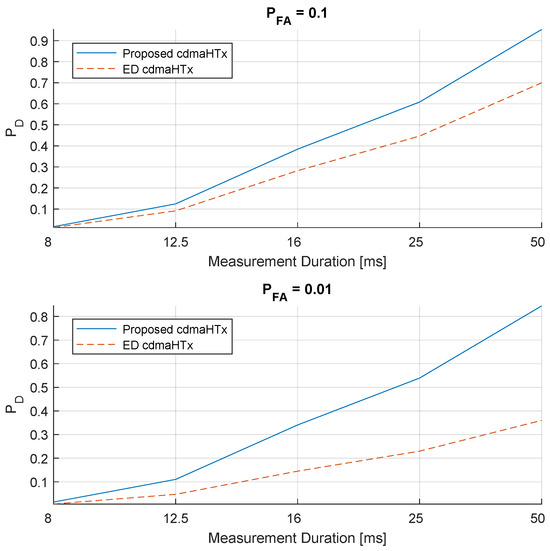
Figure 8.
The 4-carrier signal: The detection performance of the proposed method vs. ED for different measurement durations under hilly terrain channel conditions. dB. First sub-figure is at , and second is at .
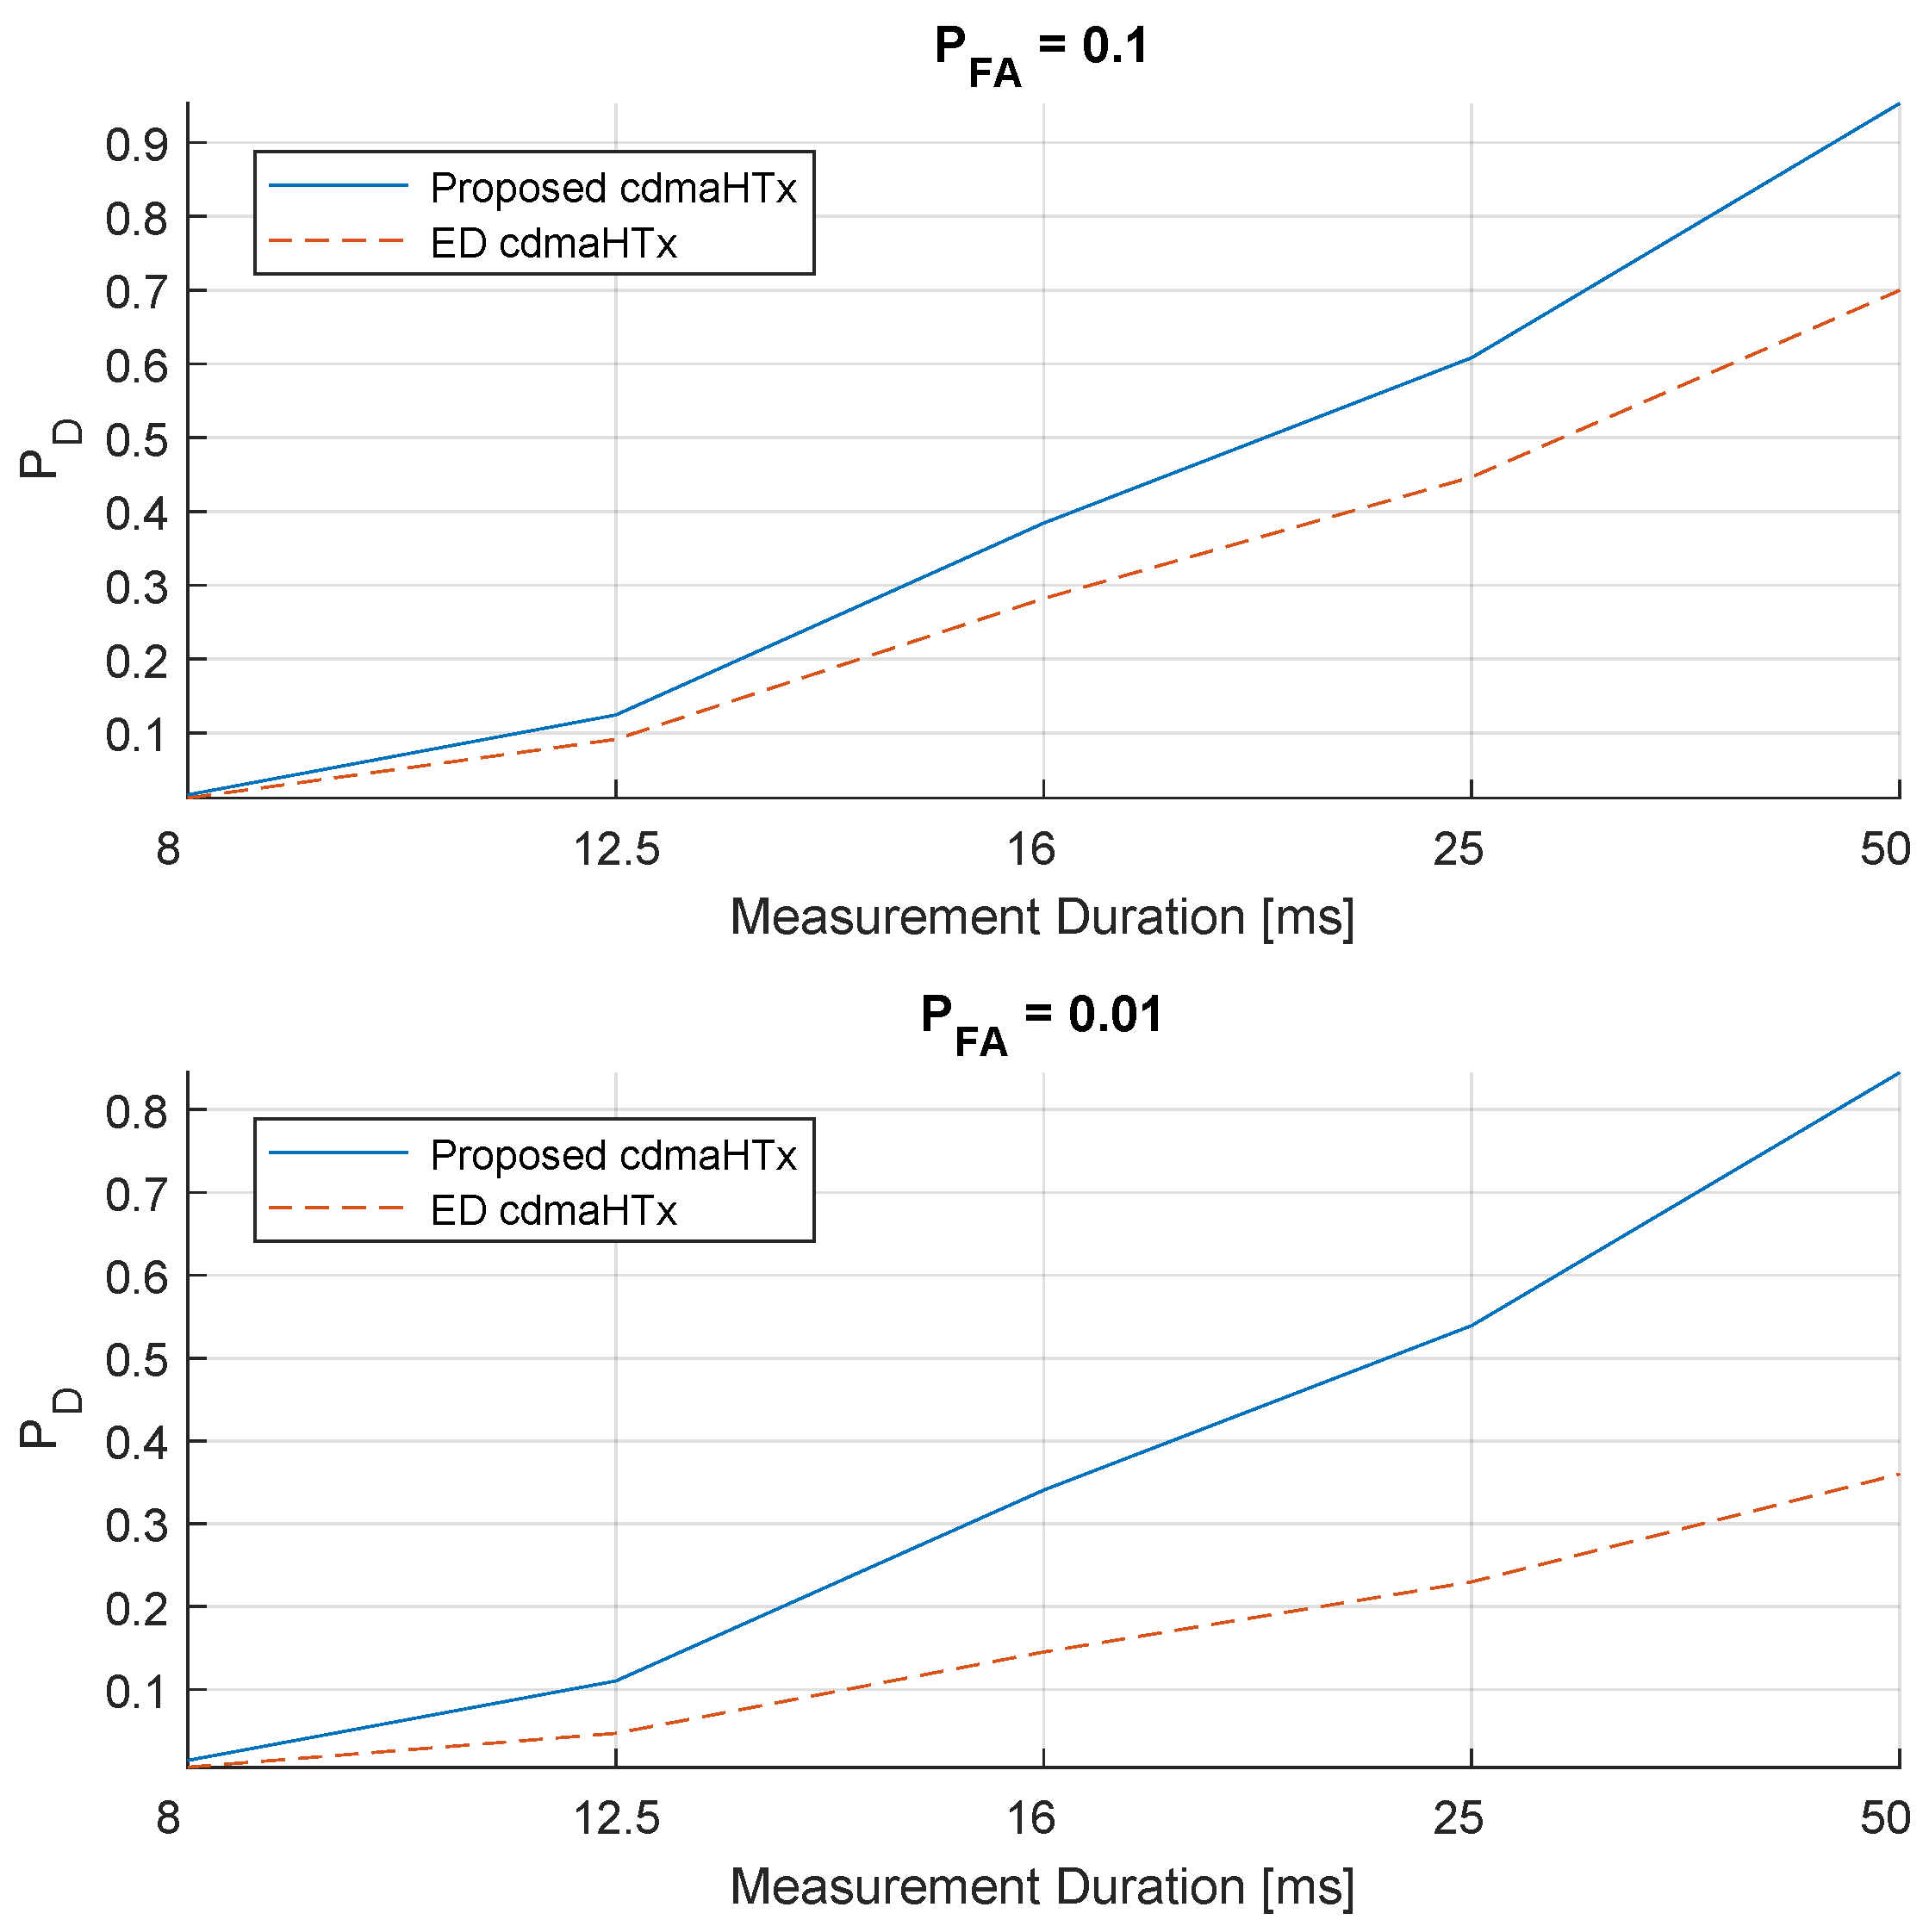
Similar to the previous case, the second analysis in the same context focuses on 3-carrier signals. Figure 9 depicts the performance of the proposed method and ED again for different measurement durations, particularly for the case of dB and this time hilly terrain () channel. For the case, a similar trend to the 4-carrier case is observed; however, ED performance deteriorates worse when compared to in this particular case at , which is compatible with the theoretical findings of the previously mentioned works. Eventually, these results in general indicate that measurement duration or number of samples included in the process has a significant influence on the performance of the proposed method and a certain number of samples should be collected to make sure that robust results are achieved.
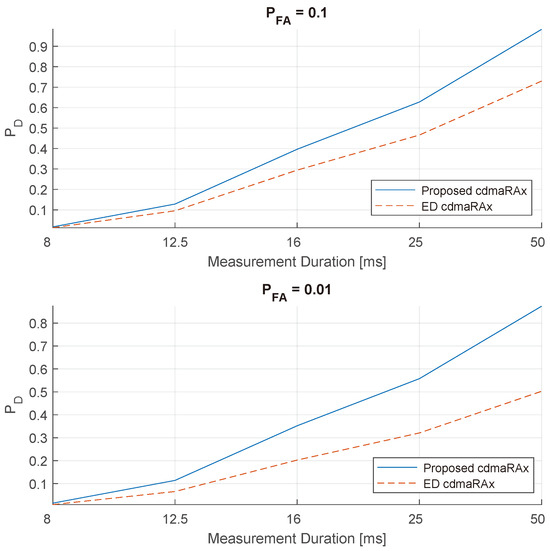
Figure 9.
The 3-carrier signal: The detection performance of the proposed method vs. ED for different measurement durations under hilly terrain channel conditions. dB. First sub-figure is at , and second is at .
6.2. Carrier-Based Analysis
In this section, the carrier-by-carrier detection performance of the proposed method is investigated to understand how the results change in terms of carriers and under different channel conditions. To this end, the 4-carrier signal is selected for analysis. Leaving the zero-lag correlations aside, three carriers detected became the focus of analysis. Thus, the detection performance of the method is plotted for various SNR levels, under the four channel conditions listed in Table 2, again considering for both , and .
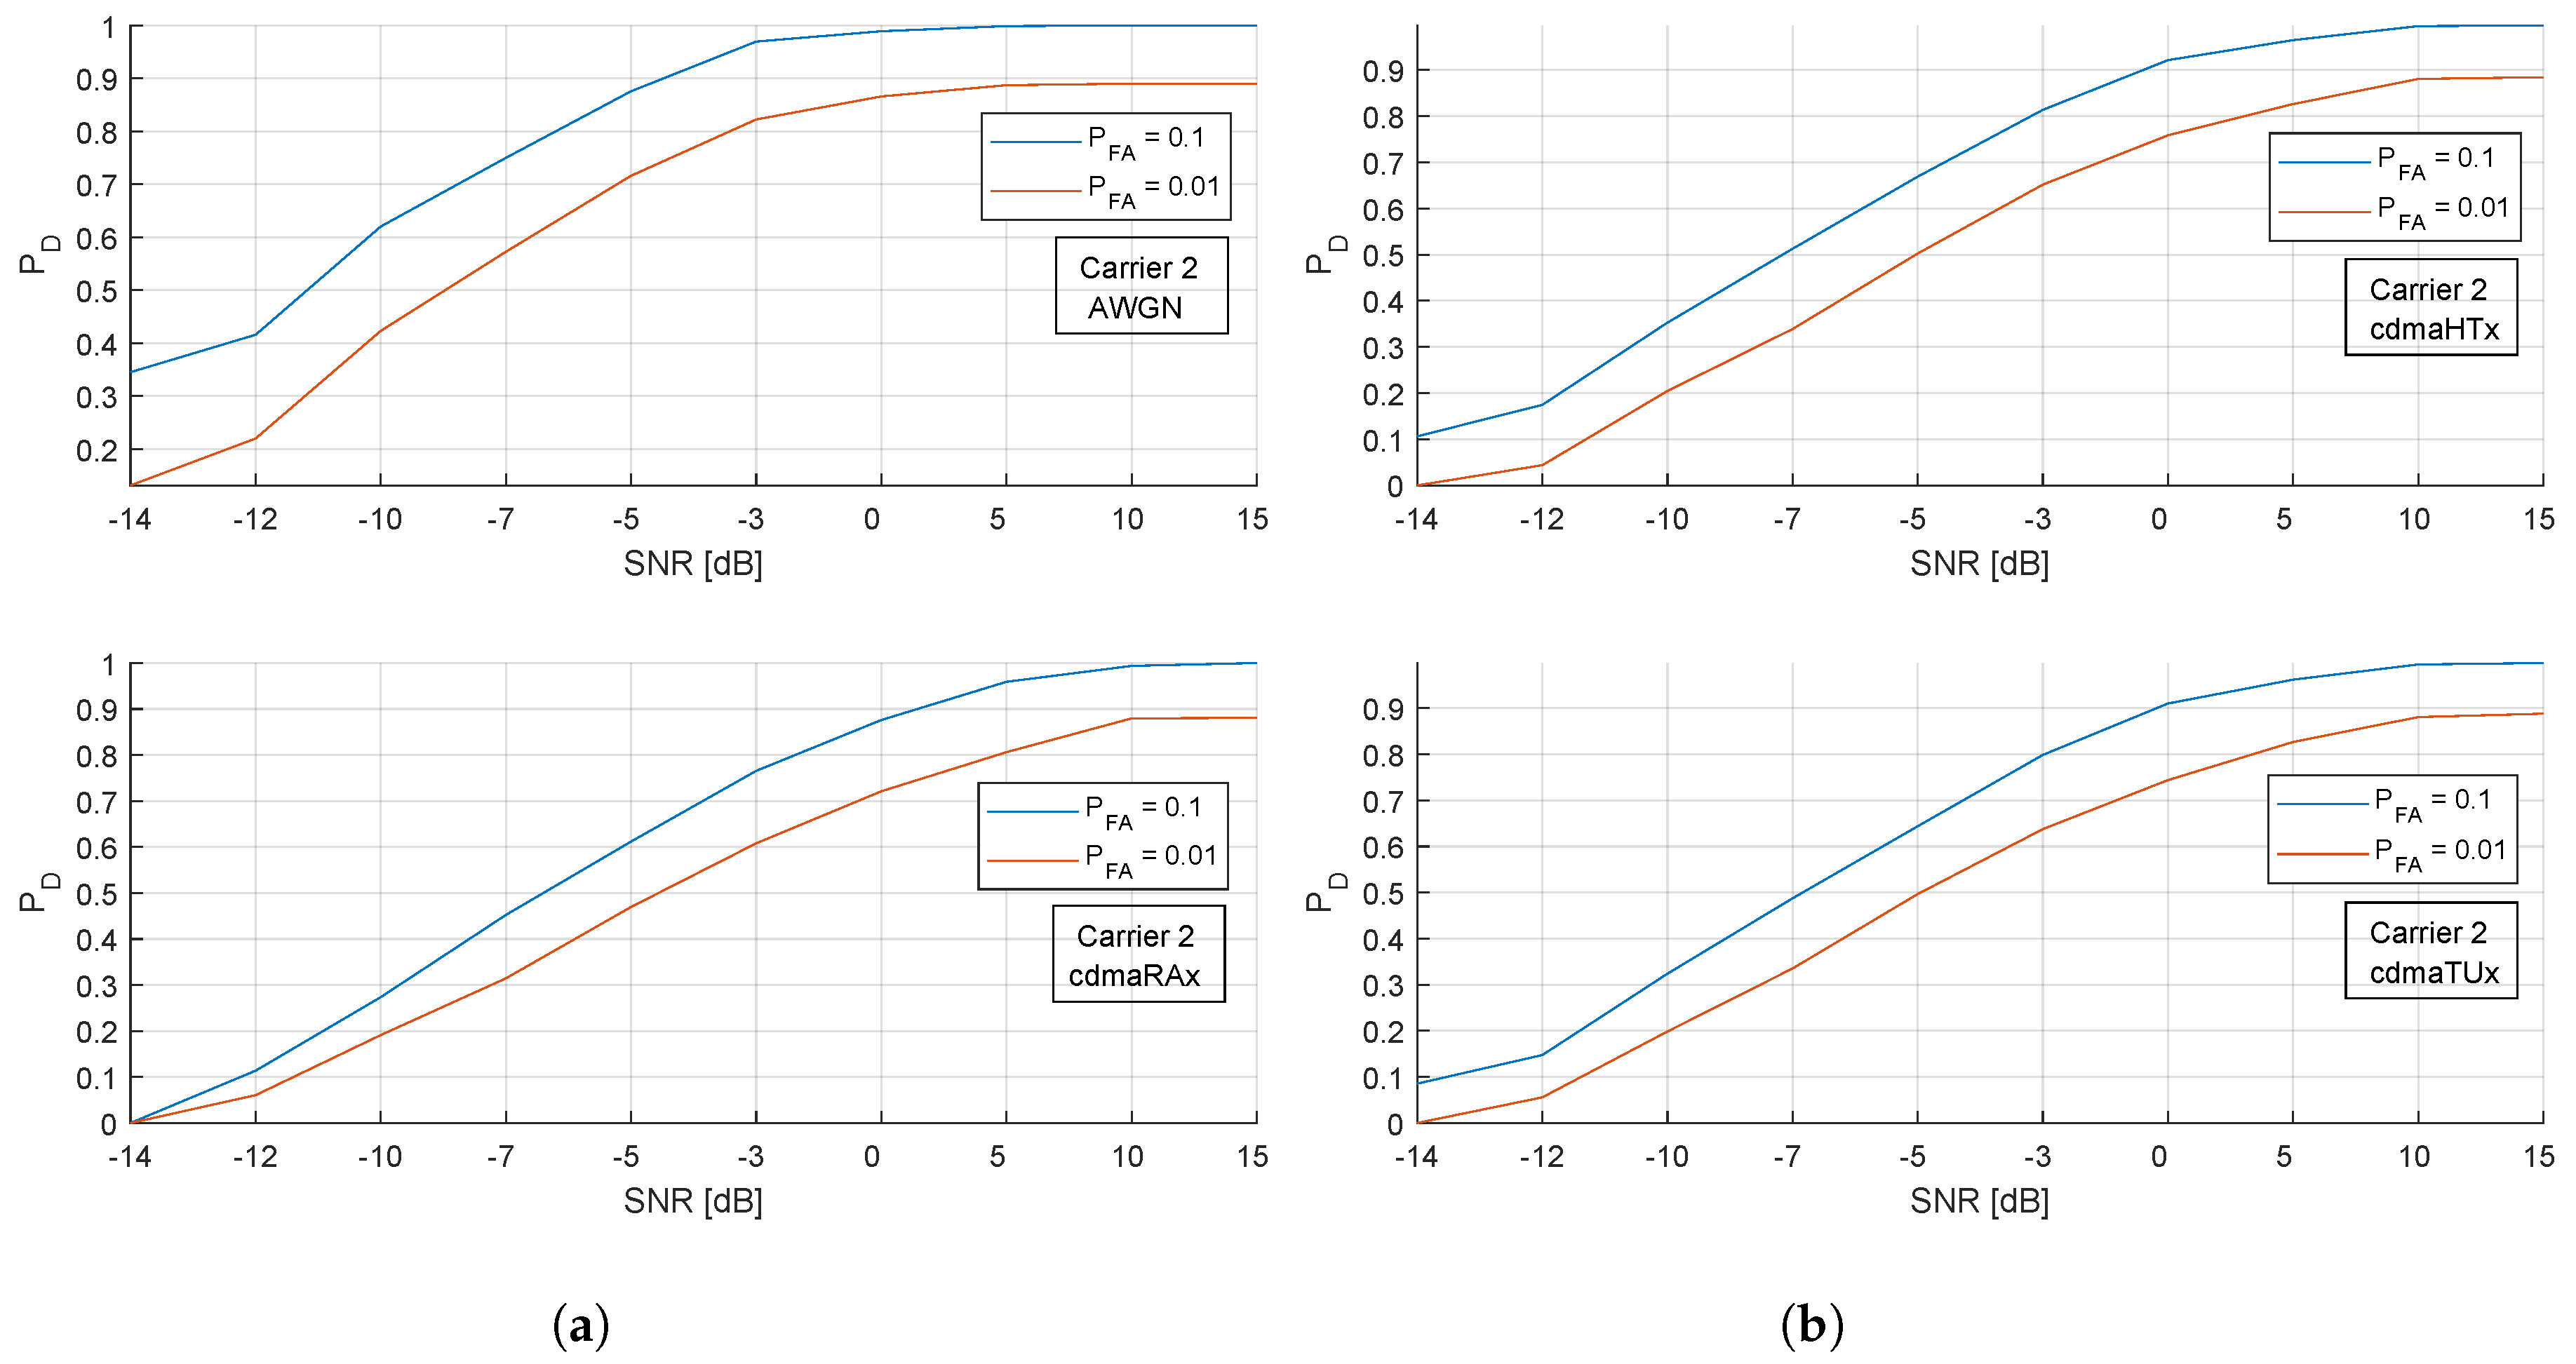
In Figure 10, four figures each with two plots provide a general overview of the performance of the proposed method for the second carrier. In the case of , the method performs best in conditions. On the other hand, even though some local changes are observed, the method performs in a similar way for other channel models indicating robustness of the method against varying channel conditions. In the case of , some level of distinction is observed in the results, meaning that under the method performs marginally better when compared to and , meaning that in this margin of channel conditions start to impose their effects.
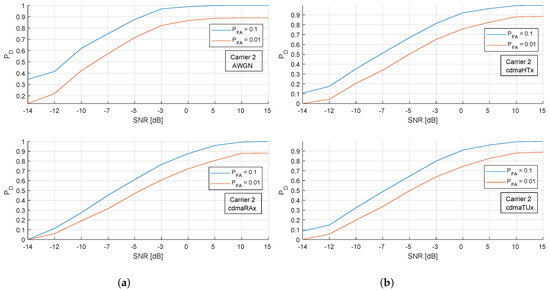
Figure 10.
The 4-carrier signal: Detection performance of the second carrier comparable to four different channel conditions for the case of , and . (a) vs. under and , (b) vs. under and .
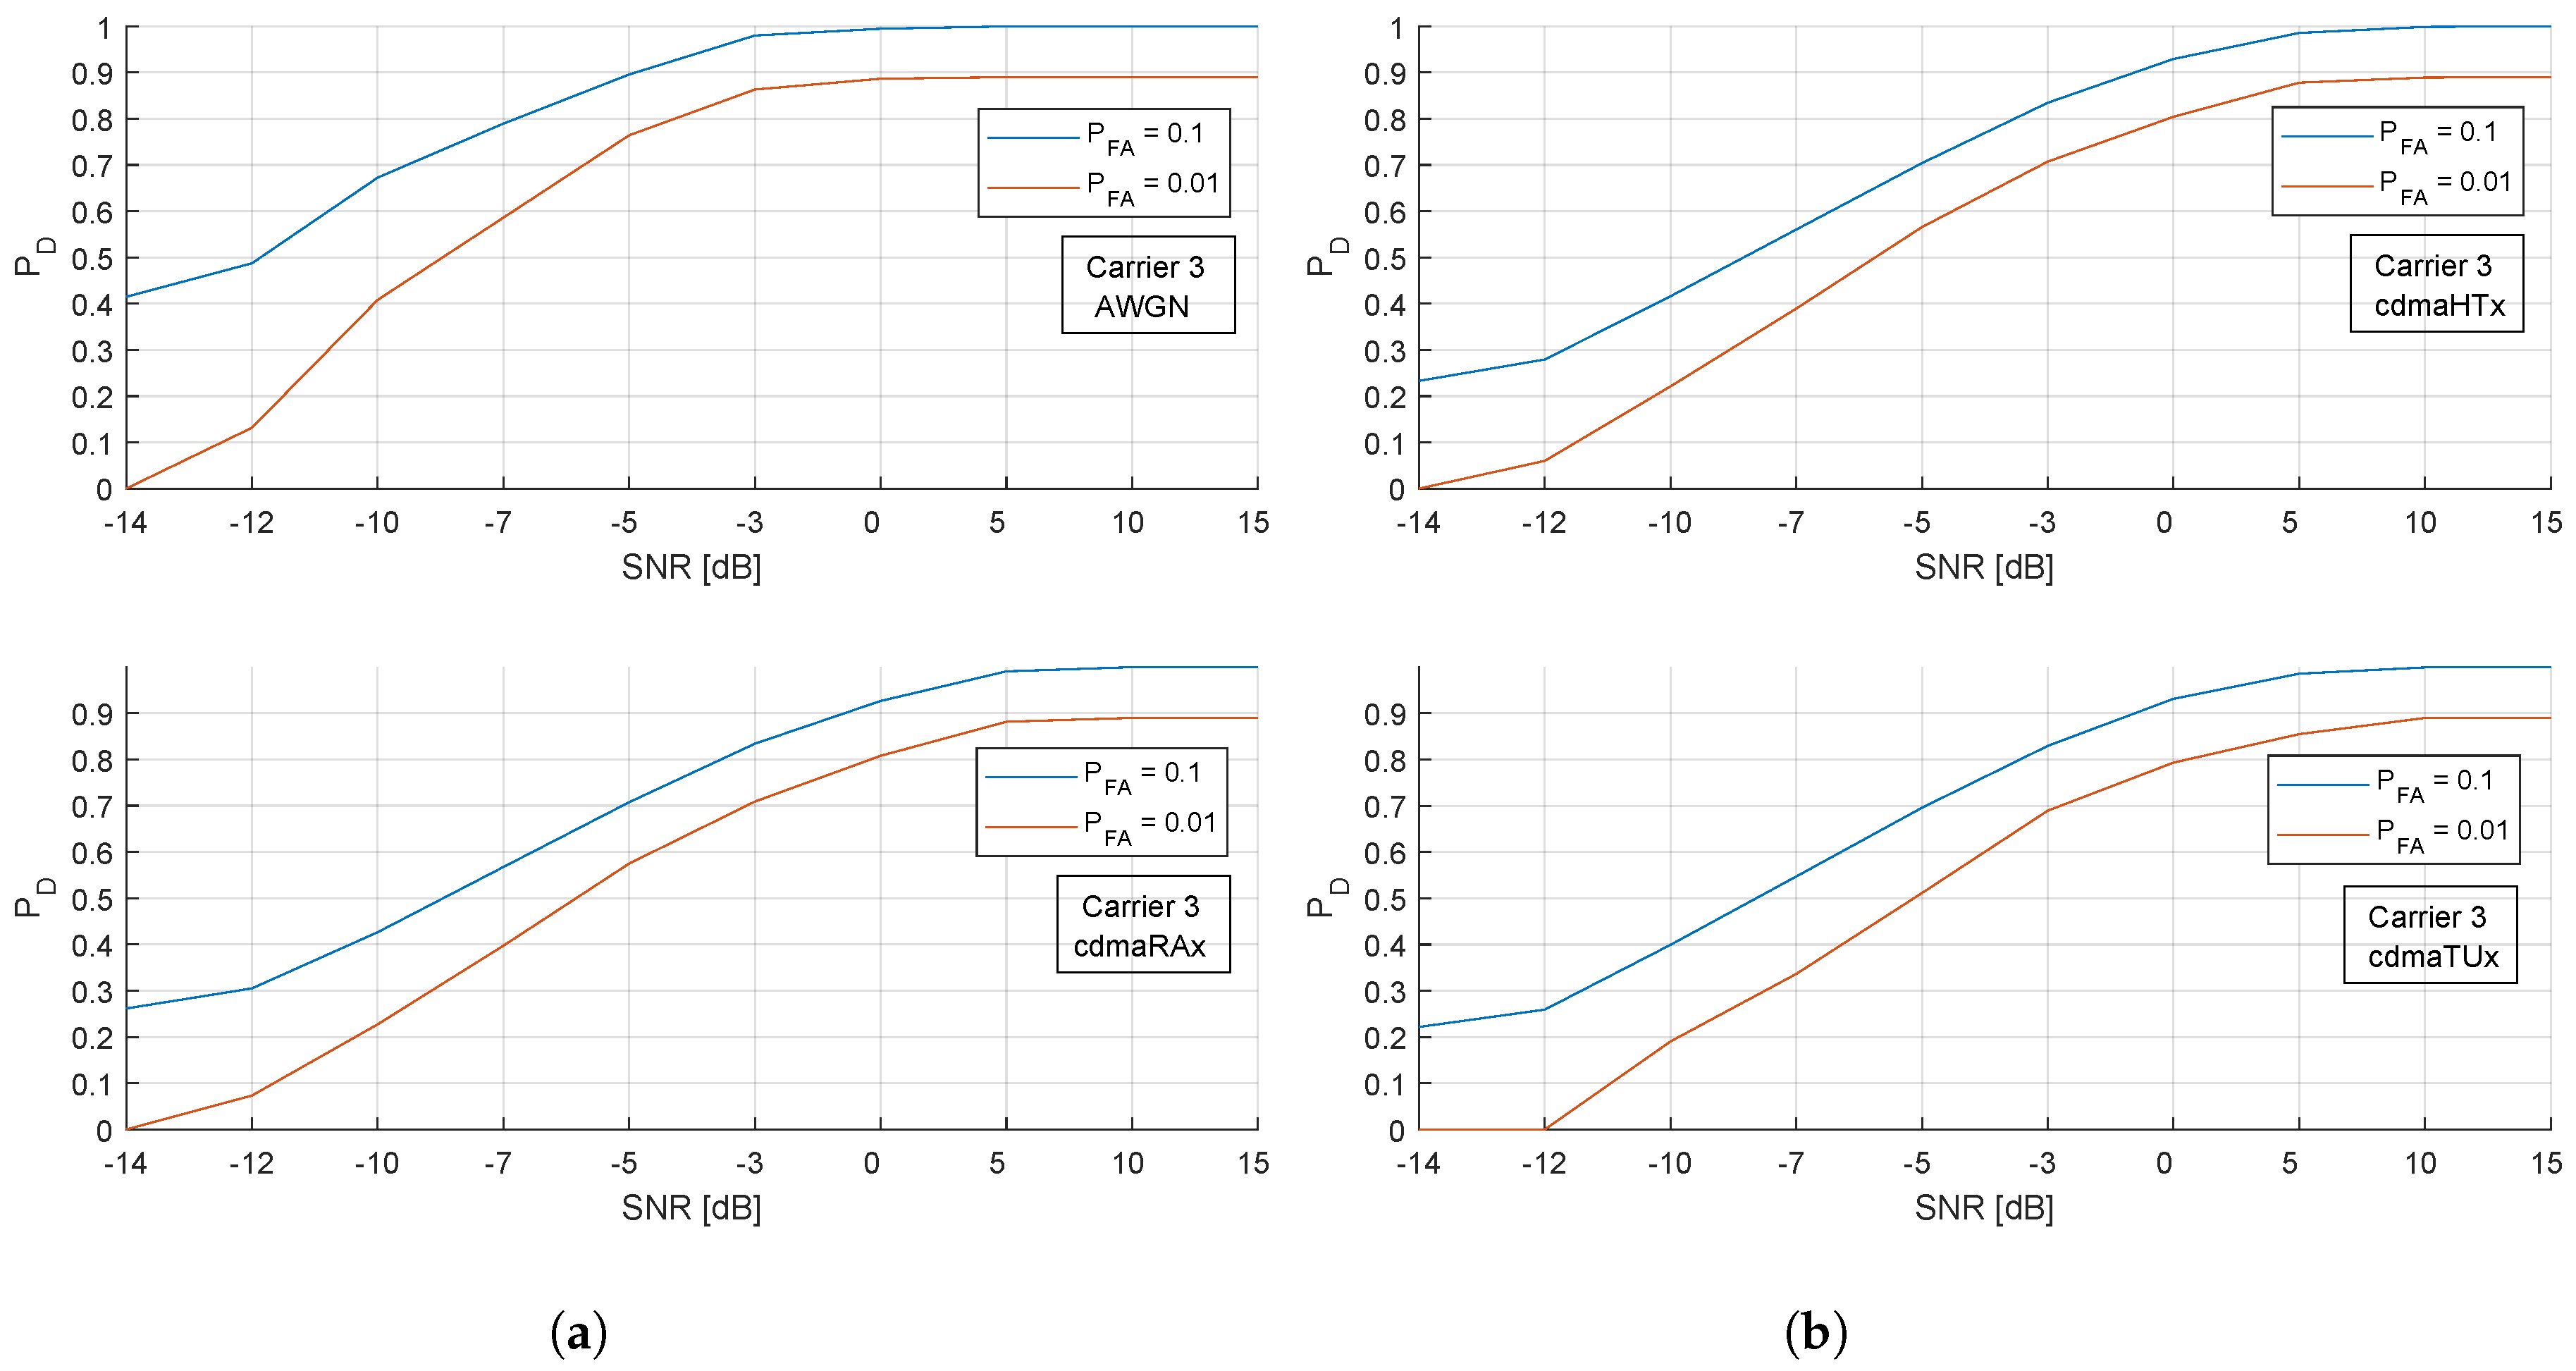
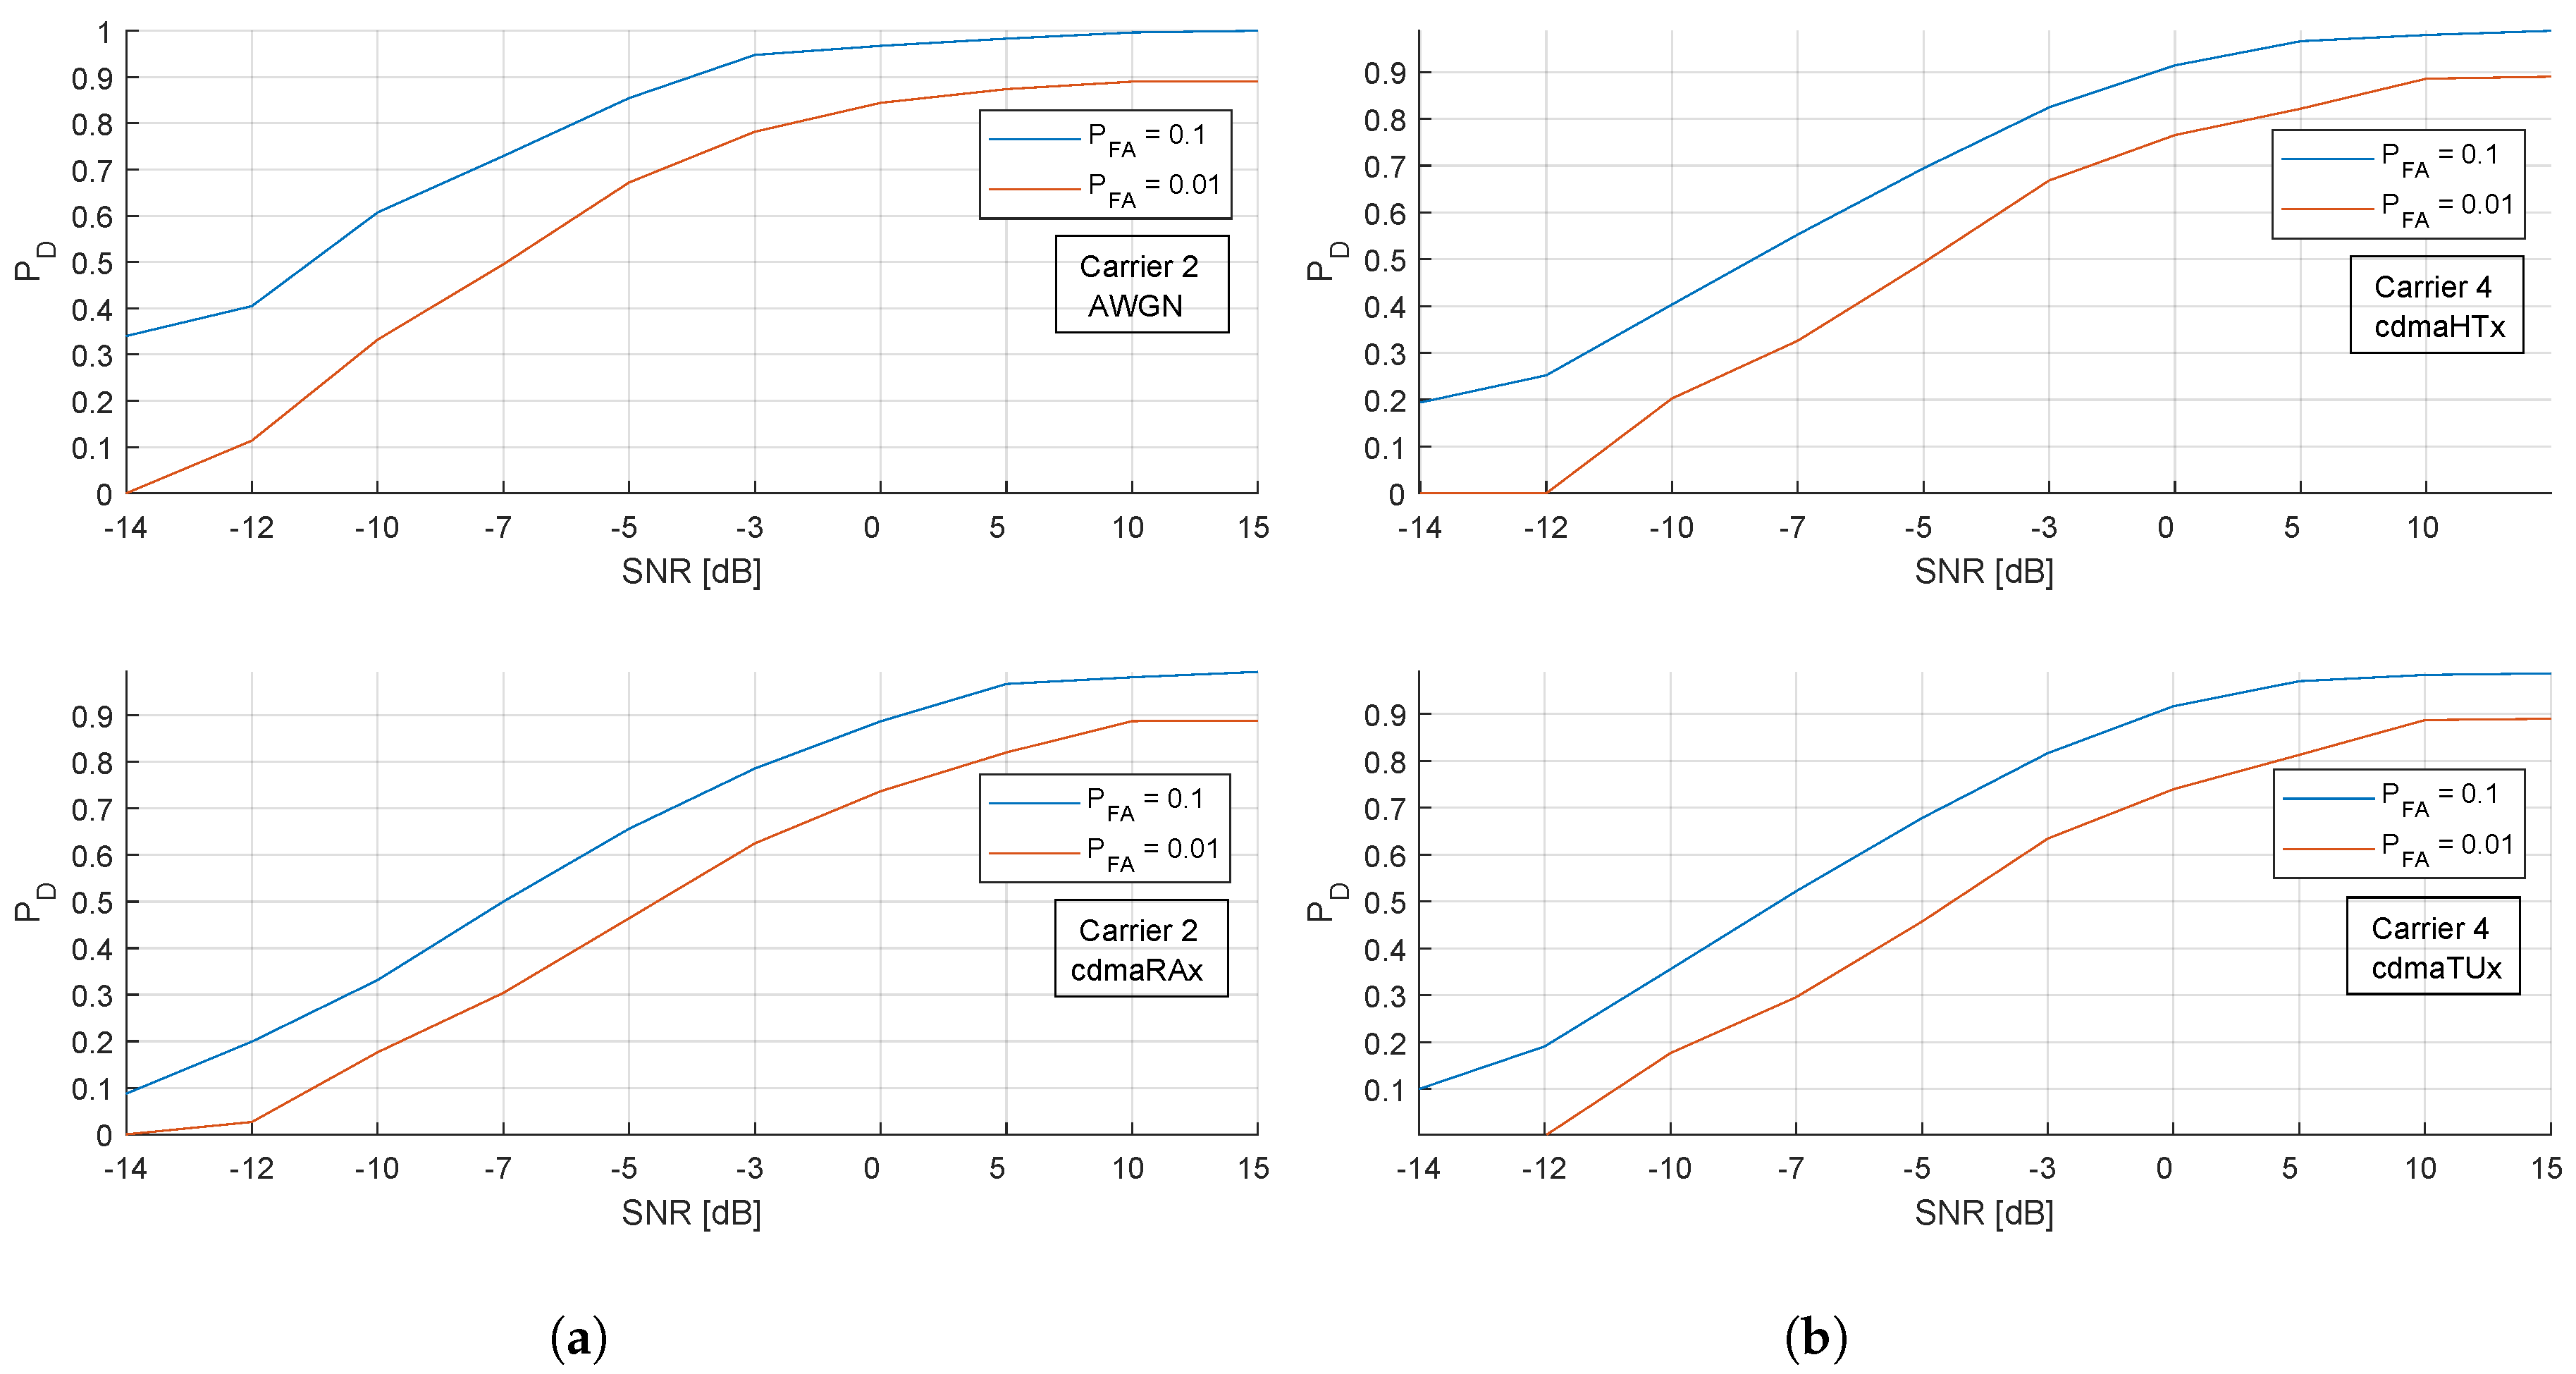
Figure 11 illustrates the same setting for the third carrier detected. It is observed that the same pattern with that of carrier two. However, in this case, performance of case deteriorates more when compared to the previous carrier, especially in the very low-SNR region. The same trend can also be observed for the fourth carrier in Figure 12, which indicates a distinguishing feature for the second carrier. However, the detection statistics in these regions are already very low and away from the significant zone of detection. In general, these results indicate that the proposed method provides strong performance independent of channel conditions down to the low-SNR region of 0 dB without any prior information.
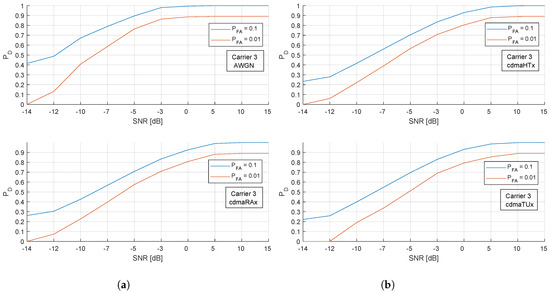
Figure 11.
The 4-carrier signal: Detection performance of the third carrier comparable to four different channel conditions for the case of , and . (a) vs. under and , (b) vs. under and .
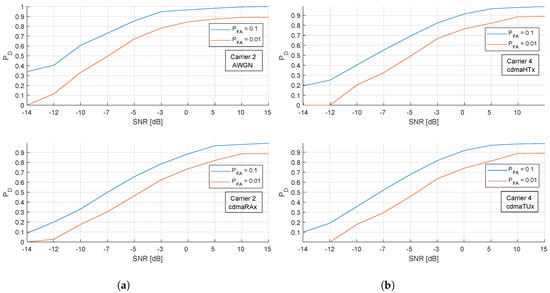
Figure 12.
The 4-carrier signal: Detection performance of the fourth carrier comparable to four different channel conditions for the cased of , and . (a) vs. under and , (b) vs. under and .
7. Discussion
In this paper, a blind carrier number and spacing estimation method is developed for carrier-aggregated DSSS cellular signals. The introduced method accurately and precisely provides these parameters along with the unique chip rate of the DSSS signal, which leads to the joint identification of the signal type in addition to the estimated parameters. Since chip rate estimation is vastly studied in the cyclostationary feature detection literature, this result is evaluated as a side benefit. The proposed method performs better than the ED technique, which is compatible with the available literature on the subject. Please note that since the SCF is computed for , the implementation complexity introduced is also minimal. The proposed method is robust against wireless channel impairments ranging from urban to rural and hilly terrain. However, the method is susceptible to the measurement duration as also the literature indicates. In general, for a certain measurement duration, the method performs strongly even under low-SNR regimes.
In terms of future work, since artificial intelligence (AI) started to imply significant improvements, especially in the area of signal estimation and detection [28], many new techniques based on convolutional neural networks and deep reinforcement learning methods have been proposed. Therefore, for the future work of this study, an advanced neural network can be developed and trained by the SCFs that are derived in this paper. Then, performance of the proposed method and that of the AI-based can be compared.
Funding
This research has not received any external funding.
Data Availability Statement
The data presented in this study are available on request from the corresponding author. The measurement results obtained in this study are not currently available for public utilization.
Conflicts of Interest
The authors declare no conflicts of interest.
References
- Mazzenga, F.; Vatalaro, F. Parameter estimation in CDMA multiuser detection using cyclostationary statistics. Electron. Lett. 1996, 32, 179–181. [Google Scholar] [CrossRef]
- Zhang, Y.; Luo, Z. A Deep-Learning-Based Method for Spectrum Sensing with Multiple Feature Combination. Electronics 2024, 13, 2705. [Google Scholar] [CrossRef]
- Jazdzewski, R.; Lopatka, J. Detection of direct sequence spread spectrum signals in the presence of harmonic and narrowband interferences. In Proceedings of the 2001 MILCOM Proceedings Communications for Network-Centric Operations: Creating the Information Force, McLean, VA, USA, 28–31 October 2001. [Google Scholar]
- Oner, M.; Jondral, F. Air interface recognition for a software radio system exploiting cyclostationarity. In Proceedings of the IEEE 15th International Symposium on Personal, Indoor and Mobile Radio Communications, Location of Conference, Barcelona, Spain, 5–8 September 2004. [Google Scholar]
- Mazzenga, F. Blind Adaptive Parameter Estimation for CDMA Systems using Cyclostationary Statistics. Signal Process. Lett. 2000, 11, 495–500. [Google Scholar] [CrossRef]
- Asai, T.; Benjebbour, A.; Yoshino, H. Recognition of CDMA signals with orthogonal codes using cyclostationarity. In Proceedings of the IEEE 6th Workshop on Signal Processing Advances in Wireless Communications, New York, NY, USA, 5–8 June 2005. [Google Scholar]
- Lundén, J.; Koivunen, V.; Huttunen, A.; Poor, H.V. Spectrum sensing in cognitive radios based on multiple cyclic frequencies. In Proceedings of the IEEE 2nd International Conference on Cognitive Radio Oriented Wireless Networks and Communications, Orlando, FL, USA, 1–3 August 2007. [Google Scholar]
- Deng, Z.; Shen, L.; Bao, N.; Su, B.; Lin, J.; Wang, D. Autocorrelation based detection of DSSS signal for cognitive radio system. In Proceedings of the IEEE International Conference on Wireless Communications and Signal Processing, Location of Conference, Nanjing, China, 9–11 November 2011. [Google Scholar]
- Rahman, M.L.; e Silva, P.F.; Lohan, E.-S. Cyclostationarity-based spectrum sensing properties for signals of opportunity. In Proceedings of the IEEE 10th International Conference on Wireless and Mobile Computing, Networking and Communications, Larnaca, Southern Cyprus, 8–10 October 2014. [Google Scholar]
- Yu, Z.; Guo, L.; Qi, L. Blind estimation of multicarrier CDMA sub-carrier frequencies based on the high-order cyclic cumulants. In Proceedings of the IEEE 5th International Conference on Wireless Communications, Networking and Mobile Computing, Beijing, China, 24–26 September 2009. [Google Scholar]
- Sisi, C.A.O.; Zhang, W. Carrier frequency and symbol rate estimation based on cyclic spectrum. J. Syst. Eng. Electron. 2020, 31, 37–44. [Google Scholar]
- Kim, K.; Akbar, I.A.; Bae, K.K.; Um, J.S.; Spooner, C.M.; Reed, J.H. Cyclostationary approaches to signal detection and classification in cognitive radio. In Proceedings of the 2nd IEEE International Symposium on New Frontiers in Dynamic Spectrum Access Networks, Dublin, Ireland, 17–20 April 2007. [Google Scholar]
- Wei, Y.; Fang, S.; Wang, X.; Huang, S. Blind estimation of the PN sequence of a DSSS signal using a modified online unsupervised learning machine. Sensors 2019, 19, 354. [Google Scholar] [CrossRef] [PubMed]
- Choi, H.; Moon, H. Blind estimation of spreading sequence and data bits in direct-sequence spread spectrum communication systems. IEEE Access 2020, 8, 148066–148074. [Google Scholar] [CrossRef]
- Mohammadi, Z.; Zaimbashi, A. Parallel multiband spectrum sensing in lte-based cognitive radios. IEEE Trans. Veh. Technol. 2024, 73, 13193–13205. [Google Scholar] [CrossRef]
- Bedir, O.; Ekti, A.R.; Ozdemir, M.K. Exploring Deep Learning for Adaptive Energy Detection Threshold Determination: A Multistage Approach. Electronics 2023, 12, 4183. [Google Scholar] [CrossRef]
- Iwamura, M.; Etemad, K.; Fong, M.H.; Nory, R.; Love, R. Carrier aggregation framework in 3GPP LTE-advanced. IEEE Commun. Mag. 2010, 48, 60–67. [Google Scholar]
- Tsatsanis, M.K.; Giannakis, G.B. Optimal decorrelating receivers for DS-CDMA systems: A signal processing framework. IEEE Trans. Signal Process. 1996, 44, 3044–3055. [Google Scholar] [CrossRef] [PubMed]
- Ghauri, I.; Slock, D.T.M. Linear receivers for the DS-CDMA downlink exploiting orthogonality of spreading sequences. In Proceedings of the 32nd Asilomar Conference on Signals, Systems and Computers, Pacific Grove, CA, USA, 1–4 November 1998; pp. 650–654. [Google Scholar]
- Bottomley, G.E. Block equalization and generalized MLSE arbitration for the HSPA WCDMA uplink. In Proceedings of the IEEE VTC Fall 2008, Calgary, AB, Canada, 21–24 September 2008. [Google Scholar]
- Gardner, W.A. Gardner, Exploitation of spectral redundancy in cyclostationary signals. IEEE Signal Process. Mag. 1991, 8, 14–36. [Google Scholar] [CrossRef]
- Gardner, W.A. Statistical Spectral Analysis: A Nonprobabilistic Theory; Prentice Hall: Englewood Cliffs, NJ, USA, 1987. [Google Scholar]
- Gu, H.-Q.; Liu, X.-X.; Xu, L.; Zhang, Y.-J.; Lu, Z.-M. DSSS Signal Detection Based on CNN. Sensors 2023, 23, 6691. [Google Scholar] [CrossRef] [PubMed]
- Boulogeorgos, A.A.A.; Chatzidiamantis, N.D.; Karagiannidis, G.K.; Georgiadis, L. Energy detection under RF impairments for cognitive radio. In Proceedings of the IEEE International Conference on Communication Workshop (ICCW), London, UK, 12 June 2015; pp. 955–960. [Google Scholar]
- Nasser, A.; Al Haj Hassan, H.; Abou Chaaya, J.; Mansour, A.; Yao, K.-C. Spectrum sensing for cognitive radio: Recent advances and future challenge. Sensors 2021, 21, 2408. [Google Scholar] [CrossRef] [PubMed]
- Mariani, A.; Giorgetti, A.; Chiani, A. SNR wall for energy detection with noise power estimation. In Proceedings of the IEEE International Conference on Communications, Kyoto, Japan, 5–9 June 2011; pp. 1–6. [Google Scholar]
- Tandra, R.; Sahai, A. SNR walls for feature detectors. In Proceedings of the IEEE International Symposium on New Frontiers in Dynamic Spectrum Access Networks, Dublin, Ireland, 17–20 April 2007; pp. 559–570. [Google Scholar]
- Zhang, Y.; Luo, Z. A Review of Research on Spectrum Sensing Based on Deep Learning. Electronics 2023, 12, 4514. [Google Scholar] [CrossRef]

Disclaimer/Publisher’s Note: The statements, opinions and data contained in all publications are solely those of the individual author(s) and contributor(s) and not of MDPI and/or the editor(s). MDPI and/or the editor(s) disclaim responsibility for any injury to people or property resulting from any ideas, methods, instructions or products referred to in the content. |
© 2024 by the author. Licensee MDPI, Basel, Switzerland. This article is an open access article distributed under the terms and conditions of the Creative Commons Attribution (CC BY) license (https://creativecommons.org/licenses/by/4.0/).