Abstract
This study investigates the impact of factors (network coverage, customer service, video calls, and downloading Speed) of 3G and 4G telecommunication services performance on customer satisfaction in the Punjab region of Pakistan. This research indicates how to make strong relations with customers and what factors of the 3G and 4G networks need to be improved to enhance the revenue of telecom operator companies. The study has recognized the four main hypotheses responsible for checking the level of customer satisfaction in the telecommunication industry of Pakistan in the Punjab region. The study depends on essential insights gathered on the arbitrary premise from 300 clients of significant telecom administrators in the Punjab area. The respondents have selected on irregular premises and were welcomed to express their sentiments through an organized survey. A complete questionnaire has been utilized for statistics collection and exists based on the analysis of descriptive measurement, correlation, and regression analysis and analyzed through SmartPLS software. They indicate that the independent variables network coverage, customer service, video calls, and downloading speed are key driving factors of customer satisfaction. Among all independent variables “Internet downloading speed” highly impacts the dependent variable “customer satisfaction” based on 3G and 4G network performance. There are a limited number of studies that focus on customer satisfaction in the telecommunication sector in Pakistan. The study will fill the gap in the literature and help service providers to increase the satisfaction level of their customers and captivate new customers.
1. Introduction
Pakistan is considered one of the broad-minded states of the world in which mobile phone users have grown tremendously. Overall mobile phone customers have enhanced by over 195 million, and there are 116 million 3G and 4G customers in Pakistan as per the record of PTA indicators [1].
There are five major cellular communication services companies in Pakistan, i.e., CMPAK (China Mobile Pakistan), Mobilink (Pakistan Mobile Communications Limited or PMCL), Telenor, Ufone, and WARID, that offer postpaid and prepaid facilities to mobile users. The level of satisfaction with cellular facilities and services clients changes to their prospects and expectations. Until now, 3G and 4G technologies have been launched in Pakistan, and we intend to determine the factors of 3G and 4G network performance on customer satisfaction. Pakistan’s telecom industry, especially cellular service, is one of the fastest-growing industries. Managing customer satisfaction in the cellular industry has undergone considerable change with the advent of a higher bandwidth spectrum and better technology. The recent introduction of mobile number portability has further increased the competition amongst telecom service providers. Our problem is that many telecom organizations have expanded their revenue to enhance the network system and consumer satisfaction. However, the primary concern is which element of their network service needs to be improved in their 3G and 4G network system to increase the company revenue, especially in a developing country. Much research on 1G and 2G and developed countries has been carried out. In this study, the researcher intends to execute the research work on 3G and 4G technology networks in the Punjab region of Pakistan. The significance of our research is to enhance the revenue of Telecom operators by finding those factors which impact customer satisfaction.
Many researchers have researched the factors impacting customer satisfaction, and we have cited the work of enough previous researchers here. So, the previous researchers had worked on factors that affect customer satisfaction in the Telecom sector. Still, the gap is they had not worked on factors that impact customer satisfaction with 3G, and 4G services in Telecom cellular services providers, especially in Punjab, Pakistan. So, our research aims to study the four parameters, i.e., “3G and 4G Network Coverage, customer service, video calls, and downloading speed,” which impact customer satisfaction.
Jere, M.G., and Mukupa, A. (2018) [2] studied customer satisfaction, quality, customer service, price, corporate image, and network coverage. After that, the author found that these parameters were significantly associated with customer satisfaction in the mobile communications industry of Zambia country.
To find the relationship between quality of service and customer satisfaction (Selelo, G. B et al. 2017) [3] researched in the telecommunication sector. The author compared levels and analyzed the determinants for quality of service. The regression results found that credibility, security, tangibility, and assurance were the main dimensions that were passively related to customer satisfaction for all mobile operators.
Also, Chee, V. (2019) [4] proposed a conceptual framework that connected the relationship between customer satisfaction, quality of service, customer retention, and customer loyalty by measuring the quality of service that telecommunication service providers provided. According to the author, service providers should focus on pricing services and network optimization to increase customer satisfaction. Figure 1 shows the factors affecting customer satisfaction in the telecom industry.
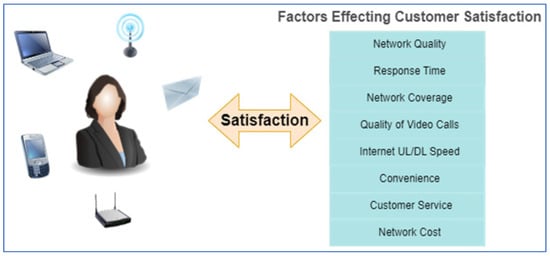
Figure 1.
Factors affecting customer satisfaction in Telecom Industry.
Marvelous et al. (2019) [5], had researched the mobile communication industry of Southern Africa to study the impact of customer-based brand equity on customer satisfaction and brand loyalty. Researchers investigated the impact of perceived quality, brand associations, and brand awareness on customer locality and satisfaction. The results showed that perceived quality, brand associations, brand awareness, brand loyalty, and customer satisfaction had significant positive connections. In addition, customer satisfaction was influenced the most by perceived quality, followed by brand affiliation and brand awareness.
1.1. The Cellular Communication Evaluation and Technologies
1.1.1. 1G Technology
The 1G denotes the first-generation cellular system technology, an analog telecommunications standard announced in the 1970s and introduced in Pakistan from 1990 to the present. I G technology used Frequency Division Multiple Access (FDMA) techniques for audio calling. The main drawbacks of 1 G technology were poor battery lifetime, poor voice quality, large handset size, frequency call drops, no security of audio calls, limited capacity, and poor handoff reliability [6,7].
1.1.2. 2G Technology
The 2G denotes the second generation of cellular telecom systems announced in the 1980s. The Cellular system was oriented and digital to speech with low-statistics speed facilities. Telephones using 2G are used worldwide for mobile communication (GSM) standards. This provides SMS, MMS, GPRS, and voice calling features and uses FDMA [6,7].
1.1.3. 3G Technology
The 3G denotes third generation technology, and they proposed high-speed data facilities in addition to the basic speech ability and uses CDMA, WCDMA radio interface. The 3G technology enhances multimedia amenities to 2G telephones by allowing audio graphics applications and video. You can watch the streaming of matches and movies or have telephonic video calls directly and through the application. In this 3G technology, the capacities increased bandwidth up to 384 Kbps when the device frame was running, up to 128 kbps in a car, and up to 2 Mbps in static applications. However, in short words, the incomings of 3G networks were very high bandwidth required, high spectrum certifying charges, and vast wealth [6,7].
1.1.4. 4G Technology
The 4G is an abbreviation for fourth-generation wireless, the stage of broadband mobile communications that precedes and surpasses 3G and 5G. The launching of every wireless cellular technology has boosted network capacity and bandwidth speeds. Users of 4G may expect speeds of up to 100 Mbps [6,7]. The network architecture of cellular communication technologies (2G, 3G, and 4G) is presented in Figure 2.
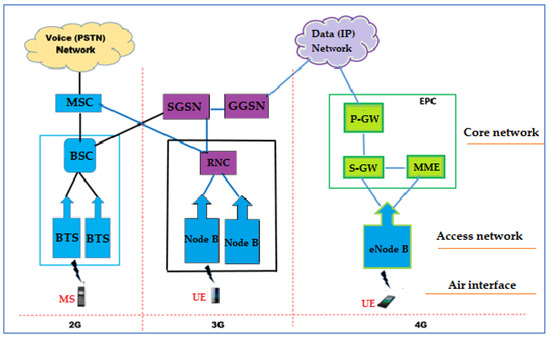
Figure 2.
Network Architecture of Cellular technologies.
1.1.5. 5G Technology
5G refers to the fifth generation of cell phone technology. Following 1G, 2G, 3G, and 4G networks, it is a new international wireless standard. In order to connect practically everyone and everything together, including machines, objects, and devices, 5G enables a new type of network. This innovative technology supports both IPv6 and IPv4. With 5G technology, we can now use our mobile phones globally. This technology has also made its way to the Chinese mobile market, allowing Chinese users to utilize their domestic phones in the United States. The 5G provides improved coverage and a high data rate at the cell’s edge. This technology allows us to obtain 1 Gbps data rates without difficulty. The applications of 5G technology include autonomous driving, high-speed HD video streaming, automated voting, healthcare, education, and e-commerce. The gigabit-scale data broadcasting capacity of 5G technology is close to 65,000 connections [8]. The 5G has a maximum download speed of 1–10 Gbps and an average speed of 50 Mbps. Figure 3 shows the 5G functional architecture [8]. In the 5G network, orthogonal frequency division multiplexing is frequently used [9]. Fifth-generation (5G) wireless network deployment is already accelerating around the world, and researchers are working on sixth-generation (6G) technologies [10]. When compared to 4G, 5G data transfer speeds are expected to increase by a factor of 20, from 1 Gbps to 20 Gbps. As a result of this innovation, users will be able to access data and information much more quickly. This is a significant step forward, especially for the military, emergency services, and rapid response teams. However, better battery solutions will be required because the use of high-powered signal boosters will result in significant battery life loss in 5G-enabled devices [11].
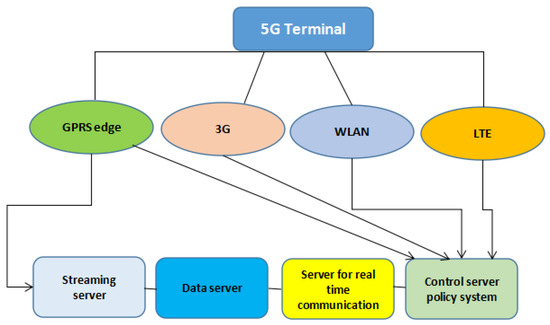
Figure 3.
5G functional architecture [8].
1.2. Machine Learning (ML) Techniques for the Wireless Communications
Machine learning is a subfield of artificial intelligence and computer science that aims to improve system performance by simulating how humans learn from experience and acquire new information. Machine learning techniques, when applied to propagation modeling and wireless communications, can boost both the quantity and quality of data carried over the internet. Channel modeling is required for the development of successful wireless communication systems. It is common practice to collect massive volumes of channel measurement data before using statistical approaches to replicate the channels in concern. By layering channel estimation atop channel modeling, modern mobile communications enable very high bandwidth physical layer transmission for highly mobile communications. In preparation for the expansion of IoT devices and the arrival of 5G networks, there is an immediate need for a more effective approach to channel modeling and channel estimation. Meanwhile, machine learning has demonstrated its ability to handle enormous data volumes [12].
With the proliferation of IoT-connected devices, there will be a greater demand than ever for dependable and secure wireless connectivity (IoT). Spectrum sharing, dynamic spectrum access, signal intelligence extraction, and efficient routing will all play critical roles in the future wireless communication paradigm of the Internet of Things. In order to attain the network’s optimal operating point, IoT devices must learn to independently collect spectrum knowledge from the network and use that knowledge to dynamically adjust crucial wireless settings (such as frequency band, symbol modulation, coding rate, route selection, etc.) [13].
LPWANs, a new IoT model, meet the need for extensive and ongoing sensory data collection. Due to its open-source physical (PHY) layer and standardized networking stack, LoRa (Long Range), an LPWAN technology, is popular in academia and business [14].
There are numerous industrial applications of mobile robots in the modern era. Existing studies of D2D caching schemes rarely account for the deployment of mobile assistive robots in wireless networks [15].
Fault current limiters (FCLs) are becoming increasingly difficult to assign to transmission systems. Utilizing deterministic expected short-circuit fault (SCF) scenarios increases the risk of FCLs being over-configured. The system’s security may also be compromised due to the fact that the prevalent local switching framework (LSF) employs unreliable FCL switching [16].
1.3. Big Data Analysis in Wireless Communication
Big data is simply a term for data that is more varied, plentiful, and arriving more quickly. The introduction of smartphones and other IoT devices paved the path for the current era of mobile big data. Collecting mobile big data is unprofitable unless appropriate analytics and learning approaches are used to uncover critical information and hidden patterns from data [17].
We are currently at capacity to manage the incoming deluge of wireless data from our communication network. Data traffic is pervasive and continuously increasing, threatening to exceed several components of wireless system architecture, such as spectrum efficiency, computer power, and front haul/backhaul connection capacity [18].
The standardization of 5G wireless communications has accelerated, and early commercial 5G services could be available as early as 2018. The 5G communications will usher in the era of big data with the growth of massive devices, one-of-a-kind complicated scenarios, broad frequency bands, massive antenna components, and dense small-cell deployments [19].
“Cloud Computing” (CC) refers to a system that processes and stores data remotely rather than locally on individual mobile devices. Meanwhile, the “modern” sector of wireless telecommunication networks is concerned about the IoT, a new technology that is rapidly gaining prominence [20].
QoS refers to network techniques that maintain the smooth operation of high-priority applications and traffic even when resources are scarce. It is anticipated that data transmission over 5G and beyond WSNs (Wireless Sensor Networks) will skyrocket, especially for multimedia content such as video. As more nodes from the Internet of Things are added to 5G networks, the design difficulty increases (the term “Internet of Things” refers to the network of devices that are all connected to one another). As data volume and network density increase, it becomes more difficult to maintain even the most fundamental level of service quality [21].
The remarkable expansion of wireless data traffic offers design and evolutionary challenges for wireless network architecture, but it also promises considerable opportunities for future network progress and enhancement. As communications and computing technology progress, BSs and UEs near the network’s edge can obtain the complexity and advanced computing and communications capabilities required for big data analytics [22].
It is safe to say that the Internet is a necessary tool that makes daily tasks easier in this data-driven era. User preferences and behavior predictions can help to improve the accuracy of services and information structures [23].
1.4. Contributions of Our Study
As we are living in the customer-centered marketing era, the firm knew it better that if they want their products/services successful then the core product/service must be supported by augmented products and services. The customer-centered idea of product/service increases the value proposition of customers. According to Business Recorder 3G and 4G users in Pakistan were 120.68 million by end of October -2022. Along with internet users for social media, many public departments and universities in Pakistan have introduced the Android App to accurately track attendance with time punctuality. Not only this also the COVID-19 pandemic geared up the idea of virtual workplaces and home-based working.
Keeping in view the above discussion, the key contribution of this work is as follows:
- ⮚
- Emphasizing the factors which increase customer value.
- ⮚
- How each player in the telecom industry can increase its market share?
- ⮚
- How to retain current customers and attract new customers?
- ⮚
- Why 5G is necessary to be introduced in Pakistan without any further delay.
- ⮚
- What technological advancement must need before implementing the 5G network in Pakistan?
2. Related Work
In the Literature review, we describe the analysis effect of the previous study and give the maximum material regarding our research topic. Too much research has been conducted in developed countries on customer satisfaction with 3G and 4G technology. The customer expended many amounts, and telecom operators were huge revenue after introducing the 3G and 4G technology in developed countries. Most revolutionary organizations there were to see buyer satisfaction and fulfillment and how to keep their customers satisfied and glad. At last, with developing rivalry, the breakdown in the 1990s, and the reduction of universal commercial centers, the trade or businesses were bound to take a thoughtful look at client satisfaction fulfillment surveys, especially as surveys have become extra sophisticated. As the importance of customer fulfillment and satisfaction plans became solid, scheming plans to appreciate clients better developed a significant aim for trade and businesses.
By analyzing how customer satisfaction and loyalty functioned as a mediator, the authors hoped to develop and validate a conceptual model of value innovation and its impact on business performance and long-term growth. The conclusions thus provided empirical support for the theoretical research model and illustrated the significance of the value innovation strategy in enhancing both short- and long-term performance [24].
After controlling for demographic variables such as age and level of education, the authors tested the hypothesis that five dimensions of service quality (tangibility, reliability, responsiveness, empathy, and assurance) were predictive of overall customer satisfaction. Even after controlling for demographic variables such as gender, age, and level of education, assurance, tangibility, dependability, and empathy were found to have the largest individual impact on customer satisfaction in terms of service quality dimensions. The significance of demographic factors in determining the success of customer service efforts was emphasized by the study’s findings, which have significant implications for mobile network operators’ market segmentation strategies [25].
Different types of telecommunications customers were studied and compared with respect to their levels of satisfaction, views on the quality of service they receive, opinions on the fairness of prices, confidence in the company’s ability to restore their service after an outage, and the strength of the (stayers and switchers). The results showed that the groups who stayed and those who left had different motivations for their loyalty. The economic, environmental, and social efficiency of the telecommunications sector is all affected by these differences. The research, however, found no distinction between long-term customers and new customers when it came to their opinions on the quality of the service they received [26].
The authors claim that customers of Asiacell’s prepaid services are very happy. The majority of Asiacell’s prepaid mobile customers in Sulaymaniyah, according to the study’s findings, were under the age of 30, and they were very happy with the company’s services. However, it should be noted that Asiacell is required to update some service offerings in response to client expectations, including pricing and query responses [27].
The studies made a significant contribution by providing actionable recommendations to the company based on real-time Twitter monitoring of customer satisfaction and survey analysis. Their data indicates that customer satisfaction with each service ranges between 31.50 and 49.25 percent. To train the machine learning classifier, a random subset of 20,000 tweets from the dataset will be extracted. Additionally, we have experimented with deep-learning networks. The lowest customer satisfaction rating for “internet speed” was 31.5%, and one of the proposed solutions is to use 5G to address this issue [28].
This study’s authors investigated Bahraini customers’ satisfaction levels with their CRM system. The variables chosen include perceived usefulness, perceived ease of use, user support, conducive conditions, and societal influence. Only sixty of the seventy telecom workers who were randomly selected to complete the survey had responses. The results showed that users were satisfied with the CRM system and that there was a significant correlation between the chosen variables and user satisfaction. Customer relationship management (CRM) software is crucial because customers are the single biggest contributor to a company’s bottom line. The study’s contribution is a better understanding of customer satisfaction measurement techniques as well as strategies for strengthening the institution’s customer-centric focus [29].
Although mobile networks are by far the most widely used form of communication, there is a dearth of information regarding the level of service quality and satisfaction felt by mobile network users. The goal of this study was to determine whether customer perceptions of service satisfaction and quality varied according to their mobile network provider. The results demonstrate that both service quality and customer satisfaction are significantly influenced by the mobile network provider. By illuminating the public’s perception of South African mobile network service providers, this study contributes to the academic literature. The study also identifies the advantages and disadvantages of South African mobile network operators in terms of the caliber of their services and their ability to satisfy customers [30].
This author investigated the relationship between customers’ expectations, experiences, and satisfaction and the digital telecommunications infrastructure of the UAE. The study adopts a positivist philosophical stance and employs a quantitative data analysis strategy to survey 130 consumers of the digital solution provided by the UAE telecommunications industry. Independent of generational differences, the study found a significant correlation between customer expectation, customer experience, and the happiness of individuals in the United Arab Emirates in relation to their use or involvement with digital solutions in the telecommunications industry [31].
The authors studied the quality of service from 4G network service providers between the telecommunication services providers in Bhopal city of India. The author compared and evaluated the quality of service of some service providers with other mobile communication operators, i.e., viz. BSNL, Vodafone Idea, Bharti Airtel, and Reliance JIO. As per the author’s results, there was a significant difference in the quality-of-service providers vs. wireless services and a difference observed in the quality of service between service providers vs. broadband services. As a result, the alternative hypothesis (H0) stated that “there is no visible difference between the quality of service and other services which service providers provided” is accepted. Because of considerable variations in the opinions about the network services being followed by service providers [32].
According to Ali, et al. (2021) [33], the profitability of an organization fluctuates based on customer satisfaction. The author said that if the customer is satisfied with company products and services, the company will achieve more profit, and more products will be sold out. The author aimed to find the impact of technical and functional service on quality and customer satisfaction in a company. The author conducted a survey and collected the results from the platforms used by customers for online meetings and academic matters. Finally, the author concluded that customer satisfaction and loyalty were being affected by privacy issues.
Furthermore, according to Shava, H. (2021) [25], brand protection, market share growth, and customer loyalty are all dependent on customer satisfaction. He surveyed service quality variables such as reliability, tangibility, responsiveness, and assurance empathy and fixed customer factors such as sex, age, and education level, which forecast customer satisfaction. After adjusting for sex, age, and education level, service quality characteristics mentioned above-improved customer satisfaction, while responsiveness made a modest unique contribution. He showed that demographic factors play a key role in ensuring that customer care efforts get the desired outcomes.
The authors examined the modeling of brand loyalty in the Nigerian telecommunication sector. In his research study, he used questionnaires for data collection. He utilized the subscribers of Globacom, 9Mobile, Airtel, MTN, and other mobile operators in some of the universities in Nigeria and online assistance from respondents from 20 different universities. The total sample size of the author was 7600 respondents, of which 4736 persons returned the complete questionnaire. After the results of the survey author concluded that if the losses and pattern of retention continued for a long time, then Globacom will retain 35%, 9Mobile will retain 16%, Airtel will retain 27%, MTN will retain 21% of GSM subscribers in Nigeria, and others mobile operators will retain 1%. [34].
Further, Dhasan et al. (2021) [35] conducted research in the telecommunication market of Thailand, and Quota sampling was utilized, with a total sample size of 798 prepaid and postpaid subscribers. According to the author’s survey, technical service quality is one of the most important characteristics of maintaining a continuous subscription, boosting customer interaction and loyalty.
According to Laghari et al., the number of services available over the Internet has increased exponentially over the last decade because services such as online gaming and voice-over I.P. have gained popularity. Instead of storing and processing the data in the system has taken place by cloud. That is why QoE (quality of experience) is a big concern for users. The author has described the QoE in different technologies, products, and services for subscribers’ needs and satisfaction. The author also highlighted the recent quality of experience (QoE) innovations in multimedia services, network management, VoIP, web development, gaming, and cloud computing [36].
Likely the primary goal of Kubasu, K. [37], research was to look at the variables that influence customer satisfaction in Kenya’s mobile cellular sector. His study was based on the theory of reasoned action and the American customer satisfaction index. According to the author’s findings, promotional, functional, inventive, and emotional value is significantly associated with consumer satisfaction. Customer satisfaction was most influenced by functional and innovative value but moderately influenced by emotional and promotional value. Finally, the author suggested that the proper implementation of all variables results in high consumer satisfaction with mobile cellular enterprises’ products and services.
In the same way, Khan et al. [38] had been conducted a survey-based analysis to find the factors which can fulfill customer satisfaction in the telecommunication industry. To find the overall CEMI, he used six features of cellular service such as the quality of voice calls, network coverage, a call drop rate, internet services, duration of a call setup, and delivery of SMS. From the survey results, the author found that signal strength, network coverage, and voice quality were the key factors that have highly impacted customer satisfaction.
Mahrinasari, et al. (2020) [39] researched the Indonesian Telecommunication market to examine the factors influencing customer loyalty and satisfaction. The researcher used a survey designed and selected 400 respondents. He used a sampling technique of non-probabilistic random, and through SEMS analysis, he analyzed the obtained data. From the results of his survey, he found that customer satisfaction can be achieved through the main determining factor, quality of service. Moreover, he observed that moderating variable of a gender perspective is an important factor, but income and educational level variables. On the other hand, did not influence the effect of customer satisfaction on loyalty.
Further, Mohammed, et al. [40], had conducted a survey to examine the impact of functional and technological service quality on trust and loyalty in online services. For this purpose, he utilized 300 users of internet services from the Kurdish region of Iraq country and used structural equation modeling to evaluate the data. After the results author found that the technical quality directly impacted trust and loyalty, but the indirect relationship between trust and loyalty was observed with functional quality.
Furthermore, the goal of Zhou, et al. [41] was to develop an E-service quality (e-SQ) measuring scale for usage in telecommunication contexts, as well as to look into the link between e-SQ, customer satisfaction, and loyalty. For this research, the author analyzed self-reports from 9249 people aged 19 to 45, and 74.55 percent of respondents were gents. A scale with five proven reliable and valid user experience parameters was generated to quantify e-SQ in the telecommunication sector. These parameters are the interface, performance, interaction quality, functional completeness, information, and content support. After analysis, a positive relationship between e-SQ, loyalty, and customer satisfaction was found.
Similarly, Chun, et al. [42] researched to determine the factors that can achieve customer satisfaction in China’s telecommunication industry. The author has used an appropriate descriptive study design for this kind of study. The author used primary data for the research and found that price is a significant parameter for customer satisfaction. According to the conclusions of this study, brand image is important to customer satisfaction, but the researchers discovered that the quality of services is not important to customer satisfaction. The results of this study can help telecommunication companies keep informed about the three critical criteria and regularly monitor their customer satisfaction.
As above, we cited enough work from previous researchers. Furthermore, no work has been found on 3G and 4G technology, especially in the Punjab region of Pakistan. To fill in this gap, we intend to determine the factors of 3G and 4G technology network performance and their impact on customer satisfaction. The summary of the literature review is presented in Table 1.

Table 1.
Summary of the Literature Review.
2.1. Theoretical Framework
The framework of this study model has indicated some factors that are upsetting the customer’s satisfaction in telecommunication based on 3G and 4G Network base service performance and predictor variables are 3G and 4G network coverage, customer services, the quality of video calls, and downloading Speed which is affecting the customer satisfaction and customer satisfaction is a dependent variable. The research framework is provided here, as in Figure 4.
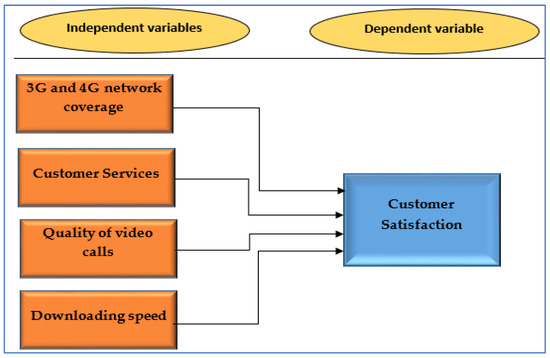
Figure 4.
Theoretical Framework of Variables.
2.2. Hypotheses of the Study
Our research hypotheses are shown below in Table 2, and their relations have been checked in the Results and Analysis and Discussion sections of our study.
Table 2.
Hypothesis.
3. Research Methodology
Our research paper demonstrates the factors that impact 3G and 4G technology performance on customer satisfaction and an empirical study on the telecommunication industry in Pakistan’s Punjab region. The study is quantitative in nature and utilizes primary data collected through a questionnaire.
3.1. Variables and Target Population
There are millions of 3G and 4G subscribers in the Punjab region. This study is particularly conducted related to the telecom sector, and our targeted population were students, employees, and businessmen. A survey questionnaire is a basic method that includes factors pertaining to Pakistan’s telecommunications sector in Pakistan. The questions are simple to grasp. The study’s focus is on 3G and 4G network performance as it relates to the level of customer satisfaction. Our independent variables are “3G and 4G Network Coverage, Customer Services, Quality of Video calls, and Downloading Speed”. The dependent variable is “Customer Satisfaction”.
3.2. Questionnaire and Treatment of Scales
Structured questionnaires were used to investigate the study’s constructs. Respondent responses have been recorded using five-point Likert scales. The Likert scale runs from 1 to 5, with 1 being strongly disagreed and 5 strongly agreed. The Likert scale is often used in research. This study used the Likert scale, which yields reliable findings.
3.3. Data Collection Procedure
A random sampling technique has been adopted in our study. Data was collected from the telecommunication sector in the Punjab region of Pakistan. We distributed 375 questionnaires in Pakistan’s telecommunications industry (Punjab), yielding 300 valid surveys. Out of 375 questionnaires issued in the telecommunications industry, 54 were not returned by respondents to us, and 21 samples were left blank, excluding them from the study.
4. Results and Analysis
For statistical analysis of collected data, we used SmartPLS, and the results of the analysis are given below.
4.1. Descriptive Statistics
4.1.1. Demographics
In this descriptive study, demographic data are used to learn about consumer demographic responses:
- i.
- Gender
- ii.
- Age
- iii.
- Education
- iv.
- Network SIM Connection type
- v.
- Telecom Operators in Punjab, Pakistan
- vi.
- The city using the Internet
These demographics were characterized to simplify the collected data interpretation and analysis. The demographical analysis of 300 respondents with different demographical variables and elaboration of each demographical variable are mentioned below.
Gender
Descriptive Table 3 below shows that 78.4% of the respondents are male and 21.6% are female in this research for the Punjab province, Pakistan, telecommunication sector.
Table 3.
Result of Demographical Frequency statistics.
Age
Table 3 Demonstrates the percentage concerning the age of different respondents are provided.
Education
Descriptive Table 3 demonstrates that the Education of the study shows that 71% of respondents are bachelors, 14.33% are masters, 0.66% are Ph.D., and 14% of others in this research are participants in this study.
Network SIM Connection Type
The response of the study shows that only 44% of respondents use the postpaid connection, and only 56% use the prepaid link, see Table 3.
Telecom Operators in Punjab Pakistan
Five telecom operators’ segregation customers wise are mentioned below. The maximum number of respondents of Mobilink whose customers participated was 34.66% in this study, while Telenor, Ufone, and Zong customers participated at 19.67%, 26.67%, and 19.0%, respectively; see Table 3.
Cities Using the Internet
As per the subject study, this research is conducted in the Punjab region, and all telecom operators of Pakistan have installed their systems in the five regions of Pakistan. The Punjab region is one of them, so the maximum number of participants in Punjab city (Multan) is 55.33%. In comparison, minimum responses are Toba Tek Singh 4.33%, Sahiwal 7.33%, Bahawalpur 10%, Sargodha 7.33%, Khanewal 6.33%, and other 9.35%, see Table 3.
4.2. Data Analysis Techniques (Data Screening)
For data selection, the researcher often employs two methods: out-of-collection values and misplaced data. When putting up a large datasheet, data entry errors are typical. The most common difficulty in the dependability of legitimate outcomes is data missing when the data missing is below 5%. (Ali, F. et al. 2018) [43,44,45] also worked in the same scenario. Those examples might perhaps be eliminated from the analysis. The most significant part of the structured questionnaire approach of survey management is ensuring that there are no missing values aside from the question statement.
4.3. Level of Analysis
This research section discusses the approach utilized to examine the responder data. A structured questionnaire was used to obtain the data for this questionnaire. MS Office 2010 was utilized, while Smart PLS was the primary data analysis program. Therefore, the findings will investigate the link between the study hypotheses by doing factor analyses, descriptive statistics, correlation analysis, and regression analysis to assess the relationship between independent and dependent variables.
4.4. Reliability and Validity
According to Taber, K.S. (2018) [46], Cronbach’s alpha is a statistic for measuring reliability and is frequently used in science education research. In the single year of 2015, it was cited as a measure of reliability in 69 separate studies published in four top science education journals. According to (Hair et al. 2011, 2014) [47,48] reliability can be estimated by Cronbach’s alpha, which is supposed to be a traditional measure of internal consistency (Cronbach 1951) [49].
All hypotheses revealed were acceptable at levels for Cronbach’s alpha, with values ranging from (0.512 to 0.855), see Table 4. Although, composite reliability also relates to assessing the internal continuity because (Werts, et al. 1974) [50] argued: “Cronbach’s alpha can produce the severe underestimation for an internal constancy reliability for the concealed variable in the PLS path models”.
Table 4.
Cronbach’s Alpha.
The result of the composite reliability indicated that measures are vigorous in terms of the internal composite reliability, see Table 5. The catalogs for composite reliability exhibited satisfactory levels ranging (from 0.626 to 0.900), which exceeded its level of threshold that is 0.8, and the results are supported by the study by (Nunnally and Bernstein 1994) [51] and (Tarhini, A. et al. 2017) [52]. The average variance extracted has been demonstrated in Table 6, which ranges from (0.424 to 0.775). The values of Crobach’s Alpha of independent variables are shown in Figure 5.
Table 5.
Composite Reliability.
Table 6.
Average variance Extracted.
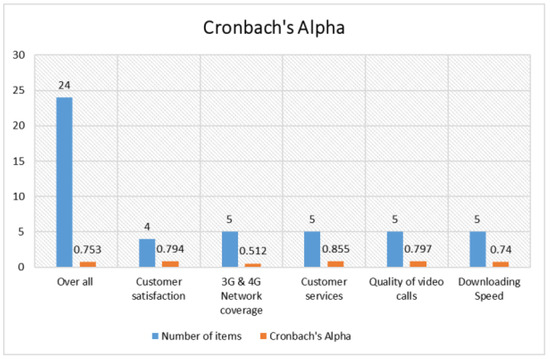
Figure 5.
Cronbach’s Alpha of independent variables.
The values of Composite Reliability of independent variables are shown in Figure 6. The value of composite reliability of customer services is higher than other variables.
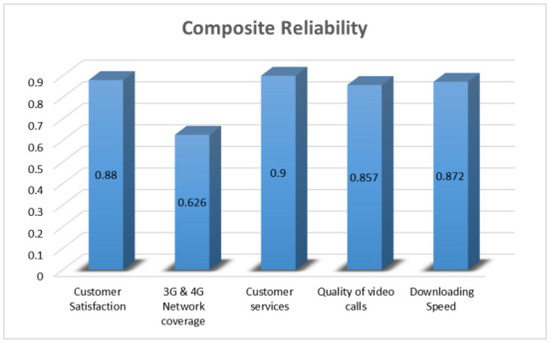
Figure 6.
Composite Reliability of independent variables.
Figure 7 shows the extracted average variance. The value of composite reliability of customer services is higher among all variables.
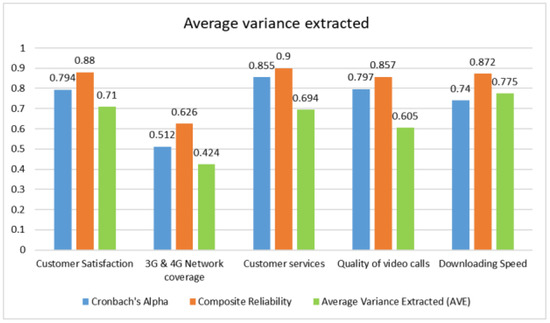
Figure 7.
The extracted average variance.
Table 7.
Combined Effect of Reliability.
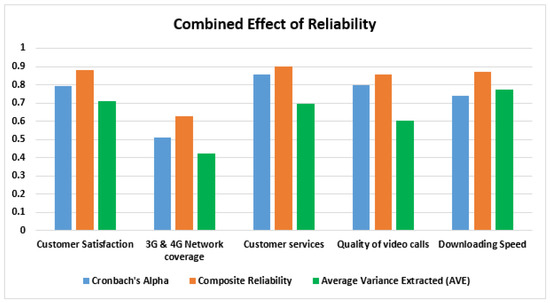
Figure 8.
The combined effect of reliability.
We evaluated the reliability of the given constructs through factor loadings. According to (Sarstedt, M, et al. 2017) [53], outer loadings were evaluated by Smart PLS.
Therefore, each factor loading was evaluated by the criteria that (≥0.6) was identified by (Hair Jr, et al. 2014) [48]. The scale loading was not recognized as an imperative component of the assessment model. Table 8 shows the Factor Loading.
Table 8.
Factor Loading.
According to (Hair, et al. 2011, 2014) [2,5], convergent validity and discriminant validity can be utilized for estimating the construct validity and convergent validity estimates the theoretical difficulties for the scale object items.
4.5. Discriminant Validity
Discriminant validity estimates each construct’s validity. Discriminant validity estimates the study, which is valid and unique. Discriminant validity was estimated by using two techniques. Such as (a) cross-loadings, (b) Fornell-Larcker Test (Hair, et al. 2011, 2014) [47,48]. Furthermore, the results of both techniques are provided below in Table 9.
Table 9.
Fornell-Larcker.
The PLS-SEM procedure utilized two criteria for evaluating construct validity convergent validity and discriminant validity (Hair, et al. 2011) [47]. The first criterion, convergent validity, is estimated by the scale items’ hypothetical (Hair, et al. 2014) [48]. The researcher evaluated the convergent validity by analyzing AVE values. The AVE esteems for all constructs exceeded the least threshold index of 0.5, as shown in Table 6. This demonstrated that all constructs that have been discussed here have above 50% variance (Götz, et al. 2010) [54]. Cross-loading is reported as follows in Table 10. Figure 9 shows the Cross loading.
Table 10.
Cross-loading.
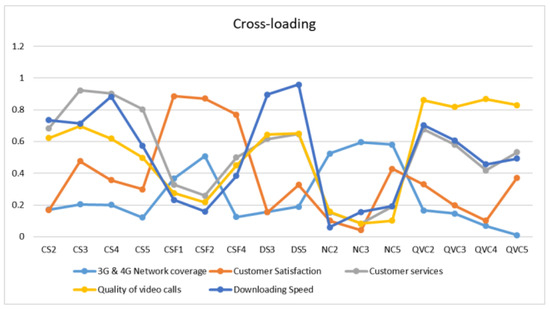
Figure 9.
Cross loading.
4.6. Path Coefficient (β)
The statistical objective for the PLS-SEM demonstrates an essential t-value. Bootstrapping was conducted with the 500 resamples, and Bootstrapping is a non-parametric procedure for estimating the precision of the path coefficients (Hair, et al. 2014) [48]. The bootstrapping process is used to estimate the value t-value, p-value, and standard error for the statistical validity of the path coefficient (Hair, et al. 2014) [48]. Whereas values of β normally range between 0.329 to 0.346, which is normally considered an essential component. Parameters that have an at-value greater than 1.96 represent a 95% level of confidence (p < 0.05), and those parameters which have a t-value greater than 2.58 represent a 99% level of confidence (p < 0.01) (Hair, et al. 2014) [48]. Therefore, in the perspective of this study, t-values were found to be greater than 2.58, thereby showing the significance of path coefficients at (p < 0.01), 99% confidence level. The Path Coefficient (β) and Total Effect are presented below in Table 11. Figure 10 also shows the Path Coefficient (β) and total effect.
Table 11.
Path Coefficient (β) and Total Effect.
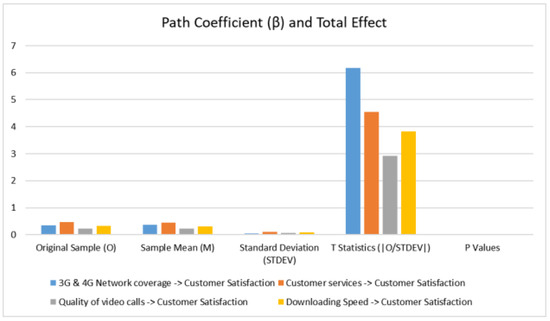
Figure 10.
Path Coefficient (β) and total Effect.
The graph of the sample mean is presented in Figure 11. The value of customer satisfaction is high than other independent variables.
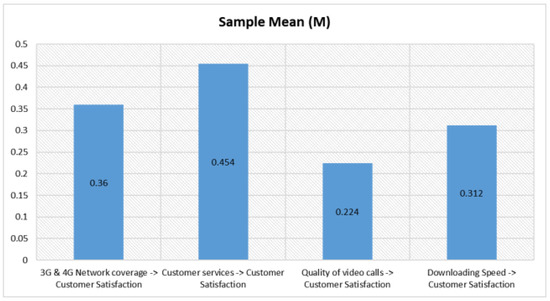
Figure 11.
Sample Mean (M) of independent variables.
5. Discussion
This study elaborates on the relationship between 3G and 4G network coverage, Customer services, Downloading Speed, quality of video calls, and customer satisfaction. The main purpose of the research is to catch those aspects associated with customer satisfaction in cellular networks of the Punjab region of Pakistan and to check the level of customer satisfaction based on 3G and 4G network performance. To obtain productive outcome information, we collected via survey questionnaires of soft and hard copies sent to 3G and 4G mobile users. We collected fruitful responses from 300 different five telecom operators’ networks in the region. The research found how existing and new services impact customer satisfaction and behavior and the other mobile companies’ networks in Pakistan. This research work leads us to how to make strong relations with customers and retain them in a particular network. Following are the questions that have been asked and discussed below:
H1:
Relationship between 3G and 4G Network Coverage and Customer satisfaction.
Hypothesis 1 explained 3G and 4G Network Coverage and customer satisfaction. Thus (Table 11) shows that its p-value is p < 1% and T-value = 6.180, the standard deviation is 0.056, the sample mean is 0.360, and the original sample is 0.346. These values show that a value above a t-value greater than 2.58 and a p-value lesser than 0.01 is acceptable. This result shows that the values of this hypothesis are significant.
H2:
Relationship between Customer services and Customer Satisfaction.
Hypothesis 2 explained Customer services and customer satisfaction. Thus (Table 11) shows that its p-value is p < 1% and T-value = 4.542, the standard deviation is 0.104, the sample mean is 0.454, and the original sample is 0.472. These values show that values above the t-value greater than 2.58 and p-value lesser than 0.01 are acceptable. This result shows that the values of this hypothesis are significant.
H3:
Relationship between the quality of video calls and Customer Satisfaction.
Hypothesis H3 explained the quality of video calls and customer satisfaction. Thus (Table 11) shows that its p-value is p < 1% and T-value = 2.913, the standard deviation is 0.076, the sample mean is 0.224, and the original sample is 0.221. Therefore, this shows that a value above a t-value greater than 2.58 and a p-value lesser than 0.01 is acceptable. This result shows that the values of this hypothesis are significant.
H4:
Relationship between downloading Speed and customer satisfaction.
Hypothesis H4 explained downloading Speed and customer satisfaction. Thus (Table 11) shows that its p-value is p < 1% and T-value = 3.815, the standard deviation is 0.086, the sample mean is 0.312, and the original sample is 0.329. Therefore, this shows that a value above a t-value greater than 2.58 and a p-value lesser than 0.01 is acceptable. These results show that the values of this hypothesis are significant.
5.1. Conclusions
The study’s main objective was to investigate the overall telecom customer and each determinant of customer satisfaction based on 3G and 4G network performance in the Punjab region of Pakistan. Questionnaire data was sent to over 375 people using different modes, and 300 valid responses were received from different subscribers of telecom operator companies existing in the Punjab region to find fruitful results. After evaluating the results of our data collection, it has been found that the sample means the value of the independent variable “downloading seed” is less than other variables see Table 11. Hence, as per our research findings, we suggest that telecom operators in the Punjab region should focus on improving downloading Speed in their network to enhance the revenue of companies. Moreover, internet speed is a basic need for advanced android Apps, virtual-based workplaces, and home-based working. The 5G technology is an updated version of 4G and the 5G technology download speed is 10 gigabits/second, about 100 times faster than 4G. The same difference can also be observed in web browsing. The current telecom structure mandatory need development in present technological infrastructure, optical fiber cable (OFC) penetration, Spectrum Re-framing, and increase in Fibre-To-The Tower/Site (FTTT/FTTS) percentage. The 5G is not only needed to satisfy consumer needs but is also mandatory to keep pace with regional technological advancement.
5.2. Future Research Directions
Many variables related to the 3G and 4G technology network are not examined in this research, such as 3G and 4G customer loyalty and Video voice messages, information on the next innovation, chances, and past system cell experience. Similarly, some of the recommendations related to this research for future work are as follows:
- Data collection in this study can be extended to the whole country with a high number of responses to make the results more reliable.
- This study can further extend the impact of 5G technology network performance on customer satisfaction in a different area because 5G is expected to come in the next couple of years.
- Another recommendation about this study is to extend this study compassion based on 3G and 4G services with different telecom operators who are providing the best services in the telecom sector
- We will also conduct our research study on 5G technology.
Author Contributions
Conceptualization, I.H.; Data curation, I.H., J.A.S. and T.M.; Formal analysis, I.U. (Ikram Ullah), T.A.S., Y.Y.G. and A.S.; Funding acquisition, I.U. (Inam Ullah), A.S. and A.T.; Investigation, I.U. (Ikram Ullah), T.A.S., Y.Y.G., A.S. and A.T.; Methodology, I.H. and I.U. (Ikram Ullah); Project administration, I.U. (Inam Ullah), A.S. and A.T.; Resources, I.H., T.M. and Y.Y.G.; Software, I.H. and J.A.S.; Supervision, I.U. (Inam Ullah); Validation, I.H., T.A.S. and Y.Y.G.; Visualization, T.A.S., I.U. (Inam Ullah), A.S. and A.T.; Writing—original draft, I.H., J.A.S., T.M. and I.U. (Ikram Ullah); Writing—review & editing, I.H., J.A.S. and T.M. All authors have read and agreed to the published version of the manuscript.
Funding
This work was funded by the Researchers Supporting Project Number (RSP2023R260) King Saud University, Riyadh, Saudi Arabia.
Data Availability Statement
The data presented in this study are available on request from the corresponding author.
Acknowledgments
This work was funded by the Researchers Supporting Project Number (RSP2023R260) King Saud University, Riyadh, Saudi Arabia.
Conflicts of Interest
The authors declare no conflict of interest.
References
- Pakistan Telecommunication Authority. Telecom Indicators. Available online: https://www.pta.gov.pk/en/telecom-indicators (accessed on 18 July 2022).
- Jere, M.G.; Mukupa, A. Customer satisfaction and loyalty drivers in the Zambian mobile telecommunications industry. J. Bus. Retail Manag. Res. 2018, 13, 120–128. [Google Scholar] [CrossRef]
- Selelo, G.B.; Lekobane, K.R. Effects of service quality on customers satisfaction on Botswana’s mobile telecommunications industry. Arch. Bus. Res. 2017, 5, 212–228. [Google Scholar]
- Chee, V.S.; Husin, M.M. The Effect of Service Quality, Satisfaction and Loyalty toward Customer Retention in the Telecommunication Industry. Int. J. Acad. Res. Bus. Soc. Sci. 2020, 10, 55–71. [Google Scholar]
- Marvelous, M.; Asphat, M.; Malon, S.R. The influence of customer-based brand equity on customer satisfaction and brand loyalty: Evidence from South African Mobile Telecommunications Industry. Int. J. Bus. Manag. Stud. 2019, 11, 32–47. [Google Scholar]
- Gawas, A.U. An overview on evolution of mobile wireless communication networks: 1G–6G. Int. J. Recent Innov. Trends Comput. Commun. 2015, 3, 3130–3133. [Google Scholar]
- Pereira, V.; Sousa, T. Evolution of Mobile Communications: From 1G to 4G. Dep. Inform. Eng. Univ. Coimbra Port. 2004, 4, 20. [Google Scholar]
- Agarwal, A.; Misra, G.; Agarwal, K. The 5th generation mobile wireless networks-key concepts, network architecture and challenges. Am. J. Electr. Electron. Eng. 2015, 3, 22–28. [Google Scholar]
- Waleed, S.; Ullah, I.; Khan, W.U.; Rehman, A.U.; Rahman, T.; Li, S. Resource allocation of 5G network by exploiting particle swarm optimization. Iran J. Comput. Sci. 2021, 4, 211–219. [Google Scholar] [CrossRef]
- Khan, W.U.; Imtiaz, N.; Ullah, I. Joint optimization of NOMA-enabled backscatter communications for beyond 5G IoT networks. Internet Technol. Lett. 2021, 4, e265. [Google Scholar] [CrossRef]
- Mazhar, T.; Malik, M.A.; Haq, I.; Rozeela, I.; Ullah, I.; Khan, M.A.; Adhikari, D.; Ben Othman, M.T.; Hamam, H. The Role of ML, AI and 5G Technology in Smart Energy and Smart Building Management. Electronics 2022, 11, 3960. [Google Scholar] [CrossRef]
- Aldossari, S.M.; Chen, K.-C. Machine learning for wireless communication channel modeling: An overview. Wirel. Pers. Commun. 2019, 106, 41–70. [Google Scholar] [CrossRef]
- Jagannath, J.; Polosky, N.; Jagannath, A.; Restuccia, F.; Melodia, T. Machine learning for wireless communications in the Internet of Things: A comprehensive survey. Ad. Hoc. Netw. 2019, 93, 101913. [Google Scholar] [CrossRef]
- Li, C.; Cao, Z. Lora networking techniques for large-scale and long-term iot: A down-to-top survey. ACM Comput. Surv. (CSUR) 2022, 55, 1–36. [Google Scholar] [CrossRef]
- Lin, Y.; Song, H.; Ke, F.; Yan, W.; Liu, Z.; Cai, F. Optimal caching scheme in D2D networks with multiple robot helpers. Comput. Commun. 2022, 181, 132–142. [Google Scholar] [CrossRef]
- Guo, L.; Ye, C.; Ding, Y.; Wang, P. Allocation of centrally switched fault current limiters enabled by 5G in transmission system. IEEE Trans. Power Deliv. 2020, 36, 3231–3241. [Google Scholar] [CrossRef]
- Alsheikh, M.A.; Niyato, D.; Lin, S.; Tan, H.-P.; Han, Z. Mobile big data analytics using deep learning and apache spark. IEEE Netw. 2016, 30, 22–29. [Google Scholar] [CrossRef]
- Bi, S.; Zhang, R.; Ding, Z.; Cui, S. Wireless communications in the era of big data. IEEE Commun. Mag. 2015, 53, 190–199. [Google Scholar] [CrossRef]
- Huang, J.; Wang, C.-X.; Bai, L.; Sun, J.; Yang, Y.; Li, J.; Tirkkonen, O.; Zhou, M.-T. A big data enabled channel model for 5G wireless communication systems. IEEE Trans. Big Data 2018, 6, 211–222. [Google Scholar] [CrossRef]
- Stergiou, C.L.; Plageras, A.P.; Psannis, K.E.; Gupta, B.B. Secure machine learning scenario from big data in cloud computing via internet of things network. In Handbook of Computer Networks and Cyber Security; Gupta, B., Perez, G., Agrawal, D., Gupta, D., Eds.; Springer: Cham, Switzerland, 2020. [Google Scholar] [CrossRef]
- Mazhar, T.; Malik, M.A.; Mohsan, S.A.H.; Li, Y.; Haq, I.; Ghorashi, S.; Karim, F.K.; Mostafa, S.M. Quality of Service (QoS) Performance Analysis in a Traffic Engineering Model for Next-Generation Wireless Sensor Networks. Symmetry 2023, 15, 513. [Google Scholar] [CrossRef]
- Chang, Z.; Lei, L.; Zhou, Z.; Mao, S.; Ristaniemi, T. Learn to cache: Machine learning for network edge caching in the big data era. IEEE Wirel. Commun. 2018, 25, 28–35. [Google Scholar] [CrossRef]
- Qin, X.; Liu, Z.; Liu, Y.; Liu, S.; Yang, B.; Yin, L.; Liu, M.; Zheng, W. User OCEAN personality model construction method using a BP neural network. Electronics 2022, 11, 3022. [Google Scholar] [CrossRef]
- Hajar, M.A.; Alkahtani, A.A.; Ibrahim, D.N.; Al-Sharafi, M.A.; Alkawsi, G.; Iahad, N.A.; Darun, M.R.; Tiong, S.K. The Effect of Value Innovation in the Superior Performance and Sustainable Growth of Telecommunications Sector: Mediation Effect of Customer Satisfaction and Loyalty. Sustainability 2022, 14, 6342. [Google Scholar] [CrossRef]
- Shava, H. The relationship between service quality and customer satisfaction in the South African mobile network telecommunications industry. J. Int. Stud. 2021, 14, 70–83. [Google Scholar] [CrossRef]
- Shahzad, A.; Yaqub, R.M.S.; Di Vaio, A.; Hassan, R. Antecedents of customer loyalty and performance improvement: Evidence from Pakistan’s telecommunications sector. Util. Policy 2021, 70, 101208. [Google Scholar] [CrossRef]
- Mohammed, B.I.; Andavar, V. Customer Satisfaction towards Telecommunication mobile services: A case study in Asiacell Telecommunications in Sulaymaniyah city. Sci. J. Cihan Univ. Sulaimaniya 2022, 6, 173–184. [Google Scholar]
- Almuqren, L.; Cristea, A.I. Predicting STC Customers’ Satisfaction Using Twitter. IEEE Trans. Comput. Soc. Syst. 2022, 10, 204–210. [Google Scholar] [CrossRef]
- Al-Shammari, M.M.; AlShowaikh, A.F. Investigating user satisfaction of customer relationship management in a Telecommunications company in the kingdom of Bahrain. Int. J. Ebusiness Egovernment Stud. 2021, 13, 97–116. [Google Scholar]
- Shava, H. Service quality and customer satisfaction experience among south african mobile telecommunications consumers. Eurasian J. Bus. Manag. 2021, 9, 217–232. [Google Scholar] [CrossRef]
- Awadhi, J.; Obeidat, B.; Alshurideh, M. The impact of customer service digitalization on customer satisfaction: Evidence from telecommunication industry. Int. J. Data Netw. Sci. 2021, 5, 815–830. [Google Scholar]
- Shrivastava, N.; Limaye, M. A comparative study of customer satisfaction towards 4g service providers in bhopal division involving demographic variables. Int. J. Manag. (IJM) 2020, 11, 889–896. [Google Scholar]
- Ali, B.J.; Saleh, P.F.; Akoi, S.; Abdulrahman, A.A.; Muhamed, A.S.; Noori, H.N.; Anwar, G. Impact of Service Quality on the Customer Satisfaction: Case study at Online Meeting Platforms. In Ali, BJ, Saleh, Akoi, S., Abdulrahman, AA, Muhamed, AS, Noori, HN, Anwar, G. Impact of Service Quality on the Customer Satisfaction: Case study at Online Meeting Platforms. Int. J. Eng. Bus. Manag. 2021, 5, 65–77. [Google Scholar]
- Inegbedion, H.; Obadiaru, E. Modelling brand loyalty in the Nigerian telecommunications industry. J. Strateg. Mark. 2019, 27, 583–598. [Google Scholar] [CrossRef]
- Dhasan, D.; Kowathanakul, S. The impact of service quality, promotions and customer engagement in determining customer loyalty in the Thai mobile network industry. ABAC J. 2021, 41, 209–240. [Google Scholar]
- Laghari, A.A.; He, H.; Shafiq, M.; Khan, A. Application of quality of experience in networked services: Review, trend & perspectives. Syst. Pract. Action Res. 2019, 32, 501–519. [Google Scholar]
- Kubasu, K. Factors Influencing Customer Satisfaction with Services Offered by Safaricom Mobile Cellular Network; Strathmore University: Nairobi, Kenya, 2018. [Google Scholar]
- Khan, N.; Akram, M.U.; Shah, A.; Khan, S.A. Calculating customer experience management index for telecommunication service using genetic algorithm based weighted attributes. In Proceedings of the 2018 IEEE International Conference on Innovative Research and Development (ICIRD), Bangkok, Thailand, 11–12 May 2018; pp. 1–8. [Google Scholar]
- Mahrinasari, M.; Pandjaitan, D.H.R. Moderating role of “consumer characteristics” in the influence of customer satisfaction on loyalty. In The Future Opportunities and Challenges of Business in Digital Era 4.0; Routledge: Oxfordshire, UK, 2020; pp. 205–209. [Google Scholar]
- Mohammed, S.S.; Shahin, O. Service quality perspectives in telecommunication sector: Trust and loyalty investigation. Amazon. Investig. 2020, 9, 394–403. [Google Scholar] [CrossRef]
- Zhou, R.; Wang, X.; Shi, Y.; Zhang, R.; Zhang, L.; Guo, H. Measuring e-service quality and its importance to customer satisfaction and loyalty: An empirical study in a telecom setting. Electron. Commer. Res. 2019, 19, 477–499. [Google Scholar] [CrossRef]
- Chun, L.; Tham, J.; Azam, S.F. Corporate competence determining factors in china telecom industry in achieving customer satisfaction. Eur. J. Manag. Mark. Stud. 2019, 4. [Google Scholar] [CrossRef]
- Ali, F.; Rasoolimanesh, S.M.; Sarstedt, M.; Ringle, C.M.; Ryu, K. An assessment of the use of partial least squares structural equation modeling (PLS-SEM) in hospitality research. Int. J. Contemp. Hosp. Manag. 2018, 30, 514–538. [Google Scholar] [CrossRef]
- Coakes, S.J.; Steed, L.; Dzidic, P. SPSS 13.0 for Windows: Analysis without Anguish; John Wiley & Sons: Milton, QLD, Australia, 2006; 270p, ISBN 9780470809143 0470809140. [Google Scholar]
- Tabachnick, B.; Fidel, L. Using Multivarite Statistics; Allyn ve Bacon Inc.: Boston, MA, USA, 2001. [Google Scholar]
- Taber, K.S. The use of Cronbach’s alpha when developing and reporting research instruments in science education. Res. Sci. Educ. 2018, 48, 1273–1296. [Google Scholar] [CrossRef]
- Hair, J.F.; Ringle, C.M.; Sarstedt, M. PLS-SEM: Indeed a silver bullet. J. Mark. Theory Pract. 2011, 19, 139–152. [Google Scholar] [CrossRef]
- Hair, J.F., Jr.; Sarstedt, M.; Hopkins, L.; Kuppelwieser, V.G. Partial least squares structural equation modeling (PLS-SEM): An emerging tool in business research. Eur. Bus. Rev. 2014, 26, 106–121. [Google Scholar] [CrossRef]
- Cronbach, L.J. Coefficient alpha and the internal structure of tests. Psychometrika 1951, 16, 297–334. [Google Scholar] [CrossRef]
- Werts, C.E.; Linn, R.L.; Jöreskog, K.G. Intraclass reliability estimates: Testing structural assumptions. Educ. Psychol. Meas. 1974, 34, 25–33. [Google Scholar] [CrossRef]
- Nunnally, B. Psychometric Theory, 3rd ed.; McGraw Hill: New York, NY, USA, 1994. [Google Scholar]
- Tarhini, A.; Al-Busaidi, K.A.; Mohammed, A.B.; Maqableh, M. Factors influencing students’ adoption of e-learning: A structural equation modeling approach. J. Int. Educ. Bus. 2017, 10, 164–182. [Google Scholar] [CrossRef]
- Sarstedt, M.; Ringle, C.M.; Hair, J.F. Partial least squares structural equation modeling. In Handbook of Market Research; Springer: Cham, Switzerland, 2021; pp. 587–632. [Google Scholar]
- Götz, O.; Liehr-Gobbers, K.; Krafft, M. Evaluation of structural equation models using the partial least squares (PLS) approach. In Handbook of Partial Least Squares; Springer: Berlin/Heidelberg, Germany, 2010; pp. 691–711. [Google Scholar]
Disclaimer/Publisher’s Note: The statements, opinions and data contained in all publications are solely those of the individual author(s) and contributor(s) and not of MDPI and/or the editor(s). MDPI and/or the editor(s) disclaim responsibility for any injury to people or property resulting from any ideas, methods, instructions or products referred to in the content. |
© 2023 by the authors. Licensee MDPI, Basel, Switzerland. This article is an open access article distributed under the terms and conditions of the Creative Commons Attribution (CC BY) license (https://creativecommons.org/licenses/by/4.0/).