Abstract
High-throughput satellite communication based on large-scale multi-beam antennas is a promising technology for sixth-generation (6G) mobile networks. Conventional online calibration methods for large-scale antennas after satellite launch are restricted by communication signals. This paper proposes an online calibration method of amplitude and phase errors without disturbing the normal communication traffic. Two important aspects of calibration are discussed, i.e., closed-form expressions of calibration accuracy and hardware complexity. Simulation results show that theoretical approximation results are close to simulation results when the number of antennas is less than half of the code length. The relative amplitude and phase performance deteriorate by 6.12 dB and 40.96 deg, respectively, when the power is lower than the reference 20 dB. Finally, a calibration experimental system with eight beams is built for verification.
1. Introduction
Large capacity and high speed are important trends of sixth-generation (6G) mobile networks. The high-throughput satellite communication system has advantages of wide bandwidth and large transmission capacity [1], which is especially suitable for 6G application. Large-scale multi-beam antennas, as the core of high-throughput satellite payload, can achieve capacity multiplication and high-gain coverage by multiple high-gain point beams [2,3,4].
Due to manufacturing and assembling errors of the device, the amplitude and phase consistency of the practical system is different from the design [5]. Before satellite launch, the amplitude and phase characteristics can be measured offline through the vector network analyzer to compensate. The port of the vector network analyzer is limited and needs to be calibrated one by one. Therefore, calibration steps are very time-consuming for large-scale multi-beam antennas. After satellite launch, the spaceborne multi-beam antenna system is affected by various factors such as the impact of launch vibration, harsh space environment, phase noise, temperature drift, resulting in performance degradation of beam pointing, antenna gain and coverage area [6,7].
The amplitude and phase errors caused by these factors are time-varying, and accurate beam pointing cannot be ensured only by offline calibration before launch [8,9]. Therefore, online calibration while communicating must be carried out after satellite launch to ensure that RF chains and array elements have predetermined amplitude and phase relations [10,11].
The online calibration schemes can be distinguished into time-division multiple access (TDMA), frequency-division multiple access (FDMA), and code-division multiple access (CDMA) systems according to the relationship between calibration signals and communication traffic [12]. In a TDMA system, the calibration process is performed by occupying a limited period of communication time slot. In this case the normal traffic is interrupted. FDMA systems employ another adjacent frequency to modulate the calibration signal so that the normal communication is ensured. This means that amplitude and phase characteristics are achieved for the adjacent frequency channel instead of the frequency to be calibrated. CDMA calibration schemes adopt spread spectrum technology to achieve parallel calibration [13,14]. Each array element is simultaneously injected with a unique pseudo-random code spread spectrum signal. After passing channels with amplitude and phase errors, the calibration receiver uses the same pseudo-random code for correlation reception processing. Amplitude and phase errors are reflected on the peak value of the correlation peak. These CDMA calibration systems can measure the amplitude and phase characteristics of all channels in parallel, and the spread spectrum gain improves the calibration accuracy in white noise environment. The first German synthetic aperture radar satellite TerraSAR-X with 384 array modules was launched in 2007 [15]. The simultaneous characterization of all modules was realized based on orthogonal Walsh codes. However, the correlation operation of orthogonal Walsh codes involves a large amount of operations and the complexity of parallel signal processing is unbearable.
A novel online calibration method for large-scale antennas is proposed in this paper. A set of spread spectrum signals for calibration is injected along with the normal traffic flow. The power of calibration signal is low enough to ensure the communication performance and the calibration process can be performed simultaneously without disturbing the normal traffic flow. Utilizing the particularity of the inverse matrix of the m-sequence, a decorrelation interference cancellation algorithm is implemented with low-complexity. Moreover, the calibration accuracy can benefit from the gain brought by spread spectrum. The calibration accuracy of the proposed method can break through the limitation of orthogonal codes in [14]. Meanwhile, the system complexity can be reduced by novel design of code-division calibration waveform.
This paper is organized as follows. Section 2 provides the system model of online calibration and analyzes the impact of normal communication traffic on amplitude and phase mismatches. Section 3 proposes a low-complexity online calibration method and derives the calibration accuracy of the proposed method. Numerical simulation results are shown in Section 4 and implementation results are provided in Section 5. Conclusions are drawn in Section 6.
Notations: The notation denotes the i-th entry of the vector . Notations , , and stand for expectation, variance, and conjugate Hermitian transpose operation, respectively. represents the identity matrix. Notations and denote the norm and phase of a vector, respectively. Notation characterizes a random variable of Gaussian distribution with expectation a and variance b. Notations and denote chi-square distribution and non-central chi-square distribution with degree of freedom n and non-central parameter .
2. System Model and Traffic Impact Analysis
2.1. System Model
An online calibration system equipped with K antennas is depicted in Figure 1. A set of code-division calibration signals is generated in parallel by the calibration controller and injected after the beamforming network (BFN). Then K transmitter and receiver (TR) chains produce amplitude and phase errors on calibration signals due to temperature drift and other factors of electronic devices. Each TR chain contains the upconverter (UC), downconverter (DC), power amplifier (PA), and low noise amplifier (LNA).
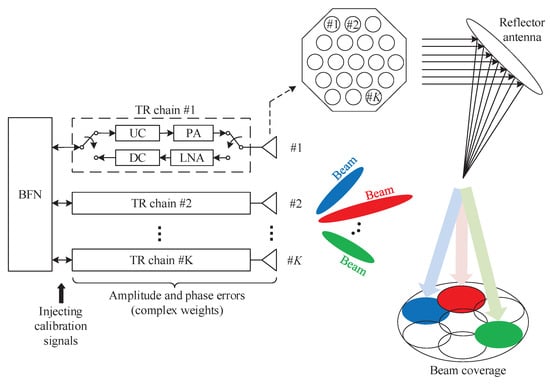
Figure 1.
Online calibration model for multi-beam antennas.
Temperature drift and other characteristics in-orbit after satellite launch are time-varying, causing amplitude and phase errors fluctuation during calibration window. To ensure effective calibration results, calibration must be completed quickly in a short time. Referring to the calibration in TerraSAR-X, the typical calibration time required for real-time estimation and compensation is about 1 second [16]. Otherwise, calibration results are lagging. During the short calibration time, the assumption of constant amplitude and phase errors is reasonable and the calibration result is valuable.
One communication signal was equivalent to a random spread spectrum modulated signal during the calibration time window [17]. Considering multiple communication signals, we perform the following conversion. We can define the equivalent communication signal as follows:
where M is the number of codes for communication, is the m-th communication signal and is its weights. The coefficient represents the equivalent superimposed complex gain of communication signal and represents the normalized equivalent binary communication data.
The received signal involves the normal communication signal and calibration signals with amplitude/phase errors as follows:
where , represents the complex weights [18] which consist of amplitude and phase , represents the normalized spread spectrum code sequence assigned to the k-th transmitting antenna, and denotes the complex noise vector, in which the elements are independent distrbuted (i.i.d.) complex Gaussian random variables [19]. The three addition items in (2) are calibration signals, the communication traffic signal, and additive noise, respectively.
The code-division calibration receiver can achieve despreading with local spread spectrum code sequences. The k-th peak value of correlation peak which contains the amplitude and phase characteristics of the corresponding transmitted antenna can be given by
Then the estimated amplitude and phase can be written as
where the first item is the desired complex weight. From (5) and (6), it can be seen that the estimated amplitude and phase are affected by the multiple access interference from other calibration signals, the interference from the traffic signal, and the noise.
In practice, the purpose of calibration is to measure and compensate the relative relation between different antennas. Assuming the first antenna is the reference, then the relative amplitude and phase can be expressed as
2.2. Impact of the Normal Traffic on Amplitude and Phase Mismatches
In order not to disturb the normal communication traffic flow and to allocate the limited transmitting power to the communication signal as much as possible, the power of the injected calibration signal must be lower than noise in the real-time online calibration system. The power level relationship of communication signal, calibration signal and noise is shown in the Figure 2. Amplitude and phase mismatches to be calibrated are illustrated in Figure 3, where red curves are true values. We set the communication traffic signal and calibration signal are of equal power. It can be seen that the amplitude and phase errors become more dispersed in the presence of traffic. Therefore, for weak calibration signals, how to achieve high-accuracy calibration in the presence of strong interference from communication traffic is a difficult problem.
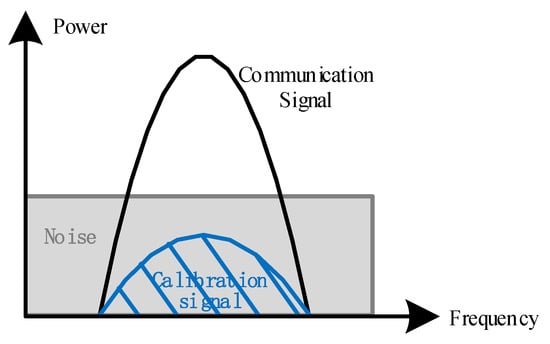
Figure 2.
Power level relationship of communication signal, calibration signal and noise.
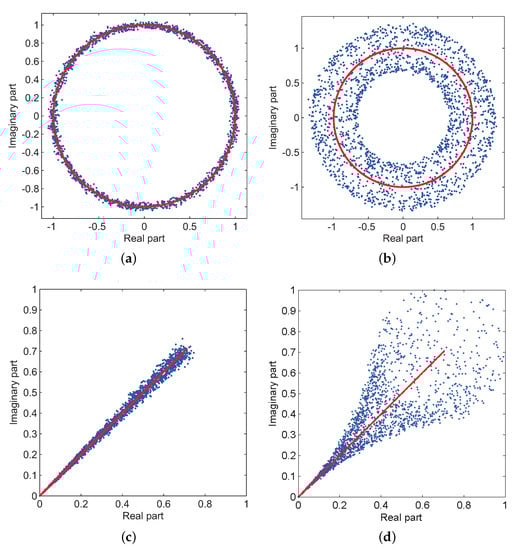
Figure 3.
Amplitude and phase mismatches. (a) Amplitude mismatches without the traffic interference. (b) Amplitude mismatches in the presence of traffic. (c) Phase mismatches without the traffic interference. (d) Phase mismatches in the presence of traffic.
3. Low-Complexity Online Calibration Method
In this section, we first propose an online calibration method that can eliminate the strong interference of communication signal. Then we derive closed-form calibration accuracy expressions of the proposed method. We also discuss the complexity of the proposed online calibration method compared with previous methods.
3.1. Online Calibration Method Based on Decorrelation Algorithm
Let be the correlation matrix of code sequences for calibration. According to (4), the vector form of () correlation peak values can be obtained as
where , , and . We define and the matrix in (9) is
As shown in Figure 3, the calibration process is seriously disturbed by the high-power communication signal. In order to eliminate the strong interference from communication signal, a decorrelation algorithm is introduced by multiplying the inverse matrix of the correlation matrix with the correlation peak values. The structure of calibration receiver based on decorrelation is shown in Figure 4.
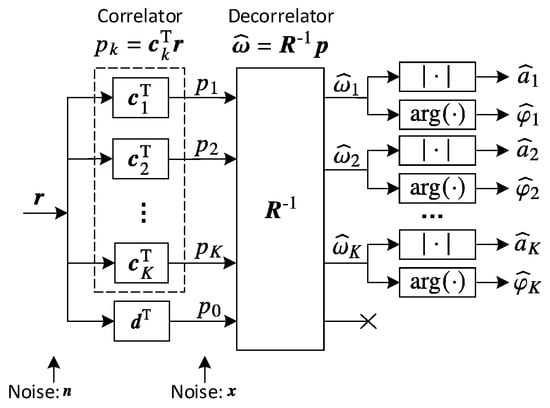
Figure 4.
Structure of calibration receiver based on decorrelation.
The inverse of the correlation matrix can be expressed as [20]
where . A code-division calibration method proposed in [21] can take advantage of the binary autocorrelation property of m-sequence. The elements on the diagonal of the matrix are all 1 and other elements are . Therefore, its inverse matrix has particularity, that is, the elements on the diagonal are , and other elements are . The relationship between the elements of the matrix and K is shown in Figure 5. When , the diagonal and off-diagonal elements of the matrix can be approximately 1 and 0, respectively. Then the matrix can be approximately obtained by . Then (11) can be rewritten as
where .
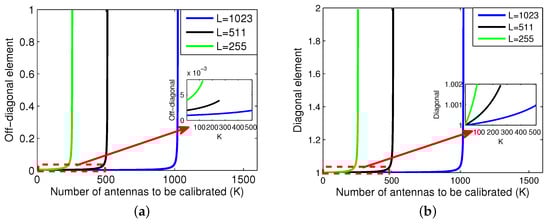
Figure 5.
The elements of the matrix versus K. (a) The off-diagonal element of . (b) The diagonal element of .
Multiplying (9) by (11) and taking out the first K elements, we can obtain K estimated complex coefficients as follows:
As previously analyzed, can approximate the identity matrix when is satisfied. Then the above equation can be rewritten as
Substituting into the above equation, the purpose of calibration is to obtain K estimated elements of as follows:
The estimated amplitude and phase of the proposed method can be expressed as
where follows complex Gaussian distribution and represents the inner product of the normalized demodulation symbol () with the normalized calibration code (). According to the central limit theorem, we can obtain that . Comparing (16) with (5), or (17) with (6), the strong interference related to has been eliminated. Meanwhile, the noise item becomes more complicated.
3.2. Calibration Accuracy Analysis
To investigate the calibration performance of the proposed method, we derive closed-form calibration accuracy expressions with respect to noise. As shown in Figure 4, two types of noise are involved [22]: and . The noise in Equation (2) is the channel noise “before” correlation, The noise in Equation (4) and Equation (9) is the noise “after” correlation. As mentioned before, follows complex Gaussian distribution . Then we can define as the ratio of calibrated signal power to noise “after” correlation:
Correspondingly, the ratio of calibrated signal power to noise “before” correlation can be defined as
The difference between and is the code length L, i.e., the signal-to-noise ratio can be improved by through spread spectrum technology. In this section, we derive the calibration accuracy at and the relationship with can be easily obtained.
The performance of calibration accuracy can be evaluated by the root mean square error (RMSE) of the relative amplitude in decibel (dB) and phase in degree (deg) as follows:
where and are true amplitude and phase coefficients, respectively. We still assume that the first antenna is chosen as the reference antenna, the same as (7) and (8). The key to obtain closed-form expressions of (20) and (21) is to estimate in (16) and in (17). From (16) and (17), we can express the following estimated complex weight coefficients:
where
As shown in Appendix A, the expectation of is zero and its variance of the real part and imaginary part can be approximately derived as for a large-scale antenna system . The approximate derivation results are closer to theoretical values when L is larger and K is smaller.
The RMSE of the relative amplitude and phase can be further approximated as follows (see the detailed proof in Appendix B):
From (24) and (25), it is clear that the calibration accuracy of the proposed method depends solely on the signal-to-noise ratio as long as (i.e., ) and the strong interference from communication signal has been eliminated efficiently. The closed-form expressions of and are gradually invalidated along with the increase of K.
In particular, when , simplified expressions can be given by
3.3. Complexity Discussion
Conventional CDMA calibration schemes mainly consists of orthogonal methods and nonorthogonal methods. The orthogonal method requires K parallel matched-filters to achieve despreading. and the nonorthogonal method involves the inverse operation of the K-order matrix. For a large-scale antenna system, the computational complexity of matched filtering and matrix inversion is too high to be realized by hardware.
The receiver of the proposed online calibration method can achieve despreading with only one matched-filter instead of K matched-filters and no matrix inversion operation is required. Meanwhile, the calibration accuracy performance can be maintained without degradation. Therefore, the proposed online calibration method is especially suitable for large-scale antenna system.
4. Simulation Results
In this section, system simulations in various scenarios are provided. We use MATLAB as the simulation software to investigate the system performance of the proposed online calibration method and verify the closed-form expressions for and .
The simulation parameters are set as follows. The length-of-spread spectrum code for calibration is . The power of the communication signal is 30 dB larger than that of the calibration signal. The phase is randomly distributed [23] in the range [−, +]. Due to the large scale of the antenna to be calibrated, we define average RMSE (ARMSE) of the estimated relative amplitude (in dB) and phase (in degrees) as follows:
Figure 6 depicts the ARMSE of the relative amplitude and phase with various K. It can be seen that our theoretical analysis results, which are approximated by (26) and (27), match all the simulation curves well in various K scenarios. Meanwhile, the proposed online calibration method can effectively eliminate the strong interference from high-power communication signals.
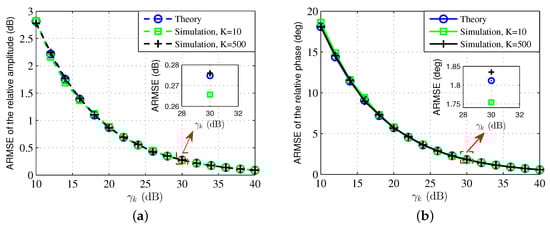
Figure 6.
Theoretical and simulation calibration accuracy. (a) ARMSE of the relative amplitude. (b) ARMSE of the relative phase.
In practical application system, the received power of multiple calibration signals is affected by different link losses. In order to evaluate the calibration accuracy in this case, we set (the power of calibration signal corresponding to the k-th antenna is 20 dB lower than that of the reference antenna) and , compared with (equal power condition). Figure 7 shows the RMSE of the relative amplitude and phase with unequal power conditions. Theoretical results are approximately by (24) and (25). Simulation results demonstrate that when the power of calibration signal is 20 dB lower than the reference antenna, the relative amplitude and phase performance deteriorate by 6.12 dB and 40.96 degrees, respectively.
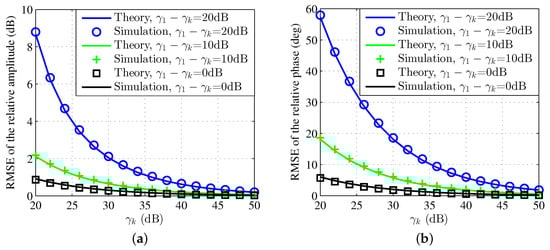
Figure 7.
Calibration accuracy with unequal power conditions (K = 2). (a) RMSE of the relative amplitude. (b) RMSE of the relative phase.
Figure 8 indicates the ARMSE of the relative amplitude and phase versus , validating the relationship in (19). On the one hand, the longer the code length, the greater the spread spectrum gain and the higher the calibration accuracy. If the code length is doubled, RMSE curves shifts by 6dB to the left. On the other hand, the correlation operation is performed in a period of code length and one measurement result is obtained. The longer the code length, the longer the measurement time. Therefore, it is necessary to compromise between high calibration accuracy and short measurement time in application.
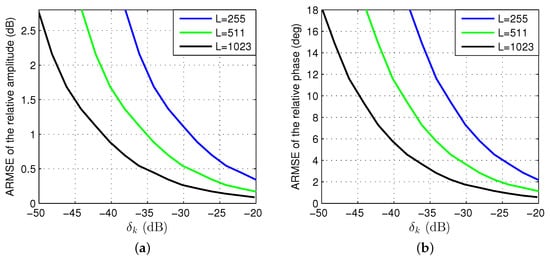
Figure 8.
Calibration accuracy with different code lengths (). (a) RMSE of the relative amplitude. (b) RMSE of the relative phase.
5. Implementation Results
A S-band calibration receiver prototype is developed to further verify the proposed calibration method. Relevant calibration system parameters are summarized in Table 1. The calibration receiver operates at a center frequency of 2.199 GHz. We can calculate that the wavelength corresponding to this frequency is 13.6 cm. One wavelength corresponds to 360 degrees, thus the electrical length corresponding to 1 degree is 0.3 mm. In other words, only 0.3 mm electrical length change will bring about 1 degree phase change.

Table 1.
System parameters.
The code sequence adopted for communication traffic is binary data randomly generated by MATLAB software. The length of calibration codes is 1023 and the chip rate is 1 Mcps. Since the acquisition of correlation peak requires a complete code length period, the correlation peak can be obtained every 1.023 ms, and then the amplitude and phase measurement results can be estimated. This measurement time is short enough to calibrate the amplitude and phase characteristics. In fact, the mission to calibrate time-varying amplitude and phase errors is typically required to be completed within 1 second. Therefore, we can average the results in exchange for improved accuracy with calibration time.
To evaluate the calibration performance of different power and phase calibration signals, the relative power of different calibration signals is set to [0, 0, 0, −5, −10,−15, −20, −25] dB and the relative phase is set to [0, 90, 45, 30, 60, 170, 135, 160] deg where the first signal is considered as reference signal without losing generality. The total power level of calibration signals is −40 dBm and the power level of commucation signal is 0dBm. How to extract amplitude and phase characteristics from such strong communication signals is a difficult problem.
The hardware connection of the experimental system is shown in Figure 9 and Figure 10 shows the experiment system for calibration. The computer generates a mixed baseband calibration signal and sends it to the vector signal generator (E4438C) through Ethernet. The mixed baseband calibration signal is composed of several calibration signals with different amplitude and phase relationships. The amplitude and phase relationships are set by MATLAB software on the computer. Another signal generator (E8257D) generates the operating clock for the calibration receiver. The calibration receiver collects the calibration signal with unknown amplitude and phase relationships through analog to digital converter (ADC) chip, and performs code correlation operation through the field programmable gate array (FPGA). Amplitude and phase measurement results are returned to another computer for display through Ethernet.
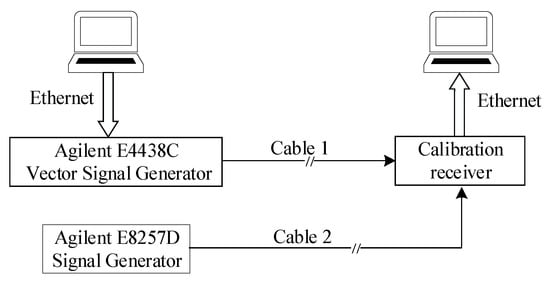
Figure 9.
Hardware connection of the experimental system.
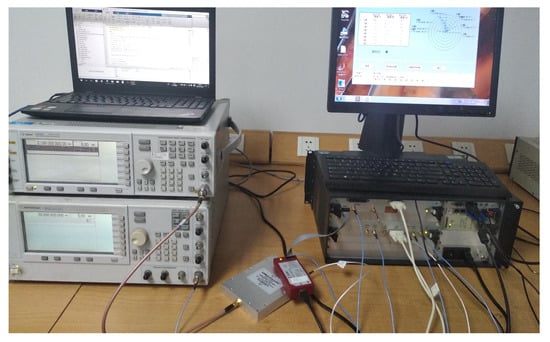
Figure 10.
Experimental system for calibration.
Hardware implementation results are shown in Figure 11. Because the experimental system is carried out under wired conditions, the relative amplitude and phase implementation results have high accuracy, close to the true values set by the signal generator (E4438C). The statistical results of means and RMSEs are shown in Table 2 and Table 3. The lower the power, the worse the measurement accuracy. The power of the eighth calibration signal is 25 dB lower than the first and its calibration results are the worst, 0.0236 dB and 0.1497 deg. The power of the second calibration signal is equal to the first and its calibration results are 0.0236 dB and 0.1497 deg. This experiment verifies that the proposed calibration method can be implemented in communication traffic signal flow.
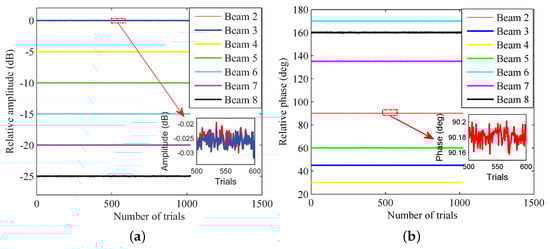
Figure 11.
Experimental results. (a) Relative amplitude. (b) Relative phase.
Table 2.
Relative amplitude statistical results.
Table 3.
Relative phase statistical results.
The additional noise source is not introduced in this experiment. The parameter in this experiment seems infinitely large, and the calibration accuracy approaches the true value infinitely. However, the practical system is affected by thermal noise and quantization noise of ADC chip, resulting in lower experimental calibration accuracy than theoretical and simulation results. Therefore, the main reason for poor calibration accuracy of low-power signals such as the eighth calibration signal is quantization, not channel noise.
6. Conclusions
An online calibration method for large-scale multi-beam antennas is proposed for high-throughput satellite communication systems. Calibration signals based on cyclic m-sequences are injected into the normal communication traffic flow. The receiver of the proposed method can achieve parallel calibration with only one matched-filter and no matrix inversion operation is required. Meanwhile, the calibration accuracy can be maintained among the strong interference from communication. The most powerful application of the proposed method is for large-scale antenna systems due to calibration accuracy and computational complexity advantages.
Author Contributions
Theory analysis, Y.L., C.H. and Z.S.; simulation, Y.L. and C.H.; writing—original draft, Y.L.; writing—review and editing, Y.L., B.L. and J.L. All authors have read and agreed to the published version of the manuscript.
Funding
This research was funded by National Scientific Foundation of China under grant 62001030.
Conflicts of Interest
The authors declare no conflict of interest.
Abbreviations
The following abbreviations are used in this manuscript:
| 6G | Sixth-generation |
| TDMA | Time division multiple access |
| FDMA | Frequency division multiple access |
| CDMA | Code division multiple access |
| BFN | Beamforming network |
| TR | Transmitter and receiver |
| UC | Upconverter |
| DC | Downconverter |
| PA | Power amplifier |
| LNA | Low noise amplifier |
| RMSE | Root mean square error |
| ARMSE | Average root mean square error |
| ADC | Analog to digital converter |
| FPGA | Field programmable gate array |
| Probability density function |
Appendix A. Expectation and Variance for yk
There are two random variables in : and . From the above analysis, the variable follows Gaussian distribution and the variable follows complex Gaussian distribution . Because the square of the standard normal distribution follows the chi-square distribution and , then . Then the expectation and variance of can be derived as and , respectively. According to the central limit theorem, the distribution of can be approximated as follows:
In deriving (A1), we have assumed that which is reasonable for a large-scale antenna system. The Monte Carlo simulation and the above approximation results of probability density function (PDF) [24] for are compared in Figure A1. It can be seen that the approximation results are quite accurate with simulation results.

Figure A1.
Monte Carlo simulation and approximation to the PDF of ().
Figure A1.
Monte Carlo simulation and approximation to the PDF of ().

The third item of (23) involves the product of two Gaussian random variables () [25]. The expectation and variance can be computed as and , respectively. When L is very large (i.e., ), is close to zero and we can neglect statistical characteristics of this item. The last item of (23) also involves the product of two independent Gaussian random variables (). Its expectation and variance are and , respectively. Note that , the coefficient in (23) follows the distribution . Thus, the expectation of is zero and the variance can be expressed as
where and are the real part and imaginary part of , respectively. For a large-scale antenna system and , (A2) can be simplified as follows:
Appendix B. Closed-Form Expressions of and
Appendix B.1. Expression of
The RMSE of the relative amplitude in (20) can be rewritten as
The derivation problem of can be transformed into estimating the statistical characteristics of . Since the estimated amplitude and phase must achieve high accuracy in the calibration mission, we can reasonably assume that and [26]. Then we can obtain the following approximation results:
Substituting (22) into and separating the real part from the imaginary part, can be given by
Equation (A6) is converted into the sum of squares of two non-zero mean Gaussian random variables. Then we convert Equation (A6) to the Gaussian distribution with variance 1 and obtain a random variable Y with non-central chi-square distribution as follows:
where . The expectation and variance of Y can be given by
Considering the coefficient in Y, the expectation and variance of can be approximated as
Appendix B.2. Expression of
Similar to , the RMSE of the relative phase in (21) can be rewritten as
The derivation problem of can be transformed into estimating the statistical characteristics of . Substituting into and separating the real part from the imaginary part, can be given by
where . The denominator of (A16) follows the distribution and the numerator follows . The ratio of two Gaussian random variables, , approximately follows [27,28]. Finally, the RMSE of the relative phase (in degree) can be derived as
References
- Rahmat-Samii, Y.; Densmore, A. Technology trends and challenges of antennas for satellite communication systems. IEEE Trans. Antennas Propag. 2015, 63, 1191–1204. [Google Scholar] [CrossRef]
- Han, S.; I, C.; Xu, Z.; Rowell, C. Large-scale antenna systems with hybrid analog and digital beamforming for millimeter wave 5G. IEEE Commun. Mag. 2015, 1, 186–194. [Google Scholar] [CrossRef]
- Montero, J.; Ocampo, A.; Fonseca, N. C-band multiple beam antennas for communication satellites. IEEE Trans. Antennas Propag. 2015, 63, 1263–1275. [Google Scholar] [CrossRef]
- Hong, W.; Jiang, Z.; Yu, C.; Zhou, J.; Chen, P.; Yu, Z.; Zhang, H.; Yang, B.; Pang, X.; Jiang, M.; et al. Multibeam antenna technologies for 5G wireless communications. IEEE Trans. Antennas Propag. 2017, 65, 6231–6249. [Google Scholar] [CrossRef]
- Chou, H.; Cheng, D. Beam-pattern calibration in a realistic system of phased-array antennas via the implementation of a genetic algorithm with a measurement system. IEEE Trans. Antennas Propag. 2017, 65, 593–601. [Google Scholar] [CrossRef]
- He, G.; Gao, X.; Zhang, R. Impact analysis and calibration methods of excitation errors for phased array antennas. IEEE Access 2021, 9, 59010–59026. [Google Scholar] [CrossRef]
- Kim, D.; Park, S.; Kim, T.; Minz, L.; Park, S. Fully digital beamforming receiver with a real-time calibration for 5G mobile communication. IEEE Trans. Antennas Propag. 2019, 68, 3809–3819. [Google Scholar] [CrossRef]
- Antón, A.; García-Rojo, I.; Girón, A.; Morales, E.; Martínez, R. Phase response calibration of a distributed antenna array for satellite acquisition. IEEE Antennas Wirel. Propag. Lett. 2016, 15, 1731–1734. [Google Scholar] [CrossRef]
- Salas-Natera, M.; Rodríguez-Osorio, R.; Haro, L. Procedure for measurement, characterization, and calibration of active antenna arrays. IEEE Trans. Instrum. Meas. 2013, 62, 377–391. [Google Scholar] [CrossRef]
- Zhang, F.; Gao, H.; Wang, Z.; Fan, W. An improved complex signal-based calibration method for beam-steering phased array. IEEE Antennas Wirel. Propag. Lett. 2021, 20, 2161–2165. [Google Scholar] [CrossRef]
- Xiao, Y.; Xu, Y.; Sun, H.; Xu, X.; Zhou, A. A precise real-time delay calibration method for navigation satellite transceiver. IEEE Trans. Instrum. Meas. 2016, 65, 2578–2586. [Google Scholar] [CrossRef]
- Greene, K.; Chauhan, V.; Floyd, B. Built-in test of phased arrays using code-modulated interferometry. IEEE Trans. Microw. Theory Tech. 2018, 66, 2463–2479. [Google Scholar] [CrossRef]
- Silverstein, S. Application of orthogonal codes to the calibration of active phased array antennas for communication satellites. IEEE Trans. Signal Process. 1997, 45, 206–218. [Google Scholar] [CrossRef]
- Schwerdt, M.; Hounam, D.; Alvarez-Peres, J.-L.; Molkenthin, T. The calibration concept of TerraSAR-X: A multiple-mode, high-resolution SAR. Can. J. Remote Sens. 2005, 31, 30–36. [Google Scholar] [CrossRef]
- Bräutigam, B.; Schwerdt, M.; Bachmann, M. An efficient method for performance monitoring of active phased array antennas. IEEE Trans. Geosci. Remote Sens. 2005, 47, 1236–1243. [Google Scholar] [CrossRef]
- Schwerdt, M.; Bräutigam, B.; Bachmann, M.; Döring, B.; Schrank, D.; Gonzalez, J. Final TerraSAR-X calibration results based on novel efficient methods. IEEE Trans. Geosci. Remote Sens. 2010, 48, 677–688. [Google Scholar] [CrossRef]
- An, J.; Wang, K.; Wang, S.; Lin, Y.; Bu, X. Antenna array calibration for IIoT oriented satellites from orthogonal CDMA to NOMA. IEEE Wirel. Commun. 2020, 12, 28–36. [Google Scholar] [CrossRef]
- Schuss, J.; Sikina, T.; Hilliard, J.; Makridakis, P.; Upton, J.; Yeh, J.; Sparagna, S. Large-scale phased array calibration. IEEE Trans. Antennas Propag. 2019, 67, 5919–5933. [Google Scholar] [CrossRef]
- Liu, S.; Yang, L.; Yang, S. Robust joint calibration of mutual coupling and channel gain/phase inconsistency for uniform circular array. IEEE Antennas Wirel. Propag. Lett. 2016, 15, 1191–1195. [Google Scholar] [CrossRef]
- Luo, X.; Yang, F.; Zhu, H. Massive MIMO self-calibration: Optimal interconnection for full calibration. IEEE Trans. Veh. Technol. 2019, 68, 10357–10371. [Google Scholar] [CrossRef]
- Lin, Y.; Wang, S.; Bu, X.; Xing, C.; An, J. NOMA-based calibration for large-scale spaceborne antenna arrays. IEEE Trans. Veh. Technol. 2018, 67, 2231–2242. [Google Scholar] [CrossRef]
- Hong, Z.; Chauhan, V.; Schonherr, S.; Floyd, B. Code-modulated embedded test and calibration of phased-array transceivers. IEEE Trans. Microw. Theory Tech. 2021, 69, 1846–1859. [Google Scholar] [CrossRef]
- Han, K.; Yang, P.; Nehorai, A. Calibrating nested sensor arrays with model errors. IEEE Trans. Antennas Propag. 2015, 63, 4739–4748. [Google Scholar] [CrossRef]
- Wei, H.; Wang, D.; Zhu, H.; Wang, J.; Sun, S.; You, X. Mutual coupling calibration for multiuser massive MIMO systems. IEEE Trans. Wirel. Commun. 2016, 15, 606–619. [Google Scholar] [CrossRef]
- Marsaglia, G. Ratios of normal variables. J. Stat. Softw. 2006, 16, 1–10. [Google Scholar] [CrossRef]
- Luo, X. Multiuser massive MIMO performance with calibration errors. IEEE Trans. Wirel. Commun. 2016, 15, 4521–4534. [Google Scholar]
- Hayya, J.; Armstrong, D.; Gressis, N. A note on the ratio of two normally distributed variables. Manag. Sci. 1975, 21, 1338–1341. [Google Scholar] [CrossRef]
- Pham-Gia, T.; Turkkan, N.; Marchand, E. Density of the ratio of two normal random variables and applications. Commun. Stat.-Theory Methods 2007, 35, 1569–1591. [Google Scholar] [CrossRef]


Disclaimer/Publisher’s Note: The statements, opinions and data contained in all publications are solely those of the individual author(s) and contributor(s) and not of MDPI and/or the editor(s). MDPI and/or the editor(s) disclaim responsibility for any injury to people or property resulting from any ideas, methods, instructions or products referred to in the content. |
© 2023 by the authors. Licensee MDPI, Basel, Switzerland. This article is an open access article distributed under the terms and conditions of the Creative Commons Attribution (CC BY) license (https://creativecommons.org/licenses/by/4.0/).