Abstract
The global energy demand, along with the proportionate share of renewable energy, is increasing rapidly. Renewables such as thermoelectric generators (TEG) systems have lower power ratings but a highly durable and cost-effective renewable energy technology that can deal with waste heat energy. The main issues associated with TEG systems are related to their vigorous operating conditions. The dynamic temperature gradient across TEG surfaces induces non-uniform temperature distribution (NUTD) that significantly impacts the available output electrical energy. The mismatching current impact may lower the energy yield by up to 70% of extractable thermal energy. As a solution, a hybrid general regression neural network (GRNN) orca predation algorithm (OPA) is proposed; backpropagation limitations are minimized by utilizing the stochastic optimization algorithm named OPA. The conclusions are evaluated and contrasted with highly improved versions of the conventional particle swarm optimization (PSO), grey wolf optimizer (GWO), and Harris hawk optimization (HHO). A detailed analytical and statistical analysis is carried out through five distinct case studies, including field stochastic data study, NUTD, varying temperature, and load studies. Along with statistical matrix errors such as MAE, RMSE, and RE, the results are assessed in terms of efficiency, tracking, and settling time. The results show that superior performance is achieved by the proposed GRNN-OPA based MPPT by 35% faster tracking, and up to 90–110% quicker settling time which, in turn, enables the 4–8% higher energy accumulation over a longer period of operation. A low-cost experimental setup is devised to further validate the practicality of the proposed techniques. From such comprehensive analysis, it can be safely concluded that the proposed GRNN-OPA successfully undertakes the drawbacks of existing classical MPPT methods with higher efficiency.
1. Introduction
Rapid and unprecedented population and economic expansion, higher social living standards, and technical advancements have all contributed to a large increase in global electric power consumption over the course of this century. As a result, power demand must be economically fulfilled in order to maintain a certain degree of comfort on a constant basis. To date, conventional nonrenewable energy sources, such as natural gas, coal, and oil, have remained the primary sources of electric power generation, despite the fact that they emit massive quantities of greenhouse gases that proactively degrade the environment and inevitably endangering the humanity and animal kingdom [1]. Renewable energy sources, such as solar, wind, hydro, tidal, and geothermal energy, provide a secure solution to the looming energy and environmental catastrophe to solve this urgent issue [2,3].
However, it is important to consider the global emissions produced during the production of renewable energy applications, particularly when a sizable quantity of them is needed and results in sizable heat losses. Thermoelectric generation (TEG) is a heat waste energy power production technology. TEGs are structurally and electrically resilient semiconductor devices that can transform thermal energy into electrical energy while maintaining a temperature differential across them [4,5].
TEGs are solid-state devices that convert thermal energy into electricity by preserving a temperature gradient between the output terminals of the generator. It is composed primarily of a collection of minute thermoelectric modules, specifically two semiconductor pins, one of which is P-doped and the other of which is N-doped [6]. These pins are electrically coupled in series and thermally coupled in parallel, and they are tenacious semiconductor hardware both structurally and electrically [7,8].
A TEG also has no mechanical components, is small, has excellent dependability, is lighter in weight, has a long life, and has many other advantages. As a result, TEGs are widely used in a variety of applications, including solar thermoelectric generation systems, combined heat and power (CHP) systems, spark ignition/compression combustion engine driven vehicles, solar thermoelectric cooling systems, thermal energy storage of internal combustion engines, and so on [9].
The effectiveness of TEG system conversion is largely determined by the hardware components and tuning procedures. The thermal efficiency of various materials is now between 3 and 8%. Maximum available power extraction from diverse temperature conditions, i.e., maximum power point tracking (MPPT) is a key duty of TEG. The concept of MPPT originates primarily in solar energy, where PV panels are subjected to varying sun irradiations; hence, several MPPT techniques are used to seek the maximum power point (MPP) under diverse operating situations [10]. It is difficult at the moment to significantly enhance thermal efficiency by inventing new materials [11]. As a result, optimizing MPPT processes is one of the most critical variables in increasing the conversion efficiency of TEG systems [12].
The first pertains to incremental conductance (IC), hill-climbing, and perturb and observe (P and O). Since these algorithms and their derivatives have a fairly basic structure and great dependability, they have been employed in the majority of industrial and home applications [13,14,15]. However, multiple MPPs appear when a TEG system is affected by non-uniform temperature distribution, which is typically caused by the mismatched thermal gradient, loose contact or uneven thermal conductance surface to the TEG module [16,17].
For instance, tremendous various meta-heuristic algorithms, such as genetic algorithm (GA), dragonfly optimization algorithm (DFOA), fast atomic search optimization (FASO) [18], PSO, sailfish optimization (SFO), salp swarm algorithm (SSA) [19], cuckoo search (CS), whale optimization algorithm (WOA), and others [20,21], are widely used on such problems to effectively find the global MPP (GMPP) [16]. In reality, a number of alternative MPPT methodologies have been proposed to achieve MPPT of TEG systems [22,23]. For instance, the P and O technique is used to first disturb a TEG system’s operating point, then investigate the output power to ascertain the direction of variation, and last, maximize the output power [24,25]. Meanwhile, INC was employed for MPPT; it compares the proportion of the gradient of conductance and instantaneous conductance gradually [26]. In addition, open circuit voltage (OCV) approach was presented, and the load voltage was required to be 50% of the open-circuit voltage, whereas work created a fundamental MPPT based on FSCC [27]. Furthermore, the literature developed an MPPT approach based on linear extrapolation, in which just three sample periods are necessary to create MPP under a variety of dynamic conditions [28].
Essentially, the abovementioned strategies are fairly successful for achieving MPPT in string-type TEG systems (each TEG string is positioned along an adiabatic line of heat source and is connected with one converter) or configurable TEG systems (each TEG is separately coupled with one converter) [29,30]. However, these two layouts comprise a huge number of converters, which significantly increases the implementation and execution costs in the original investment as well as future long-term maintenance expenses. In the case of NUTD, where the temperature on TEGs changes substantially, a significant number of converters are necessary to ensure a reasonably high production efficiency. A centralized TEG system, in contrast, can significantly cut such converter expenses by connecting all TEGs in a series parallel. Despite this, many MPPs arise in the presence of NUTD, with a single GMPP and several LMPPs. The aforementioned MPPT systems are readily stuck at LMPP, resulting in a relatively low overall efficiency.
Interestingly, meta-heuristic algorithms can give a strong tool for centralized TEG (C-TEG) systems to implement MPPT under NUTD conditions. These algorithms have the intricate benefits of resilience, model-free and diffusion method, and eradication of local maxima trap. This is a game-changing development. In order to discover the optimal answer, they often imitate biology, social behavior, and chemical or physical law. This permits them to avoid getting trapped at a local minimum and enables them to do so without the requirement of a precise system model. Several MPPT designs have been discovered in photovoltaic (PV) systems operating under partial shading conditions (PSC), in which solar irradiation is spread non-uniformly over PV panels, resulting in multiple MPPs. A multi-LMPPs photovoltaic system exposed to regional shadowing has an MPPT equivalent to a centralized TEG system subjected to NUTD. As a result, it is reasonable to use meta-heuristic techniques to find the best MPP for C-TEG systems [31]. Since they have a high likelihood of finding the global optimal value, they have the following limitations in the MPPT task: dependence on manual knowledge in process parameters, high unpredictability of search, and extended optimization time [32]. The literature proposes a rapid atomic optimization [18] approach for adaptively altering the weight between exploration and usage, implying that it is not important to quantify global and regional exploration using predefined weights.
Despite this, the process of adapting this approach still takes a considerable amount of time. There are various novel approaches that may be used to address the limitations of the meta-heuristic algorithm in each of these domains [33]. Instead of spending a significant amount of time precisely fitting, learning-based solutions make use of neural networks’ exceptional potential for nonlinear fitting to carry out quick function approximation in conjunction with the input duty cycle and output power of TEG systems. For instance, the generalized recurrent neural network (GRNN) is superior to the radial basis function (RBF) neural network. Furthermore, GRNN is capable of considerable nonlinear mapping. For a smaller sample data, accurate predictions can be made quickly. Moreover, as a widely used and successful hyper-parameter optimization approach, Bayesian optimization is commonly used to reduce the unpredictability and unreliability caused by human tweaking, hence enhancing the performance of optimization algorithms. Bayesian optimization, on the other hand, requires less time offline than it does. The main contributions of the presented work are summarized as:
- A novel orca predator algorithm (OPA) is implemented for Hyperparameter tuning of general regression neural network (GRNN).
- Proposed GRNN-OPA-based technique is implemented as MPPT control for TEG system under dynamic thermal gradients.
- Proposed GRNN-OPA-based MPPT control technique can track MPP with 99.96% efficiency within 65 ms under dynamic thermal gradients.
- Comparison of GRNN-OPA is made with GRNN-HHO, GRNN-GWO and GRNN-PSO-based state-of-the-art MPPT techniques.
- The proposed technique is also tested using experimental setup and extracted 7% more power as compared to other techniques.
- Statistical analysis is presented to validate the robustness and stability of the proposed technique.
2. Centralized TEG Modeling
2.1. Configuration of TEG Systems
The TEG system’s architecture is exceedingly flexible. Centralized, string-type, and modularized TEG systems make up the three basic kinds of TEG architectures. MPPT technique research for centralized TEG systems is the primary focus of this study.
Centralized TEG systems, depicted in Figure 1, are straightforward and affordable to implement since they link several TEG strings with a single PWM based DC-DC converter. This DC-DC converter is used to extract the power from TEG modules and deliver it to the load in controlled manner. Therefore, the installation and maintenance costs of modular design TEG systems are higher than those of traditional TEG systems, but the mismatched energy loss is lower [34]. TEG systems are commonly subjected to NUTD because of the unequal distribution of waste heat around the room and the increasing scale of TEG systems, resulting in considerable mismatched power losses.
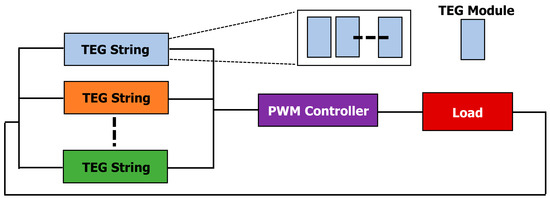
Figure 1.
TEG systems comprising of multiple TEG strings connected to a PWM controller and a load.
The TEG module’s internal architecture and loaded circuit are shown in Figure 2. When connected to an external circuit, a TEG module will transform the thermal energy it is receiving into electrical energy. Temperature changes in the inside of a TEG module are what causes electrons to flow in and out of the module [35]. Open circuit voltage is particularly influenced by temperature on both the cold and the hot sides, as illustrated below:
where represents the Seebeck coefficient; ΔT is a quantity that represents the temperature differential between both the hot and cold sides. The Seebeck effect, as well as the Thomson effect, has an impact on the TEG module. In general, the Thomson coefficient is stated as follows:
where is the hot side temperature and is the cold side temperature and is the average of the hot side and cold side temperatures. The Thomson coefficient for a functional TEG module is not zero. The Seebeck coefficient of a precise TEG module is [36]:
where is the is the Seebeck coefficient’s fundamental element, and is the rate at which it changes, is the reference temperature. The wattage on the load may be determined using the basic circuit theory as follows:
where and is the internal resistance of load and TEG, respectively.
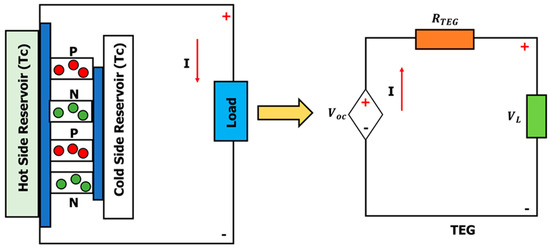
Figure 2.
The TEG module’s intrinsic architecture and loaded circuit.
2.2. NUTD-Influenced Centralized TEG Model
The current of a centralized TEG system [17] is defined as follows:
According to Equation (7), the output power is denoted as follows:
Centralized TEG systems have the following overall output power:
Power and voltage curve on the other hand, is a superposition of many paraboloids, leading to a larger number of LMPPs and a perfect MPP in the P-V curve. Clearly, output power can only be maximized if TEG systems are constantly kept at an ideal MPP.
3. Orca Predation Algorithm
3.1. Inspiration
Orcas are highly socialized carnivores that belong to the dolphin family and are extremely clever. They live in small family pairings which comprising about 30 individuals. In a normal pod of orcas, there are around 20& babies, 20& adult males, and 60& females; however, in a bigger pod, there are often more male orcas. The female orcas stay with the group for their whole lives, while the males depart when the population of the community grows too vast and start a new community somewhere.
Individuals in a group swim within 100 m of one another, share prey, and seldom leave the group for prolonged hours. Orcas have excellent vision; yet, it is useless for hunting or traversing in a pitch black underwater acoustic. Orcas, similarly to other cetaceans, rely heavily on sonar to analyze their underwater surroundings.
Orcas hunt in packs and have specific hunting strategies, similarly to wolves. When they come upon a swarm of prey, they tend to communicate with one another and plot their strategy using ultrasonic rather than leaning on them and swallowing vast numbers of prey. The prey is shocked or killed as everyone blows bubbles, flashes their pale guts, and whips their spines against the sphere. Once the group is under control, the orca uses its tail to batter the shoal’s edge in order to grab the food.
The orca predator algorithm has been proposed in this study based in order to represent orcas’ social agglomeration, situational awareness, and hunting behavior (OPA).
3.2. Development of an Orca Colony
In OPA, a group of orcas is created. The orca can swim in one, two, three, and even multi-dimensional spaces. The mathematical analysis of the orca group is given as follows:
where is the population of orca which depicts the set of all possible outcomes for the said problem, shows the location of the orca that indicates solution of the candidate located at the said problem, and is the dimension of the search space.
3.3. Chasing Phase
As soon as orcas stumble upon a shoal of fish, they do not just swarm to hunt; they collaborate and transmit information with one another via sonar technology. Thus, forcing their prey to move to a safe place for their hunting. Furthermore, this activity can be divided into two steps namely driving and surrounding prey.
Therefore, parameter is involved to alter the orca’s likelihood of performing these two operations separately. The value of is chosen in between [0, 1]. If the random value is greater than , then the driving phase is executed; if not, then the encircling phase is executed.
3.3.1. Driving of Prey
Orcas must surface to pursue a shoal of fish when they spot one. If there are fewer orcas, the resulting swimming space will likewise be smaller, or the hunting grounds will be easier to navigate and the orcas will be able to recognize their prey quickly and accurately.
On the other hand, a large school of orcas means a large dimension of swimming, or the hunting environment would be more sophisticated, and the orca’s swimming would be easily dispersed and reaching the target position will be difficult.
Additionally, the individual orcas move closer to their prey, thus regulating the orca group’s center position to maintain its near position to the prey and avoid the diversion from the orca group’s objective. Depending on the population size of the orca, we generalize two chasing tactics. The first approach is used when the orca group is big (); the second way is used when the orca group is small (). Figure 3 depicts the process of orca prey drive.
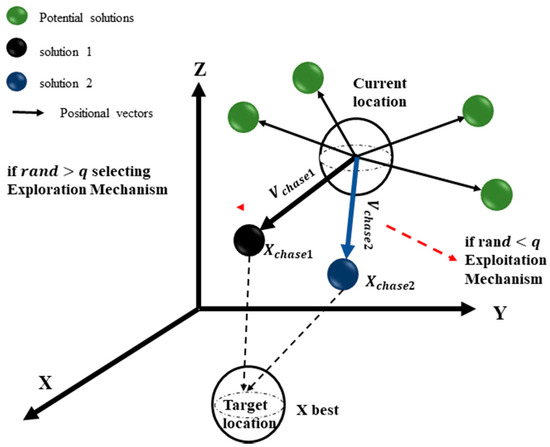
Figure 3.
Graphical depiction of orcas driving the prey [37].
The orca’s movement speed and related position may be expressed as follows:
where and represents the chasing speed of the orca at time after selecting the first and the second chasing method, respectively, the number of cycles is denoted by , represents global best position, is the average location of the orca group; whereas is a random number whose value lies in the range of [0, 2], is a constant whose value is 2. Several experiments concluded that the best value of in terms of performance is since q lies in the range of [0, 1]. The is the random number which is uniformly distributed between 0 and 1. is the current particles position, is the position of best particle.
3.3.2. Encircling of Prey
As soon as the shoal has been brought to the surface, orcas must form a controlled sphere around the school of fish. Orcas communicate with one another utilizing sonar throughout the encirclement and compute their future movement location depending on the position of surrounding orcas. Assuming that orcas self-locate based on locations of randomly selected orcas, compute the location after travelling as:
where denotes the maximum number of iterations, show three randomly chosen orcas from orcas, and , represents the location of the orca.
3.3.3. Adjustments of Positions
Sonar enables orcas to locate their target and modify their existing positions. If the orcas see the fish approaching while they are still monitoring the new position, they will keep doing so; otherwise, they will stay in the previous spot. The following formula is used to alter their positions:
where is the fitness function value associated with , whereas illustrates the fitness function with respect to .
3.4. Attacking Phase
3.4.1. Attacking Prey
An assumption of four orcas has been made, which correlate to the four best locations to strike in the circle. In this algorithm only four orcas were chosen since more orcas would lead the algorithm to take longer to reach its convergence.
When more orcas seek to enter the region, they must go in the path of the four orcas that are already there. The path of migration may be controlled by the proximity of orcas picked at random if orcas opt to re-enter the cage after feeding to substitute other orcas. Figure 4 illustrates how this procedure may be expanded into a model. The following formula can be used to calculate the orca’s movement speed and position during the assault phase.
where represents the orca’s velocity vector while hunting prey at time , and represents the orca’s velocity vector when returning to its containment at time . The four orcas best position is represented as , , , , respectively, , exhibits the location of orca at the time following the assault phase, and is a random number between [0, 2] and [−2.5, 2.5], respectively.
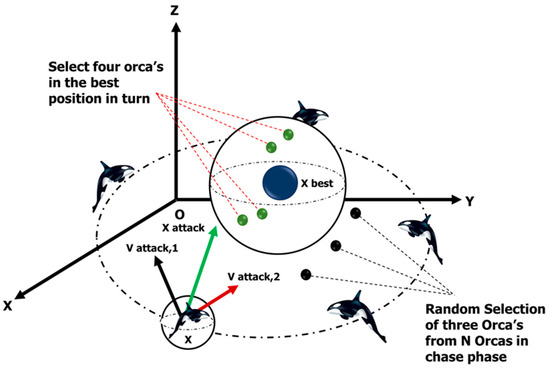
Figure 4.
Graphical representation of orcas attacking prey.
3.4.2. Adjustment of Positions
Orcas use sonar to find food and alter their positions in a similar manner to how they chase. After the school has been tamed, one orca will cruise to the school’s perimeter and use its tail to search for food. The orca’s position is allocated the problem’s feasible range’s minimal limit value (), which may be written as the following pseudocode shown in Figure 5.
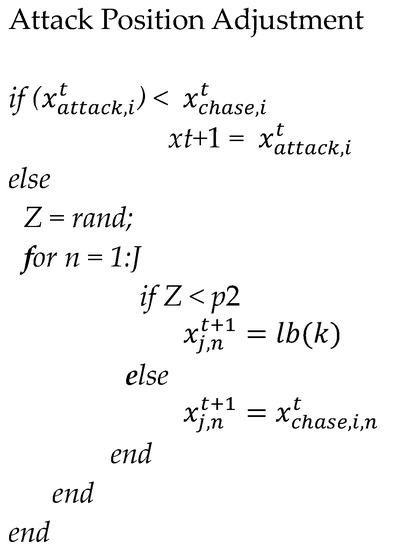
Figure 5.
Pseudocode for position updating using OPA.
where and represents a constant number whose value lies in the range of [0, 1]. This value is selected differently according to the problems.
4. General Regression Neural Network (GRNN)
GRNN is a single-pass neural network in which the hidden layer has a Gaussian activation function. The layers of GRNN are input, hidden, summation, and division. One may find the regression of the random variable on the observed values of the random variable as follows:
where is a known joint continuous probability density function. The general structure of GRNN is shown in Figure 6.
When is undetermined, it is required to calculate it using a set of x and y observations. The nonparametric consistent estimator proposed by Parzen may be used to calculate as follows:
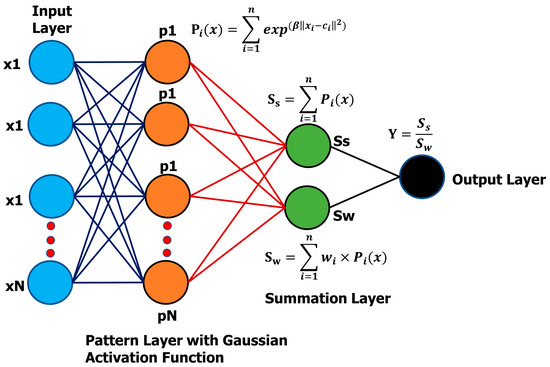

Figure 6.
Structure of GRNN consisting of hidden layers.
Substituting Equation (22) into Equation (21) leads to the following:
4.1. Training of GRNN
The training of GRNN is a straightforward procedure. The training objectives are the output weights, while the input weights are simply the transposed inputs. The quantity of neurons after training corresponds to the amount of training data since GRNN is an associative memory.
The adoption of a data dimensionality reduction method, such as clustering or principal component analysis, is one of the proposed treatments since this training strategy is unsuccessful if there are a high number of training examples (PCA). As mentioned in Algorithm 1, one of the innovative methods for decreasing data dimensionality is the construction of GRNN using an error-based algorithm. Based on the prediction error, the algorithm will decide whether or not to incorporate that input in the training of the GRNN before doing so. Pseudo code of OPA based GRNN is shown in Algorithm 1.
| Algorithm 1: Training of GRNN |
| 1: Train GRNN with 10% training data |
| 2: for i ≤ i final |
| 3: find the output of GRNN yi of input ji |
| 4: find MSE |
| 5: if MSE > Threshold then |
| 6: Train GRNN with |
| 7: end if |
| 10: end |
4.2. Smoothing Parameter Adjustment of GRNN
Since (smoothing parameter) is the sole free parameter in GRNN and having appropriate values would increase GRNN accuracy, it should be assessed, and because there is no ideal analytical solution for determining alpha, numerical methods can be employed to approximate it.
The holdout technique is one of the suggested approaches. In this method, samples are randomly eliminated from the training dataset; after that, the result is computed using the omitted samples and a GRNN with a fixed ; and lastly, the error the sample target and output of the network is calculated. For every alpha value, this procedure is repeated and the smoothing parameter () which has the minimum sum of errors is selected as the optimal smoothing parameter.
Other search and optimization strategies may also be employed to locate . Genetic algorithms (GA) and differential evolution (DE), for example, are viable solutions.
5. Results and Discussion
The results have been compared against hybrid GRNN–Harris Hawks Optimization GRNN–HHO, GRNN–Grey Wolf Optimization (GRNN-GWO), and GRNN–Particle Swarm Optimization (GRNN-PSO) models. Case 1, case 2, and case 3 are devised as STC startup tests, varying operating condition and stochastic industrial environment cases followed by experimental verification of GRNN-OPA model. The performance measuring factors, including tracking time, power tracking efficiency and statistical indices, have been employed for comparison [38]. The objectives of the optimization process are maximizing the output power and minimization of error between the actual and tracked power.
5.1. Case 1: Start-Up Test
The starting test is used to verify the control action’s achievability at STC [17]. TEG system’s zero point is set as starting point. For this case, the hot side temperature of all modules in a string is 280 °C and the cold side temperature is 35 °C. The theoretical GMPP lies at 665.3 . Power and duty cycle comparisons in Figure 7 and Figure 8 showing fewer samples are utilized to achieve tracked power. GRNN-OPA oscillations at GM are nonexistent.

Figure 7.
Comparison of power tracked in case 1.
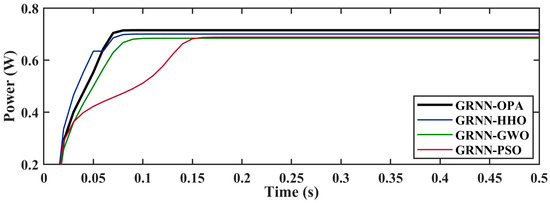
Figure 8.
Comparison of duty cycle variation in case 1.
A substantially lower tracking time is observed by PSO in Figure 7 due to the observable prolonged exploration phase with higher oscillations while tracking GM, HHO shows a similar track. As summarized in Table 1, the tracked power using GRNN-OPA, GRNN-HHO, GRNN-GWO and GRNN-PSO is 665.1 W, 653.6 W, 648.4 W, and 646.6 W with an efficiency of 99.96%, 98.24%, 97.45%, and 97.18%, respectively. GRNN-OPA track and settles at GM is 65 ms which is 71 ms faster than HHO and 45 ms quicker than PSO, which can be validated through Figure 7. A comparison of voltage transients is presented in Figure 8. Table 1 and Figure 9 show that GRNN-OPA harvests maximum energy compared to competing MPPT techniques because of its successful exploratory and exploitative behavior. This is an essential characteristic for comparison.

Table 1.
Comparison of results for case 1.
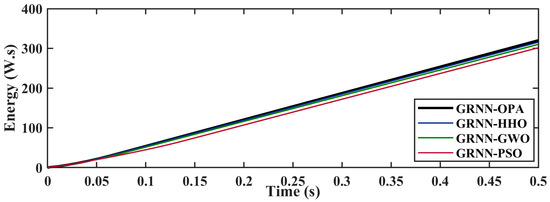
Figure 9.
Comparison of energy extracted in case 1.
5.2. Case 2: Varying NTD
The output power is positively proportional to operating temperature and load match has a predominant effect upon voltage drop. Case 2 deals with the rapidly changing temperature across TEG’s hot and cold sides. The aggregated GMPP lies at 342.4. The test pattern covers all the ranges of operational temperature feasible in the field operations of the TEG system. A transition occurs every 500 ms. The magnitude of temperature for asphalt materials can reach 60 °C on average during day time.
Figure 10 shows the comparison of power efficiency. The iterative duty cycle is compared in Figure 11. GRNN-OPA achieve the highest power and efficiency in tracking power 342.1 W of power with an efficiency of 99.91%, followed by GRNN-HHO at 337.4 W, GRNN-GWO 332.9 W, and GRNN-PSO at 327.3 W, having 98.53%, 97.22%, and 95.58% respectively. The proposed techniques achieve 1.2–4.7% more power. It indicates a higher energy yield and efficiency.
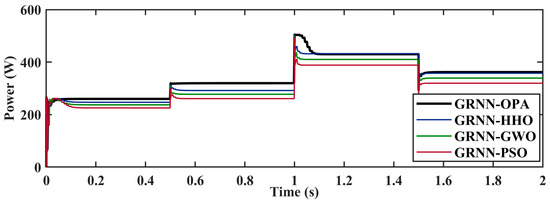
Figure 10.
Comparison of power tracked in case 2.
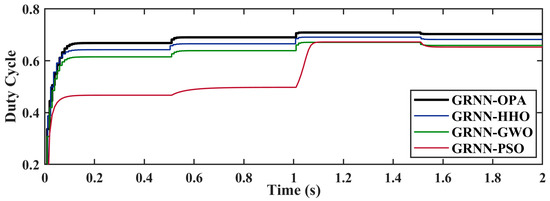
Figure 11.
Comparison of duty cycle variation in case 2.
The results in Figure 10 and Figure 11 show that GRNN-OPA has the shortest TT of 69 ms with a corresponding ST of 110 ms. The detailed comparison is shown in Table 2. The standard PSO takes 121 ms to track GM in fast-varying temperatures and causes loss of power due to random oscillations. Under NUTD conditions, the LM trap becomes predominant and is a major cause of power loss. The GRNN-OPA, GRNN-HHO, and GRNN-PSO have TT of 75 ms, 89 ms, and 121 ms. The extracted energy comparison is shown in Figure 12.

Table 2.
Comparison of results for case 2.
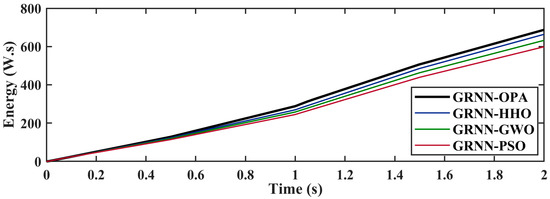
Figure 12.
Comparison of energy extracted in case 3.
5.3. Case 3: Stochastic Variation
The nonuniform temperature causes major drawbacks in thermoelectric couples power generation. Different heat density produces different current and current across TEG terminals. Thermal profile of cement rotary kiln is shown in Figure 13. There is a mismatch scenario as a result of this variation in the series current. The least productive panel regulates how much current may travel through a group of modules. The extra power of other modules is dissipated in the underperforming region and the hotspot effect is produced. The power is dissipated in the form of heat energy which may damage the TEG modules acting as a resistive load. A small mismatch in series connected TEG modules as power sources may lower its production capacity by up to 60–70%. To isolate the underperforming modules, bypass diodes are installed in parallel with each module. Underperforming modules are separated during mismatch brought on by NUTD by turning on bypass diodes. This is the most cost-effective method to minimize the impact of the mismatched current generation. This case sheds light on 24-h industrial operation in the real world. The 24-h temperature profile is designed by examining the literature for an industrial rotary kiln surface with active fan air cooling [39].
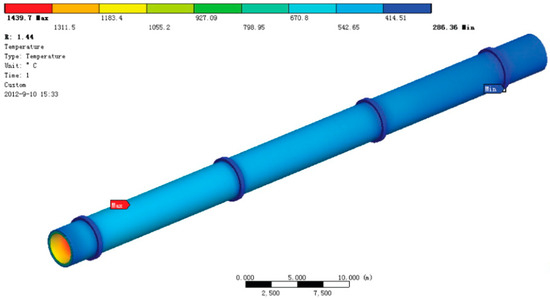
Figure 13.
Thermal profile of a cement rotary kiln outer surface.
Figure 14 and Figure 15 provide the hot side and cold side temperature profiles with a sample time of 10 min. The maximum average power per hour obtained under stochastic NUTD conditions by GRNN-OPA, GRNN-HHO, GRNN-GWO, and GRNN-PSO is 249.2 W, 244.6 W, 237.9 W, and 234.5 W, respectively, leading up to 99.1% efficiency of tracking by GRNN-OPA. The PSO gets stuck in LM’s and its power fluctuates vigorously achieving the lowest efficiency of 92%. Average power is a composition of both transient and steady-state power tracking, which co-relates to the exploration and exploitation of search space in SI optimization. Total energy harvest is better suited to exhibit the robustness of MPPT control action. The highest energy is 5.98 by GRNN-OPA, followed by GRNN-HHO 5.87 , GRNN-GWO 5.71 , and the least average is achieved by GRNN-PSO at 5.63 . The lower magnitude of PSO is caused by LM trap, oscillations at MPP, slower settling, and larger random fluctuations as seen in Figure 16 power transient comparison.
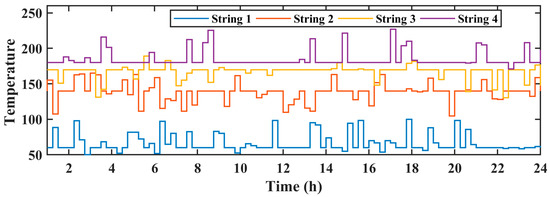
Figure 14.
Temperature variation of hot side.

Figure 15.
Temperature variation of cold side.

Figure 16.
Comparison of power tracked in case 3.
The GRNN-OPA tracks the GM within 6–8 iterations and settles at MPP within 12 iterations. HHO, GWO, and PSO take min of 15 iterations to settle. Fluctuations are caused by the alpha-leader change used by GWO to update the better solution vectors of searching alpha and beta candidate solutions in the search space. An improvement of 5–6% in power tracking efficiency, 60–80% in tracking and settling time, and up to 95% ripple reduction ( W). The performance in case 3 can be summarized as OPA > HHO > GWO > PSO.
5.4. Experimental Verification
The GRNN-OPA is run on functional hardware in real time. The output power of the dc voltage-source-based TEG emulator fluctuates with small changes in voltage. The fluctuation in terminal voltage for the TEG module may be approximated as a change in operating temperature. The TEG emulator is connected to the load through the DC-DC boost converter. On a low-cost microcontroller, the GRNN-OPA based MPPT method is developed. It also shows that the GRNN-OPA approach can be applied to real-time hardware with ease. Figure 17 depicts the hardware arrangement.

Figure 17.
Comparison of energy extracted in case 3.
TEG emulator is used to experimentally evaluate the suggested MPPT approaches. It goes into further detail on the two TEG system emulator circuits. Electrically, a voltage source with internal resistance can be used to mimic a thermoelectric generator. Ref. [36] suggests the emulator design, in which the DC power supply is combined with the TEG module to replicate the electrical behavior of the entire system. The arrangement used in ref. [40] is followed in the creation of the TEG emulator. As shown in Figure 4, a temperature-dependent voltage source simulates the TEG module. The open-circuit voltage (), according to the mathematical connection in Equation (6), is a function of temperature difference. As a result, the properties of the TEG module may be mimicked by a power source with high voltage and low series resistance. Rapid fluctuations in DC source voltages are generated to mimic temperature swings.
The hardware components’ electrical connection is shown in Figure 18. The DC boost converter receives the outputs from TEG emulators. The sensors give the microcontroller the input samples it needs to test the fitness function and modify the control signal. To run the DC converter in continuous current mode, the operating frequency is maintained constant at 61 . The MATLAB-Arduino data collection interface is used to track how control is having an effect. The experimental setup is shown in Figure 19.
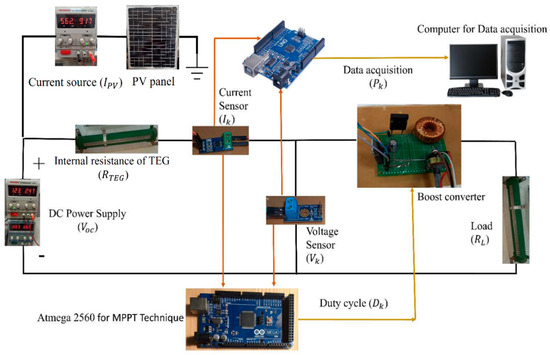
Figure 18.
PV-TEG emulator hardware setup.
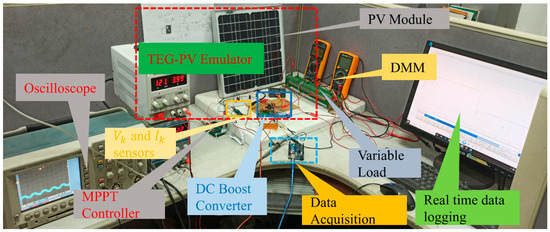
Figure 19.
PV-TEG emulator hardware setup.
A comparison of the experimental data between GRNN-GWO and GRNN-OPA is given in this section. As shown in Figure 20, GRNN-PSO tracks and settles at GMPP in 150 with a power of 43.48 , which is lower than the power recorded by GRNN-OPA.

Figure 20.
PSO-GRNN tracked power.
Due to the successful prediction of the suggested approach, Figure 21 illustrates the GRNN-OPA tracking the maximum power in a short amount of time. GRNN-OPA has a considerable amount of power. Our approach takes milliseconds to monitor GMPP, and the power recorded is 46.55 .

Figure 21.
GRNN-OPA tracked power.
5.5. Common Results and Discussion
This section highlights the outcomes that are universal to all case studies.
5.5.1. Settling Time and Tracking Time
The MPPT controller’s tracking time (TT) is the time it takes to find GM, and the settling time is the time it takes for its seeking agents in search space to converge on GMPP without oscillations. Within the shortest number of repetitions, the lowest TT and ST are favored. Two significant qualitative indicators are tracking time and settling time. An efficient MPPT controller should have the fewest possible time limitations. OPA has the greatest ST and TT, followed by HHO, GWO, and PSO. On average, the proposed techniques give 45–65% improvement in faster settling time. The shorter tracking time exhibits the robustness of the MPPT controller operation.
5.5.2. Power Tracking Efficiency
The MPPT controller’s most essential feature is its efficiency. The greatest and average power efficiencies are investigated. The proposed approaches beat the competing solutions in both indexes. PSO and GWO’s power tracking efficiency in NUTD circumstances are exposed in the CPS and field atmospheric case studies.
5.5.3. Oscillations and Fluctuations
Oscillations in voltage transients near MPP are a key concern with traditional approaches. Similarly, SI-based controllers that use Levy functions or Brownian motion functions to break LM traps show variations. These oscillations are not good. Power and voltage transients are effectively eliminated using the proposed strategies. In all situations, the waves are 1 W.
5.5.4. Statistical Analysis and Energy Harvest
OPA harvests the most energy, followed by HHO, GWO, and PSO. In a hybrid framework, PSO is the least successful at achieving redundancy. This is due to its durability and general effectiveness. The statistical analysis of the suggested MPPT approaches is shown in Figure 22. Relative error (RE), mean absolute error (MAE), and root mean square error (RMSE) are used to assess the approaches’ sensitivity.
where is the maximum output power of the PV system, is the total number of runs, and is the output power in the run. Studies include median, means, standard deviation, and success rate (SR) in addition to the measurements in Equations (24)–(26). Comparing the suggested method to GRNN-HHO, GRNN-GWO, and GRNN-PSO, reduced RE and MAE are obtained.
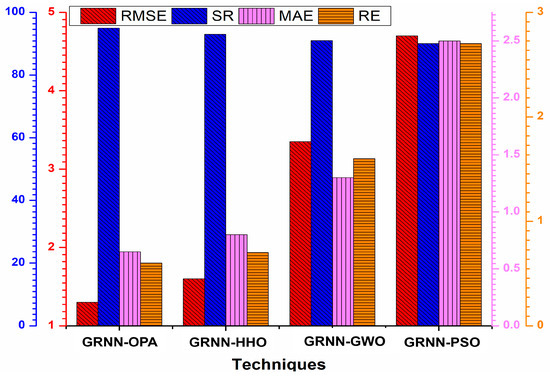
Figure 22.
Statistical analysis of the competing techniques.
6. Conclusions
This article presents a hybrid machine learning swarm intelligence intelligent control technique that has been developed to maximize the power output from centralized TEG systems under various operating conditions. The research addresses the need for a comprehensive analysis of the GRNN training through swarm intelligence optimization algorithm while undertaking the problems of slow convergence and the existence of multiple local solutions in TEG MPPT control. The outcomes are contrasted with recently developed stochastic algorithms HHO, GWO, and standard PSO in different operational circumstances. The statistical and analytical indices-based comparative analysis is made. Effective mathematical modeling, parameter adjustment, and repetition avoidance in GM tracking are key features for improved performance. Robustness, oscillations minimization, and stable output electrical transients are achieved. The ripples, fluctuations, and overshot are minimized through the effective tuning of the optimization process. The power tracking efficiency is up to 99.96%, with output oscillations were reduced to 1 W. On average 6% more power is achieved compared to classic PSO. As compared to modern SI-based MPPT controllers, 40–60% quicker tracking time improvement is exhibited. Under field stochastic atmospheric circumstances, GRNN-OPA operates adequately. The experimental evaluation verifies the controller’s usability in real-time applications. It is reasonable to say that the proposed GRNN-OPA outperforms existing techniques, using lesser computational resources, enhancing the output power of TEG as a renewable energy resource and adding to the feasibility of the TEG systems as a scalable and reliable energy sources.
To increase the efficiency of the electricity generated by renewable sources, the MPPT issue will eventually be expanded to additional renewable energy sources. The increased economic viability of renewable energy sources encourages its application to combat climate change through high-efficiency functioning.
Author Contributions
Data curation, Resources, Writing—original draft, Visualization, N.M.K.; Formal analysis, Methodology, Writing—review & editing, A.A.; Investigation, S.K.H.; Methodology, Validation, M.M.; Investigation, Writing—original draft, M.H.Z.; Project administration, Funding acquisition, Supervision, N.A. All authors have read and agreed to the published version of the manuscript.
Funding
This research received no external funding.
Institutional Review Board Statement
Not applicable.
Informed Consent Statement
Not applicable.
Data Availability Statement
Not applicable.
Conflicts of Interest
The authors declare no conflict of interest.
Abbreviations
| TEG | Thermoelectric Generator |
| MPPT | Maximum Power Point Tracking |
| P and O | Perturb and observe |
| MAE | Mean Absolute Error |
| RMSE | Root Mean Square Error |
| IC | Incremental Conductance |
| MRA | Mud Ring Optimizer |
| GWO | Grey Wolf Optimizer |
| GM | Global Maxima |
| PSO | Particle Swarm Optimization |
| WOA | Whale Optimization Algorithm |
| GMPP | Global Maximum Power Point |
| LMPP | Local Maximum Power Point |
| NUTD | Non-uniform Temperature Distribution |
| OCV | Open Circuit Voltage |
| FSCC | Fractional Short Circuit Current |
| PSC | Partial Shading Condition |
| PWM | Pulse Width Modulation |
| PCA | Principle Component Analysis |
| TT | Tracking Time |
| ST | Settling Time |
| LM | Local Minima |
| SI | Swarm Intelligence |
| CPS | Complex Partial Shading |
| GRNN-HHO | General Regression Network–Harris Hawk Optimization |
| GRNN-PSO | General Regression Network–Particle Swarm Optimization |
| GRNN-GWO | General Regression Network–Grey Wolf Optimization |
| The temperature at STC condition () | |
| Temperature () | |
| Equivalent series resistance cell | |
| Parallel equivalent resistance | |
| Series equivalent resistance | |
| The thermal voltage of the PV module | |
| Output voltage | |
| Duty cycle | |
| Step size of duty cycle |
References
- Anand, M.P.; Rajapakse, A.; Bagen, B. Stochastic Model for Generating Synthetic Hourly Global Horizontal Solar Radiation Data Sets Based on Auto Regression Characterization. Int. Energy J. 2020, 20, 181–200. [Google Scholar]
- Mirhosseini, M.; Rezania, A.; Rosendahl, L. Power optimization and economic evaluation of thermoelectric waste heat recovery system around a rotary cement kiln. J. Clean. Prod. 2019, 232, 1321–1334. [Google Scholar] [CrossRef]
- Wei, X.; Amin, M.A.; Xu, Y.; Jing, T.; Yi, Z.; Wang, X.; Xie, Y.; Li, D.; Wang, S.; Zhai, Y. Two-stage cooperative intelligent home energy management system for optimal scheduling. IEEE Trans. Ind. Appl. 2022, 58, 5423–5437. [Google Scholar] [CrossRef]
- Attivissimo, F.; Di Nisio, A.; Lanzolla, A.M.L.; Paul, M. Feasibility of a photovoltaic–thermoelectric generator: Performance analysis and simulation results. IEEE Trans. Instrum. Meas. 2015, 64, 1158–1169. [Google Scholar] [CrossRef]
- Zafar, M.H.; Al-Shahrani, T.; Khan, N.M.; Mirza, A.F.; Mansoor, M.; Qadir, M.U.; Khan, M.I.; Naqvi, R.A. Group Teaching Optimization Algorithm Based MPPT Control of PV Systems under Partial Shading and Complex Partial Shading. Electronics 2020, 9, 1962. [Google Scholar] [CrossRef]
- Bahrami, A.; Schierning, G.; Nielsch, K. Waste Recycling in Thermoelectric Materials. Adv. Energy Mater. 2020, 10, 1904159. [Google Scholar] [CrossRef]
- Fathabadi, H. Novel solar-powered photovoltaic/thermoelectric hybrid power source. Renew. Energy 2020, 146, 426–434. [Google Scholar] [CrossRef]
- Zafar, M.H.; Khan, N.M.; Mansoor, M.; Khan, U.A. Towards green energy for sustainable development: Machine learning based MPPT approach for thermoelectric generator. J. Clean. Prod. 2022, 351, 131591. [Google Scholar] [CrossRef]
- El-Shahat, A.; Bhuiyan, M.S.R. Thermoelectric Generator Performances and Efficiency Analysis Integrated with MPPT Techniques. In Proceedings of the 2021 International Conference on Sustainable Energy and Future Electric Transportation (SEFET), Hyderabad, India, 21–23 January 2021; IEEE: Piscataway, NJ, USA, 2021. [Google Scholar]
- Hao, J.; Chen, Z.; Ge, Z.; Sun, J.; Du, X.; Chen, Q. Optimal flow layout and current allocation for improving the thermoelectric refrigeration system based on heat current method. Int. J. Energy Res. 2021, 46, 2826–2839. [Google Scholar] [CrossRef]
- Kanimba, E.; Pearson, M.; Sharp, J.; Stokes, D.; Priya, S.; Tian, Z. A comprehensive model of a lead telluride thermoelectric generator. Energy 2018, 142, 813–821. [Google Scholar] [CrossRef]
- Karbaschi, H.; Nouri, N.; Rezaei, M.; Rashedi, G. Thermoelectric power generation efficiency of zigzag monolayer nanoribbon of bismuth. Nanotechnology 2020, 31, 375403. [Google Scholar] [CrossRef] [PubMed]
- Jena, S.; Kar, S.K. Employment of solar photovoltaic-thermoelectric generator-based hybrid system for efficient operation of hybrid nonconventional distribution generator. Int. J. Energy Res. 2020, 44, 109–127. [Google Scholar] [CrossRef]
- Jiang, B.; Liu, X.; Wang, Q.; Cui, J.; Jia, B.; Zhu, Y.; Feng, J.; Qiu, Y.; Gu, M.; Ge, Z.; et al. Realizing high-efficiency power generation in low-cost PbS-based thermoelectric materials. Energy Environ. Sci. 2020, 13, 579–591. [Google Scholar] [CrossRef]
- Kumar, P.M.; Jagadeesh Babu, V.; Subramanian, A.; Bandla, A.; Thakor, N.; Ramakrishna, S.; Wei, H. The design of a thermoelectric generator and its medical applications. Designs 2019, 3, 22. [Google Scholar] [CrossRef]
- Ming, T.; Yang, W.; Huang, X.; Wu, Y.; Li, X.; Liu, J. Analytical and numerical investigation on a new compact thermoelectric generator. Energy Convers. Manag. 2017, 132, 261–271. [Google Scholar] [CrossRef]
- Mansoor, M.; Mirza, A.F.; Duan, S.; Zhu, J.; Yin, B.; Ling, Q. Maximum energy harvesting of centralized thermoelectric power generation systems with non-uniform temperature distribution based on novel equilibrium optimizer. Energy Convers. Manag. 2021, 246, 114694. [Google Scholar] [CrossRef]
- Yang, B.; Zhang, M.; Zhang, X.; Wang, J.; Shu, H.; Li, S.; He, T.; Yang, L.; Yu, T. Fast atom search optimization based MPPT design of centralized thermoelectric generation system under heterogeneous temperature difference. J. Clean. Prod. 2020, 248, 119301. [Google Scholar] [CrossRef]
- Mirza, A.F.; Mansoor, M.; Ling, Q.; Yin, B.; Javed, M.Y. A Salp-Swarm Optimization based MPPT technique for harvesting maximum energy from PV systems under partial shading conditions. Energy Convers. Manag. 2020, 209, 112625. [Google Scholar] [CrossRef]
- Xie, W.; Huang, G.; Zhang, X.; Deng, F. A Maximum Power Point Tracking Controller for Thermoelectric Generators. In Proceedings of the 2017 36th Chinese Control Conference (CCC), Dalian, China, 26–28 July 2017; IEEE: Piscataway, NJ, USA, 2017. [Google Scholar]
- Yang, B.; Wang, J.; Zhang, X.; Zhang, M.; Shu, H.; Li, S.; He, T.; Yang, L.; Yu, T. MPPT design of centralized thermoelectric generation system using adaptive compass search under non-uniform temperature distribution condition. Energy Convers. Manag. 2019, 199, 111991. [Google Scholar] [CrossRef]
- Zhang, X.; Tan, T.; Yang, B.; Wang, J.; Li, S.; He, T.; Yang, L.; Yu, T.; Sun, L. Greedy search based data-driven algorithm of centralized thermoelectric generation system under non-uniform temperature distribution. Appl. Energy 2020, 260, 114232. [Google Scholar] [CrossRef]
- Zhang, X.S.; Yang, B.; Yu, T.; Jiang, L. Dynamic Surrogate Model Based Optimization for MPPT of Centralized Thermoelectric Generation Systems under Heterogeneous Temperature Difference. IEEE Trans. Energy Convers. 2020, 35, 966–976. [Google Scholar] [CrossRef]
- Motiei, P.; Yaghoubi, M.; GoshtasbiRad, E. Transient simulation of a hybrid photovoltaic-thermoelectric system using a phase change material. Sustain. Energy Technol. Assess. 2019, 34, 200–213. [Google Scholar] [CrossRef]
- Omidi, B.; Rahbar, N.; Kargarsharifabad, H.; Rashidi, S. Combination of a solar collector and thermoelectric cooling modules in a humidification–dehumidification desalination system-experimental investigation with energy, exergy, exergoeconomic and environmental analysis. Energy Convers. Manag. 2020, 225, 113440. [Google Scholar] [CrossRef]
- Yedala, N.; Kaisare, N.S. Modeling of Thermal Integration of a Catalytic Microcombustor with a Thermoelectric for Power Generation Applications. Energy Fuels 2021, 35, 5141–5152. [Google Scholar] [CrossRef]
- Dalala, Z.M.; Zahid, Z.U. New MPPT Algorithm Based on Indirect Open Circuit Voltage and Short Circuit Current Detection for Thermoelectric Generators. In Proceedings of the 2015 IEEE Energy Conversion Congress and Exposition (ECCE), Montreal, QC, Canada, 20–24 September 2015; IEEE: Piscataway, NJ, USA, 2015. [Google Scholar]
- Avila, L.; De Paula, M.; Trimboli, M.; Carlucho, I. Deep reinforcement learning approach for MPPT control of partially shaded PV systems in Smart Grids. Appl. Soft Comput. 2020, 97, 106711. [Google Scholar] [CrossRef]
- Yuan, C.; Sadashivaiah, G.; Bechtold, T.; Rudnyi, E.B. Efficient Design Optimization of a Thermoelectric Generator by a Combination of Model Order Reduction and Thermal Submodeling Techniques. In Proceedings of the 33rd International ECMS Conference on Modelling and Simulation, Caserta, Italy, 11–14 June 2019; ECMS: Caserta, Italy, 2019. [Google Scholar]
- Zhang, H.; Yue, H.; Huang, J.; Liang, K.; Chen, H. Experimental studies on a low concentrating photovoltaic/thermal (LCPV/T) collector with a thermoelectric generator (TEG) module. Renew. Energy 2021, 171, 1026–1040. [Google Scholar] [CrossRef]
- Khan, M.K.; Zafar, M.H.; Rashid, S.; Mansoor, M.; Moosavi, S.K.R.; Sanfilippo, F. Improved Reptile Search Optimization Algorithm: Application on Regression and Classification Problems. Appl. Sci. 2023, 13, 945. [Google Scholar] [CrossRef]
- Mujeeb Khan, N.; Mansoor, M.; Moosavi, S.K.R.; Khan, K.; Qadir, Z.; Zafar, M.H. Machine Learning-Based Maximum Power Point Tracking Technique for Concentrated PV/TEG System Under Non-uniform Environmental Conditions. In Artificial Intelligence of Things for Smart Green Energy Management; Springer: Berlin/Heidelberg, Germany, 2022; pp. 81–101. [Google Scholar]
- Yang, B.; Wu, S.; Li, Q.; Yan, Y.; Li, D.; Luo, E.; Zeng, C.; Chen, Y.; Guo, Z.; Shu, H.; et al. Jellyfish search algorithm based optimal thermoelectric generation array reconfiguration under non-uniform temperature distribution condition. Renew. Energy 2023, 204, 197–217. [Google Scholar] [CrossRef]
- Li, J.; Amin, M.A.; Shi, J.; Cheng, L.; Lu, F.; Geng, B.; Liu, A.; Zhou, S. Energy Trading of Multiple Virtual Power Plants Using Deep Reinforcement Learning. In Proceedings of the 2021 International Conference on Power System Technology (POWERCON), Haikou, China, 8–9 December 2021; IEEE: Piscataway, NJ, USA, 2021. [Google Scholar]
- Zhou, W.; Yamamoto, K.; Miura, A.; Iguchi, R.; Miura, Y.; Uchida, K.-I.; Sakuraba, Y. Seebeck-driven transverse thermoelectric generation. Nat. Mater. 2021, 20, 463–467. [Google Scholar] [CrossRef]
- Eldesoukey, A.; Hassan, H. 3D model of thermoelectric generator (TEG) case study: Effect of flow regime on the TEG performance. Energy Convers. Manag. 2019, 180, 231–239. [Google Scholar] [CrossRef]
- Jiang, Y.; Wu, Q.; Zhu, S.; Zhang, L. Orca predation algorithm: A novel bio-inspired algorithm for global optimization problems. Expert Syst. Appl. 2022, 188, 116026. [Google Scholar] [CrossRef]
- Khan, M.K.; Zafar, M.H.; Mansoor, M.; Mirza, A.F.; Khan, U.A.; Khan, N.M. Green energy extraction for sustainable development: A novel MPPT technique for hybrid PV-TEG system. Sustain. Energy Technol. Assess. 2022, 53, 102388. [Google Scholar]
- Li, G.; Liu, Z.; Jiang, G.; Liu, H.; Xiong, H. Numerical simulation of the influence factors for rotary kiln in temperature field and stress field and the structure optimization. Adv. Mech. Eng. 2015, 7, 1687814015589667. [Google Scholar] [CrossRef]
- Zhou, Z.; Holland, P.; Igic, P. MPPT algorithm test on a photovoltaic emulating system constructed by a DC power supply and an indoor solar panel. Energy Convers. Manag. 2014, 85, 460–469. [Google Scholar] [CrossRef]
Disclaimer/Publisher’s Note: The statements, opinions and data contained in all publications are solely those of the individual author(s) and contributor(s) and not of MDPI and/or the editor(s). MDPI and/or the editor(s) disclaim responsibility for any injury to people or property resulting from any ideas, methods, instructions or products referred to in the content. |
© 2023 by the authors. Licensee MDPI, Basel, Switzerland. This article is an open access article distributed under the terms and conditions of the Creative Commons Attribution (CC BY) license (https://creativecommons.org/licenses/by/4.0/).