1. Introduction
The development of smart cities represents a major shift in how cities are planned, and has managed to enhance the quality of life for citizens and create more sustainable, efficient, and liveable urban environments. Smart cities utilize the latest technologies and data analyses to optimize the delivery of essential services such as energy, transportation, health care, and education. They also aim to reduce waste and increase efficiency while enhancing the sustainability and liveability of urban environments. Integrating cutting-edge technologies into city infrastructure and services, such as the Internet of Things, big data, and cloud computing, is a key component of smart city development. These technologies allow for the real-time monitoring and control of city systems, providing planners and managers with valuable insights and information so that they can make more informed decisions. Intelligent transportation systems (ITS) are critical for developing smart cities. ITS technologies help to improve the efficiency, safety, and sustainability of the transportation network in a city, making it an essential component of the smart city infrastructure. ITS technologies, such as connected vehicles, real-time traffic management systems, and advanced driver-assist systems, are integrated into the transportation network to provide a more seamless, efficient, and safe travel experience for all road users. These systems include using sensors, cameras, and other technologies to monitor the traffic flow and adjust the real-time signal timings, reducing congestion and improving mobility. ITS technologies also help to improve the transportation network’s efficiency by providing real-time information to travellers about road conditions, traffic delays, and public transportation routes. This information can be used to adjust signal timings, reroute traffic, and provide alternate modes of transportation, helping to alleviate congestion and improve mobility. Furthermore, ITS technologies are also critical in helping to achieve the sustainability goals of a smart city. By reducing congestion and improving the efficiency of the transportation network, ITS technologies can help to reduce emissions and enhance air quality.
ITS are becoming integral to the smart city environment, due to their service-centric design and support functions for various applications. ITS are reliable in scaling distance and providing uninterrupted and pervasive communication and service access to their driving users. The fundamental building blocks of ITS are vehicles that are equipped with sensors, radios, and processing units for handling external information [
1]. These technologies provide drivers with real-time data and services, such as traffic updates, emergency services, and in-vehicle infotainment and entertainment services, allowing for a more seamless, efficient, and safe travel experience. The architecture of ITS encompasses connected vehicles, wireless technologies, roadside infrastructures, distributed networks such as the cloud, and communication protocols. These components work together to create a smart transportation system that provides drivers with real-time information and services and enables communication between vehicles, the central system, and other road users. ITS include vehicle-to-vehicle (V2V) and vehicle-to-anything (V2X) communication modes, with the support of their infrastructure [
2,
3]. V2V communication enables vehicles to communicate directly with each other, exchanging data on road conditions, traffic flow, and vehicle speed. “Anything” refers to the communication between roadside infrastructures, cloud networks, gateways, and sensors, etc., which is an extension of V2V. Therefore, the ability of ITS to provide V2V and V2X communication modes is a key part of their role in creating a smart transportation system for smart cities. This interconnection between heterogeneous devices and vehicles is made feasible through different standards, such as dedicated short-range communication, wireless access in the vehicular environment, and IEEE 802.11p. These communication standards are designed with the necessary technical specifications to provide the optimal communication and information sharing between vehicles and other road users, or distributed resources such as roadside infrastructure. These standards ensure that this communication is not affected by the velocity and direction of the vehicles, enabling a reliable and uninterrupted service delivery [
4,
5].
ITS provide a wide range of services and applications in the smart city environment, including safety driving assistance, navigation, traffic congestion reporting, and many more. These services aim to enhance the driving experience and make the transportation system safer, more efficient, and more sustainable. The information that is exchanged by the in-position vehicle is useful for gaining knowledge about the environment from the trailing vehicles. This information provides users with driving assistance and navigation [
5,
6]. The information exchange between these vehicles plays a crucial role in ITS and is leveraged to offer various services, including driving support and navigation. By exchanging information such as position, speed, and other attributes, vehicles can improve their understanding of the road environment, including other vehicles, traffic conditions, and road infrastructure. This information exchange helps drivers to make better decisions concerning their route, speed, and driving behaviour, improving the transportation system’s safety, efficiency, and sustainability. Navigation, routing applications, and services require adequate information from multiple sources to provide precise user guidance. Therefore, the accuracy of the information that is exchanged between vehicles is crucial for ensuring the reliability of the navigation, routing applications, and services that are provided by ITS. The information must be correct and consistent with the speed and distance of the vehicles to meet this requirement. The information attributes that are gathered from the monitoring vehicle are the change in position, location, distance, speed, and trajectory, along with the travel distance and road segment [
7,
8]. ITS process this information for navigation, traffic congestion reporting, and safe driving assistance. The usability of this information depends on how it is used to provide navigation or driving assistance to the user. The information that is exchanged between vehicles and sensors is processed efficiently to improve driving assistance [
8,
9].
The amount of information that is exchanged in the driving scenario is substantial and is continuously updated as the vehicle travels. Processing such frequent information is complex but is addressed through granular service provisioning to provide a precise user service [
10]. The processing systems that are designed for ITS must handle network dynamics competently and efficiently process the large amounts of data that are frequently exchanged in the driving scenario. Information processing, extraction, decision making, and assistance are the major tasks of this computation and processing system [
11]. The development of various roadside service applications for driving users is constantly evolving to meet the changing needs and requirements of these users. The precision of the analysis and the correctness of the information can be verified through simple services such as localization and distance prediction.
Similarly, the designed method for ITS must not increase the information overhead, as this can lead to a malfunction of the applications. The design of the computation and processing system for ITS requires exceptional and time-bound operational features to ensure the optimal data extraction [
9,
10,
12]. With an increasing number of vehicles on the road, traffic congestion and accidents are becoming more common, leading to economic and social costs. Traditional traffic monitoring systems rely on physical infrastructure such as cameras and sensors, which can be expensive to install and maintain. Furthermore, these systems often provide limited information about driving behaviour and are not able to provide real-time feedback to drivers. To address these issues, there is a need for a more advanced and intelligent traffic monitoring system that can provide real-time feedback to drivers based on their behaviour. This system should be able to detect potentially hazardous situations and provide appropriate alerts to drivers to prevent accidents. This article proposes a solution for increasing this precision and better driving assistance by assimilating improved learning features with roadside data analysis. Safe driving and navigation assistance require multimodal data acquisitions and analyses. The problem is the time-series dependency of the data and their volatile nature. Therefore, specific decision/navigation assistance is short-lived. Despite these issues, the leveraging of this behaviour is required, using detailed external and internal data modelling. Therefore, the objectives of this research are listed as follows:
To propose and formulate a behaviour-based response model (BRM) for high-precision assisted driving through an in-depth data analysis.
To introduce the assimilation of regression modelling for analysing a self-vehicle and its neighbouring vehicle data to handle traffic congestion.
To conduct a comparative study to identify the advantages and limitations of the proposed BRM using measured metrics.
This research paper is presented in five sections.
Section 1 provides an overview of the research background and sets the objectives for modelling the proposed behaviour-based response model for traffic monitoring and driving assistance. The section also introduces the significance of ITS in the development of smart cities and the role of vehicles with smart computation capabilities.
Section 2 focuses on the related work, provides an in-depth analysis of roadside monitoring for vehicle safety systems and driving assistance technologies, and identifies the research gaps.
Section 3 describes the proposed behaviour-based response model, including its applications, information, and behaviour modelling. The model uses the smart computation capabilities of connected vehicles to analyse the traffic conditions and provide assisted driving recommendations to its users.
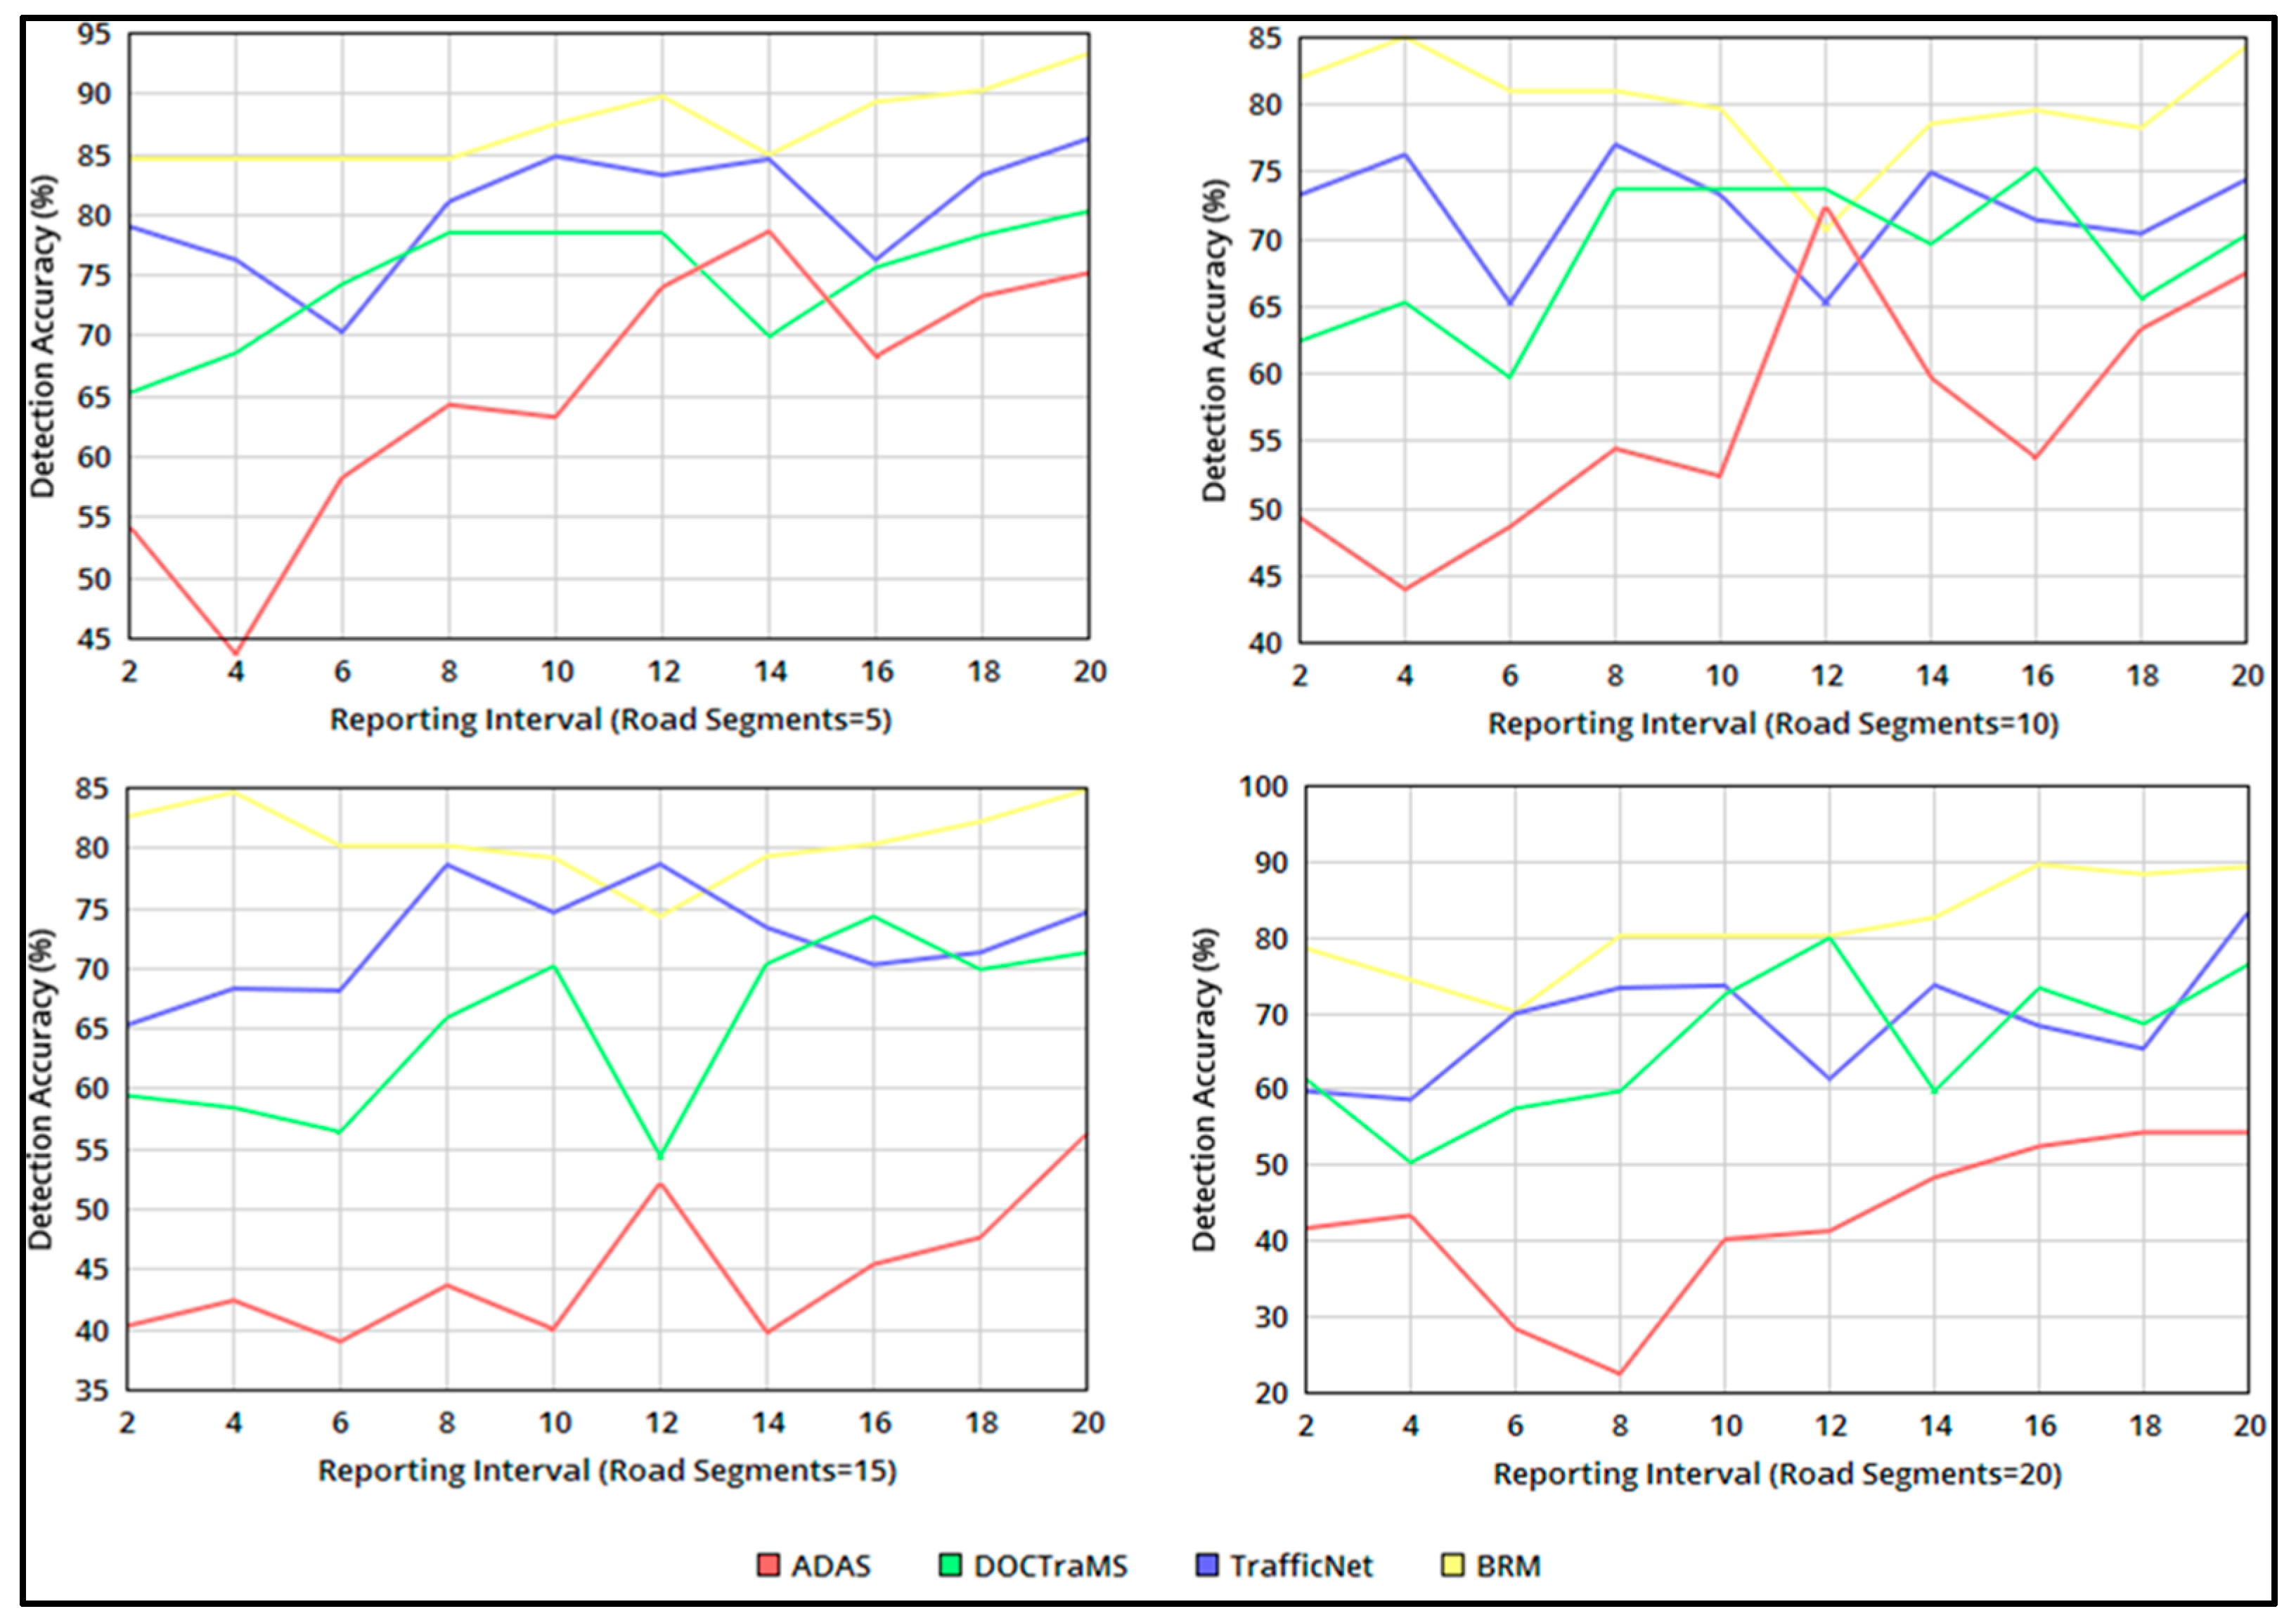
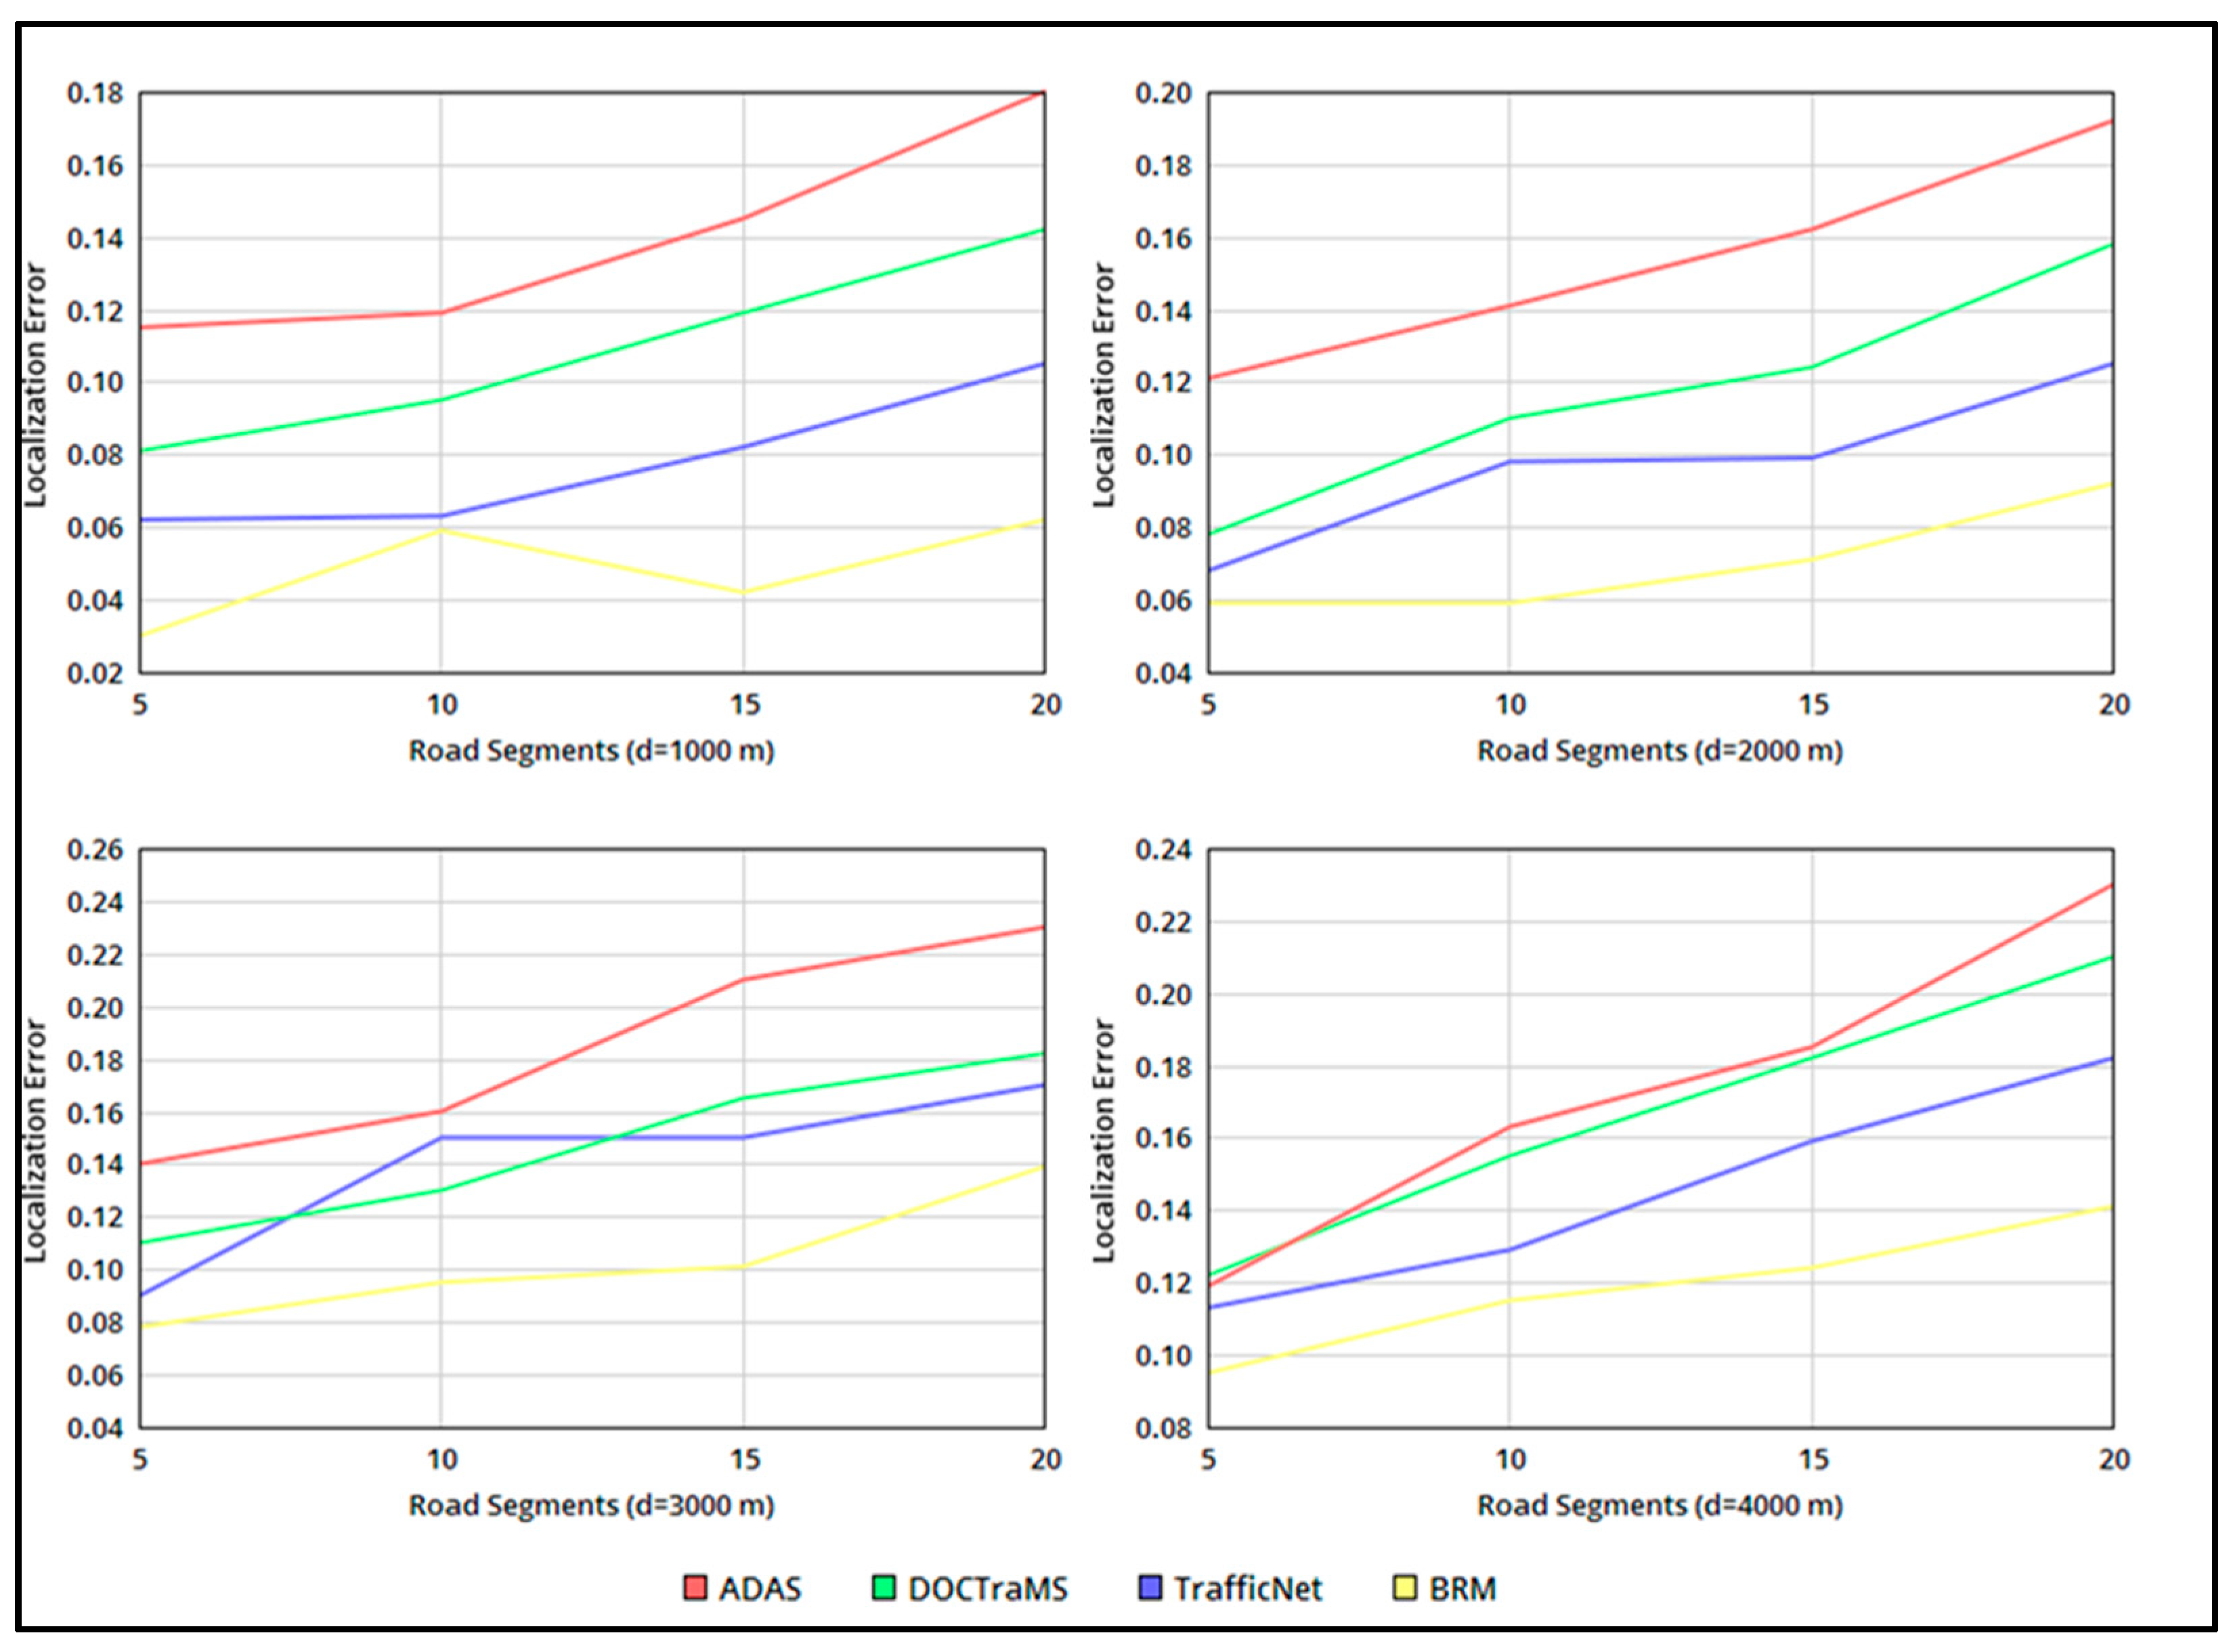
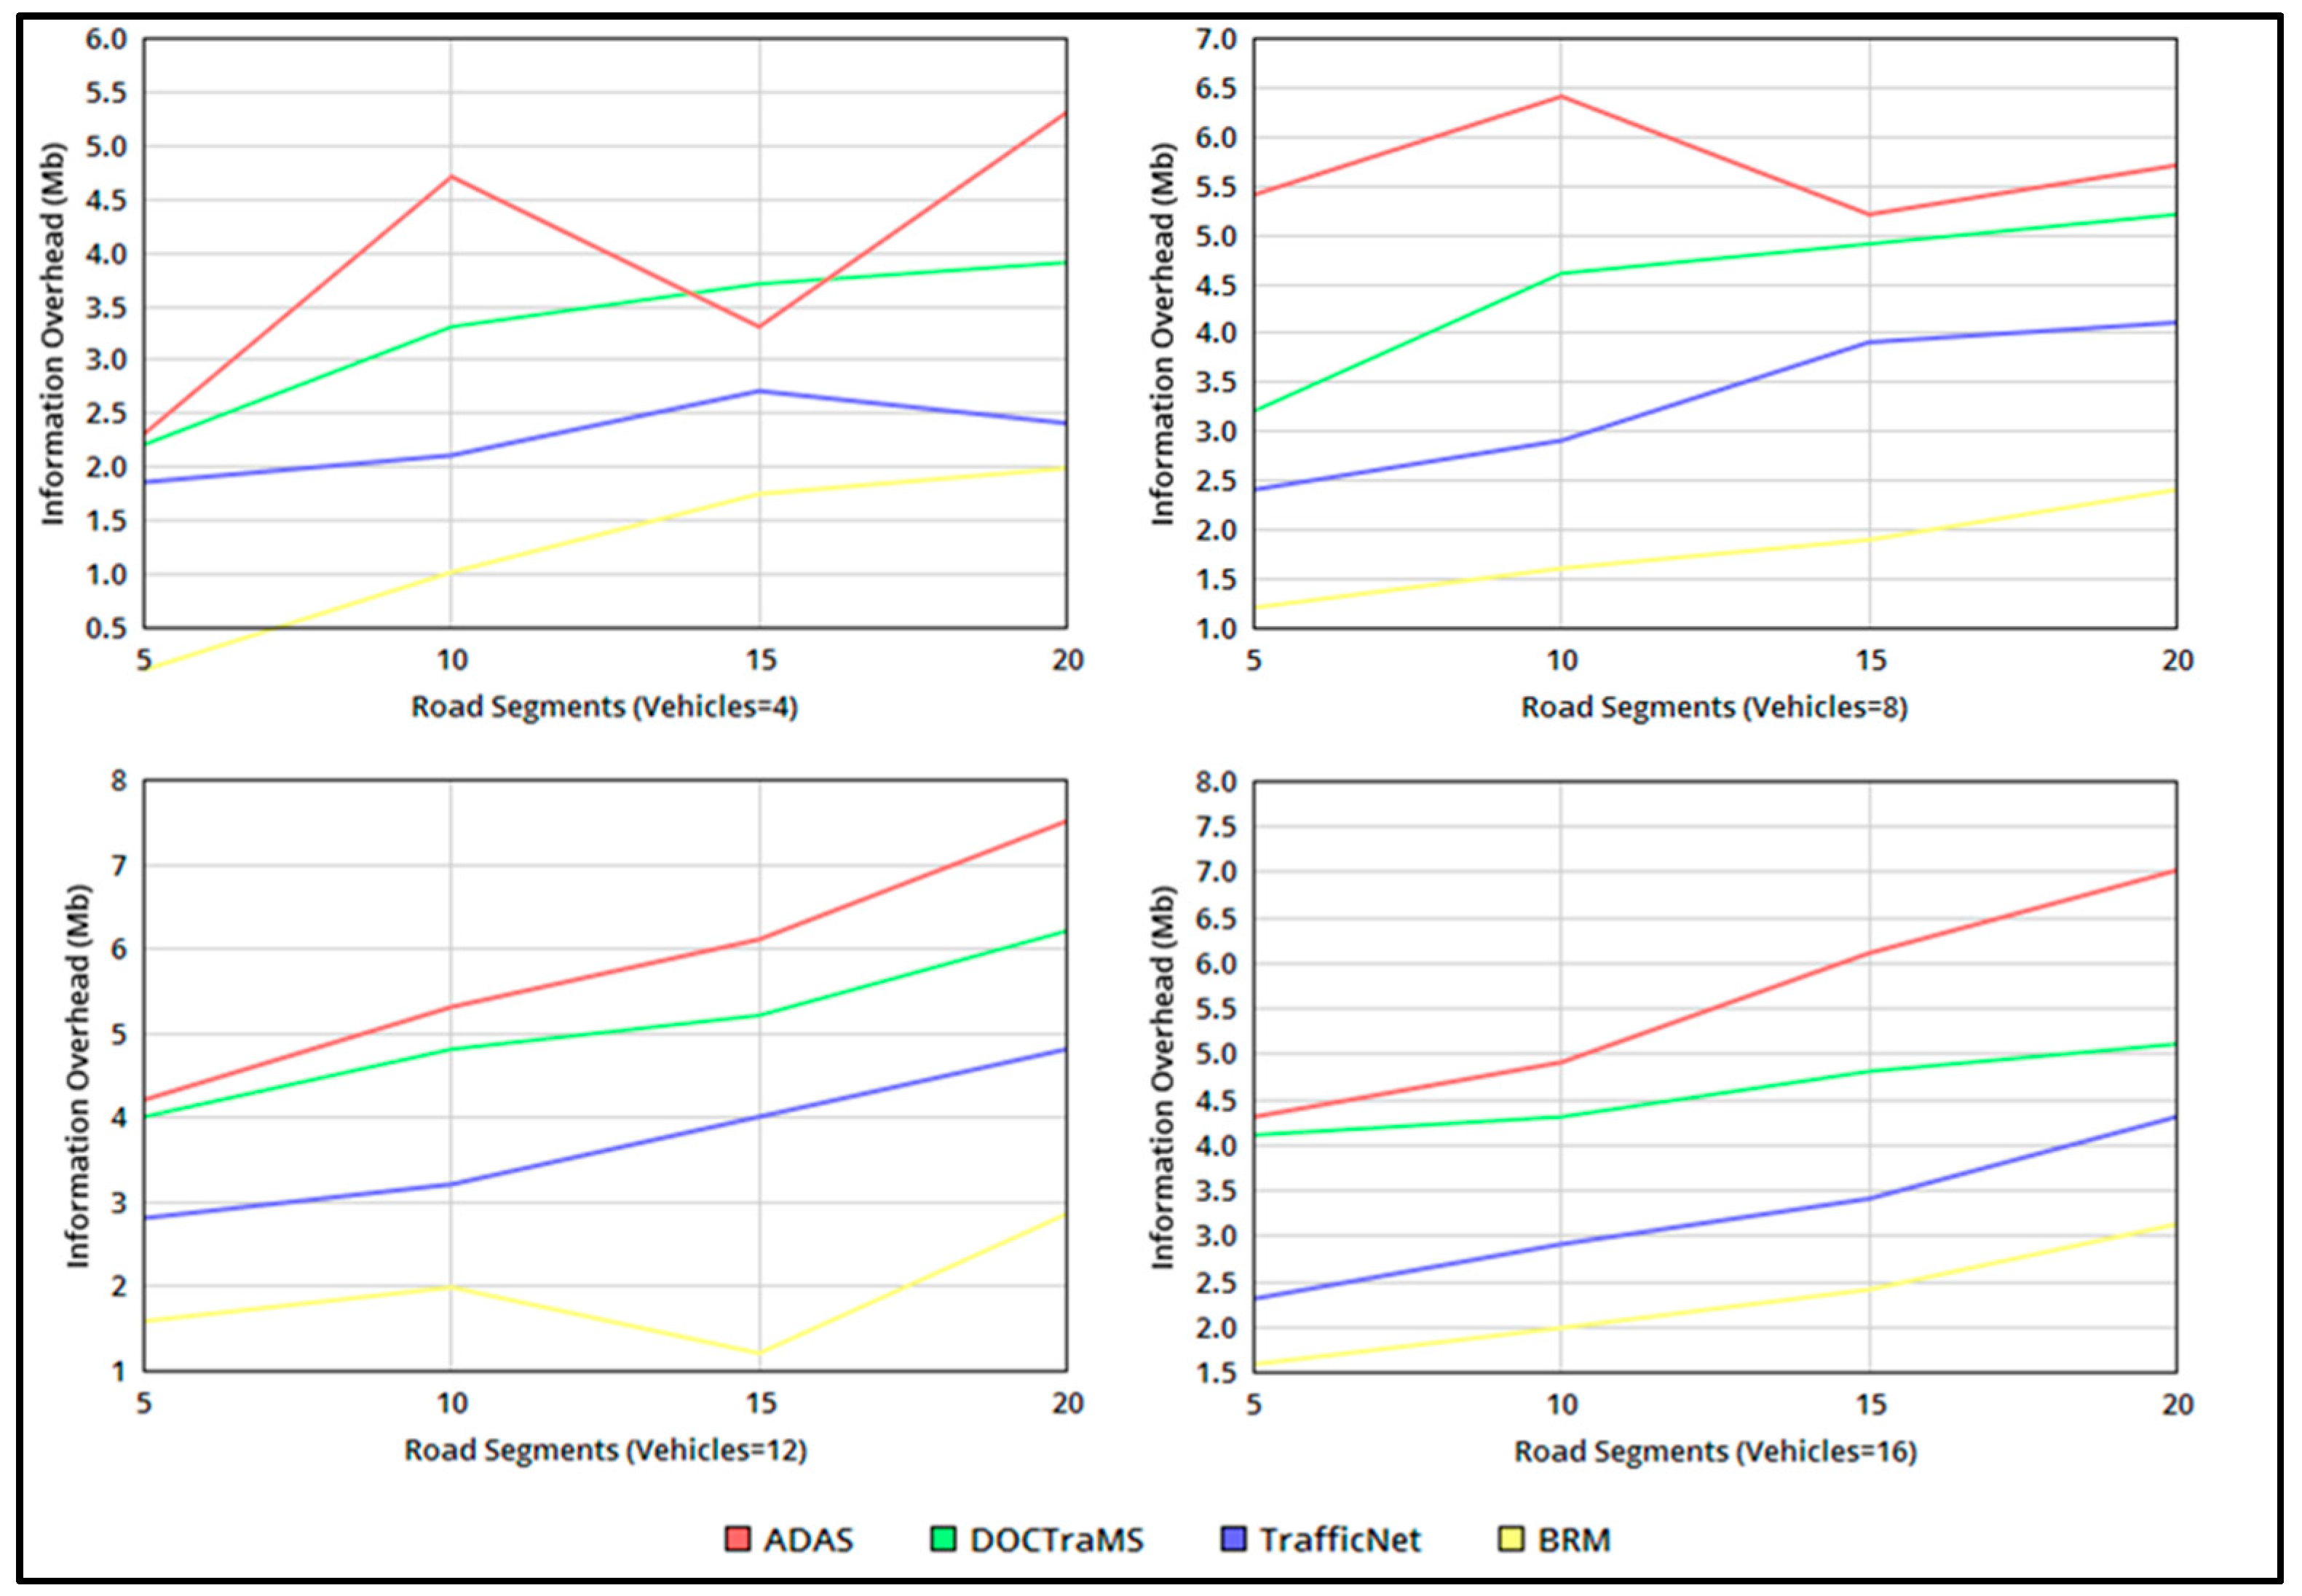
Section 4 presents the experimental results and an analysis of the proposed model, which are validated for the various inputs and intervals of the metrics, such as the detection accuracy, localization error, and information overhead. Finally, the conclusion in
Section 5 summarizes the key findings and highlights the contribution of the proposed model to the field of ITS for smart cities.
3. Proposed Behaviour-Based Response Model
The BRM is employed for detecting roadside incidents to provide better driving assistance for connected vehicles. The widespread cloud and the traffic safety applications within the smart city environment are exploited for this purpose. To improve its reliability, driving assistance, for location and incident accuracy, must be shared with fewer errors. Therefore, the physical attributes of the vehicles, in connection to their mobility and location patterns, are analysed to provide consistent and precise driving assistance using the BRM.
3.1. Application Modelling
The application model for real-time ITS scenarios consists of a digital interface that is equipped in the vehicle. This digital device (such as a touch screen, minicomputer, or digital device assistance) is connected to the vehicle’s radio and power unit. The digital device can receive radio signals and project them into visualizing images or message alerts. The device can communicate with the cloud and other networks using radio units. This communication is served using the existing roadside infrastructure units. The service availability, amid the change in the vehicle’s position, is ensured by the roadside infrastructure for retaining the service quality. The digital device interacts through an application and system software for information exchange.
3.2. Information Modelling
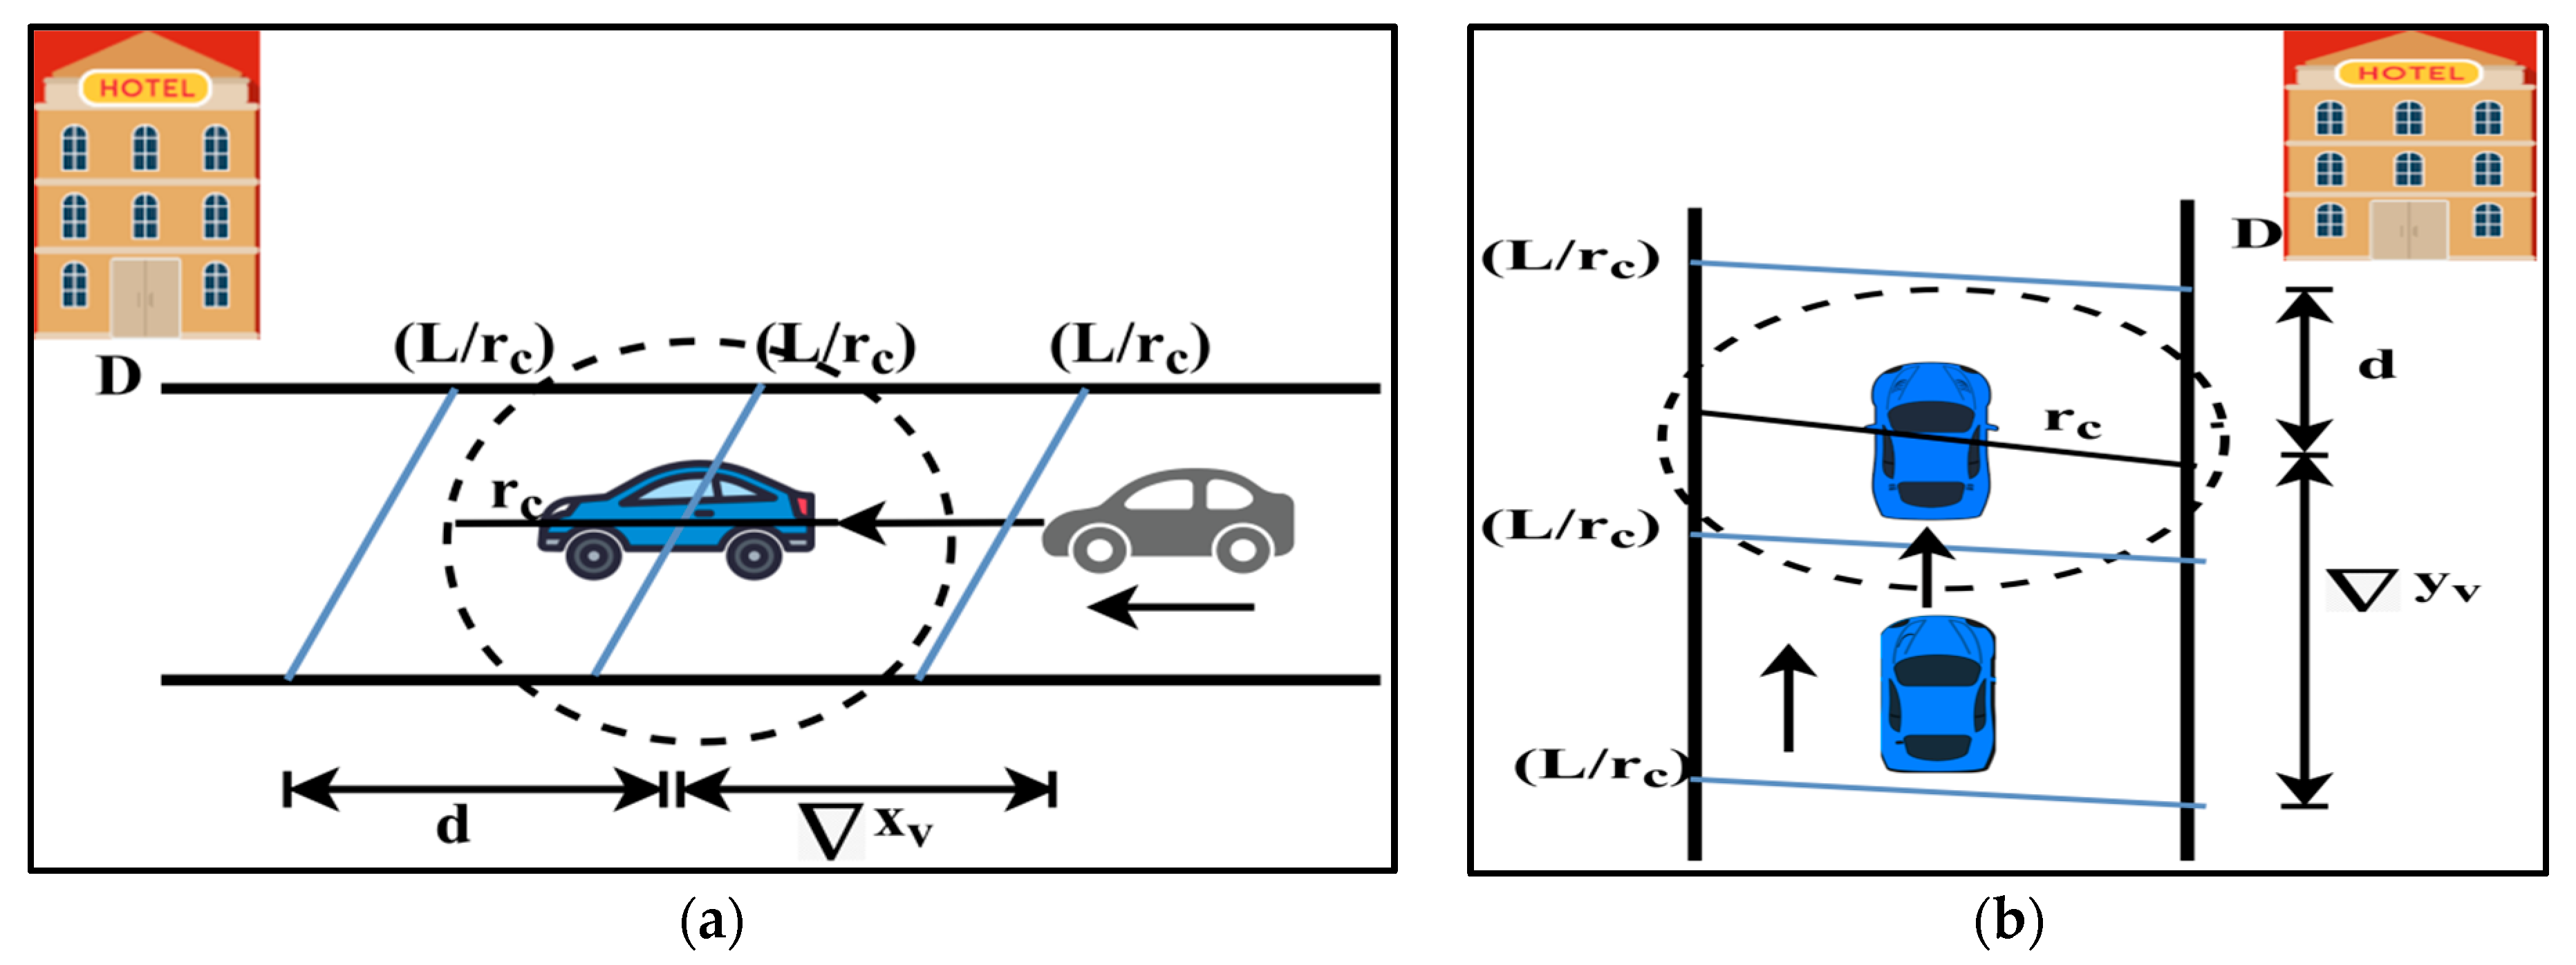
The information in the BRM relies on the environmental conditions and the response of the vehicles to these conditions. This is recorded as the incident from which the assistance is processed. The relating factor between the vehicle and roadside environment determines the incidents that are experienced for the following vehicles. The precision of the information processing must be high to prevent information falsification or misguided assistance. The input is expected to be quantized for a high level of information processing, which must meet the quality requirements. This means that the accountable inputs must provide the extraction of useful information. The usefulness of this information is verified based on the driving assistance that is provided to the user. Let
represent the road segment distance that connects the driving user and the fixed destination. This distance is computed using Equation (1).
Here,
and
stand for the position coordinates of the vehicle
and destination
. The variable
denotes the angle of deviation between the two vehicles. The conditions “if there is no trajectory” and “if there is a trajectory” indicate the vehicle movement pursuing the same or different directions. In particular, the moving speed of the vehicle for the turn around the new vehicle is considered in this trajectory. The time required to travel the distance,
, is computed in Equation (2).
where,
,
and
are the previous last known travel time of
, the current expected time of the previous distance, and the time information of the vehicle, which is stored in the cloud, from which the expected times
and
are zero, meaning the velocity of the vehicle is constant. On the other hand, if there is a variation in these factors, in particular, if
then the incident is experienced by the vehicle. This incident can be a road traffic or intersecting traffic signal, etc. However, if there is an adverse identification, driving assistance must be invoked to provide knowledge of the road scenario. If the length of the road is
and the radio coverage range of the vehicle is
, then
is the available partitions in
. The
that is computed in any of
is computed as:
The time that is computed using Equation (3) validates the segment/partition of the road that is covered by the vehicle. Equation (1) is revisited for the trajectory of the vehicle, because the above time is not a constant where the angle of deviation
is observed. The angle of deviation determines the moving direction and trajectory that is experienced by the vehicle. The angle of deviation,
is estimated using Equation (4), as
where,
are the changes in the coordinate positions of the vehicle for the
and
axis representations. The road segment
encompasses multiple intersections that cause the change in
and
. In such a case, the precision error
is computed using Equation (5).
In
Figure 1a,b, the illustrations of
and
are displayed.
As per the representation in
Figure 1a,b,
or
if the vehicle moves along the
or
respectively. Now, the set of inputs that are analysed are
.
Let denote the behaviour attributes of a vehicle that is denoted as with and conditions. These behaviour attributes are classified using the regression learning model, as discussed in the next section.
3.3. Behaviour Modelling
The behaviour modelling follows a step-by-step procedure using regression learning to estimate the incident, location, and cause, which are reported to the pursuing connected vehicle to assist the driving users. The members of are independently analysed, and then the constraints due to the joint validation are analysed to provide a granular information extraction. The application model and user experience rating verify the usefulness of the information. This fact is applicable in a real-time scenario for estimating the information usefulness. Depending on the available information, the utilization determines its usefulness. This usefulness is decided using the vehicle behaviour, assistance, and safe driving attributes. The data analysis requires intense training and verification for validity across multiple intervals. Therefore, the behaviour model design relies on previous user experiences. The regression-based analysis for incident detection is pursued in the same order as and . This learning analysis exploits the relationship between the independent attributes to improve its reliability in information extraction. The analysis is presented below, along with the explanation.
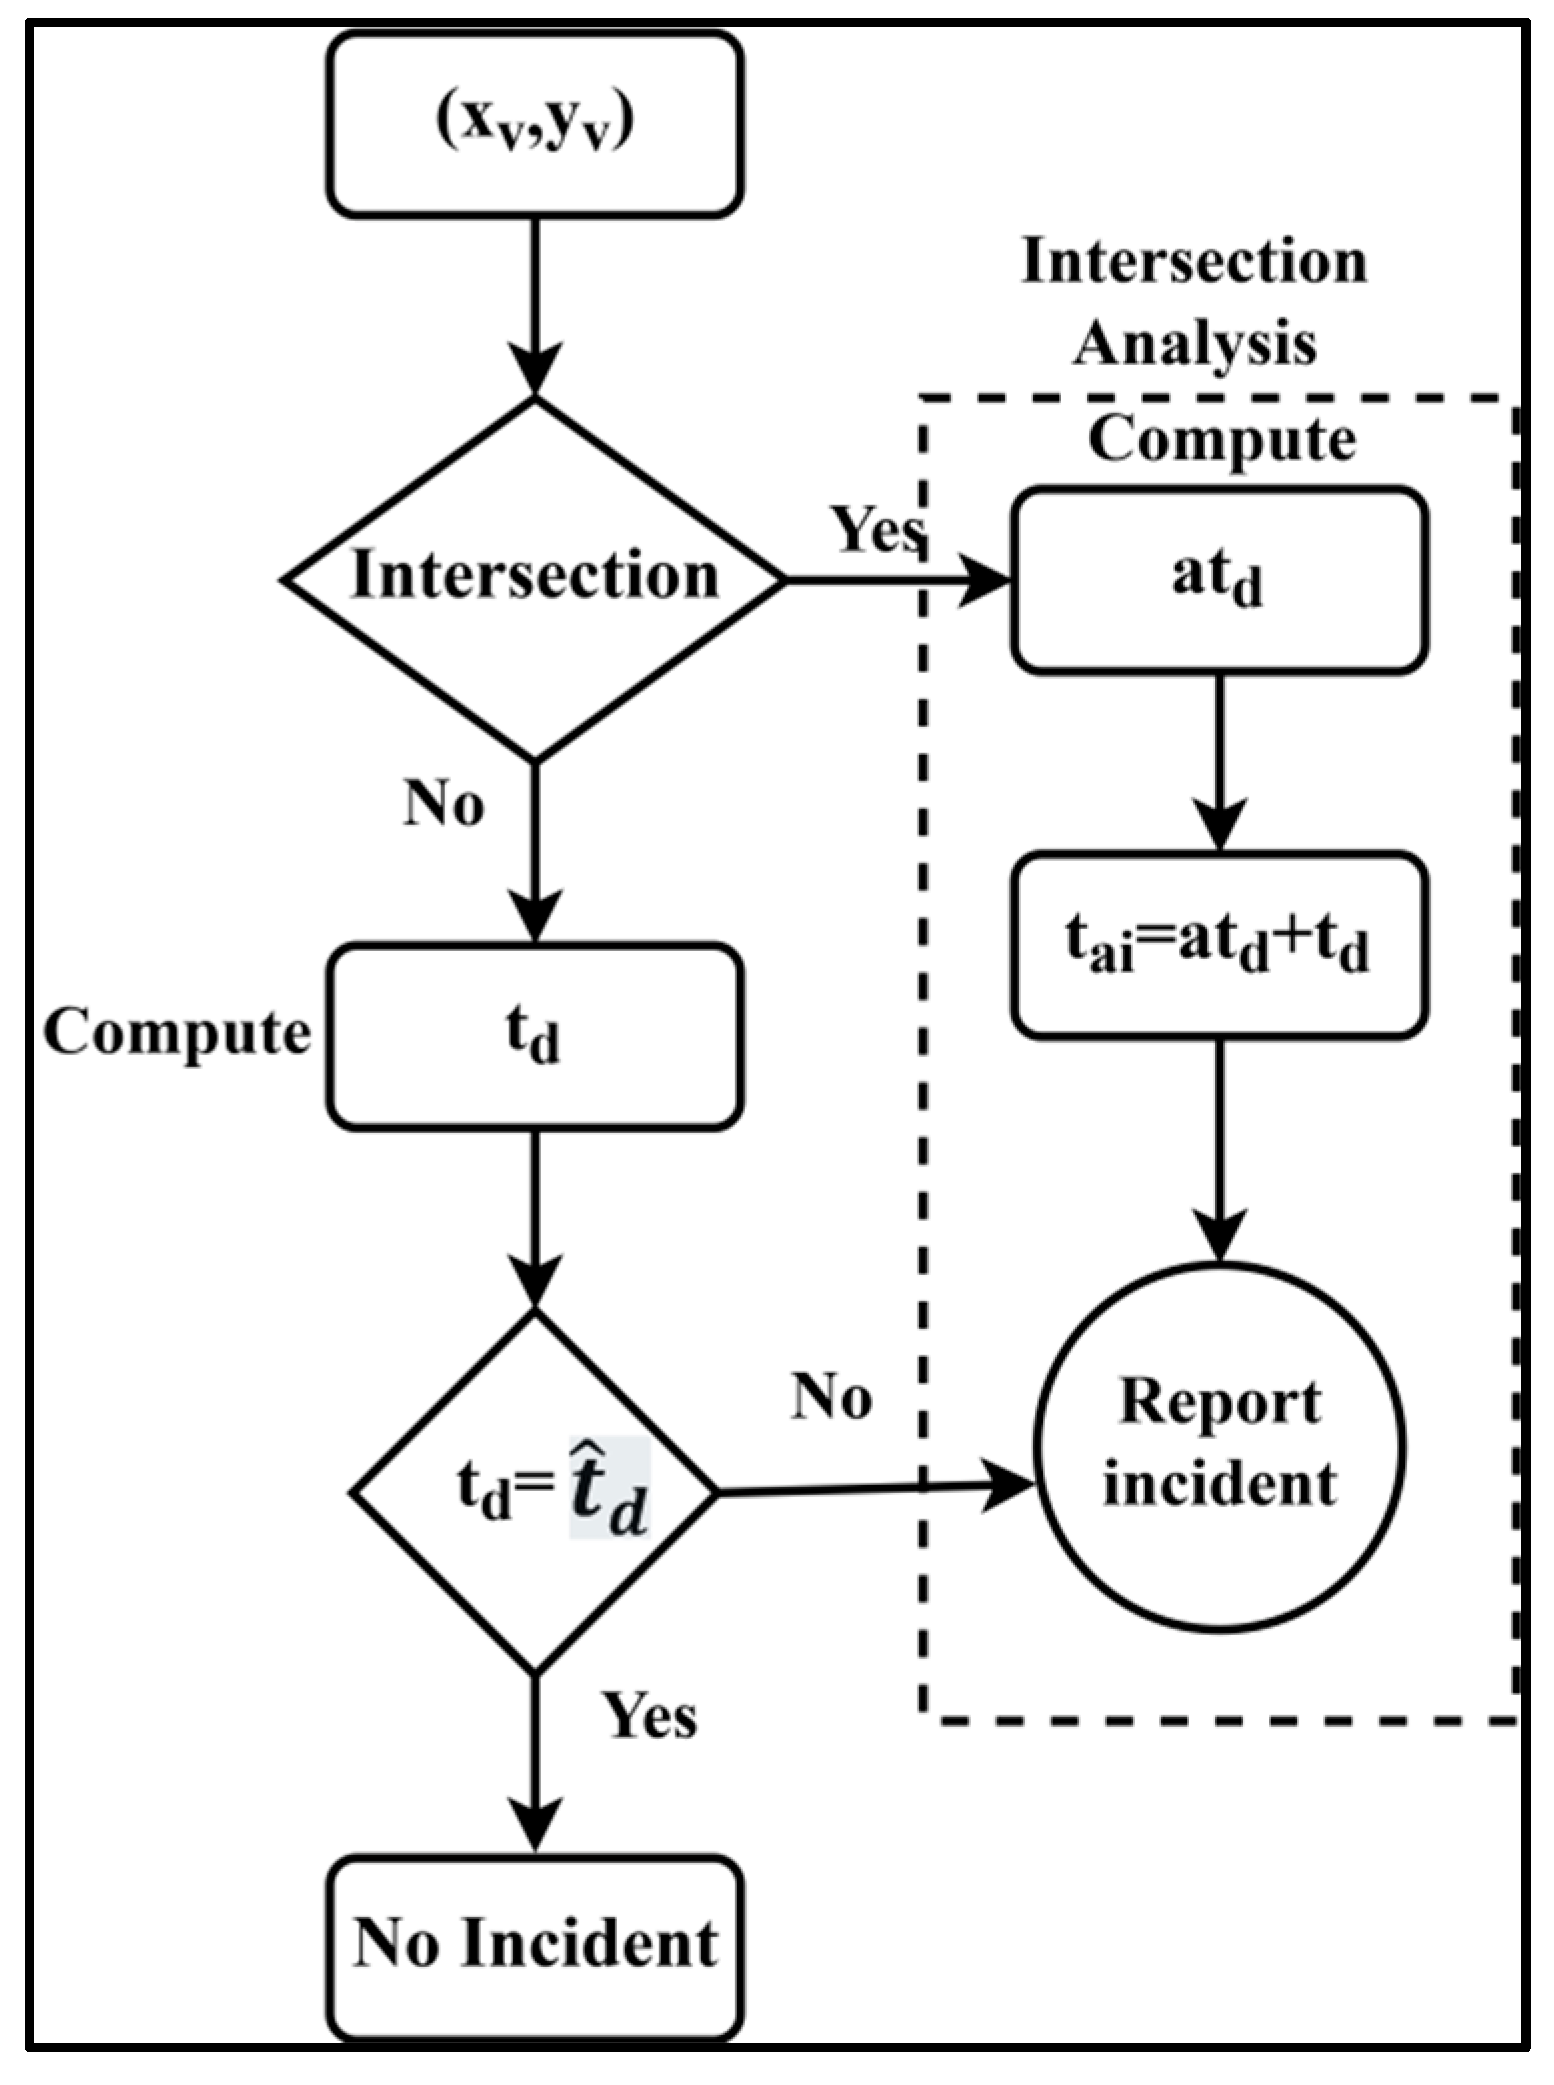
3.4. Analysis 1: Conditions for Validation
The driving time towards a fixed
reduces as the segment count decreases. This is observed for a non-intersecting road. Let
represent the additional time that is experienced in reaching
. This can be because of a traffic signal or congestion that is experienced in
. Therefore, the regression analysis is modelled in
Figure 2 for an intersecting and non-intersecting
.
The non-intersecting
causes no change in
whereas the intersecting
experiences some delay in covering the distance
. Therefore, the location precision for the time
is computed as
In the estimation of as in Equation (6), the arrival time of the vehicle is postponed by , which is verified as . If this condition is experienced, the incident is reported as a delay in the time that is experienced by the predecessor vehicle to the pursuing vehicle.
3.5. Analysis 2: Validation of
The error in determining the position of the vehicle is based on the velocity and time in
. This error misguides the incident update by falsifying the location to the user in the driving assistance. Therefore, in the regression process, the analysis of
is performed linearly. If
denotes the input constraint for
, then the validating input is
, where
and
are the input co-efficients in correspondence with the
that is observed in
and
. Now, the objective of the regression is to achieve the
as
if
. Therefore, the variation of
for
(i.e.,)
is computed using Equation (7), as:
The variation that is observed using Equation (6) changes with the vehicle’s velocity. The chance of an error in the above analysis varies due to neighbouring vehicles and road conditions. Therefore, the boundary for differentiating
and
is defined for the varying
due to different velocities and densities. This boundary is useful in validating
across all the road segments; if the value of
lies within the boundary, then the location error is less, and the incident is of the normal clause. Instead, if
is found to lie behind or above the boundary, then the localization error is high, for which a notification is necessary. The boundary between
and
(i.e.,)
is computed using Equation (8).
The boundary that is defined in Equation (7) specifies a minimum value of
and a maximum value of
for the
of a vehicle that is located during
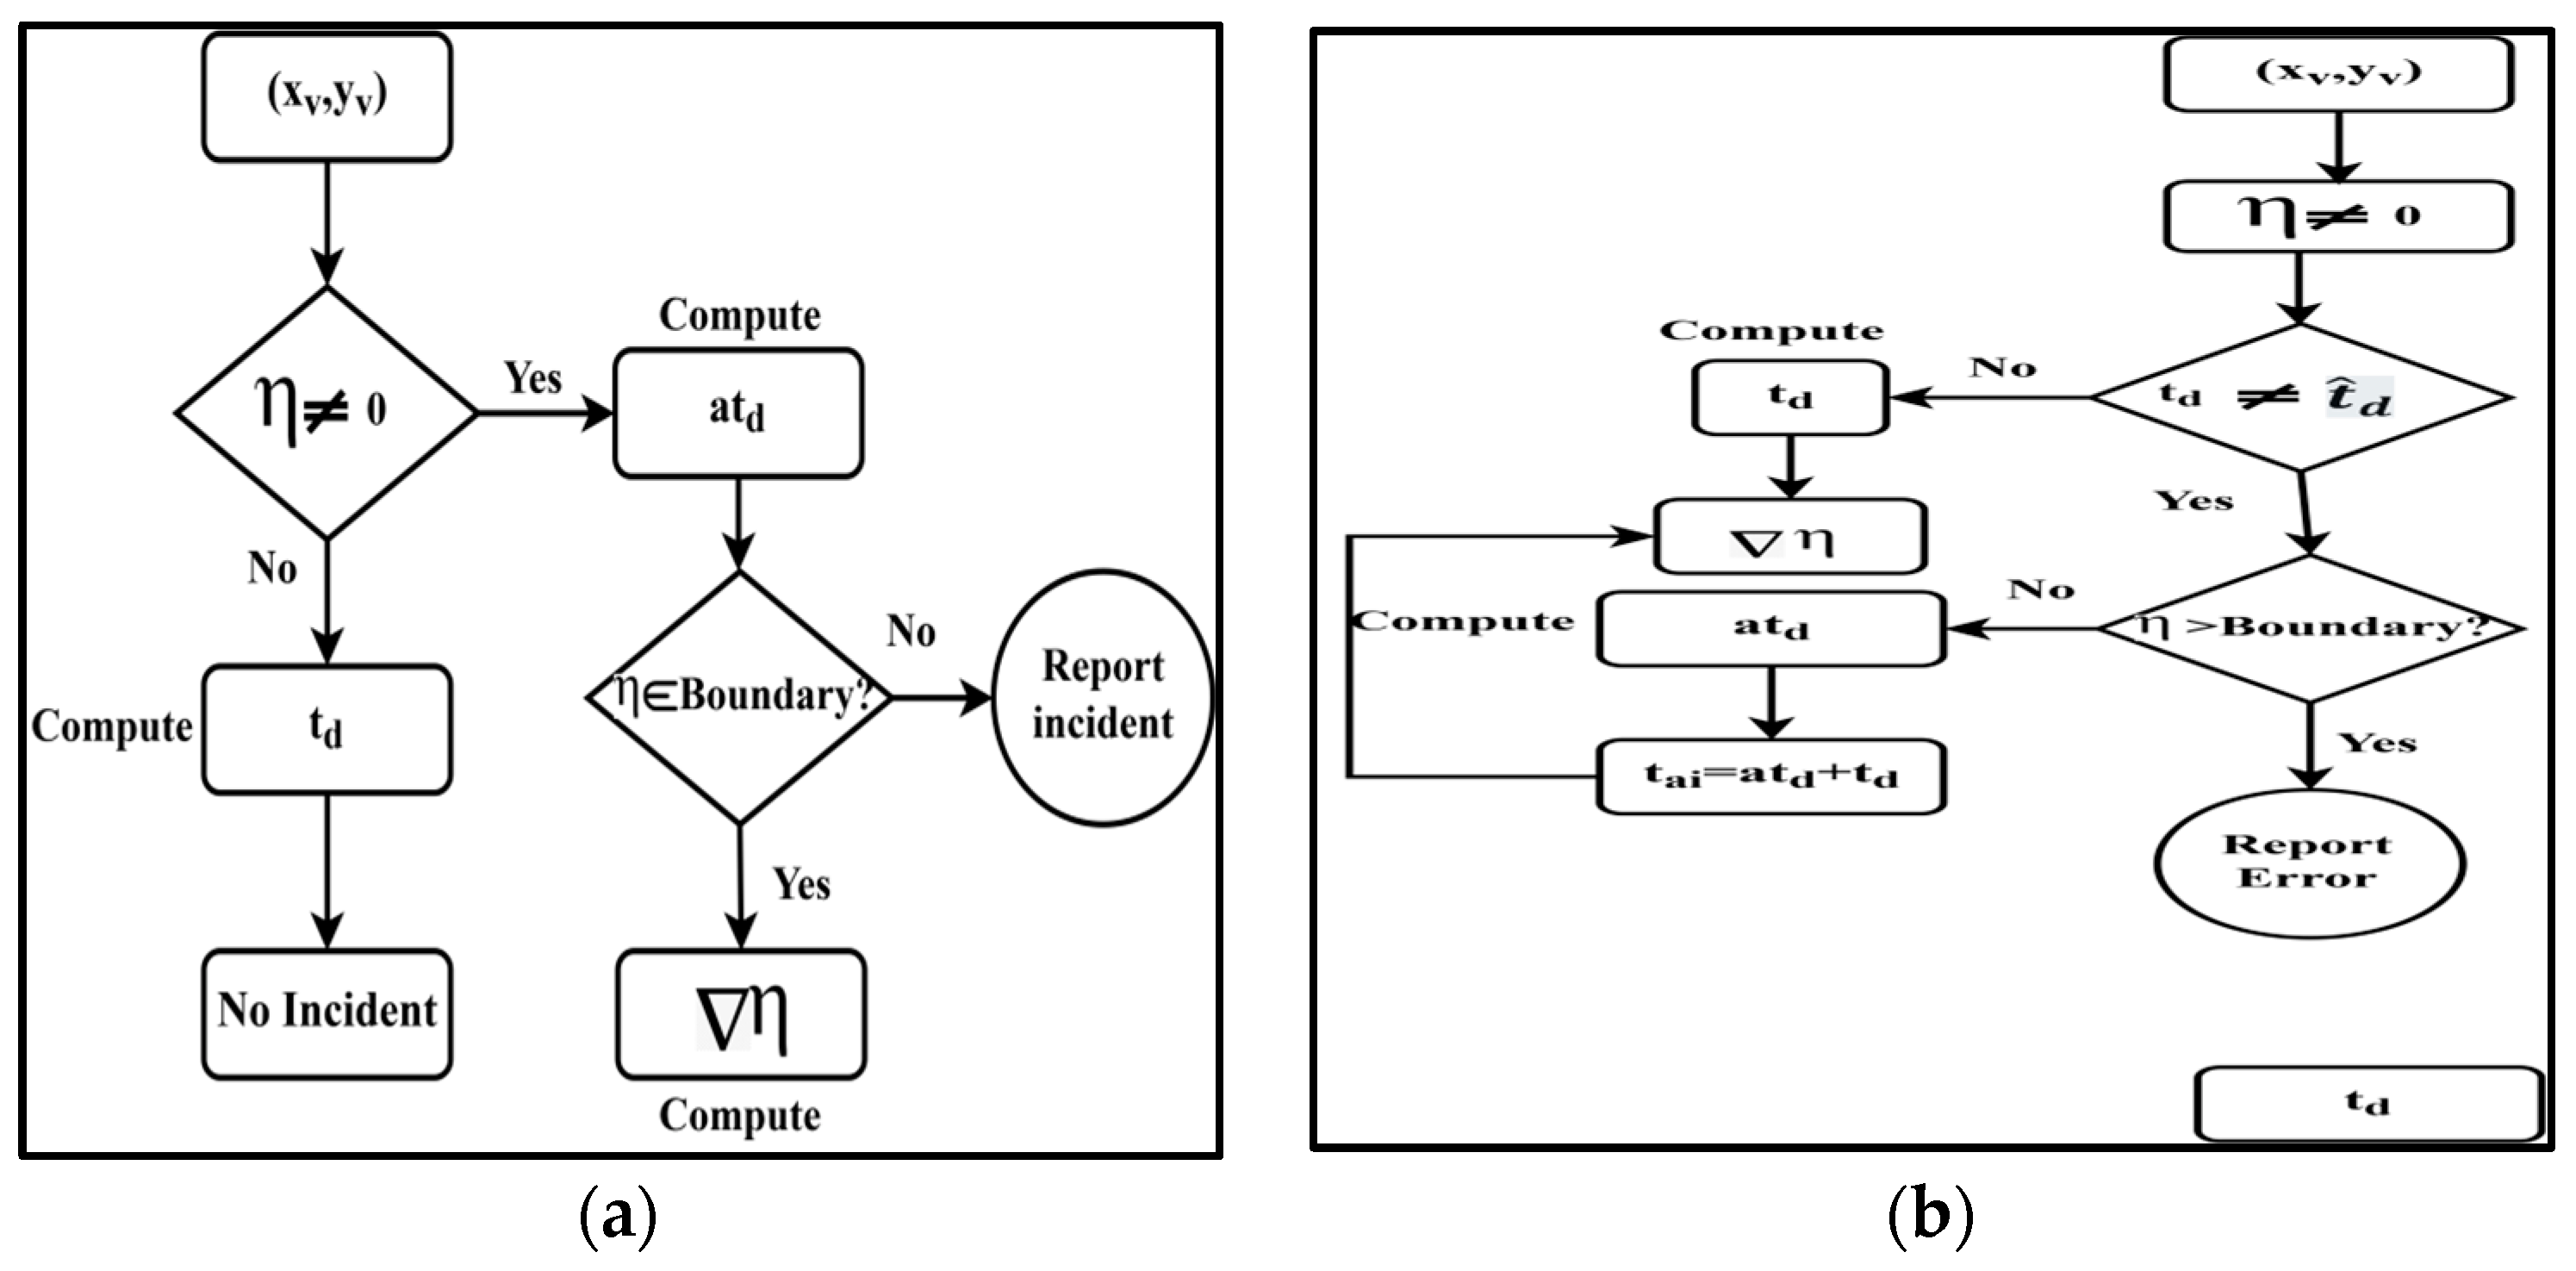
. From here, the relationship analysis is performed. Before this analysis, a representation of the regressive processes for the boundary and relationship conditions is illustrated in
Figure 3a,b, respectively.
In
Figure 3a, the position of the vehicle and its corresponding boundary failing condition generates notifications (report incident). This case is analysed as the joint processing using
and
in
Figure 3b, where the condition of the
boundary is split into
and
for an independent analysis. This validates the condition that does not require a notification (incident reporting), but a localization error exists. This means that the availability of the vehicle is true and its driving time is some, whereas the location (positioning) error is observed due to the
or
being changed, which results in
in this case.
3.6. Relation Modelling (Analysis 1: Analysis 2)
The change in
that is observed due to the
in any
causes additional driving time
. The vehicle’s location that is estimated in this condition is unsatisfactory, and the vehicle detects an incident to be reported. This reporting is reflected in the navigation and driving assistance process that is adopted by the pursuing vehicle. For the
the segment along distance
and the boundary using the
and
are modelled as follows.
From Equation (9), the range of is and the distance is scaled between to for the independent metric . For a time, this range is valid from to , which provides as the satisfying condition. Therefore, the required time for achieving less is where the velocity of the vehicle is constant. If there is a change in the velocity, then and therefore, is the expected time delay for balancing in the abovementioned range.
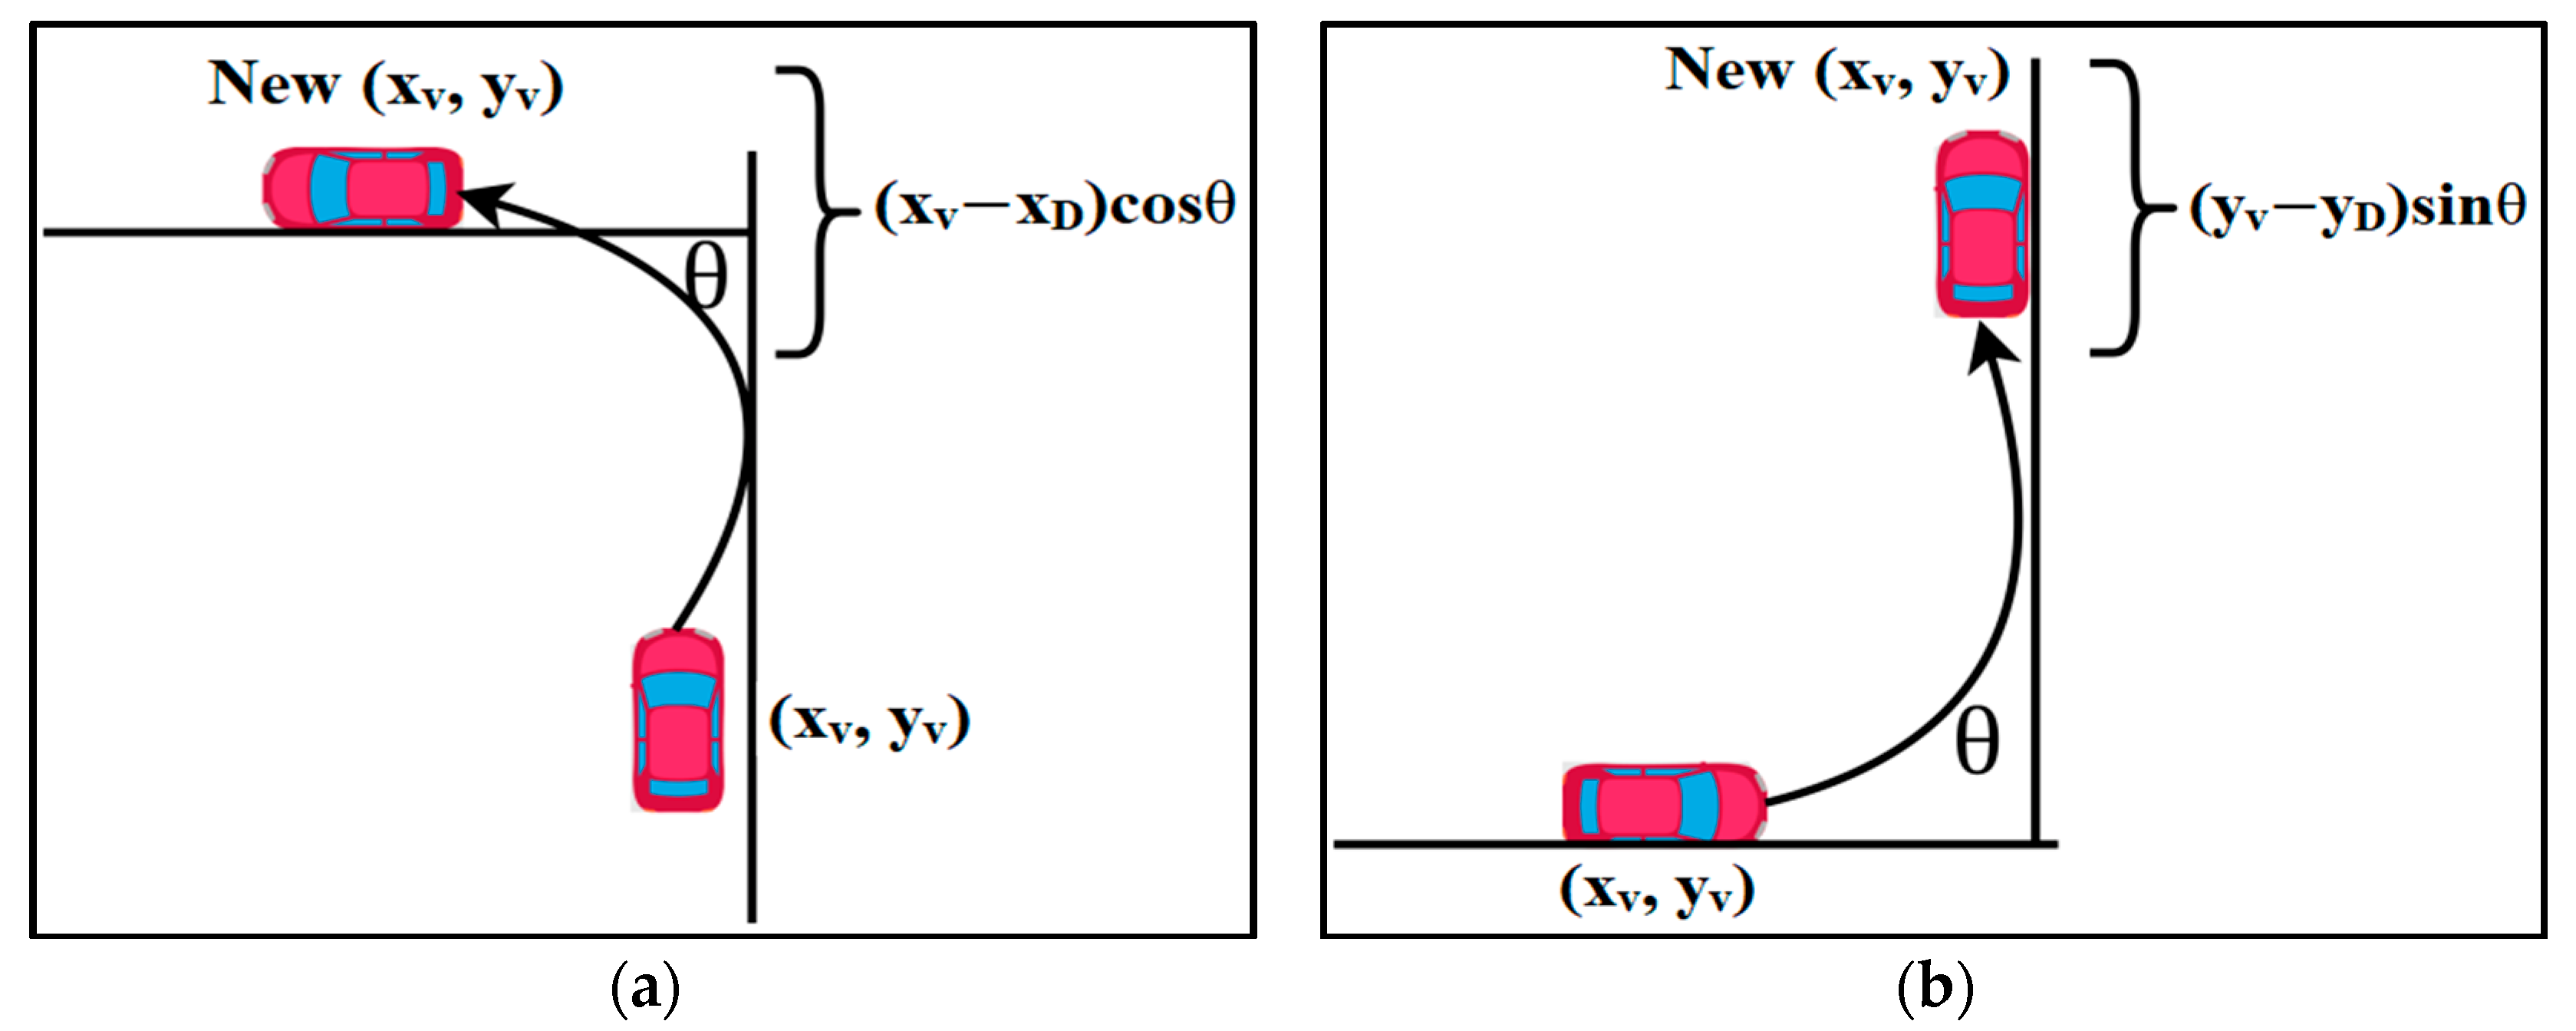
3.7. Analysis 3: Evaluation of
The change in the angle of deviation determines the trajectory of a vehicle. The trajectory of the vehicle is used to identify the moving directions and changes in the route plan. A change in the route plan is notified to the pursuing user. Therefore, the trajectory information is to be analysed for the pursuing vehicle. The vehicle moving before is the reference for the trailing vehicle to identify the direction of movement. Instead, the moving vehicle is dependent on the road segment and
to change its direction. The angle of trajectory along the road segment does not need to be notified. On the other hand, if there is a change in the driving plan due to abnormal events (such as accidents or congestion), then this variation is to be reported to the trailing vehicle as a notification. The error is computed for the deviation/miscomputation of the position. The error with
is given by Equation (10).
The change in the plane for validating
is represented in
Figure 4a,b, respectively.
However, the regression process is the same, where the distance error is computed using Equation (11).
The error that is observed in this case is considered for all the in to verify if the vehicle has settled its position in the horizontal/vertical plane. The displacement distance is also augmented to the travel time of the vehicle to estimate .
3.8. Relation Modelling (Analysis 1, 2, 3)
The relationship between
and
for
is given as
In Equation (12),
is modelled based on
and
to estimate the delay time in reaching the destination. The notification here is confined to the basis of
and
to reduce unnecessary event detection. This improves the accuracy of the driving assistance by suppressing the localization errors. The notification is followed for precise event detection, and driving assistance is ensured with this non-overloaded formation.
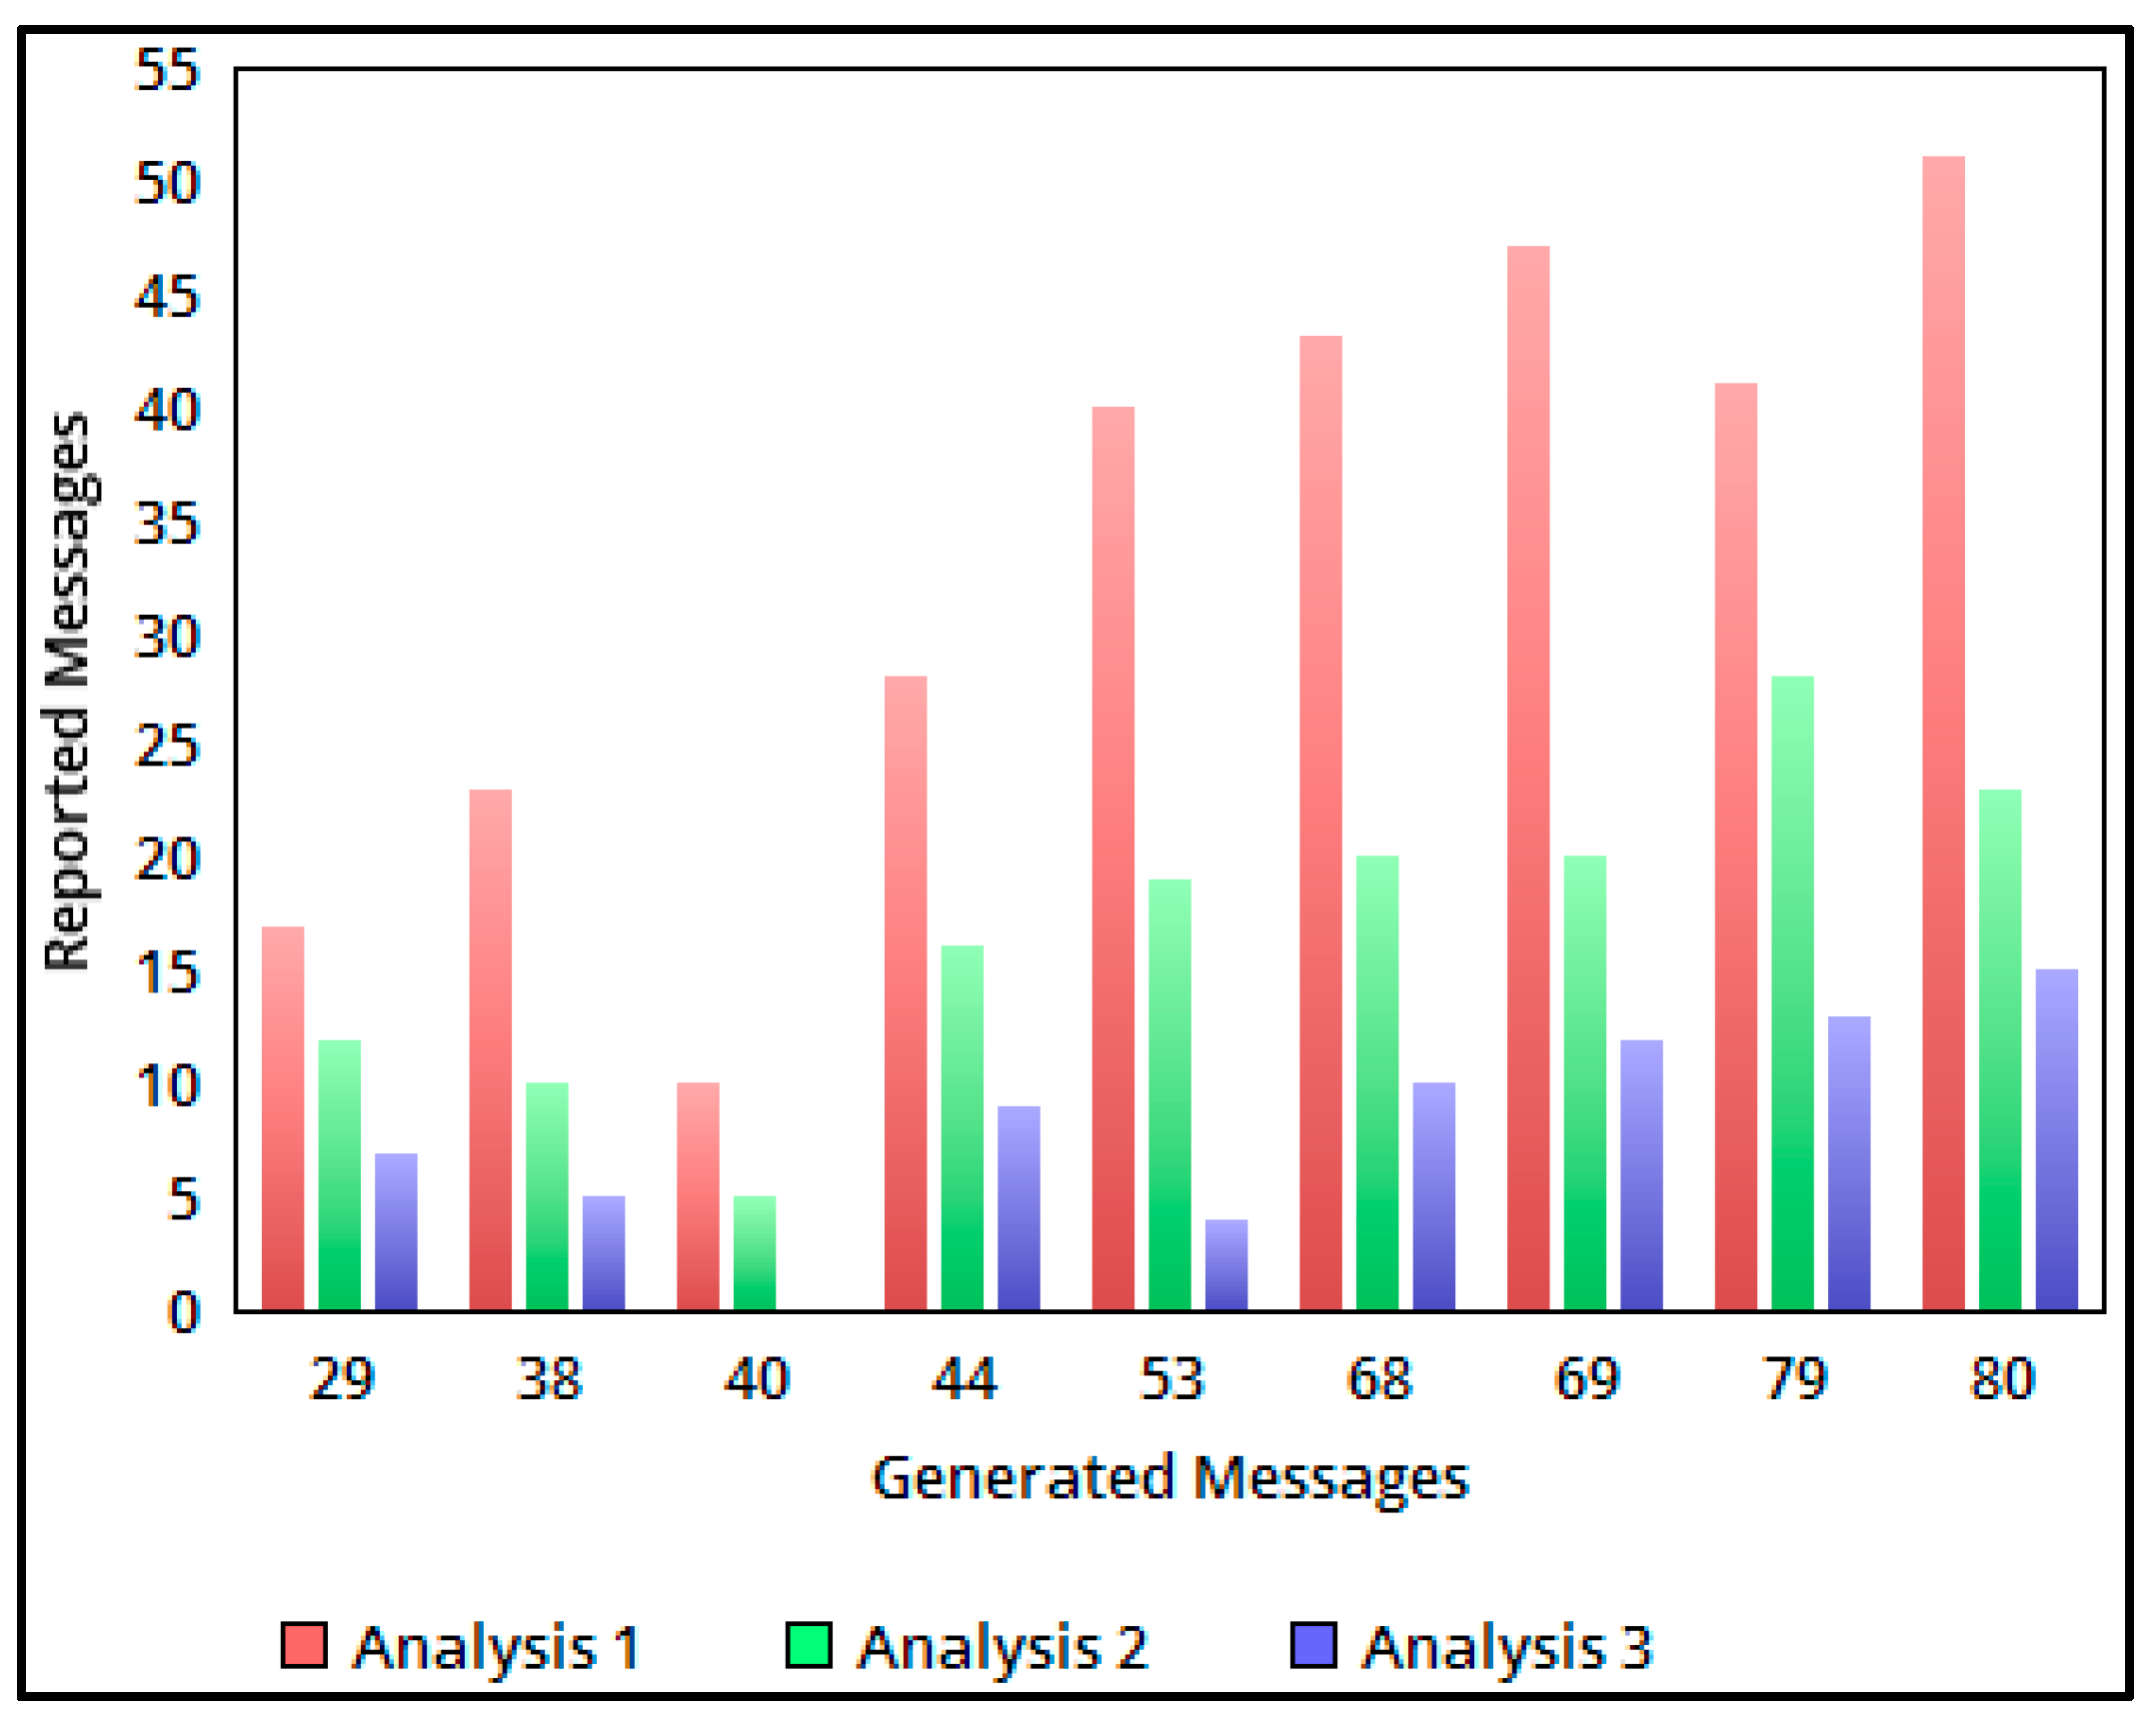
Figure 5 represents the comparative analysis of the generated detection and refined messages through analyses 1, 2, and 3.
As discussed above, the reported messages are classified in each analysis step by using different conditional verifications. In the above illustration, analysis 1 to analysis 3 corresponds to
,
and
validation in the process of identifying prompt messages. The values of the above illustration are presented in
Table 1.


