
Image-Based Pothole Detection Using Multi-Scale Feature Network and Risk Assessment

Abstract
:1. Introduction
1.1. Problem Definition and Motivation
1.2. Contributions
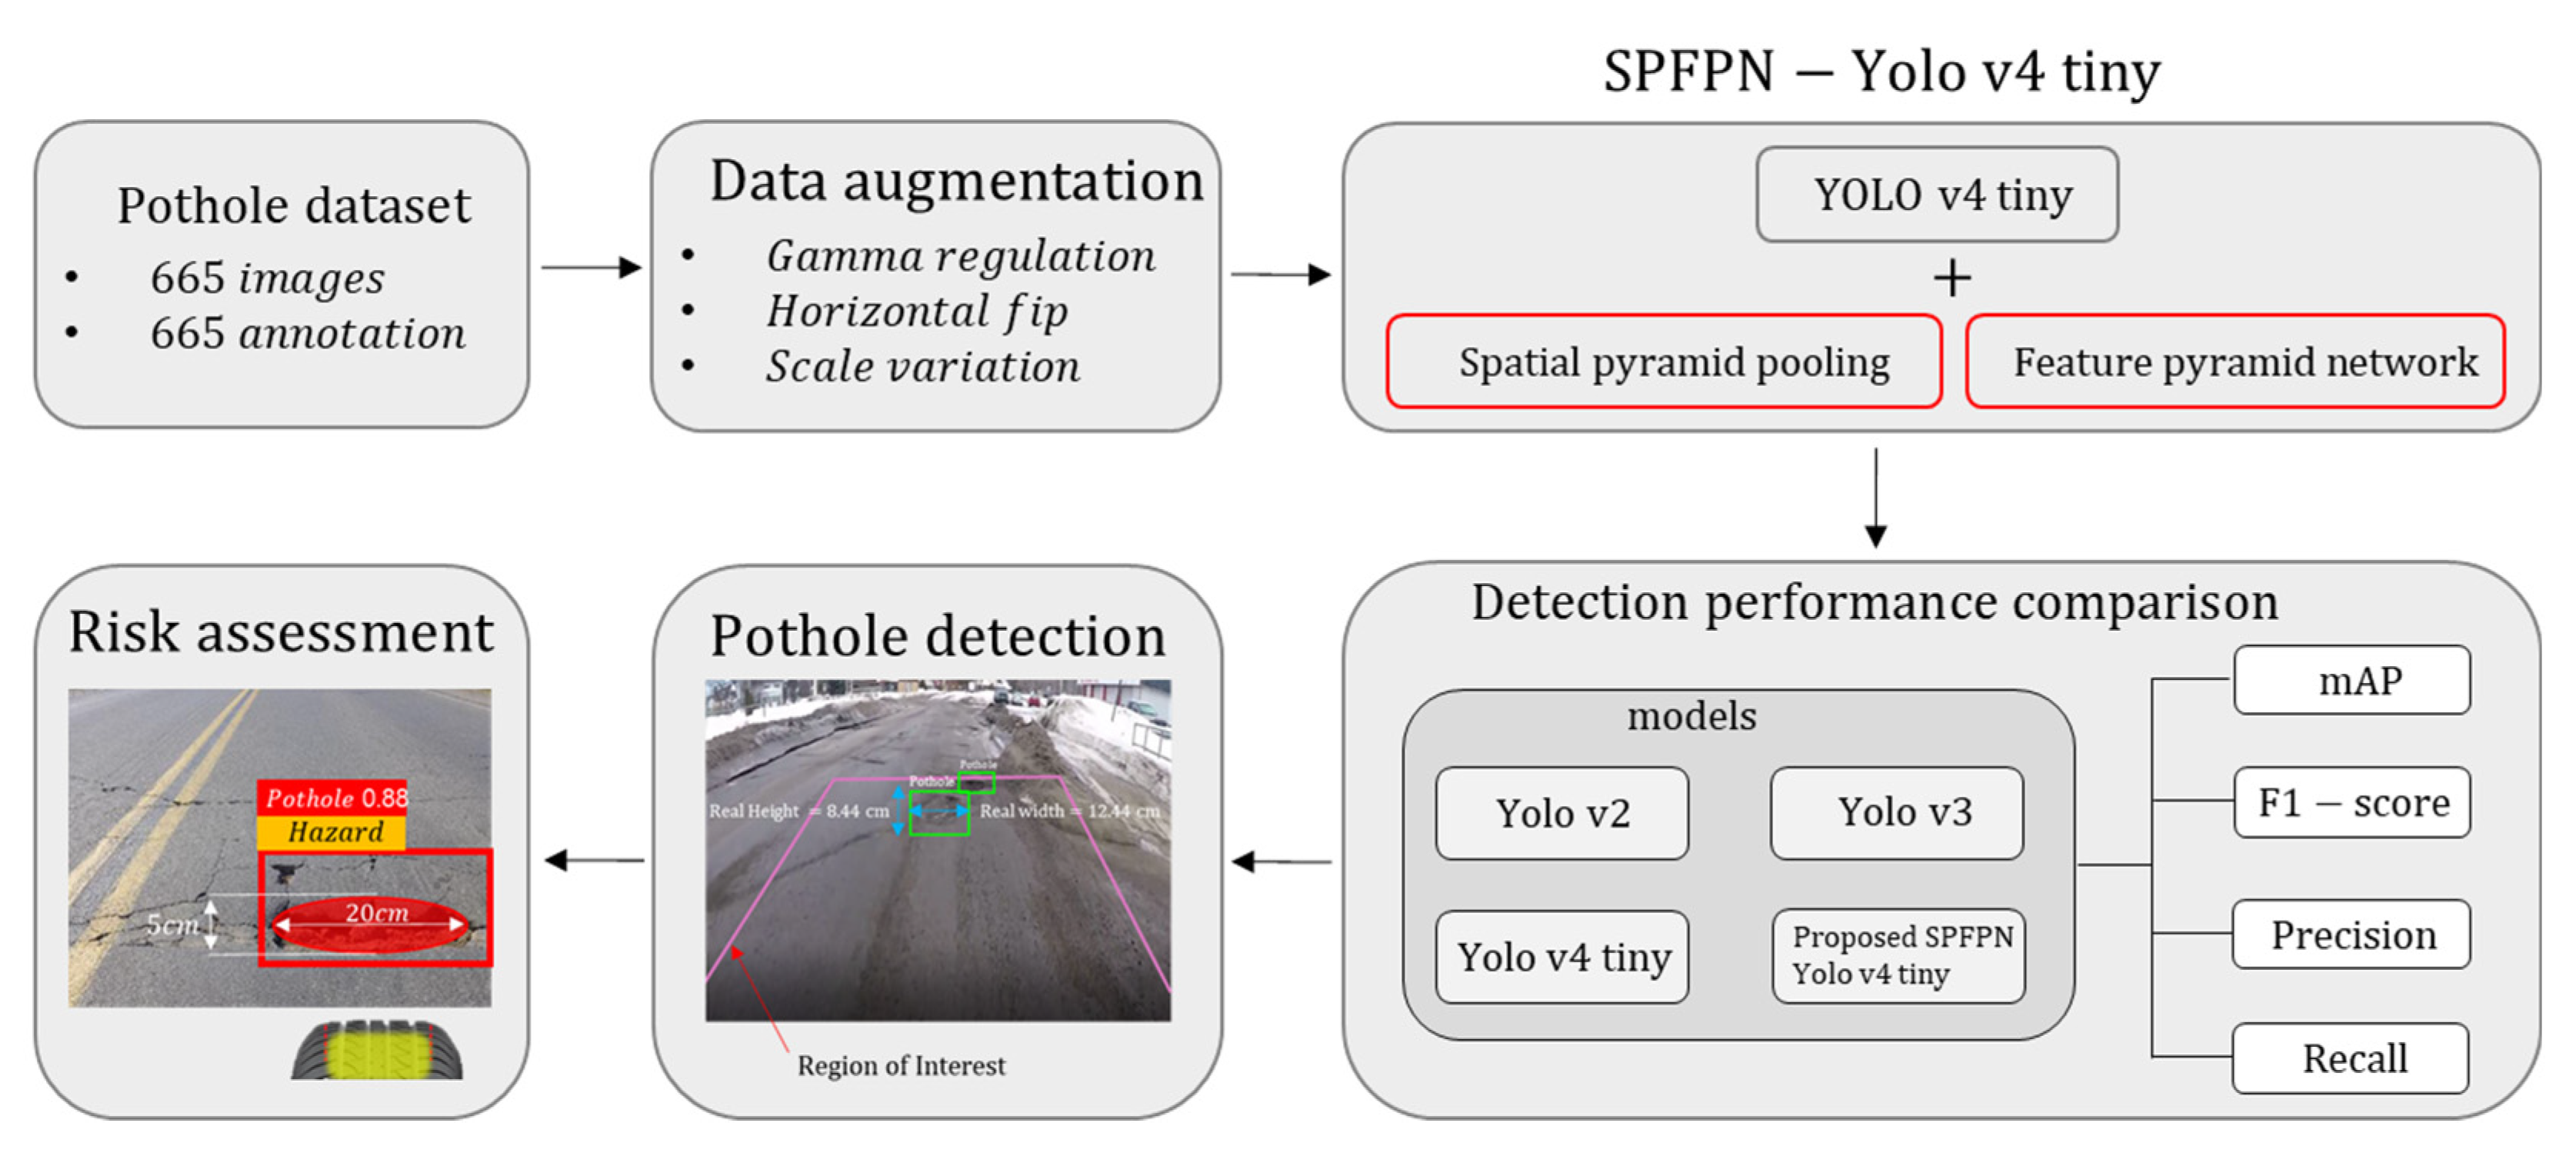
- Assuming a low-spec hardware system, we developed a lightweight pothole detection algorithm capable of real-time detection without a GPU.
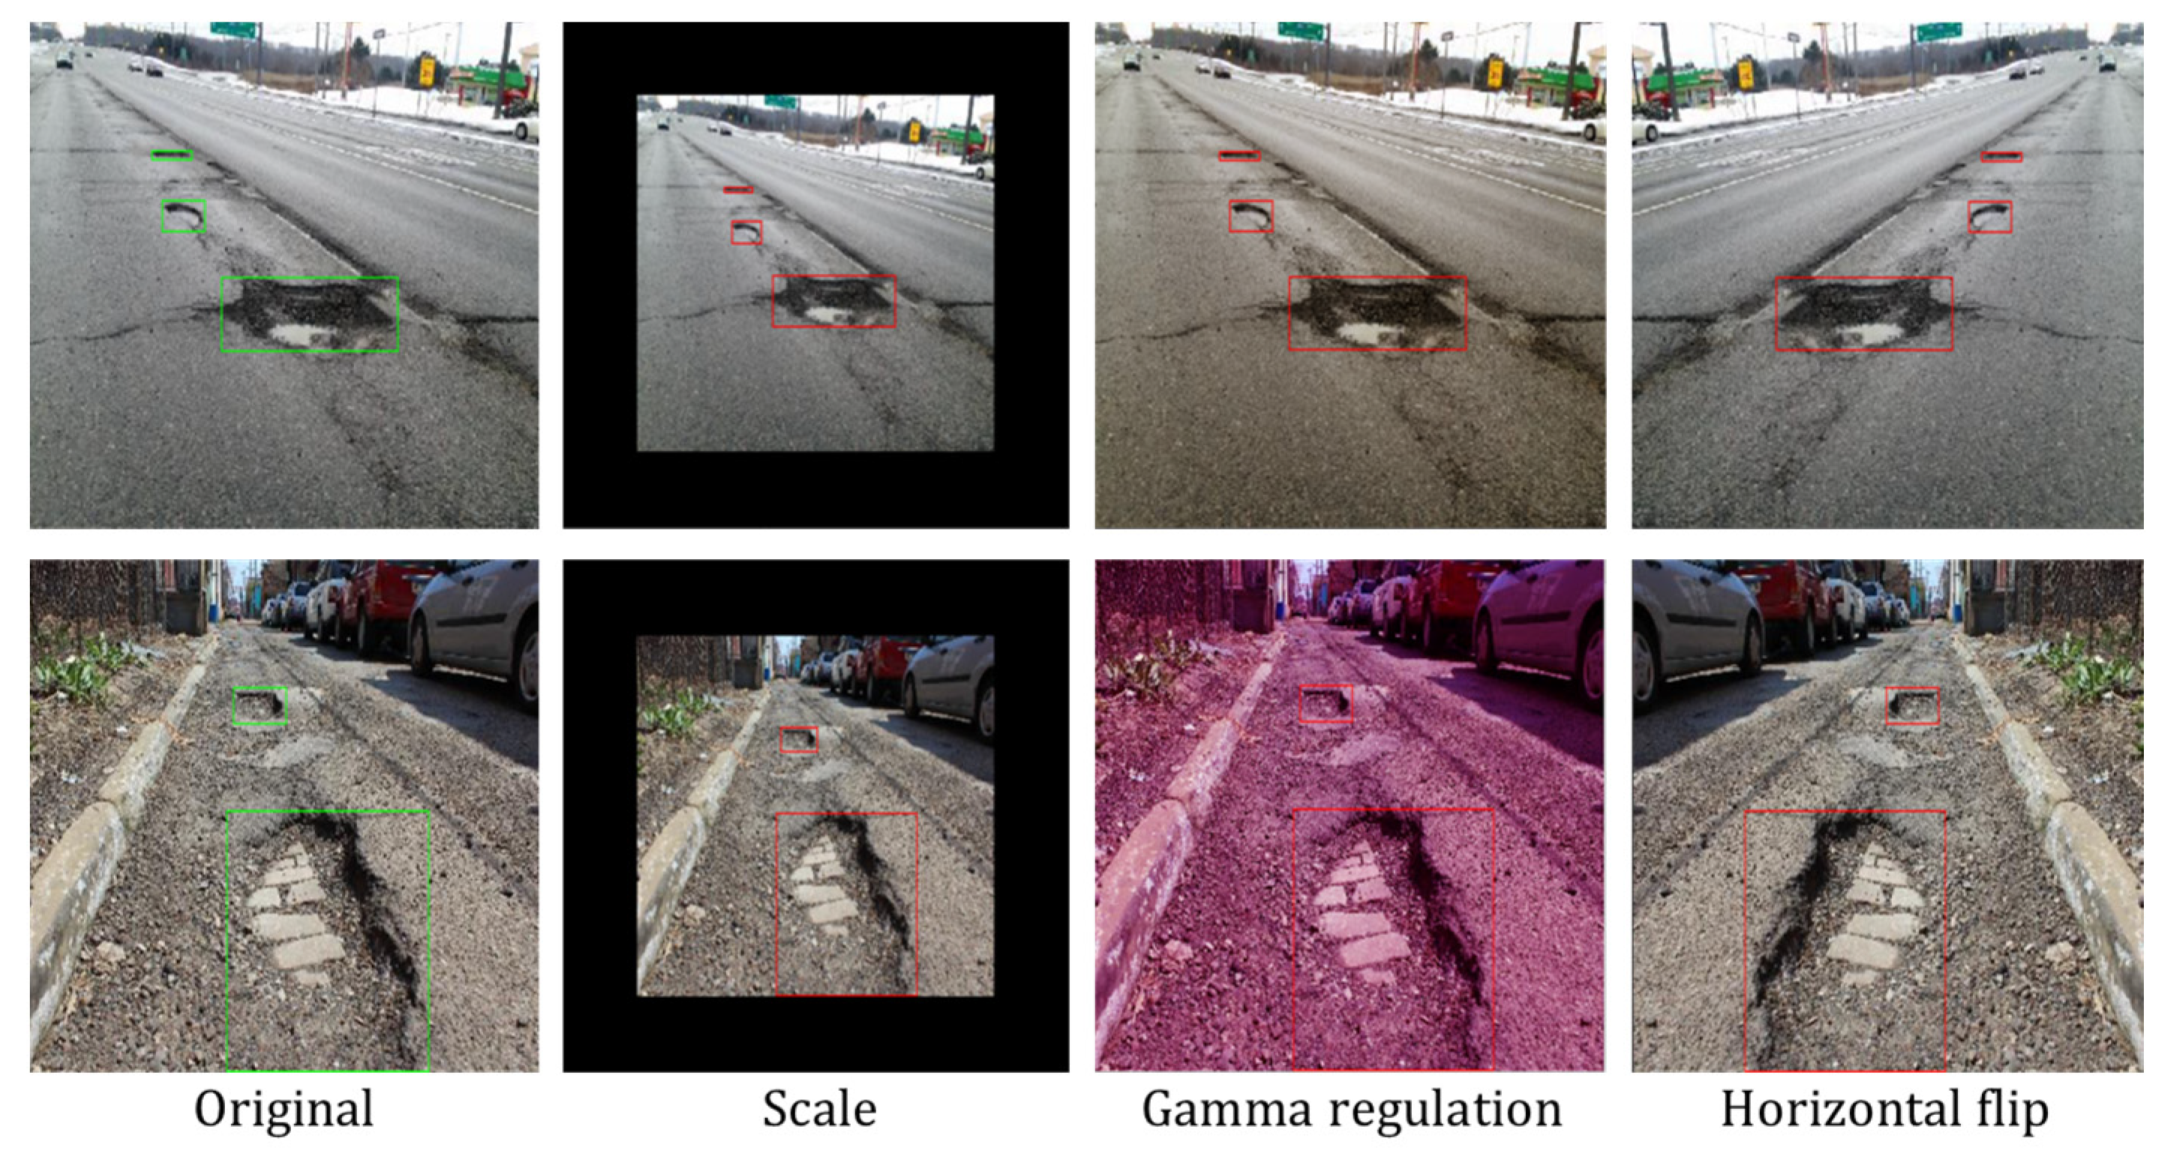
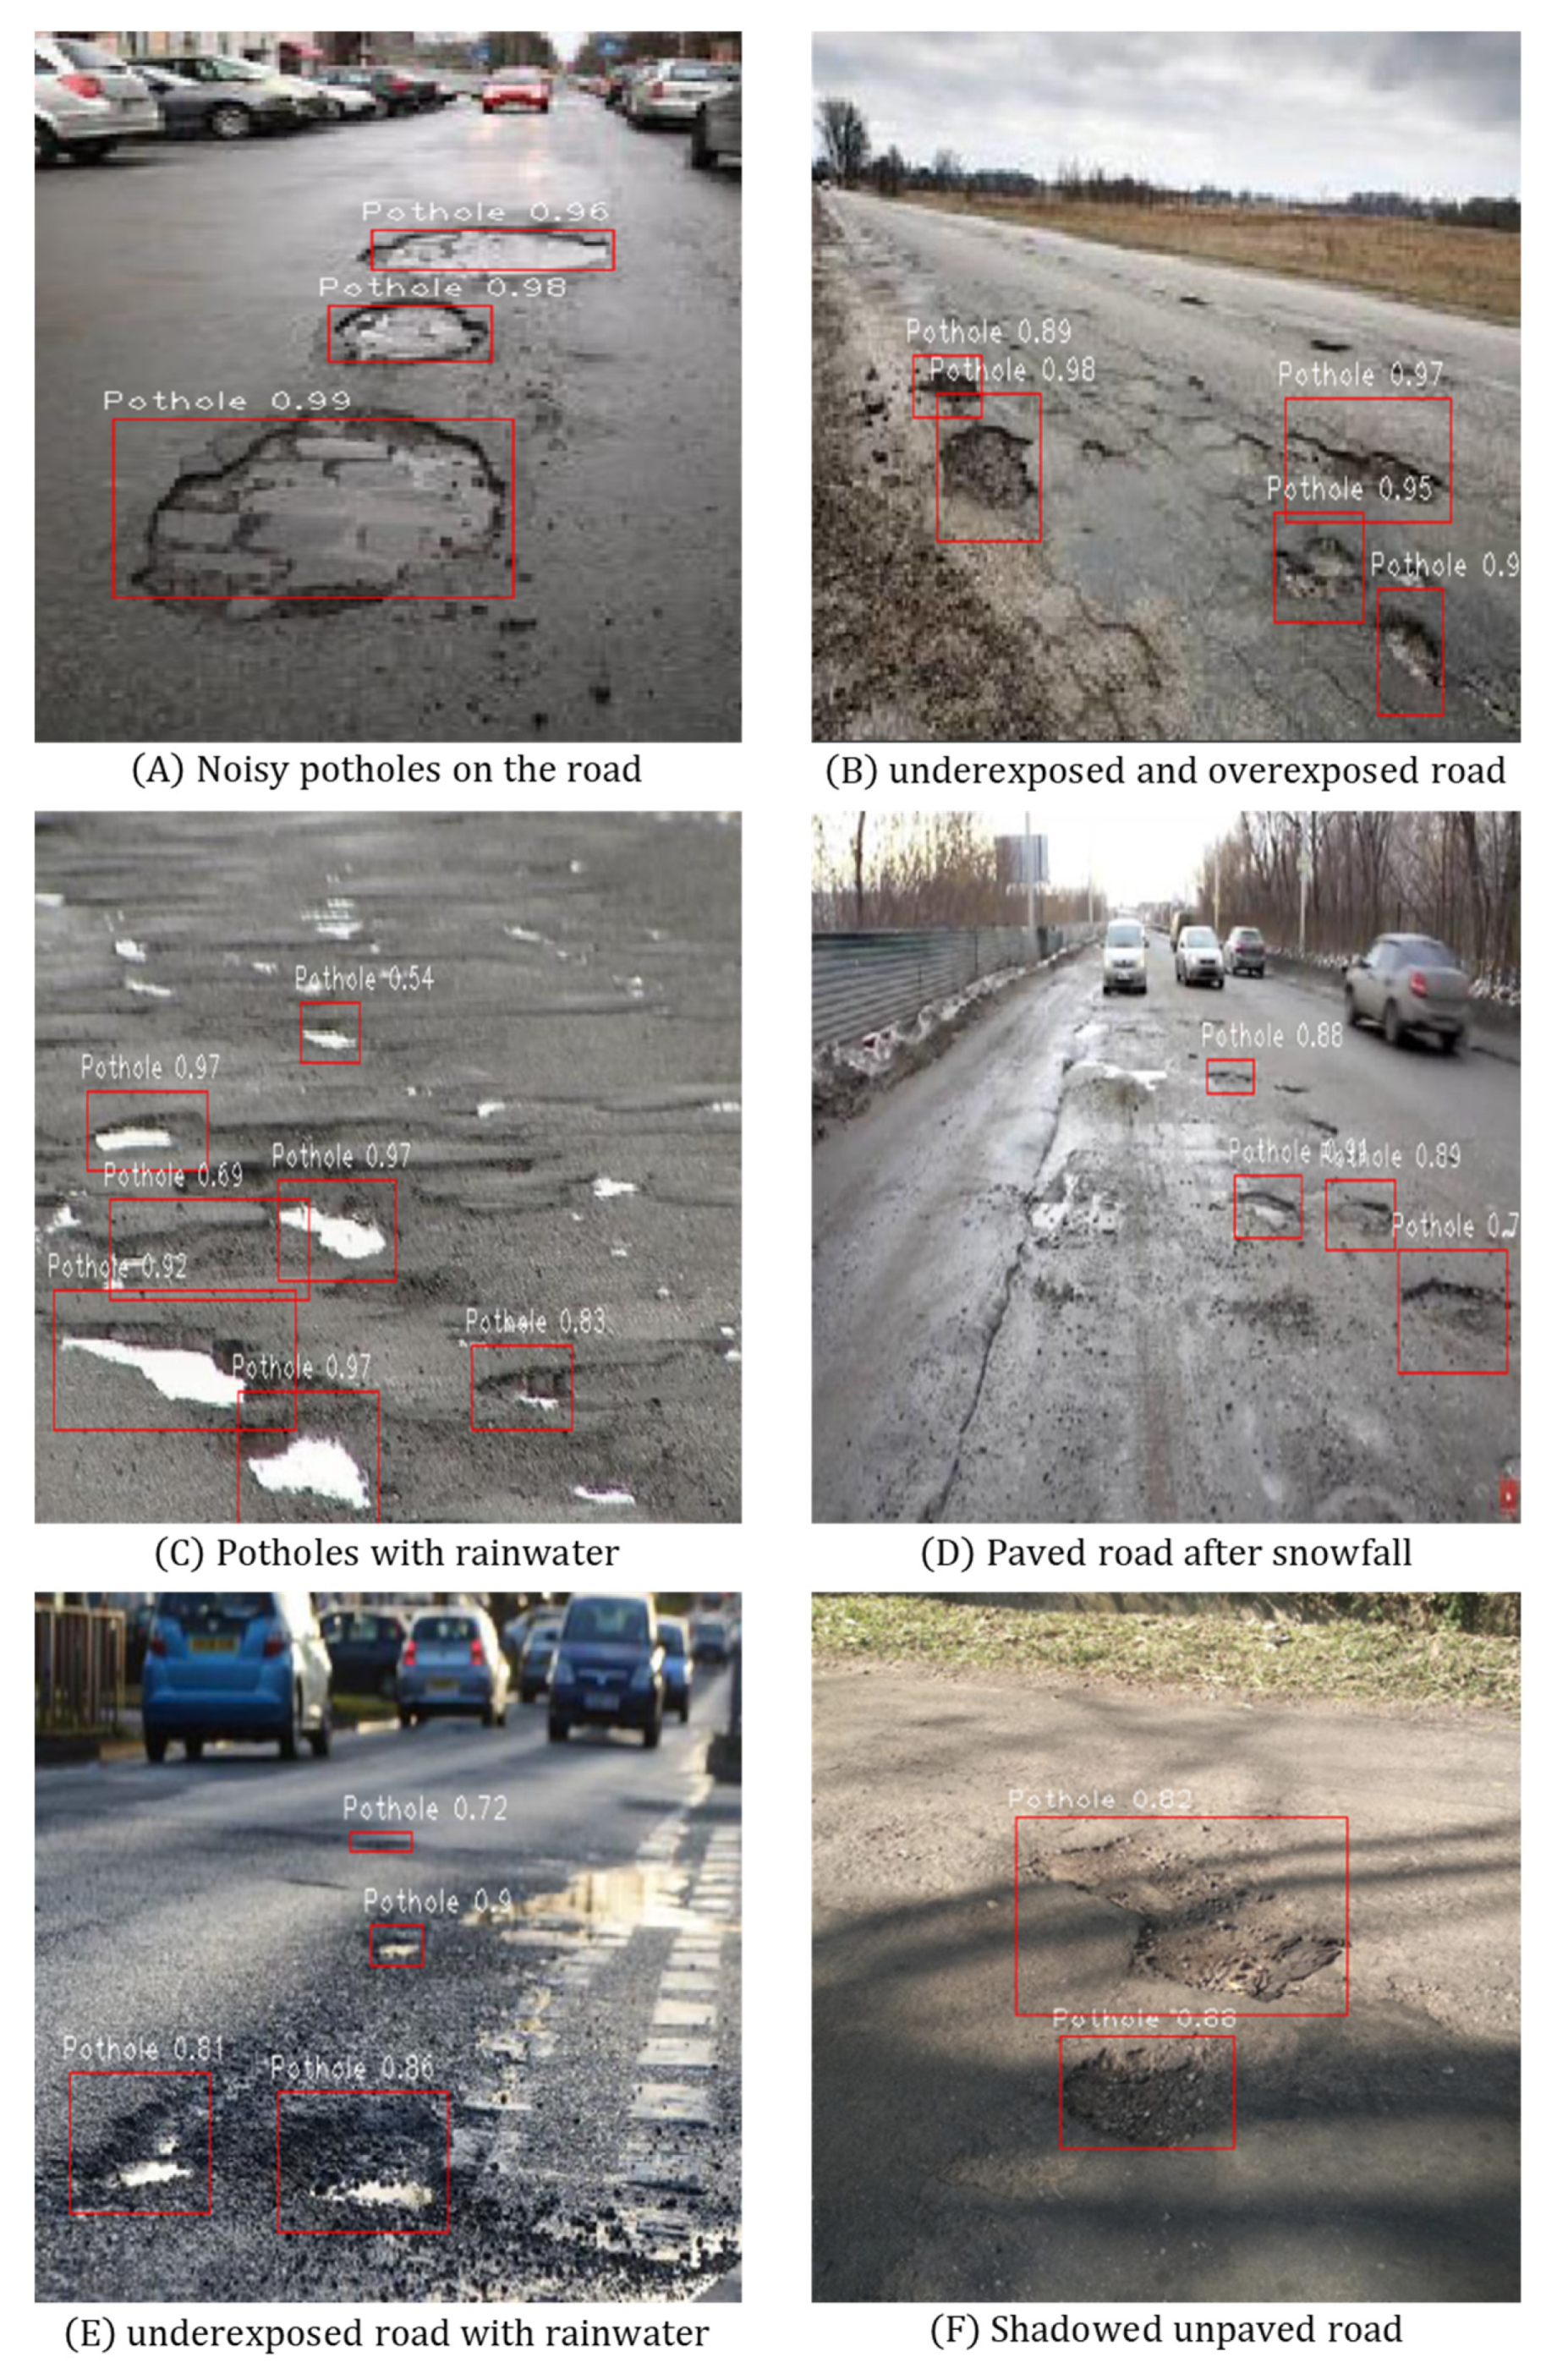
- By applying data augmentation techniques, such as gamma regulation, horizontal flip, and scaling, we compensate for the deficient dataset and increase the adaptation of deep learning models in various environments (i.e., overexposed, underexposed, unpaved, asphalt pavement)
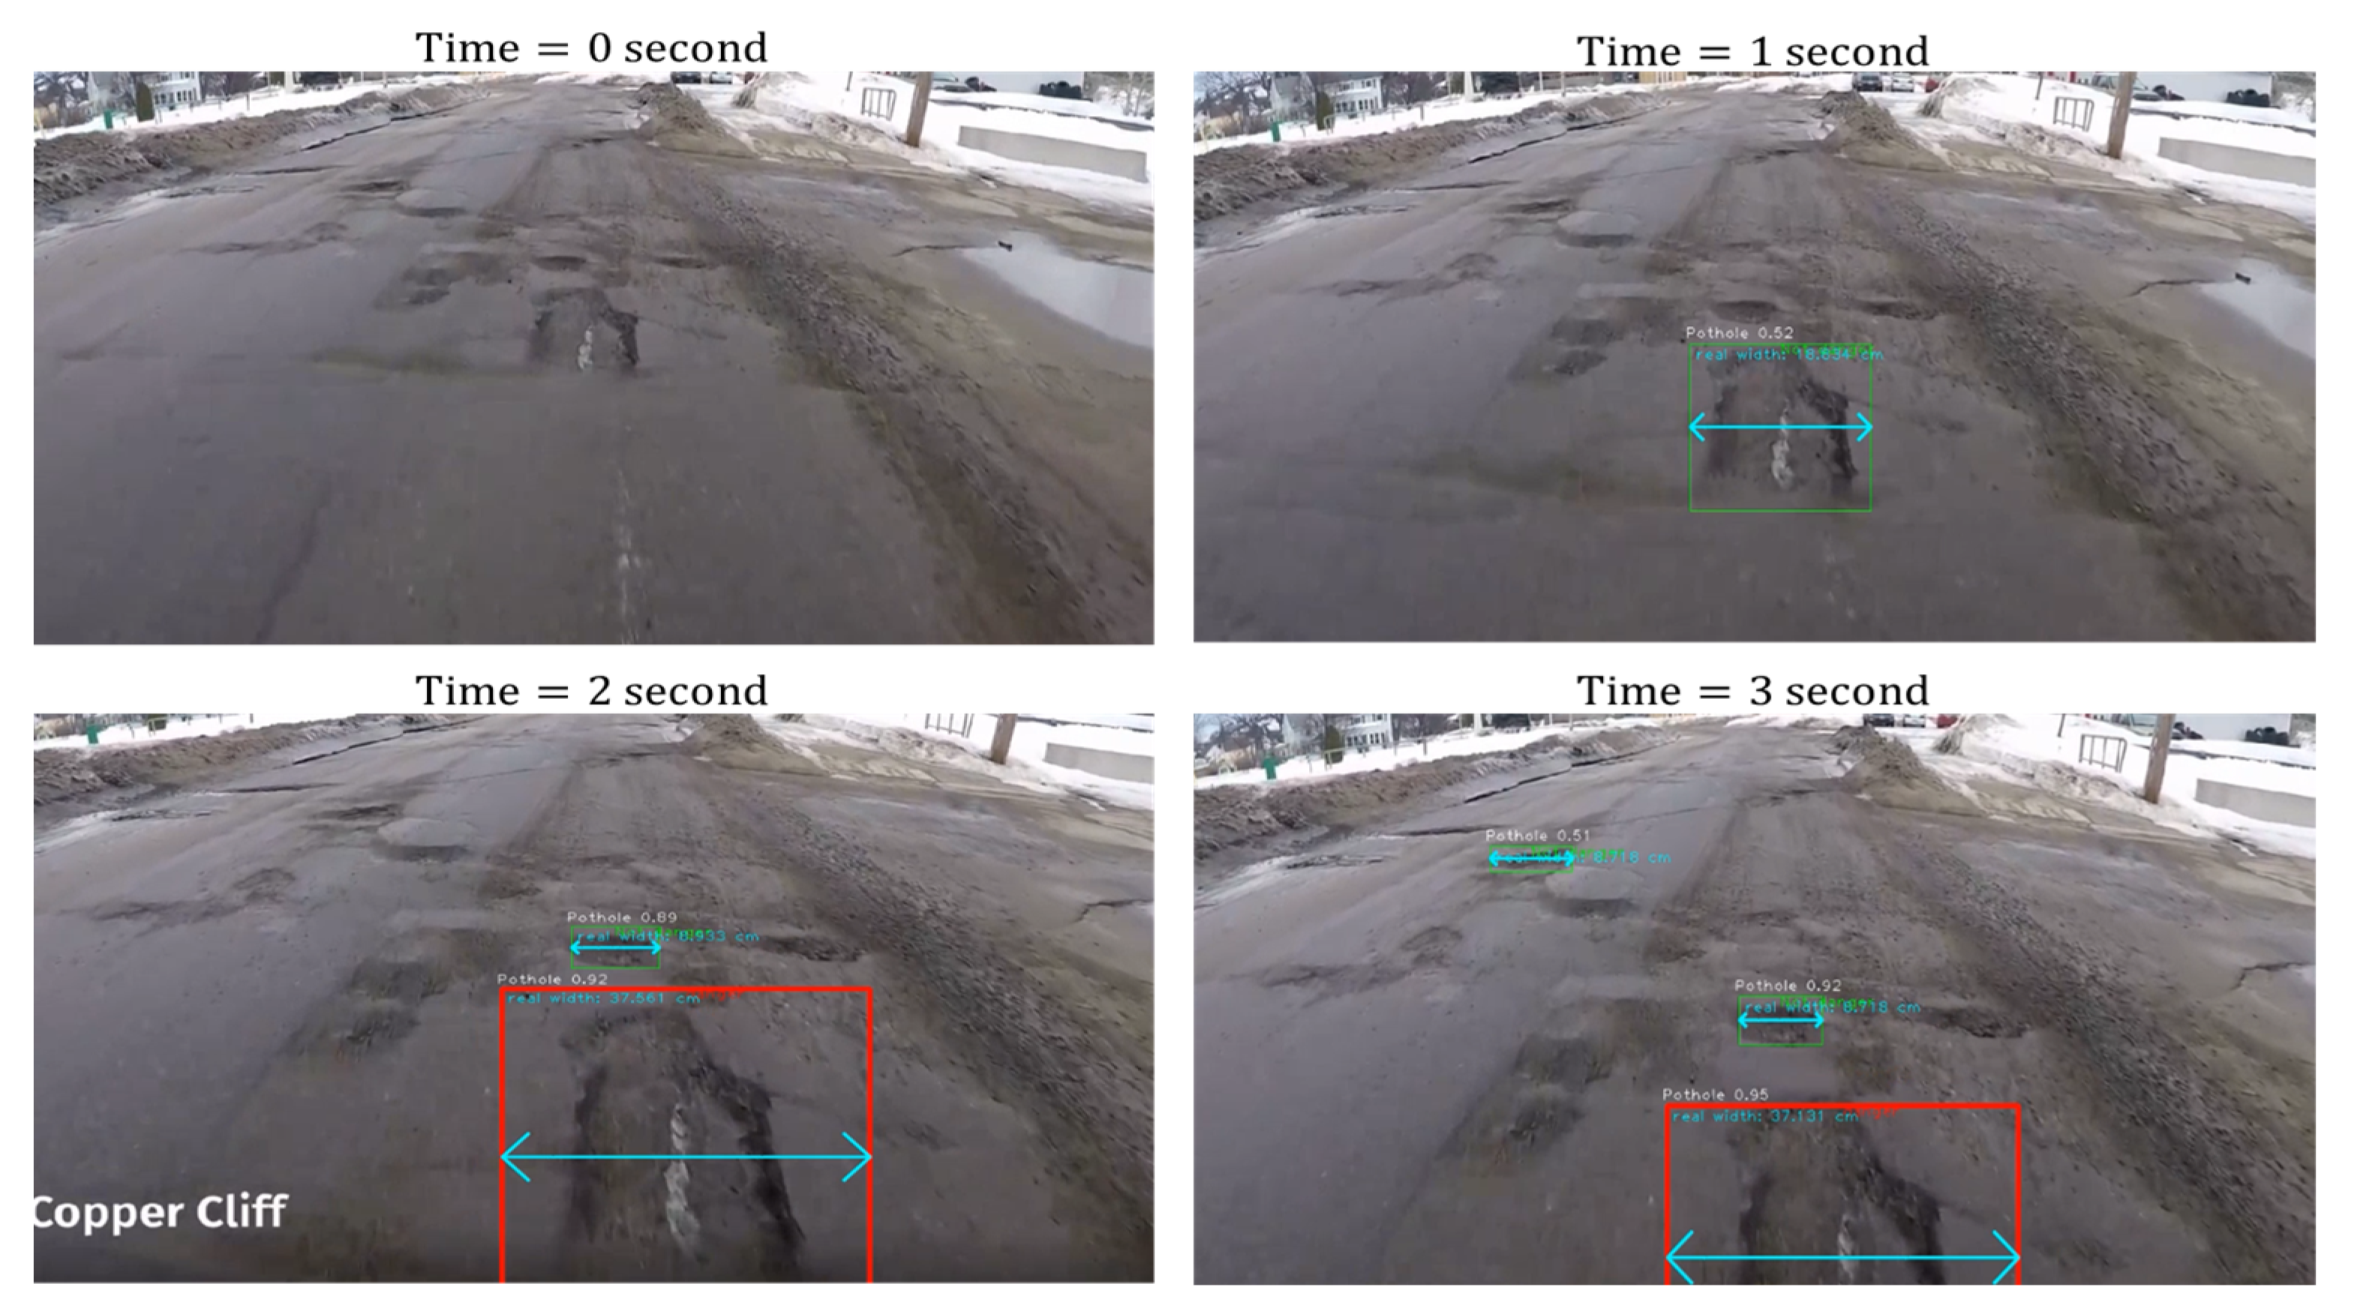
- We proposed a new risk assessment criterion to compare the size of potholes with the tire contact patch size to identify large potholes that are likely to affect traffic accidents.
2. Related Work
2.1. Pothole Object Detection
2.2. Risk Assessment Methods
3. Methods
3.1. Dataset Preprocessing
3.1.1. Dataset Preparation and Data Augmentation
3.1.2. Dataset Configuration
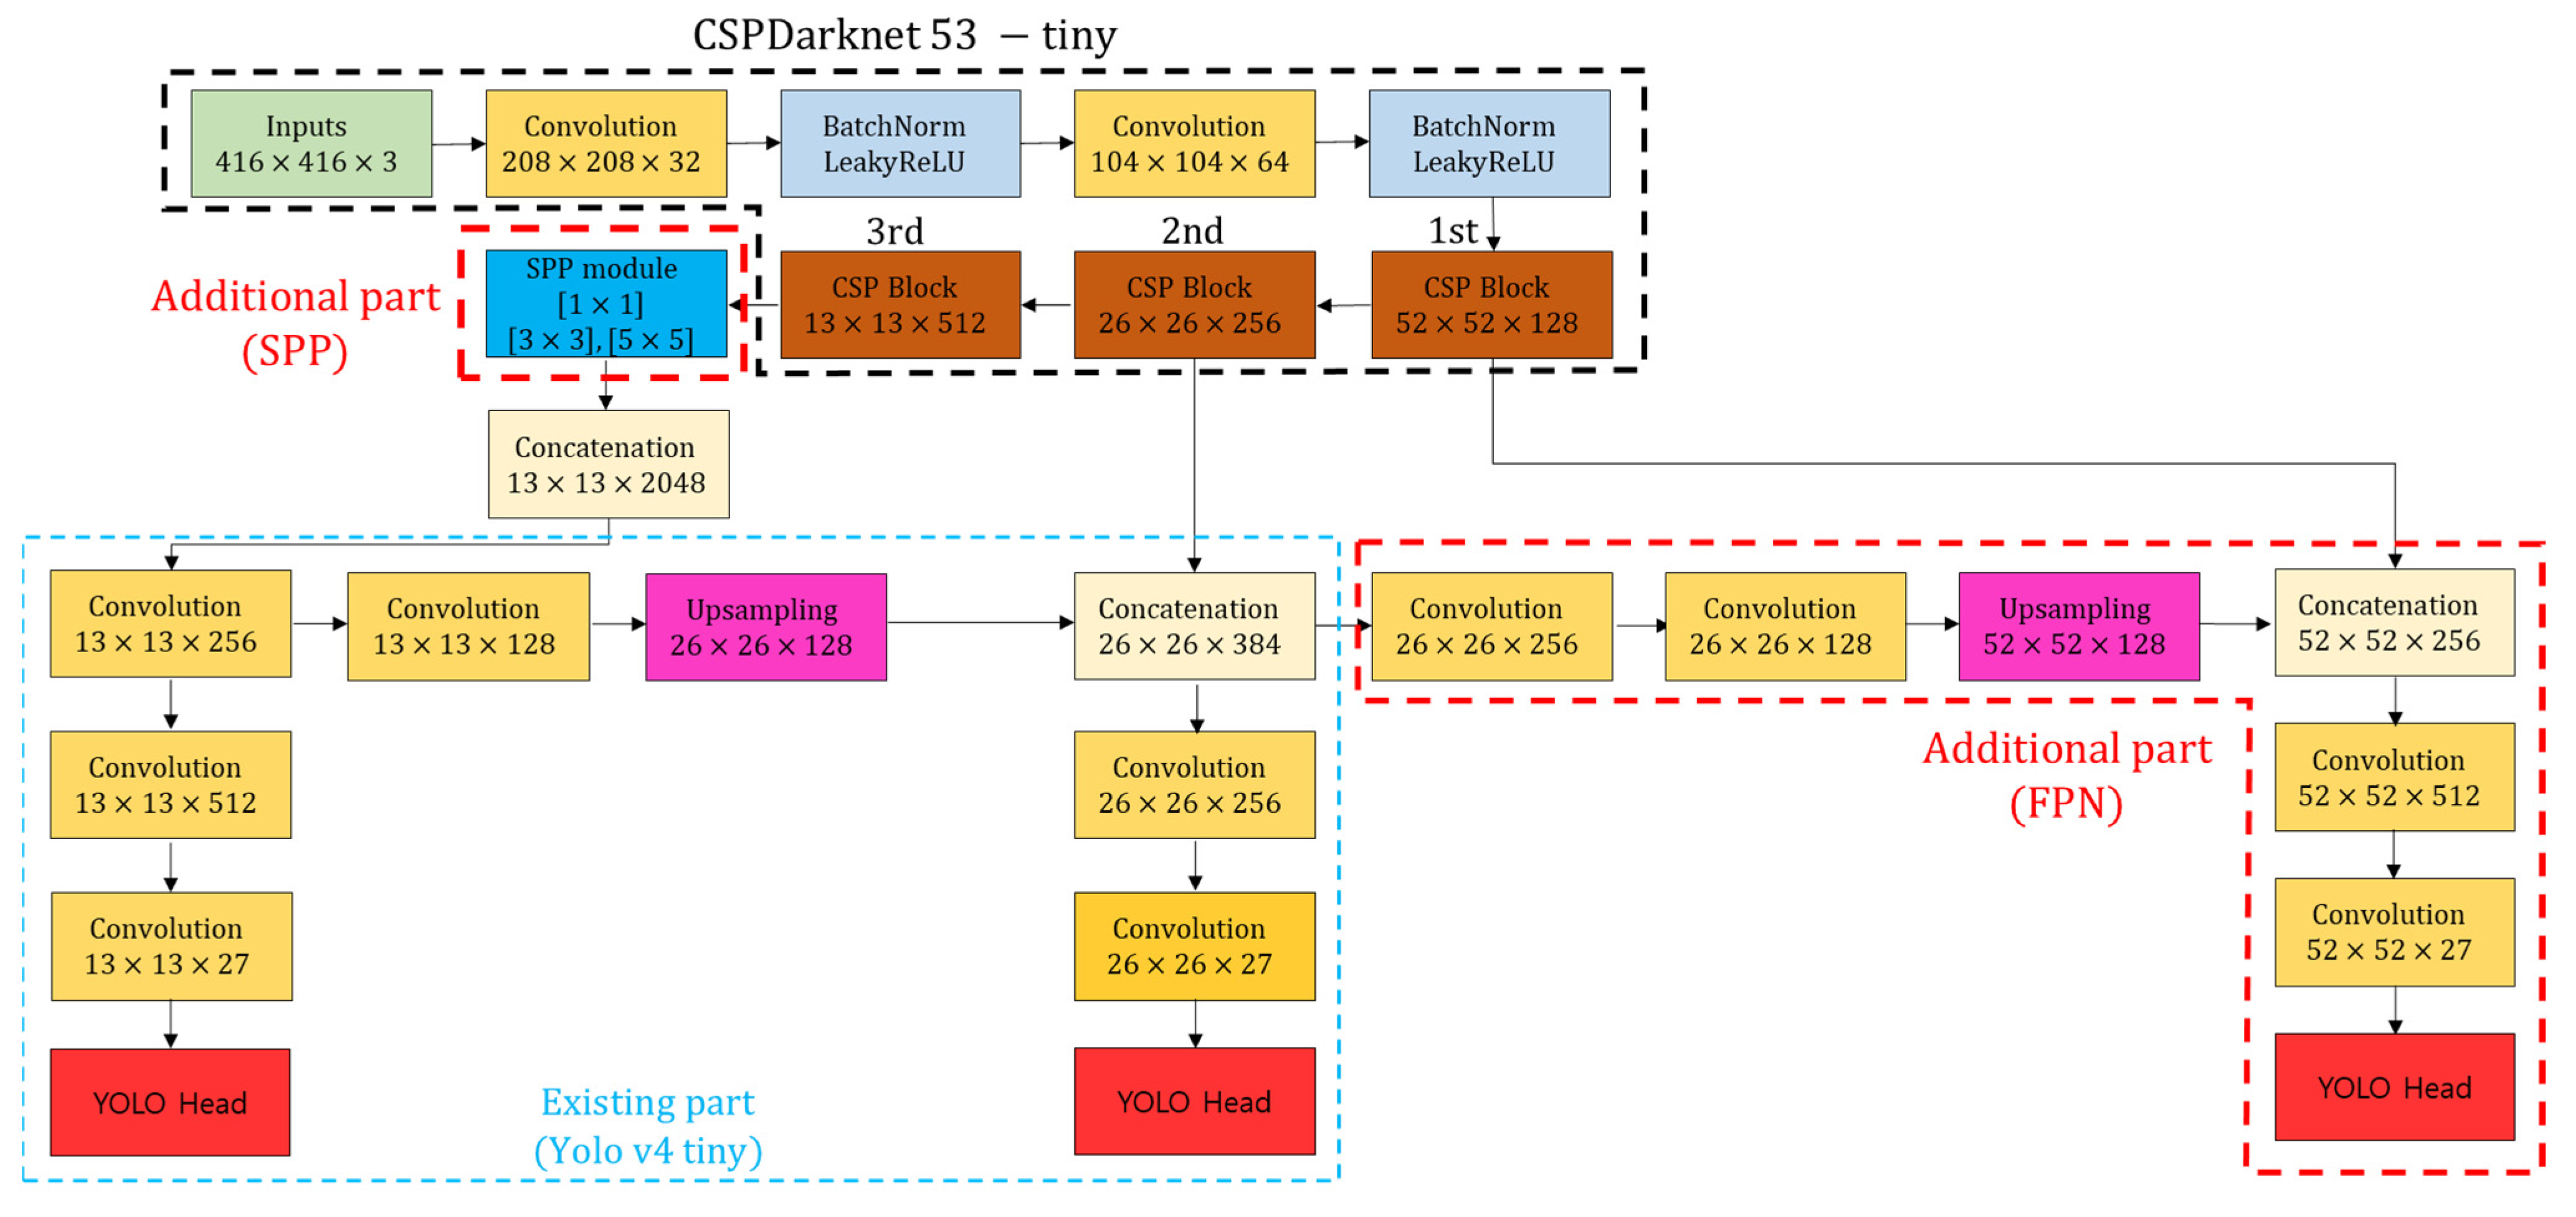
3.2. Development SPFPN-YOLOv4 Tiny
3.2.1. Multi-Scale Feature Network
3.2.2. SPFPN YOLOv4 Tiny
3.3. K-Means++ Clustering
3.4. Object Detection Performance Evaluation Metrics
3.5. Risk Assessment
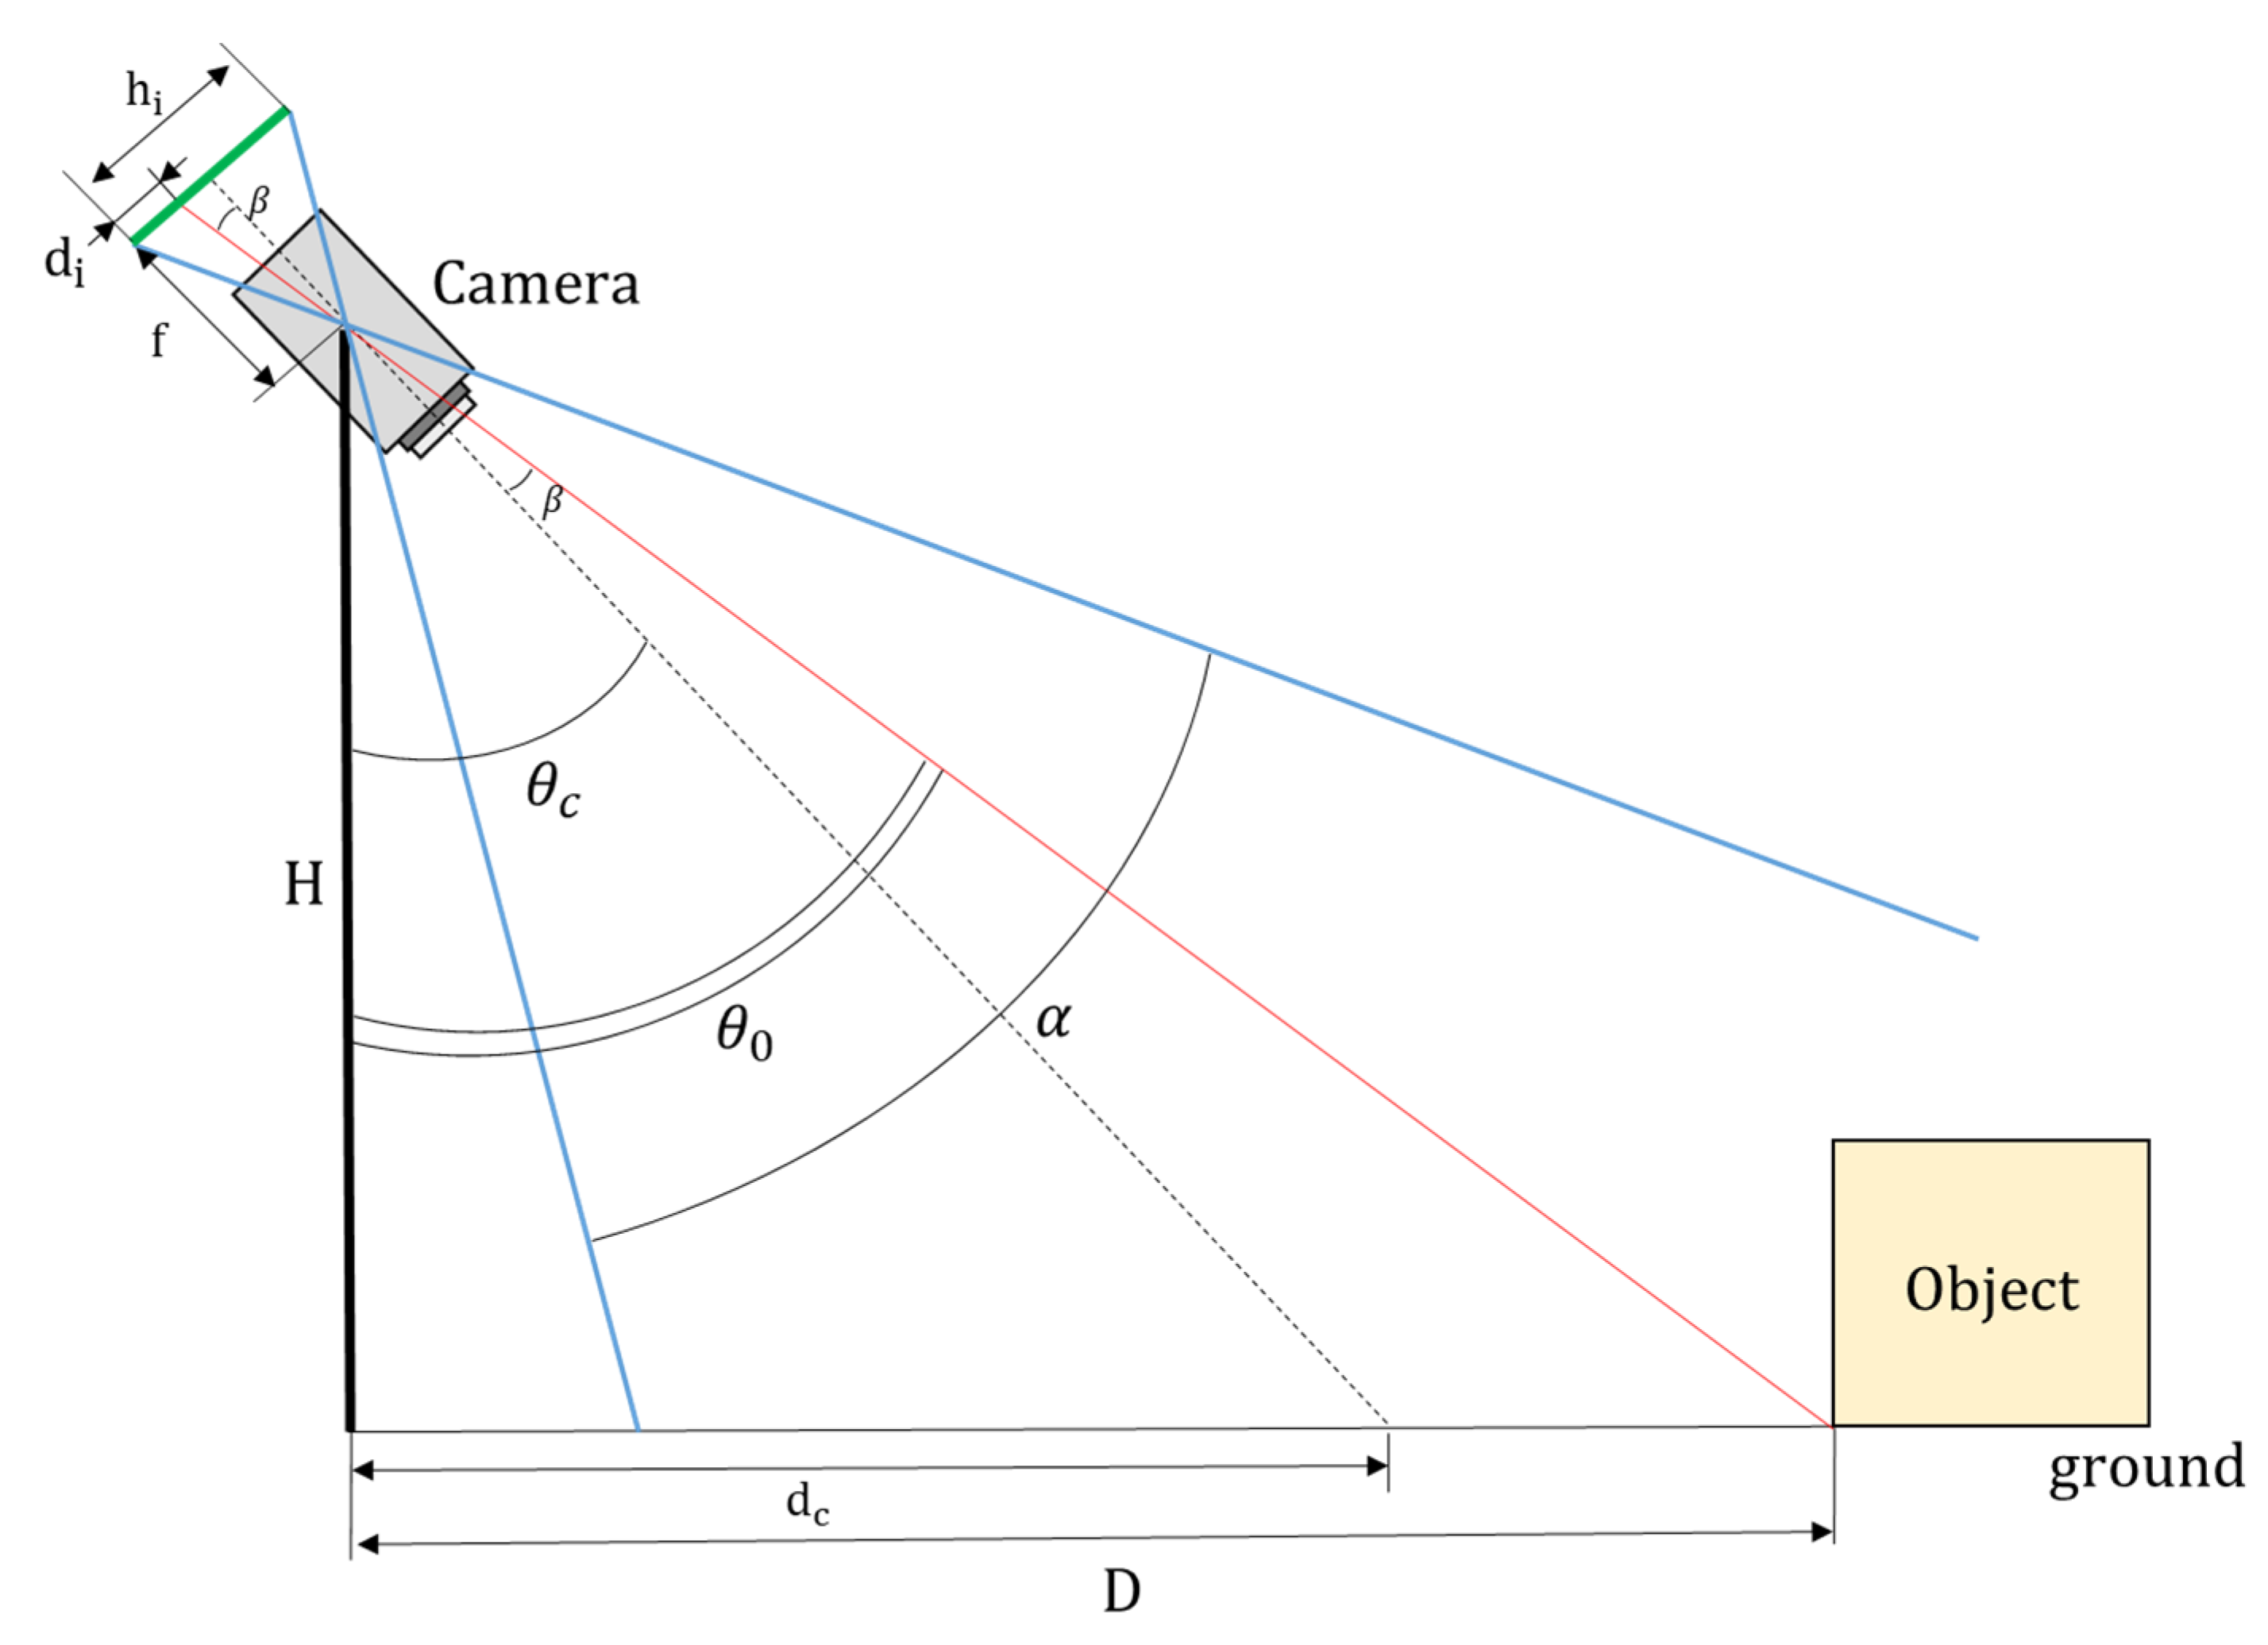
3.5.1. Pothole Distance Estimation
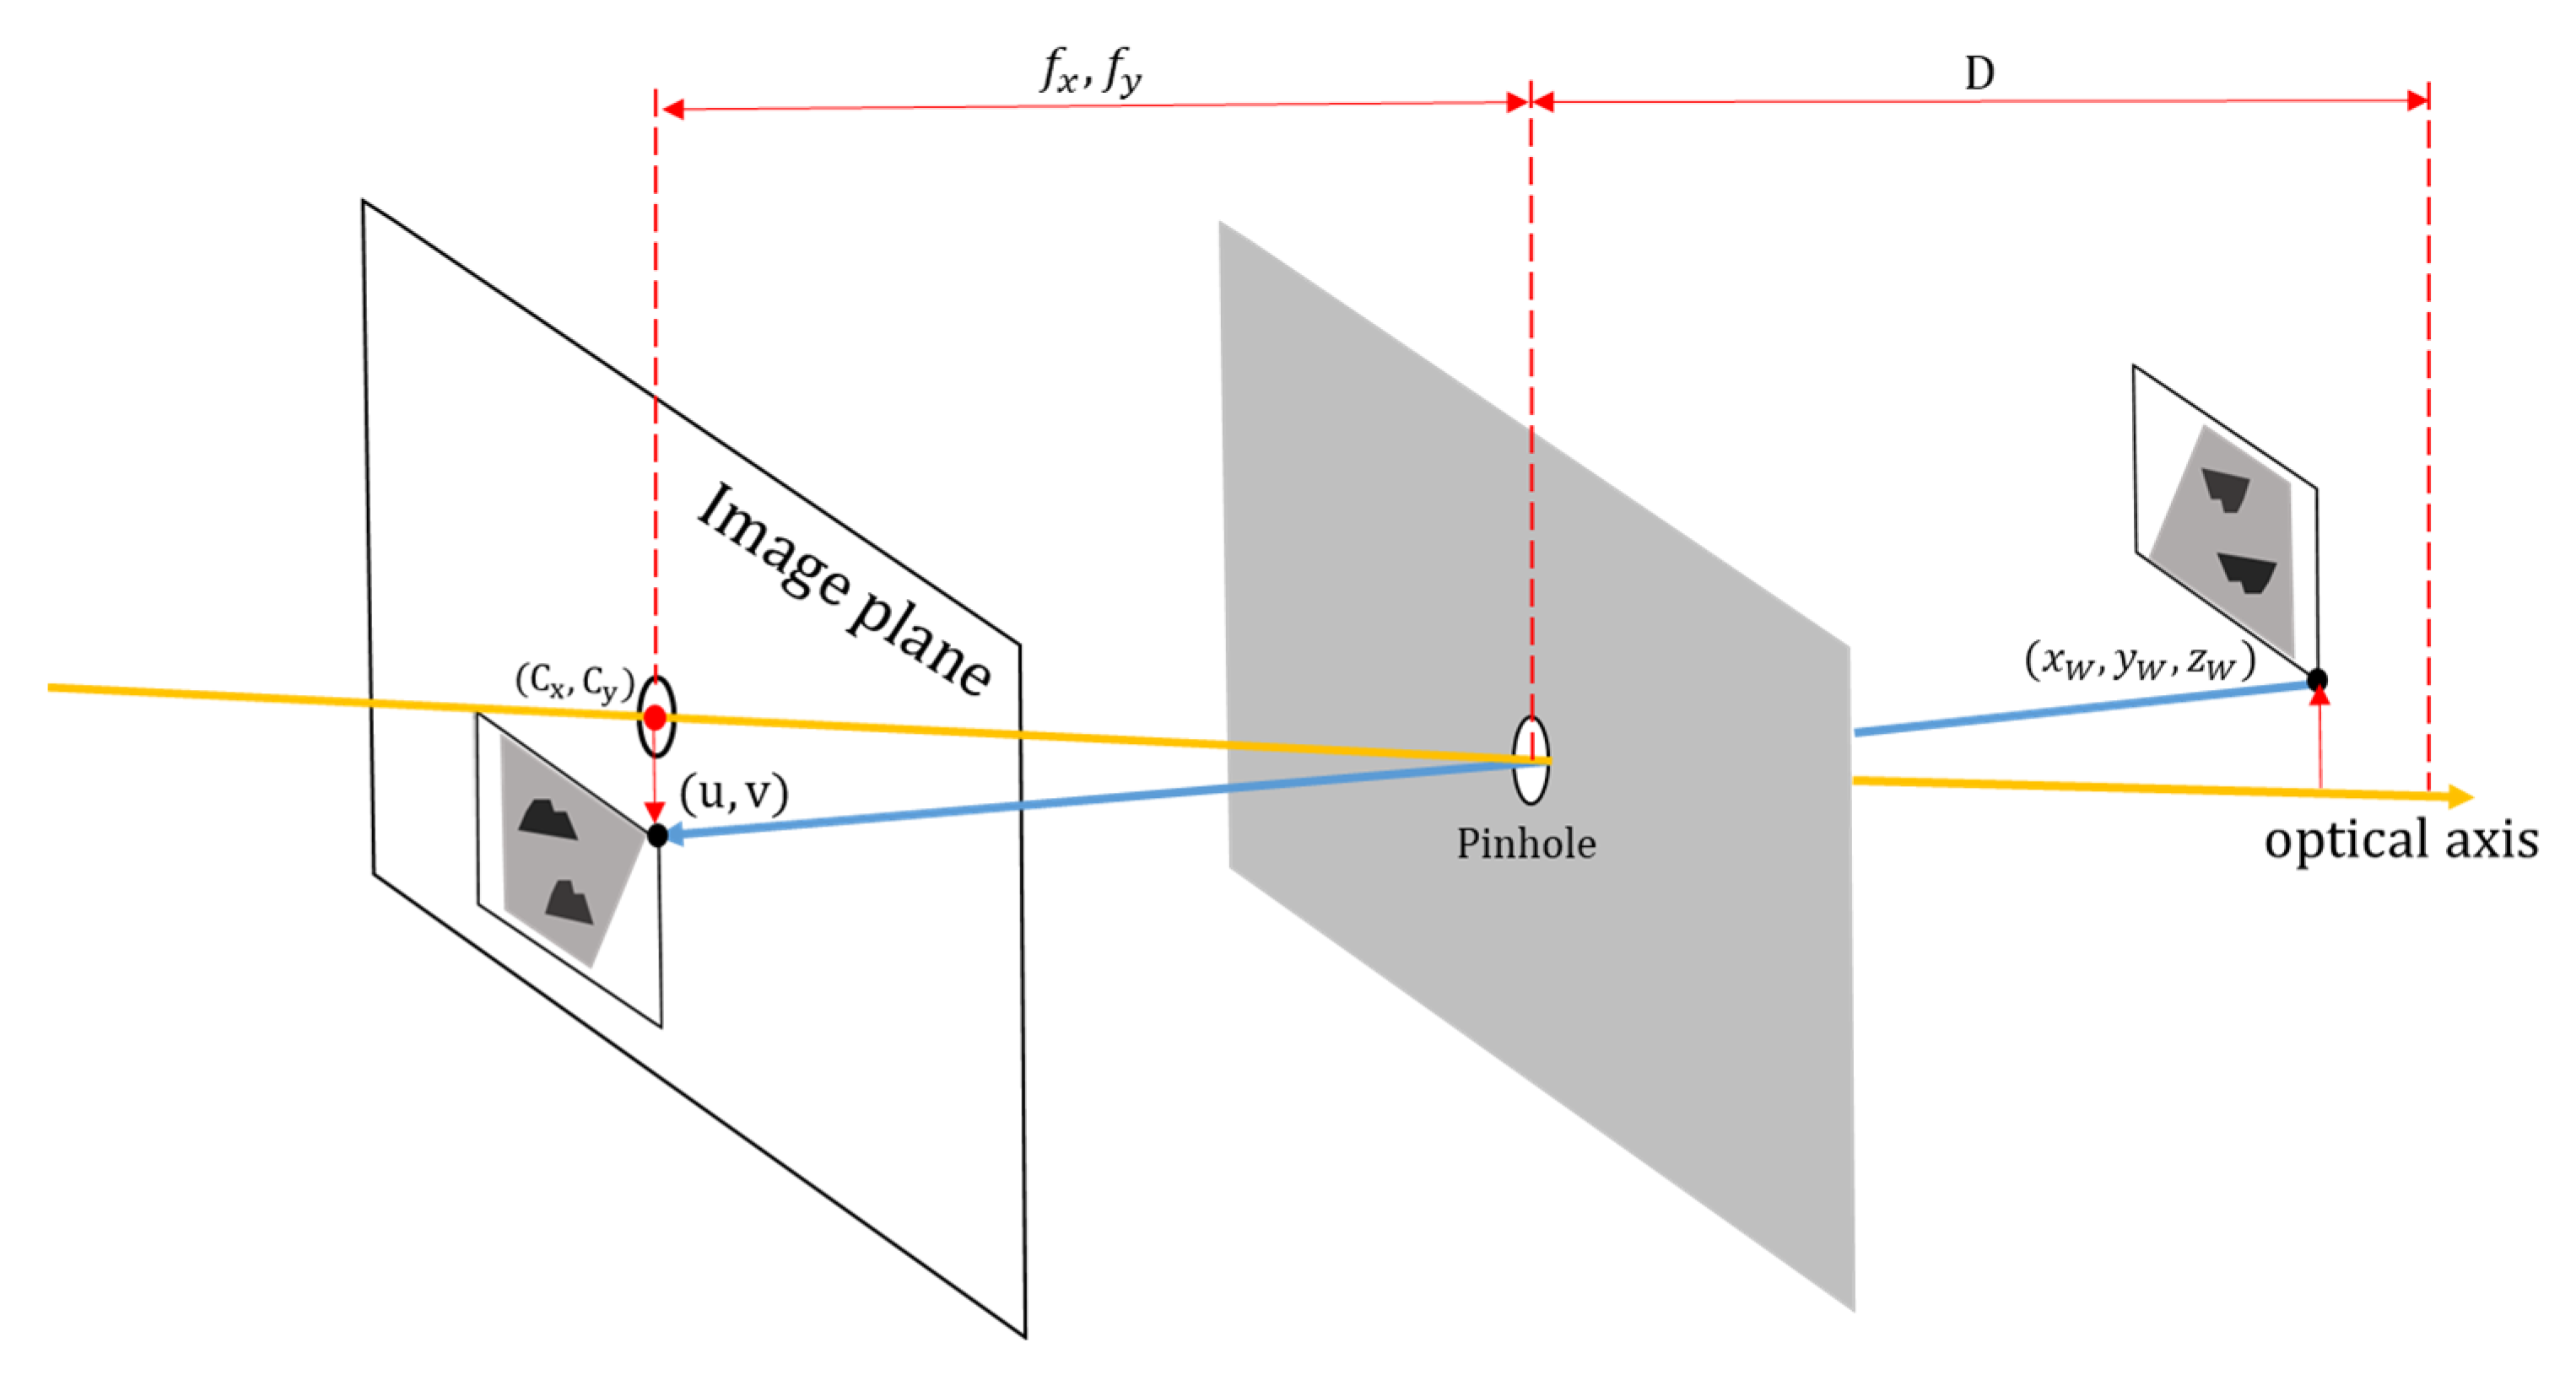
3.5.2. Pinhole Camera Model
4. Results
4.1. Object Detection Algorithm Performance Comparison
4.2. Risk Assessment
5. Discussion
6. Conclusions
Author Contributions
Funding
Institutional Review Board Statement
Informed Consent Statement
Data Availability Statement
Acknowledgments
Conflicts of Interest
References
- Ministry of Road Transport and Highway. 2022. Available online: https://morth.nic.in/road-accident-in-india (accessed on 28 December 2022).
- Bučko, B.; Lieskovská, E.; Zábovská, K.; Zábovský, M. Computer Vision Based Pothole Detection under Challenging Conditions. Sensors 2022, 22, 8878. [Google Scholar] [CrossRef]
- Qiao, Y.; Santos, J.; Stoner, A.M.; Flinstch, G. Climate change impacts on asphalt road pavement construction and maintenance: An economic life cycle assessment of adaptation measures in the State of Virginia, United States. J. Ind. Ecol. 2020, 24, 342–355. [Google Scholar] [CrossRef]
- Zhang, F.; Hamdulla, A. Research on Pothole Detection Method for Intelligent Driving Vehicle. In Proceedings of the 2022 3rd International Conference on Pattern Recognition and Machine Learning (PRML), Chengdu, China, 22–24 July 2022; pp. 124–130. [Google Scholar]
- She, X.; Hongwei, Z.; Wang, Z.; Yan, J. Feasibility study of asphalt pavement pothole properties measurement using 3D line laser technology. Int. J. Transp. Sci. Technol. 2021, 10, 83–92. [Google Scholar] [CrossRef]
- Fan, R.; Ozgunalp, U.; Wang, Y.; Liu, M.; Pitas, I. Rethinking road surface 3-d reconstruction and pothole detection: From perspective transformation to disparity map segmentation. IEEE Trans. Cybern. 2021, 52, 5799–5808. [Google Scholar] [CrossRef] [PubMed]
- Kaushik, V.; Kalyan, B.S. Pothole Detection System: A Review of Different Methods Used for Detection. In 2022 Second International Conference on Computer Science, Engineering and Applications (ICCSEA); IEEE: Piscataway, NJ, USA, 2022; pp. 1–4. [Google Scholar]
- Wang, H.-W.; Chen, C.-H.; Cheng, D.-Y.; Lin, C.-H.; Lo, C.-C. A real-time pothole detection approach for intelligent transportation system. Math. Probl. Eng. 2015, 2015, 869627. [Google Scholar] [CrossRef]
- Kim, Y.-M.; Kim, Y.-G.; Son, S.-Y.; Lim, S.-Y.; Choi, B.-Y.; Choi, D.-H. Review of Recent Automated Pothole-Detection Methods. Appl. Sci. 2022, 12, 5320. [Google Scholar] [CrossRef]
- Ahmed, K.R. Smart Pothole Detection Using Deep Learning Based on Dilated Convolution. Sensors 2021, 21, 8406. [Google Scholar] [CrossRef] [PubMed]
- Chen, W.-H.; Hsu, H.-J.; Lin, Y.-C. Implementation of a Real-time Uneven Pavement Detection System on FPGA Platforms. In Proceedings of the 2022 IEEE International Conference on Consumer Electronics-Taiwan, Taipei, Taiwan, 6–8 July 2022; pp. 587–588. [Google Scholar]
- Musa, A.; Hamada, M.; Hassan, M.A. Theoretical Framework Towards Building a Lightweight Model for Pothole Detection using Knowledge Distillation Approach. In SHS Web of Conferences; EDP Sciences: Les Ulis, France, 2022; p. 03002. [Google Scholar]
- Kırbaş, U. Effects of pothole type pavement distress on whole-body vibration. Road Mater. Pavement Des. 2022, 1–22. [Google Scholar] [CrossRef]
- Solanke, V.L.; Patil, D.D.; Patkar, A.S.; Tamrale, G.S.; Kale, A.G. Analysis of existing road surface on the basis of pothole characteristics. Glob. J. Res. Eng. 2019, 19, 17–23. [Google Scholar]
- Romero-Chambi, E.; Villarroel-Quezada, S.; Atencio, E.; Muñoz-La Rivera, F. Analysis of optimal flight parameters of unmanned aerial vehicles (UAVs) for detecting potholes in pavements. Appl. Sci. 2020, 10, 4157. [Google Scholar] [CrossRef]
- Jana, S.; Thangam, S.; Kishore, A.; Sai Kumar, V.; Vandana, S. Transfer learning based deep convolutional neural network model for pavement crack detection from images. Int. J. Nonlinear Anal. Appl. 2022, 13, 1209–1223. [Google Scholar]
- Pandey, A.K.; Iqbal, R.; Maniak, T.; Karyotis, C.; Akuma, S.; Palade, V. Convolution neural networks for pothole detection of critical road infrastructure. Comput. Electr. Eng. 2022, 99, 107725. [Google Scholar] [CrossRef]
- Gupta, S.; Sharma, P.; Sharma, D.; Gupta, V.; Sambyal, N. Detection and localization of potholes in thermal images using deep neural networks. Multimed. Tools Appl. 2020, 79, 26265–26284. [Google Scholar] [CrossRef]
- Koch, C.; Brilakis, I. Pothole detection in asphalt pavement images. Adv. Eng. Inform. 2011, 25, 507–515. [Google Scholar] [CrossRef]
- Powell, L.; Satheeshkumar, K. Automated road distress detection. In Proceedings of the 2016 International Conference on Emerging Technological Trends (ICETT), Kollam, India, 21–22 October 2016; pp. 1–6. [Google Scholar]
- Ukhwah, E.N.; Yuniarno, E.M.; Suprapto, Y.K. Asphalt pavement pothole detection using deep learning method based on YOLO neural network. In Proceedings of the 2019 International Seminar on Intelligent Technology and Its Applications (ISITIA), JW Marriott Hotel, Surabaya, Indonesia, 28–29 August 2019; pp. 35–40. [Google Scholar]
- Redmon, J.; Farhadi, A. Yolov3: An incremental improvement. arXiv 2018, arXiv:1804.02767. [Google Scholar]
- Adarsh, P.; Rathi, P.; Kumar, M. YOLO v3-Tiny: Object Detection and Recognition using one stage improved model. In Proceedings of the 2020 6th International Conference on Advanced Computing and Communication Systems (ICACCS), Coimbatore, India, 6–7 March 2020; pp. 687–694. [Google Scholar]
- Huang, Z.; Wang, J.; Fu, X.; Yu, T.; Guo, Y.; Wang, R. DC-SPP-YOLO: Dense connection and spatial pyramid pooling based YOLO for object detection. Inf. Sci. 2020, 522, 241–258. [Google Scholar] [CrossRef]
- Park, S.-S.; Tran, V.-T.; Lee, D.-E. Application of various yolo models for computer vision-based real-time pothole detection. Appl. Sci. 2021, 11, 11229. [Google Scholar] [CrossRef]
- Bochkovskiy, A.; Wang, C.-Y.; Liao, H.-Y.M. Yolov4: Optimal speed and accuracy of object detection. arXiv 2020, arXiv:2004.10934. [Google Scholar]
- Wang, L.; Zhou, K.; Chu, A.; Wang, G.; Wang, L. An improved light-weight traffic sign recognition algorithm based on YOLOv4-tiny. IEEE Access 2021, 9, 124963–124971. [Google Scholar] [CrossRef]
- Malta, A.; Mendes, M.; Farinha, T. Augmented reality maintenance assistant using yolov5. Appl. Sci. 2021, 11, 4758. [Google Scholar] [CrossRef]
- Dharneeshkar, J.; Aniruthan, S.; Karthika, R.; Parameswaran, L. Deep Learning based Detection of potholes in Indian roads using YOLO. In Proceedings of the 2020 International Conference on Inventive Computation Technologies (ICICT), Coimbatore, India, 26–28 February 2020; pp. 381–385. [Google Scholar]
- Asad, M.H.; Khaliq, S.; Yousaf, M.H.; Ullah, M.O.; Ahmad, A. Pothole Detection Using Deep Learning: A Real-Time and AI-on-the-Edge Perspective. Adv. Civ. Eng. 2022, 2022. [Google Scholar] [CrossRef]
- He, K.; Zhang, X.; Ren, S.; Sun, J. Spatial pyramid pooling in deep convolutional networks for visual recognition. IEEE Trans. Pattern Anal. Mach. Intell. 2015, 37, 1904–1916. [Google Scholar] [CrossRef] [PubMed]
- Lin, T.-Y.; Dollár, P.; Girshick, R.; He, K.; Hariharan, B.; Belongie, S. Feature pyramid networks for object detection. In Proceedings of the IEEE Conference on Computer Vision and Pattern Recognition, Honolulu, HI, USA, 19 April 2017; pp. 2117–2125. [Google Scholar]
- RAC Foundation. 2019. Available online: https://www.racfoundation.org/media-centre/potholes-does-size-matter (accessed on 18 January 2019).
- Yang, C.H.; Kim, J.G.; Shin, S.P. Road hazard assessment using pothole and traffic data in South Korea. J. Adv. Transp. 2021, 2021, 1–10. [Google Scholar] [CrossRef]
- Kortmann, F.; Fassmeyer, P.; Funk, B.; Drews, P. Watch out, pothole! featuring road damage detection in an end-to-end system for autonomous driving. Data Knowl. Eng. 2022, 142, 102091. [Google Scholar] [CrossRef]
- Kaggle, Pothole Detection. Available online: https://www.kaggle.com/datasets/andremvd/pothole-detection (accessed on 8 June 2020).
- Alhussan, A.A.; Khafaga, D.S.; El-Kenawy, E.-S.M.; Ibrahim, A.; Eid, M.M.; Abdelhamid, A.A. Pothole and Plain Road Classification Using Adaptive Mutation Dipper Throated Optimization and Transfer Learning for Self Driving Cars. IEEE Access 2022, 10, 84188–84211. [Google Scholar] [CrossRef]
- Liu, W.; Anguelov, D.; Erhan, D.; Szegedy, C.; Reed, S.; Fu, C.-Y.; Berg, A.C. Ssd: Single shot multibox detector. In Proceedings of the European Conference on Computer Vision, Amsterdam, The Netherlands, 11–14 October 2016; pp. 21–37. [Google Scholar]
- Li, J.; Liang, X.; Shen, S.; Xu, T.; Feng, J.; Yan, S. Scale-aware fast R-CNN for pedestrian detection. IEEE Trans. Multimed. 2017, 20, 985–996. [Google Scholar] [CrossRef]
- Lin, T.-Y.; Maire, M.; Belongie, S.; Hays, J.; Perona, P.; Ramanan, D.; Dollár, P.; Zitnick, C.L. Microsoft coco: Common objects in context. In Proceedings of the European Conference on Computer Vision, Zurich, Switzerland, 6–12 September 2014; pp. 740–755. [Google Scholar]
- Wang, C.-Y.; Liao, H.-Y.M.; Wu, Y.-H.; Chen, P.-Y.; Hsieh, J.-W.; Yeh, I.-H. CSPNet: A new backbone that can enhance learning capability of CNN. In Proceedings of the IEEE/CVF Conference on Computer Vision and Pattern Recognition Workshops, Seattle, WA, USA, 14–19 June 2020; pp. 390–391. [Google Scholar]
- Arthur, D.; Vassilvitskii, S. k-Means++: The Advantages of Careful Seeding; Stanford University: Stanford, CA, USA, 2006. [Google Scholar]
- Rezaei, M.; Terauchi, M.; Klette, R. Robust vehicle detection and distance estimation under challenging lighting conditions. IEEE Trans. Intell. Transp. Syst. 2015, 16, 2723–2743. [Google Scholar] [CrossRef]
- Minca, C. The determination and analysis of tire contact surface geometric parameters. Rev. Air Force Acad. 2015, 1, 149. [Google Scholar]


| References & Year | Contribution | Model | CPU | GPU | FPS | mAP(IoU@0.5) |
|---|---|---|---|---|---|---|
| Ukhwah et al. [21], 2019 | Detection of potholes and area estimation | YOLOv3 YOLOv3 tiny YOLOv3 SPP | Intel ® Xeon (R) CPU@2.30GHz | Tesla T4 (13 GB) | 0.4 | 83.43% 79.33% 88.93% |
| Park et al. [25], 2021 | Comparison with various YOLO models | YOLOv4 YOLOv4 tiny YOLOv5s | Tesla K80 (12 GB) | 77.7% 78.7% 74.8% | ||
| Asad et al. [30], 2022 | Detection of pothole using Raspberry Pi 4 | YOLOv2 YOLOv3 YOLOv4 YOLOv4 tiny YOLOv5 | ARM Cortex-A53@1.4GHz | 3.20 2.39 1.98 31.76 18.25 | 81.21% 83.60% 85.48% 80.04% 95.00% | |
| Bucko et al. [2], 2022 | Detection potholes under adverse weather condition | Sparse R-CNN YOLOv3 YOLOv3-SPP | 28.57 27.78 | 72.6% 77.1% 79.1% | ||
| Dharnesshkar et al. [29], 2020 | Detection potholes of the India road | YOLOv2 YOLOv3 YOLOv3 tiny | GeForce GTX 1060 | 45.33% 38.41% 49.71% |
| Property | Degree of Risk | LTTP (USA) | HPAS (China) |
|---|---|---|---|
| Depth | Low | Below 25 mm | |
| Moderate | Between 25 and 50 mm | ||
| High | Greater than 50 mm | ||
| Area | Low | Below 0.1 m2 | |
| High | Greater than 0.1 m2 |
| Prediction | Predicted as Positive | Predicted as Negative | |
|---|---|---|---|
| Actual | |||
| Positive | True Positive (TP) | False Negative (FN) | |
| Negative | False Positive (FP) | True Negative (TN) | |
| Environment | Model Version |
|---|---|
| CPU | Intel(R) Xeon(R) CPU @ 2.30 GHZ |
| GPU | Tesla K80 (12 GB) |
| IDE | Google Colab Pro |
| CUDA | 10.1 |
| Tensorflow | 2.2.1 |
| Python | 3.8 |
| Model | mAP(IoU@0.5) | Training Hours |
|---|---|---|
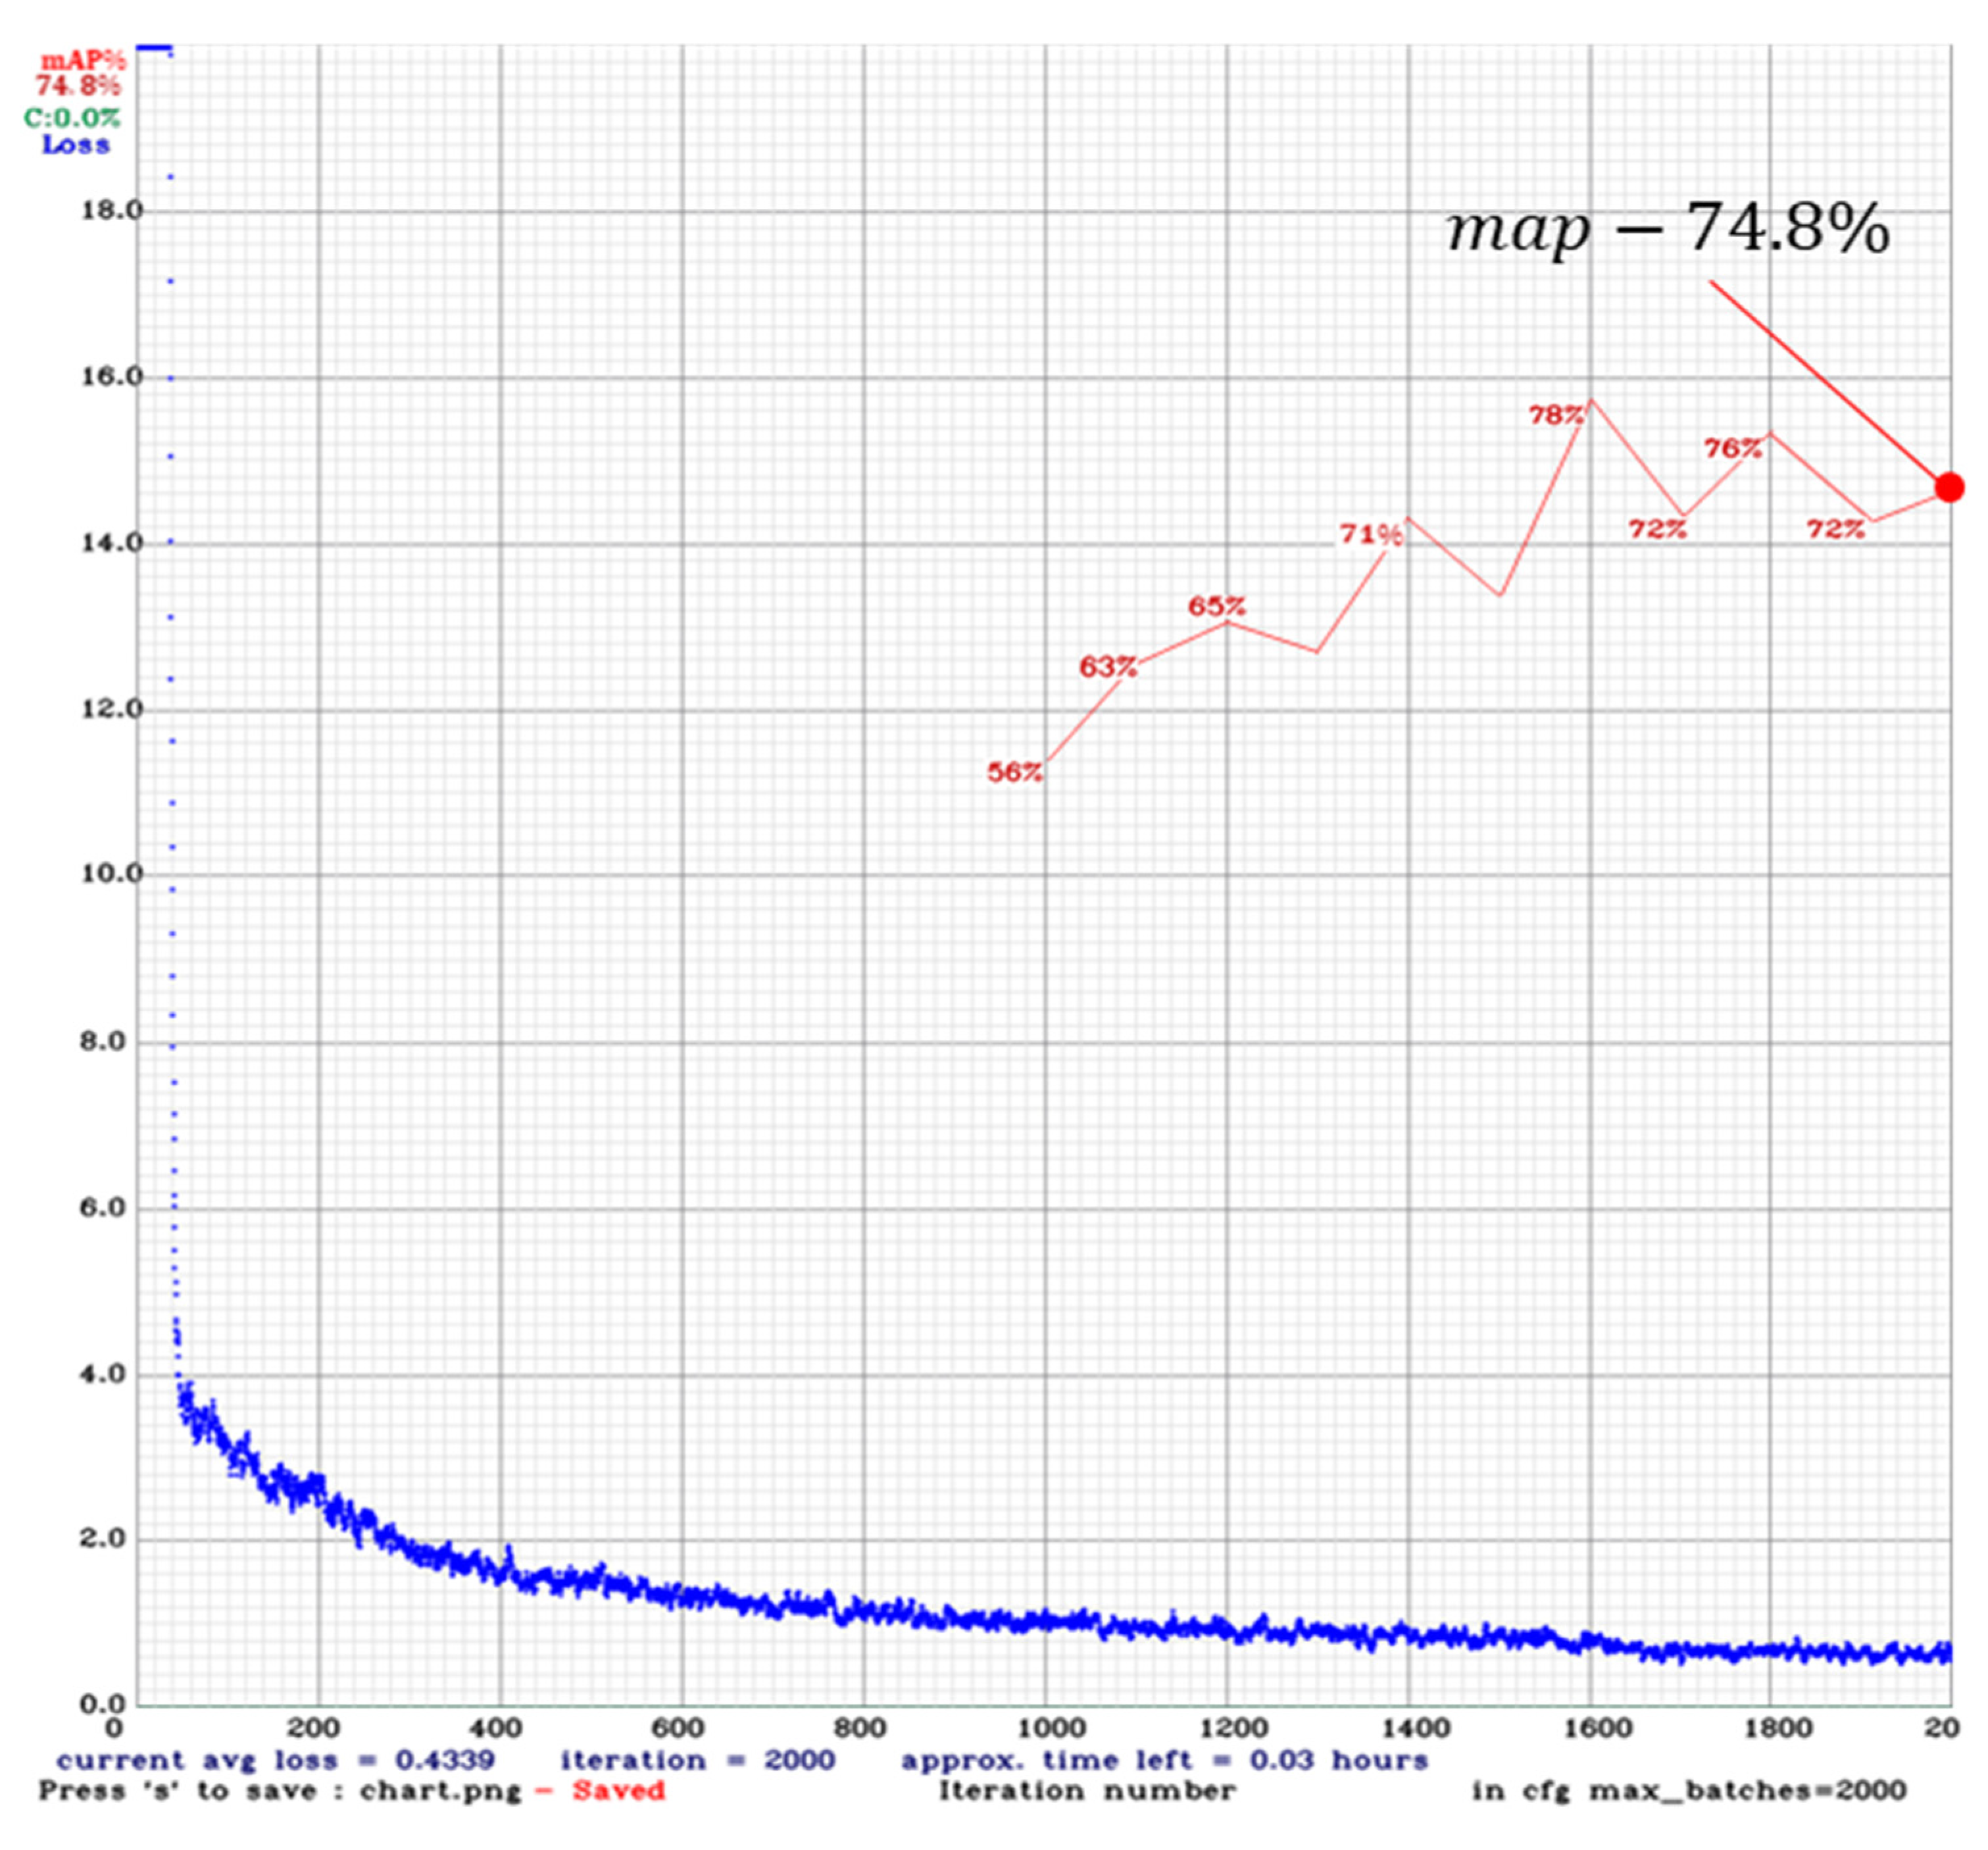
| YOLOv2 | 74.8% | 8.8 |
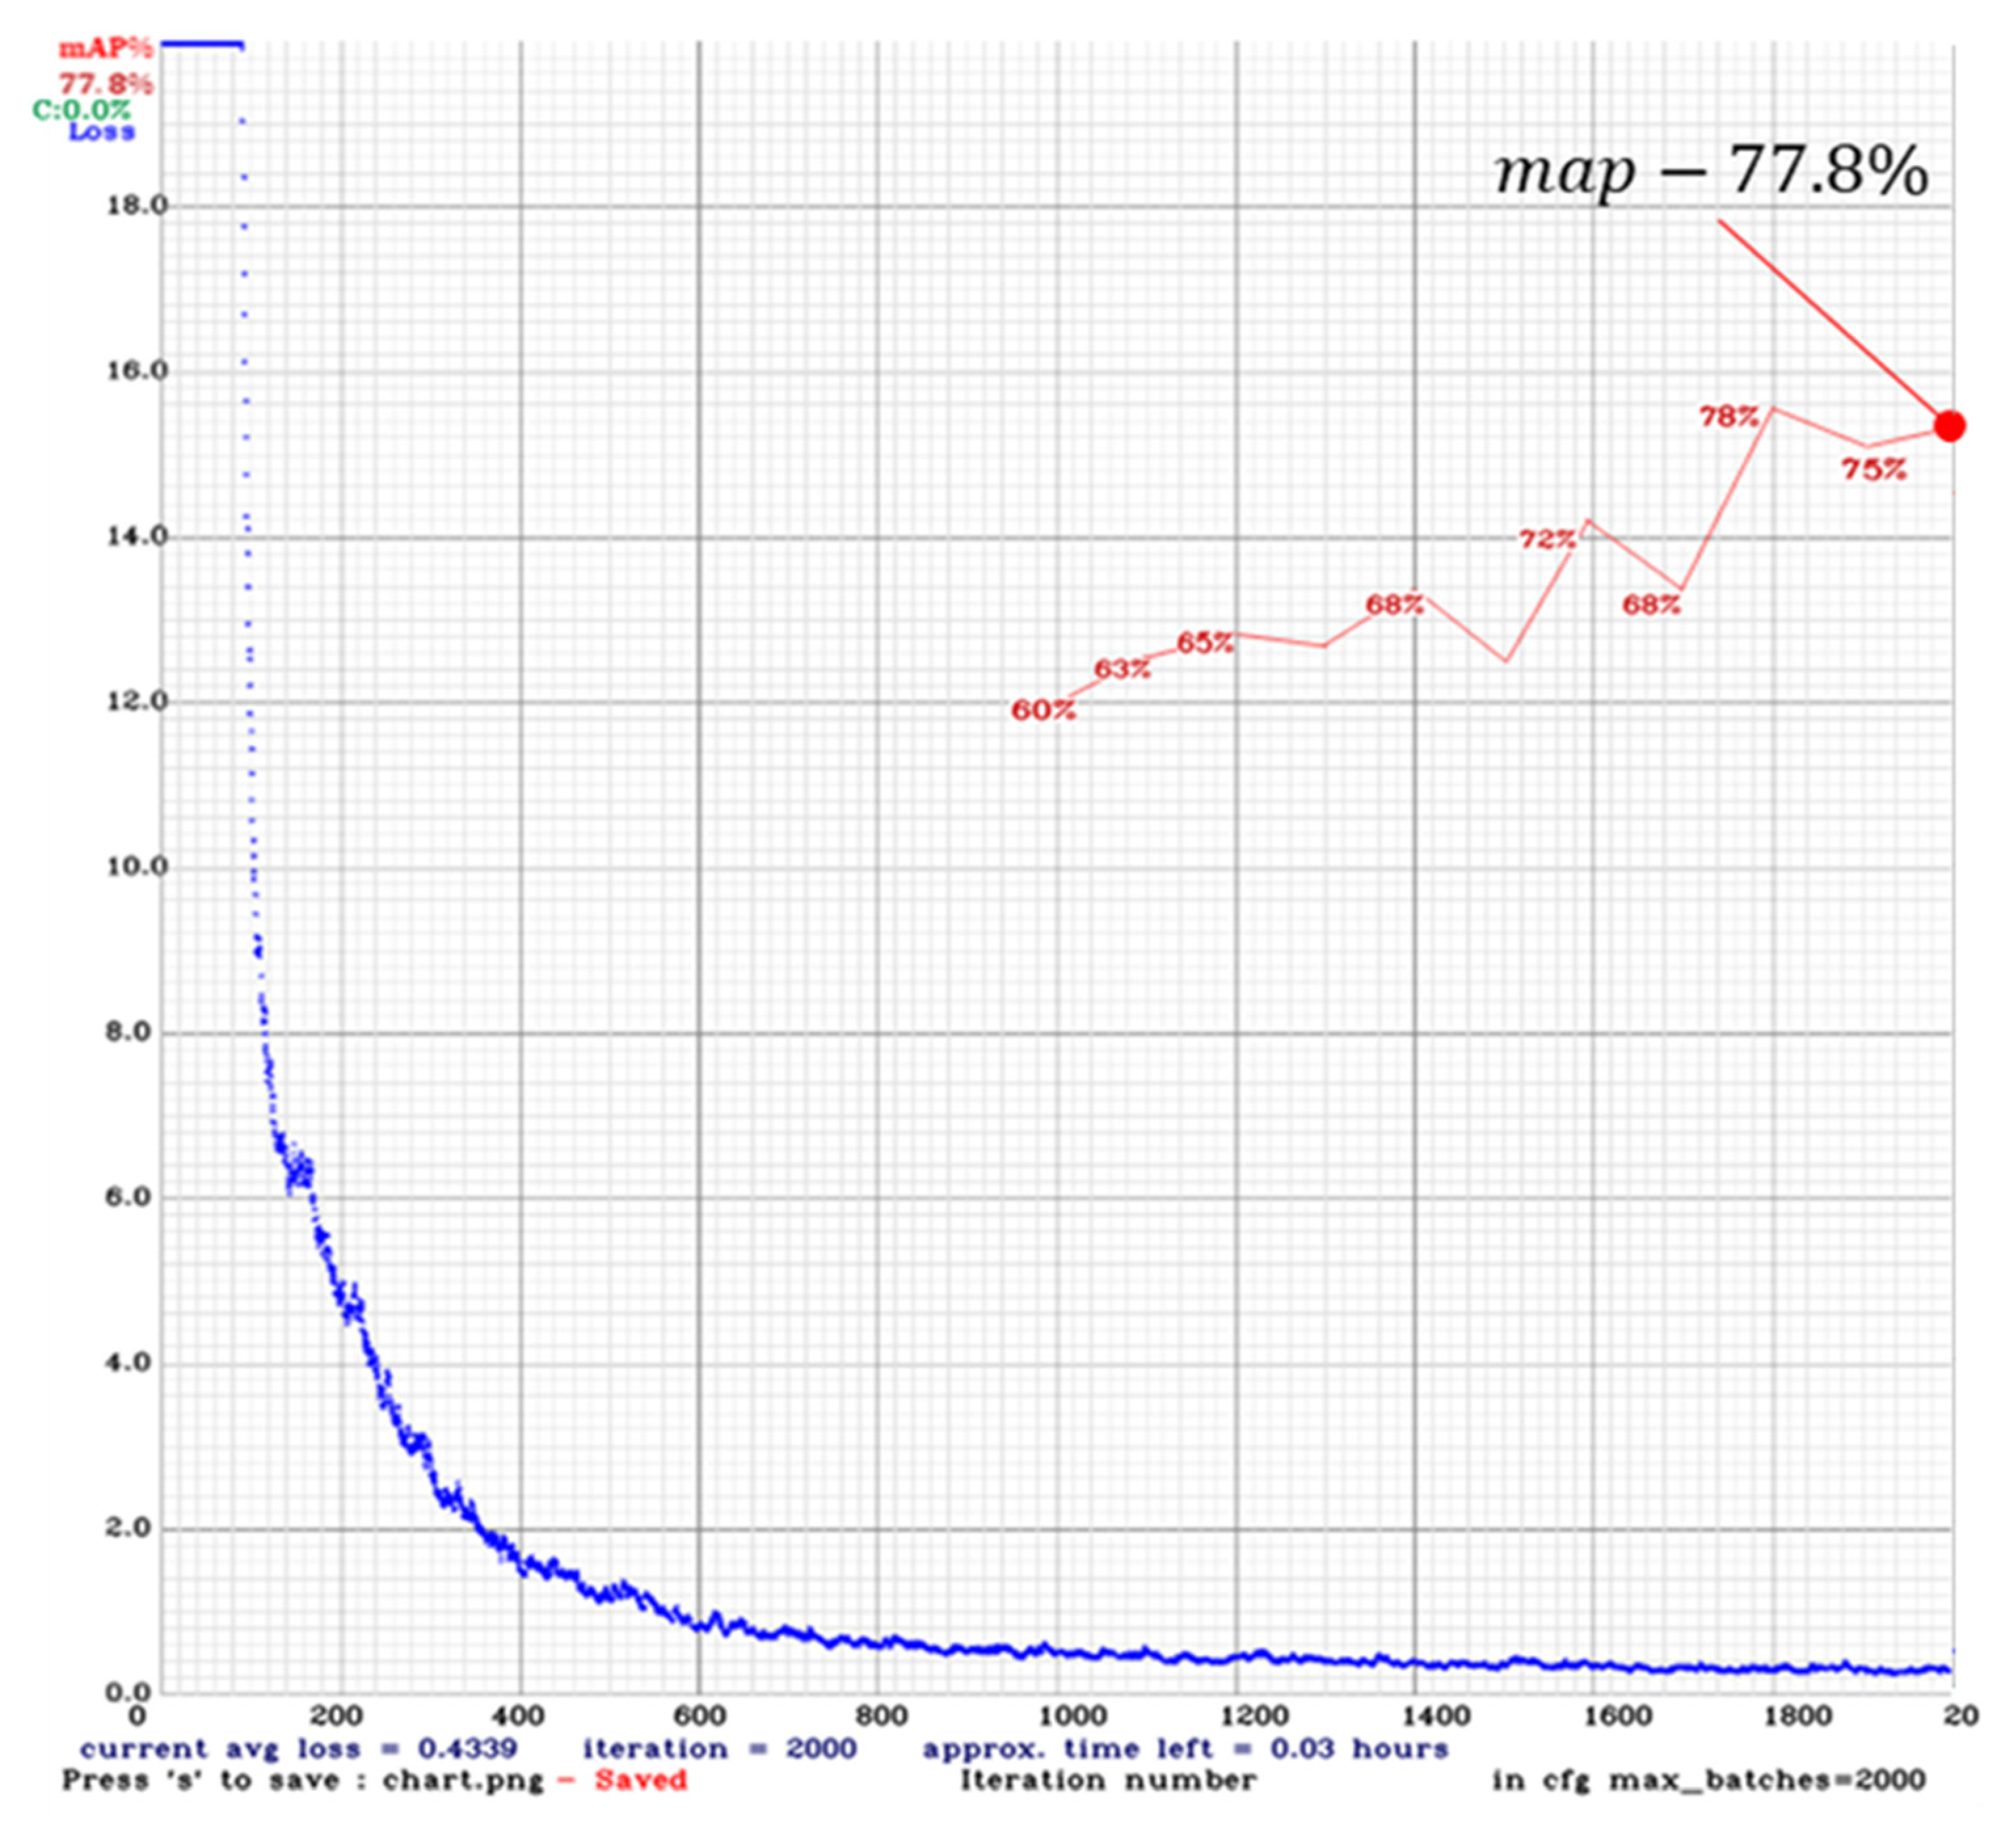
| YOLOv3 | 77.8% | 9.4 |
| YOLOv4 tiny | 72.7% | 4.2 |
| SPFPN-YOLO v4 tiny | 79.6% | 5.8 |
| Model | Precision | Recall | F1-Score | FPS |
|---|---|---|---|---|
| YOLOv2 | 83% | 74% | 78.2% | 26 |
| YOLOv3 | 88% | 72% | 79.2% | 28 |
| YOLOv4 tiny | 74% | 76% | 72.5% | 56 |
| Proposed SPFPN YOLOv4 tiny | 89% | 84% | 86.4% | 38 |
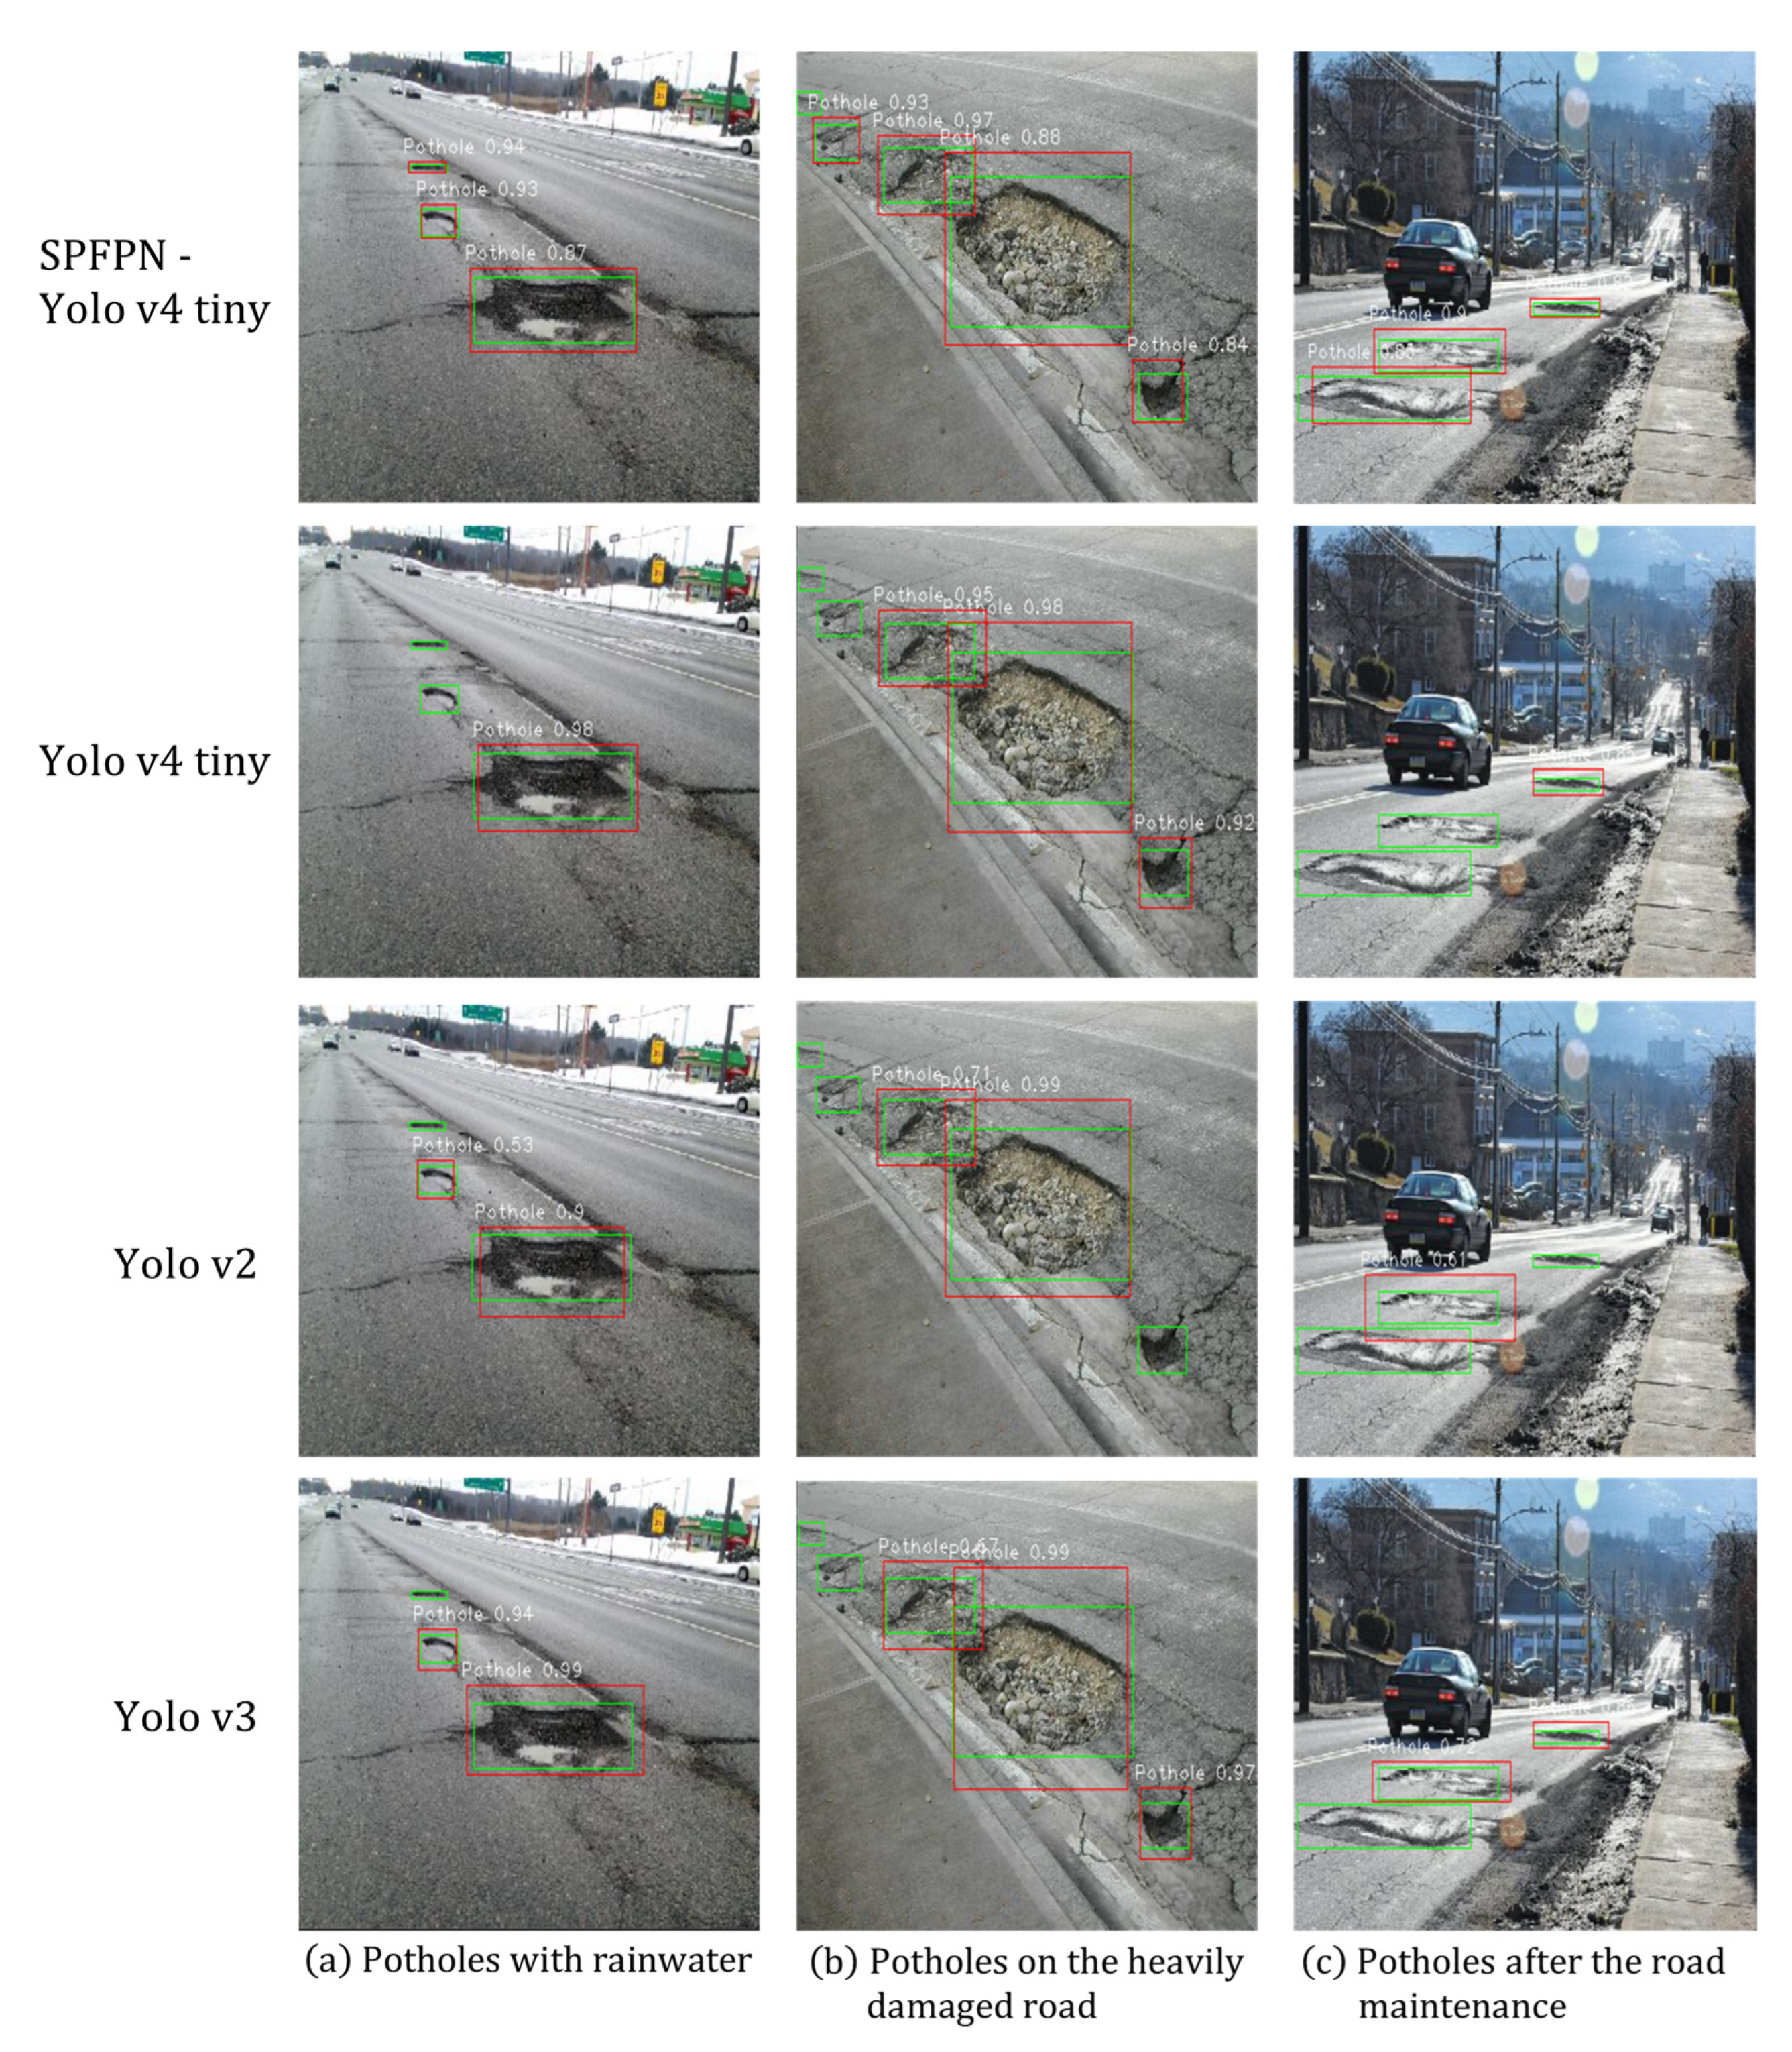
| Picture | Model | No. of Potholes | Detected Potholes | Accuracy(%) | IoU |
|---|---|---|---|---|---|
| (a) | YOLOv2 | 3 | 2 | 66 | 0.54 |
| YOLOv3 | 2 | 66 | 0.52 | ||
| YOLOv4 tiny | 1 | 33 | 0.61 | ||
| Proposed SPFPN-YOLOv4 tiny | 3 | 100 | 0.63 | ||
| (b) | YOLOv2 | 5 | 2 | 40 | 0.48 |
| YOLOv3 | 3 | 60 | 0.44 | ||
| YOLOv4 tiny | 3 | 60 | 0.47 | ||
| Proposed SPFPN-YOLOv4 tiny | 4 | 80 | 0.53 | ||
| (c) | YOLOv2 | 3 | 1 | 33 | 0.45 |
| YOLOv3 | 2 | 66 | 0.63 | ||
| YOLOv4 tiny | 1 | 33 | 0.52 | ||
| Proposed SPFPN-YOLOv4 tiny | 3 | 100 | 0.58 |
Disclaimer/Publisher’s Note: The statements, opinions and data contained in all publications are solely those of the individual author(s) and contributor(s) and not of MDPI and/or the editor(s). MDPI and/or the editor(s) disclaim responsibility for any injury to people or property resulting from any ideas, methods, instructions or products referred to in the content. |
© 2023 by the authors. Licensee MDPI, Basel, Switzerland. This article is an open access article distributed under the terms and conditions of the Creative Commons Attribution (CC BY) license (https://creativecommons.org/licenses/by/4.0/).
Share and Cite
Heo, D.-H.; Choi, J.-Y.; Kim, S.-B.; Tak, T.-O.; Zhang, S.-P. Image-Based Pothole Detection Using Multi-Scale Feature Network and Risk Assessment. Electronics 2023, 12, 826. https://doi.org/10.3390/electronics12040826
Heo D-H, Choi J-Y, Kim S-B, Tak T-O, Zhang S-P. Image-Based Pothole Detection Using Multi-Scale Feature Network and Risk Assessment. Electronics. 2023; 12(4):826. https://doi.org/10.3390/electronics12040826
Chicago/Turabian StyleHeo, Dong-Hoe, Ji-Yoon Choi, Sang-Baeg Kim, Tae-Oh Tak, and Sheng-Peng Zhang. 2023. "Image-Based Pothole Detection Using Multi-Scale Feature Network and Risk Assessment" Electronics 12, no. 4: 826. https://doi.org/10.3390/electronics12040826
APA StyleHeo, D.-H., Choi, J.-Y., Kim, S.-B., Tak, T.-O., & Zhang, S.-P. (2023). Image-Based Pothole Detection Using Multi-Scale Feature Network and Risk Assessment. Electronics, 12(4), 826. https://doi.org/10.3390/electronics12040826