You are currently viewing a new version of our website. To view the old version click .
Electronics
  • Article
  • Open Access

31 May 2023

Support Vector Machine Chains with a Novel Tournament Voting

,
,
and
1
Graduate School of Natural and Applied Sciences, Dokuz Eylul University, 35390 Izmir, Turkey
2
Department of Computer Engineering, Dokuz Eylul University, 35390 Izmir, Turkey
3
Department of Electrical and Electronics Engineering, Dokuz Eylul University, 35390 Izmir, Turkey
*
Author to whom correspondence should be addressed.
This article belongs to the Special Issue Artificial Intelligence Technologies and Applications

Abstract

Support vector machine (SVM) algorithms have been widely used for classification in many different areas. However, the use of a single SVM classifier is limited by the advantages and disadvantages of the algorithm. This paper proposes a novel method, called support vector machine chains (SVMC), which involves chaining together multiple SVM classifiers in a special structure, such that each learner is constructed by decrementing one feature at each stage. This paper also proposes a new voting mechanism, called tournament voting, in which the outputs of classifiers compete in groups, the common result in each group gradually moves to the next round, and, at the last round, the winning class label is assigned as the final prediction. Experiments were conducted on 14 real-world benchmark datasets. The experimental results showed that SVMC (88.11%) achieved higher accuracy than SVM (86.71%) on average thanks to the feature selection, sampling, and chain structure combined with multiple models. Furthermore, the proposed tournament voting demonstrated higher performance than the standard majority voting in terms of accuracy. The results also showed that the proposed SVMC method outperformed the state-of-the-art methods with a 6.88% improvement in average accuracy.

1. Introduction

Machine learning (ML) involves developing algorithms that are able to emulate human intelligence. In ML, the adaptation of processes such as data preprocessing, feature engineering, algorithm selection, and parameter setting directly affects the performance of the predictive model. It is expected that ML models will be effective even with small-sized datasets gathered from various industries. Labeling data manually, protecting privacy, and processing imbalanced, insufficient, high-dimensional, incomplete, or noisy datasets are difficulties associated with machine learning. For this reason, research studies seeking to develop effective ML models and increase their performance are currently ongoing.
Support vector machine (SVM) is one of the most popular ML methods due to its impressive characteristics, including high generalization ability, efficiency in high dimensions, and easy implementation []. SVM is a supervised machine learning technique that usually performs well in many different areas, such as health [,] psychology [] neuroscience [], marketing [], biometry [], robotics [], food [], the environment [,], and agriculture [].
Although SVM is effective in many situations, it has some shortcomings that reduce its classification ability. The use of a single model is insufficient when compared to the performance of ensemble models. There are essentially two reasons that ensemble learning (EL) is preferred over a single model: performance and robustness. Parallel or sequential trials increase the performance compared to a single model. Furthermore, the failure of one classifier can be rectified by the successes of other classifiers. In EL, the main focus is on training multiple models and combining the results from these models. Homogeneous ensembles can be created using the same ML algorithm or heterogeneous ensembles using different algorithms. The power of different models can be utilized by applying the SVM method to different subsets of the dataset. Based on this motivation, in this study, we propose a novel ensemble learning approach that uses SVM as a base learner.
Majority voting (MV) is the most frequently used method when combining the results of classifiers in an ensemble. In the classification problem, the class label with the majority vote is the final prediction, while, in the regression problem, the results from the models are averaged. A problem related to majority voting is that it ignores the fact that some learners that lie in the minority may produce more accurate outputs, since it does not explicitly address diversity [].
To overcome these limitations, this paper proposes a novel voting mechanism, called tournament voting, in which the results of classifiers compete in groups at each stage and the process is repeated until one winner remains. It also introduces the support vector machine chains (SVMC) method, which builds a series of learners in a special structure and integrates their outputs via the tournament voting mechanism so as to achieve better prediction performance than a single SVM learner.
The remainder of the article is organized as follows. In Section 2, studies on ensemble learning are explained. Section 3 describes two novel concepts proposed in this paper: SMVC and tournament voting. In Section 4, experimental studies and a discussion of the findings are presented. In addition, in this section, our results are compared with the results of state-of-the-art studies. Finally, Section 5 provides a few final observations and future directions.

3. Proposed Method

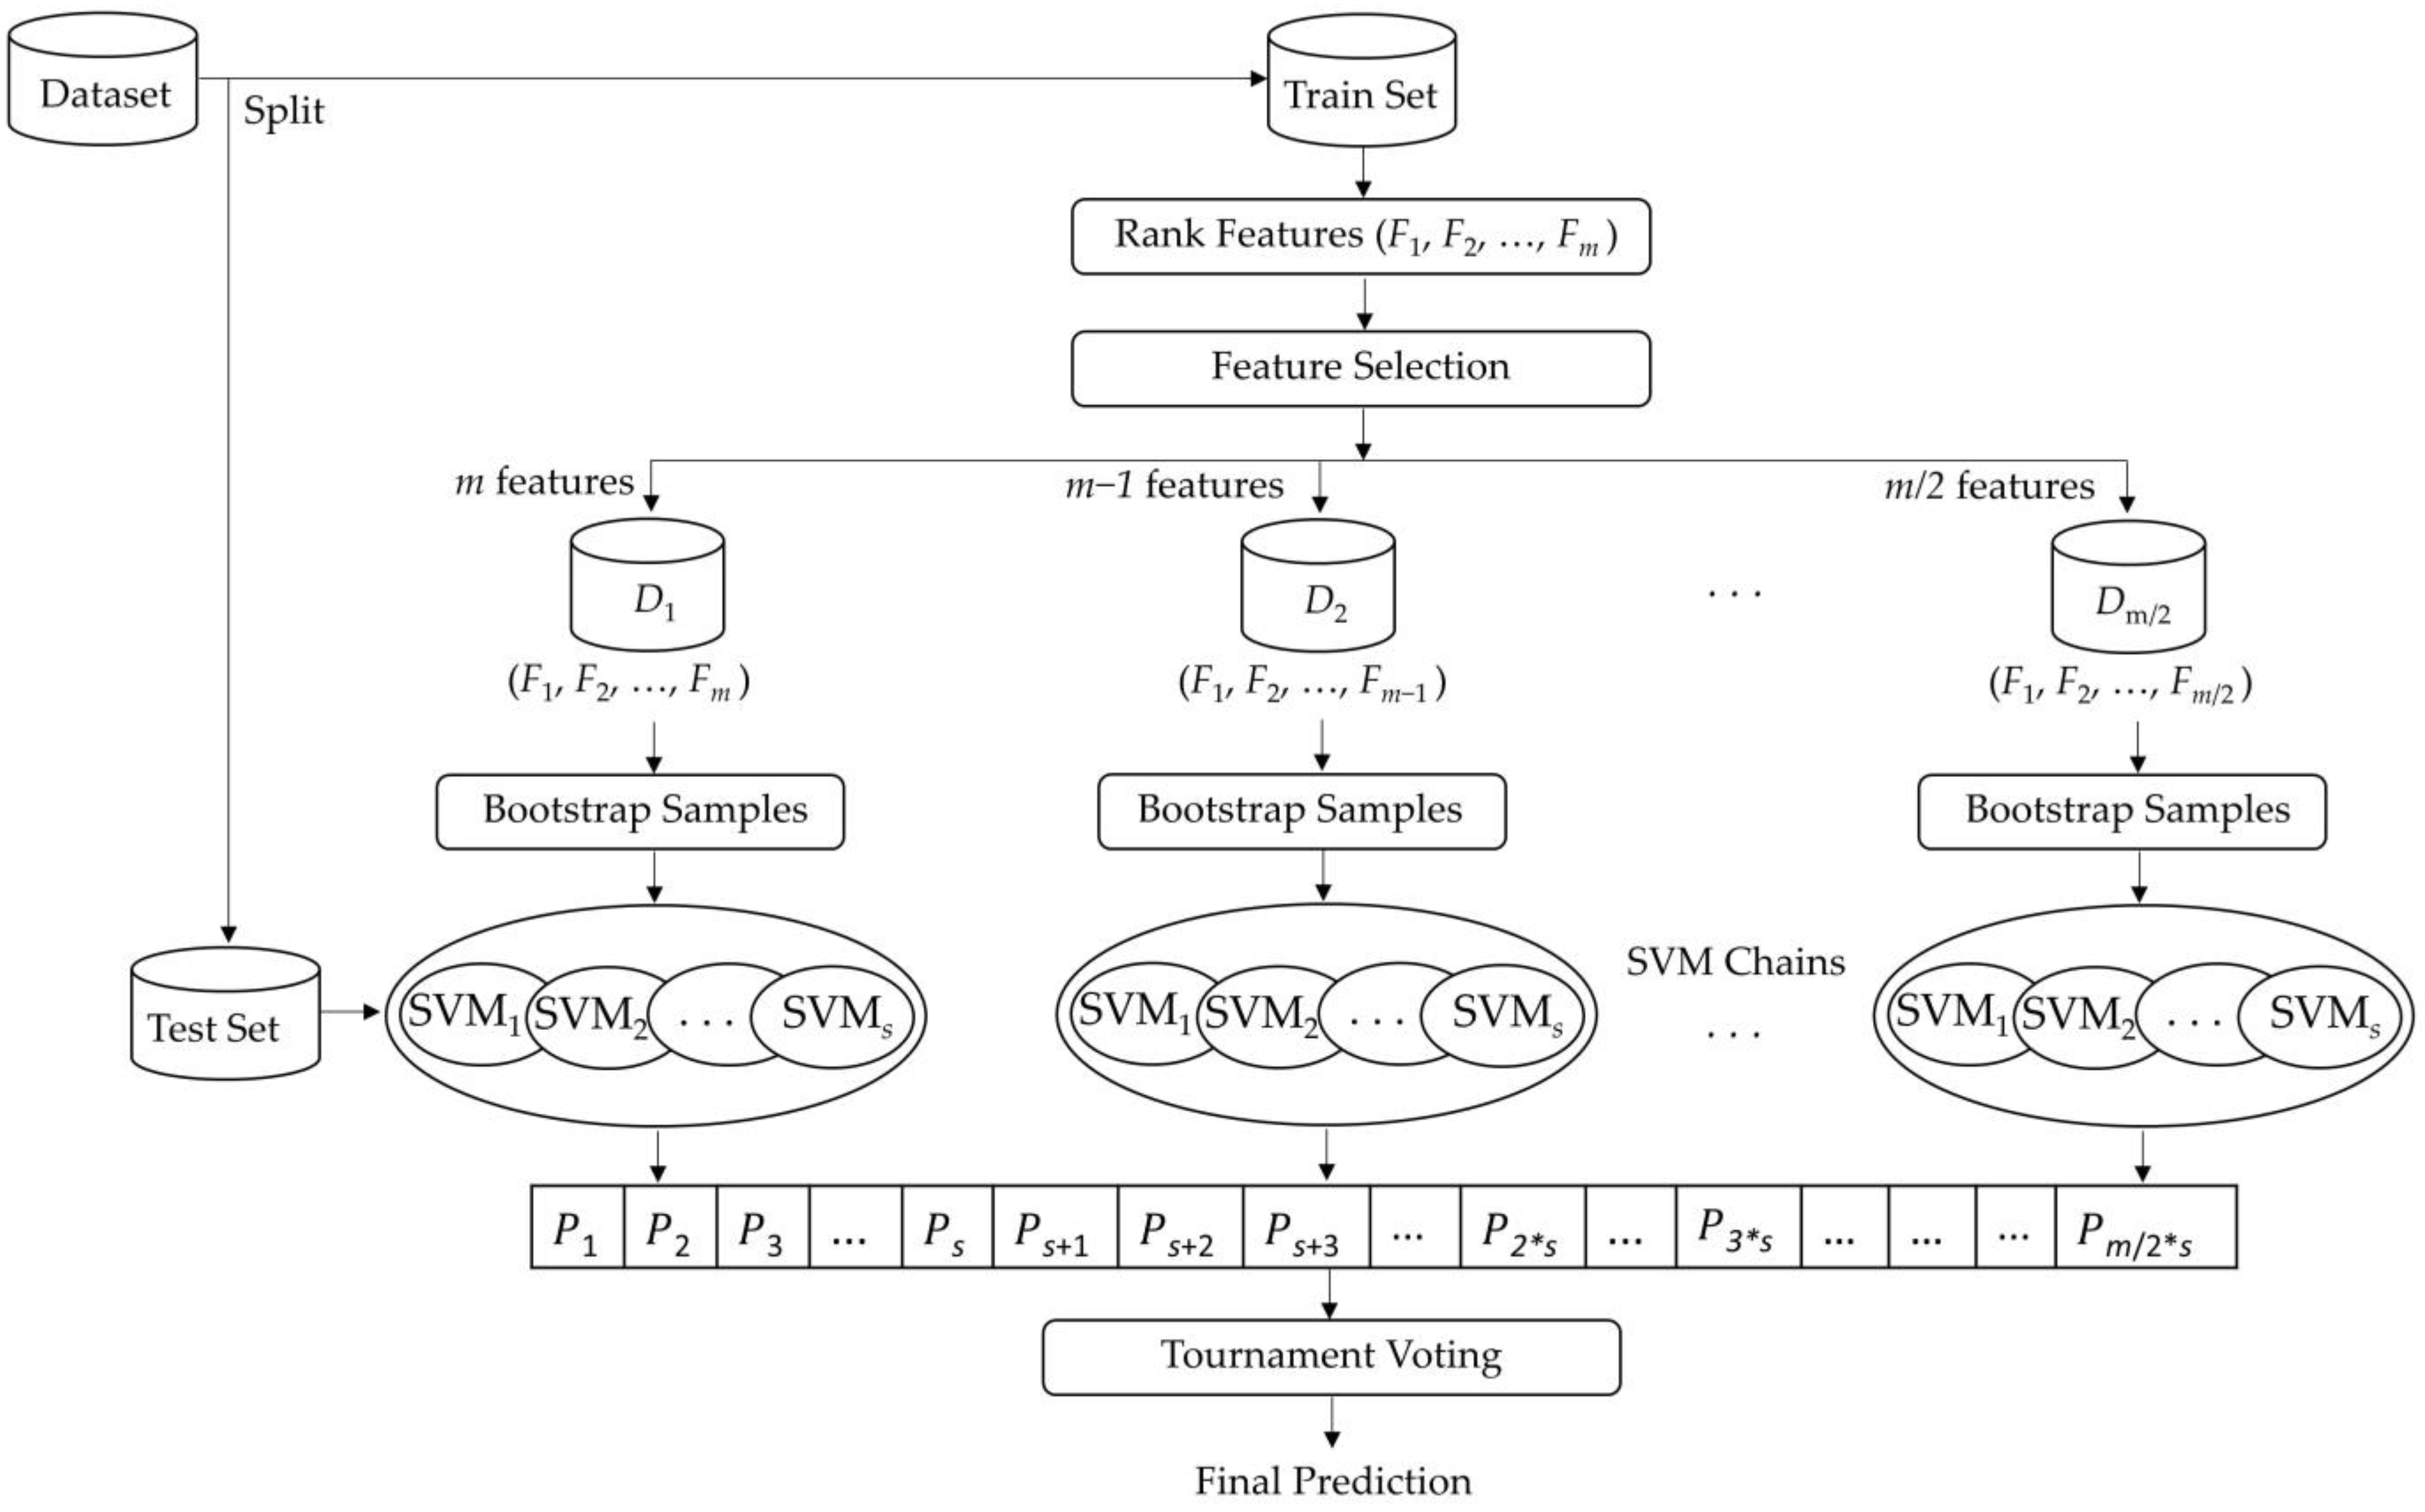
3.1. Support Vector Machine Chains (SVMC)

This paper proposes a novel method, support vector machine chains (SVMC), which has a structure in which a set of models are trained by reducing the attributes at each stage. The predictions of each learner in the chain are aggregated using a novel voting mechanism (tournament voting). The proposed voting mechanism is executed through the division of the results of classifiers by the tournament size, and then a selection approach is used based on the class labels in the groups for further processes; it gradually moves on to the next round, and, at the end of the tournament rounds, the winning class label is assigned as the final prediction.
Figure 1 shows a general overview of the proposed SVMC method. First, the relationships between the features and the target are revealed using mutual information. All features are listed from the most informative to the least. At each stage, the feature with the lowest value is eliminated and the model to be trained with the remaining attributes is added to the chain. In other words, a Mutual Information-Based Feature Elimination method is performed to reduce attributes iteratively. In order to increase the speed and improve the performance in high-dimensional datasets, m features to m/2 features in descending order are evaluated when creating an ensemble. Each classifier is built on a bootstrapped training set. For a given query instance in the test set, each classifier provides a vote to a class. After this, tournament voting is used to combine the results. The results from the models are divided into groups of the desired number and compete among themselves. The label that emerges successfully from each group is grouped again in the next level and this process is repeated until only one finalist remains.
Figure 1. The general overview of the proposed SVMC method.
Majority voting (MV) is a simple and straightforward method for classification problems as it selects the class with the most votes. However, it has some drawbacks. A class label supported by many learners does not necessarily mean that it is the correct answer because the learners’ ability highly determines the quality of the final output. This paper proposes a novel voting mechanism, called tournament voting.
In the proposed tournament voting method, the results of the models compete in groups. The label that moves up from each group is the dominant class label in the group. Labels for all groups are promoted to the next round according to their dominance and continue to be evaluated according to their dominance in the following rounds.
An example of tournament voting is illustrated in Figure 2. In this example, the predicted values coming from the classifiers are gradually evaluated in groups of three. There are three class labels: “0”, “1”, and “2”. The dominant class label in each group is determined as the winner. For example, the winner of the first group [1 0 0] in the first round is determined as label “0” and fed to the next round to compete again with the results of other groups. In the figure, the winners of groups are shown below the round. In the first round, there are 9 groups, and the winners of these groups are [0 0 1 2 0 2 0 1 0], respectively. These winners compete once again in the second round. The winner of a group is the class label that achieves the highest number of votes from each classifier in the group. Therefore, the winners of the groups in the second round are “0”, “2”, and “0”, respectively. This voting continues until a single result is achieved. In the last round, the class label “0” is handled as the final prediction.
Figure 2. An example illustrating tournament voting.
Suppose that we run the same example with majority voting. The label “0” has 10 votes, the label “1” has 10 votes, and the label “2” has 7 votes. In such equality situations, majority voting will assign the first label that it sees as the final label and return the label “1” as a result. As can be seen, the result of majority voting is different from the result obtained by tournament voting.

3.2. Formal Description

Suppose a dataset D with n instances such that D = { ( x i , y i ) } i = 1 n , where x i     X denotes the input vector, y i   Y = { c 1 , c 2 ,   ,   c r } is the class label associated with instance x i , and r is the number of class labels. Let F = { f 1 ,   f 2 ,   ,   f m } be the set of features; each instance is a point in the m-dimensional feature space. The importance score of each feature F is calculated by the mutual information measure.
Mutual Information-Based Feature Elimination is an effective approach that selects a subset of features S that shares the highest MI with Y , i.e., max   S F I ( S   ; Y ) . Mutual information (MI) is a measure used to rank and evaluate the features of data with respect to their relevance to the target class variable. The information (I) between two variables X and Y is defined as the extent to which knowing Y reduces the uncertainty about X, as given in Equation (1).
I ( X   ;   Y ) = H ( X ) H ( X   |   Y )
where I ( X   ;   Y ) is the mutual information for the variables X and Y, H ( X ) is the entropy for X, and H ( X   |   Y ) is the conditional entropy for X given Y. MI is always greater than or equal to zero, I ( X   ;   Y ) 0 , with a higher value indicating a stronger link between these two variables. If the computed result is zero, the variables are considered independent. The measure is symmetrical, i.e.,   I ( X   ;   Y ) = I ( Y   ;   X ) . A conventional choice of entropy is Shannon entropy with the logarithmic information gain with a probability mass function (p), as given in Equation (2).
I ( X   ;   Y ) = x X y Y p ( x , y ) l o g 2 p ( x , y ) p ( x ) p ( y )
After the ranking process, features are arranged from the highest to the lowest based on the amount of discriminative information that they carry, i.e., they are ranked as follows: ( F 1 ,   F 2 , ,   F m ) . Afterward, the algorithm generates a collection of datasets { D 1 ,   D 2 , ,   D m / 2 } from the original data such that the first one ( D 1 ) is composed of instances with m features ( F 1 ,   F 2 , ,   F m ) , the second one ( D 2 ) includes instances with m-1 features ( F 1 ,   F 2 , ,   F m 1 ) , and so on, until the final dataset ( D m / 2 ) involves instances with m/2 features ( F 1 ,   F 2 , ,   F m / 2 ) . The main idea behind this approach is that higher classification accuracy can be achieved with features of higher importance. After this, a collection of training sets is created from D i   with the bootstrap resampling technique and each one is used to train an individual SVM learner L i . In this way, an ensemble is created of s classifiers such that { S V M 1 ,   S V M 2 ,   ,   S V M s } . The same process is repeated m/2 times with each dataset D i , i = 1 , 2 , , m / 2 , to build SVM chains.
Definition 1. 
SVM chains are a collection of SVM models that have been trained on bootstrap samples drawn from the datasets, which are generated by removing one feature in each iteration based on the mutual information values.
Given a new data tuple to classify, each classifier in the SVM chain independently votes for a specific class, and, therefore, a set of predictions ( P 1 ,   P 2 , ,   P m / 2 s )   is obtained. Afterward, a novel voting mechanism, called tournament voting, is used to combine the predictions and determine the final output.
Definition 2. 
Tournament voting is a meta-algorithm that divides the predictions of classifiers into groups, which compete among themselves, by identifying the class with the highest number of votes in the groups, and the winners proceed to the next round until only one finalist remains.
Algorithm 1 presents the pseudocode of the proposed SVMC approach. In the first loop, mutual information values are calculated for each attribute f i , where i = 1 , 2 , , m . According to the MI values, attributes are arranged in decreasing order such that ( F 1 ,   F 2 ,   ,   F m ) . In the outer loop, the algorithm generates a dataset D i from the original data   D = { ( x i , y i ) } i = 1 n by removing the feature with the lowest MI value in each iteration. In the inner loop, a collection of training sets is created from D i with the bootstrap resampling technique and each one is used to train an individual SVM learner L i j . Here, an ensemble is created of s learners. When the same process is repeated m / 2 times, a total of m / 2 s learners are trained to build SVM chains. For each tuple x in the test set T , a prediction is made by each classifier in the SVM chain separately, and, therefore, a set of predictions ( P 1 ,   P 2 , ,   P m / 2 s ) is obtained. Finally, the tournament voting method is used to combine the predictions and determine the ultimate output. All predicted class labels are stored in a single list, named C.
Algorithm 1: Support Vector Machine Chains (SVMC).
Inputs:
D: dataset D = { ( x i , y i ) } i = 1 n  
m: number of features
s: chain size
T: test set
Outputs:
C: the predicted class labels
Begin
  for  i = 1  to  m
     Calculate mutual information ( M I ) for feature f i
  end for
   ( F 1 ,   F 2 , ,   F m ) = Sort features in descending order according to M I scores
  for  i = 1  to  m / 2
      D i = D with features ( F 1 ,   F 2 , ,   F m i + 1 )
     for  j = 1  to  s
                                D i j = Generate a new set from D i with bootstrapping
                                L i j = SVM( D i j )
     end for
  end for
   P =  
   C =
  foreach x in T
      for  i = 1  to  m / 2
       for  j = 1  to  s  
        P .Add ( L i j ( x ) )
       end for
      end for
       C .Add( T o u r n a m e n t V o t i n g ( P ) )
  end for
End Algorithm
Algorithm 2 presents the pseudocode of the proposed tournament voting method. The predicted class labels in array P = { P i } i = 1 m / 2 s are the input of the algorithm. It gradually splits them into groups with a size of t and the candidates in the groups compete. The recursively structured algorithm continues to process the labels in groups until only one class label c is left. The dominant label (i.e., the most common label or the mode of class labels) advances to the next round as the winner and the competition continues until only one final label c remains.
Algorithm 2: Tournament Voting.
Inputs:
  P: array of predicted class labels
  t: the number of candidates in the group
Output:
  c: final class label
Begin
    if length( P ) = 1
      c = P [0]
      return c
    else
      Divide P into g r o u p s with the size of t
       P =
      for  c a n d i d a t e s in g r o u p s
       w i n n e r = mode ( c a n d i d a t e s )
       P .Add( w i n n e r )
      end for
      return  T o u r n a m e n t V o t i n g ( P )
    endif
End Algorithm
We can summarize the advantages of the SVMC method as follows:
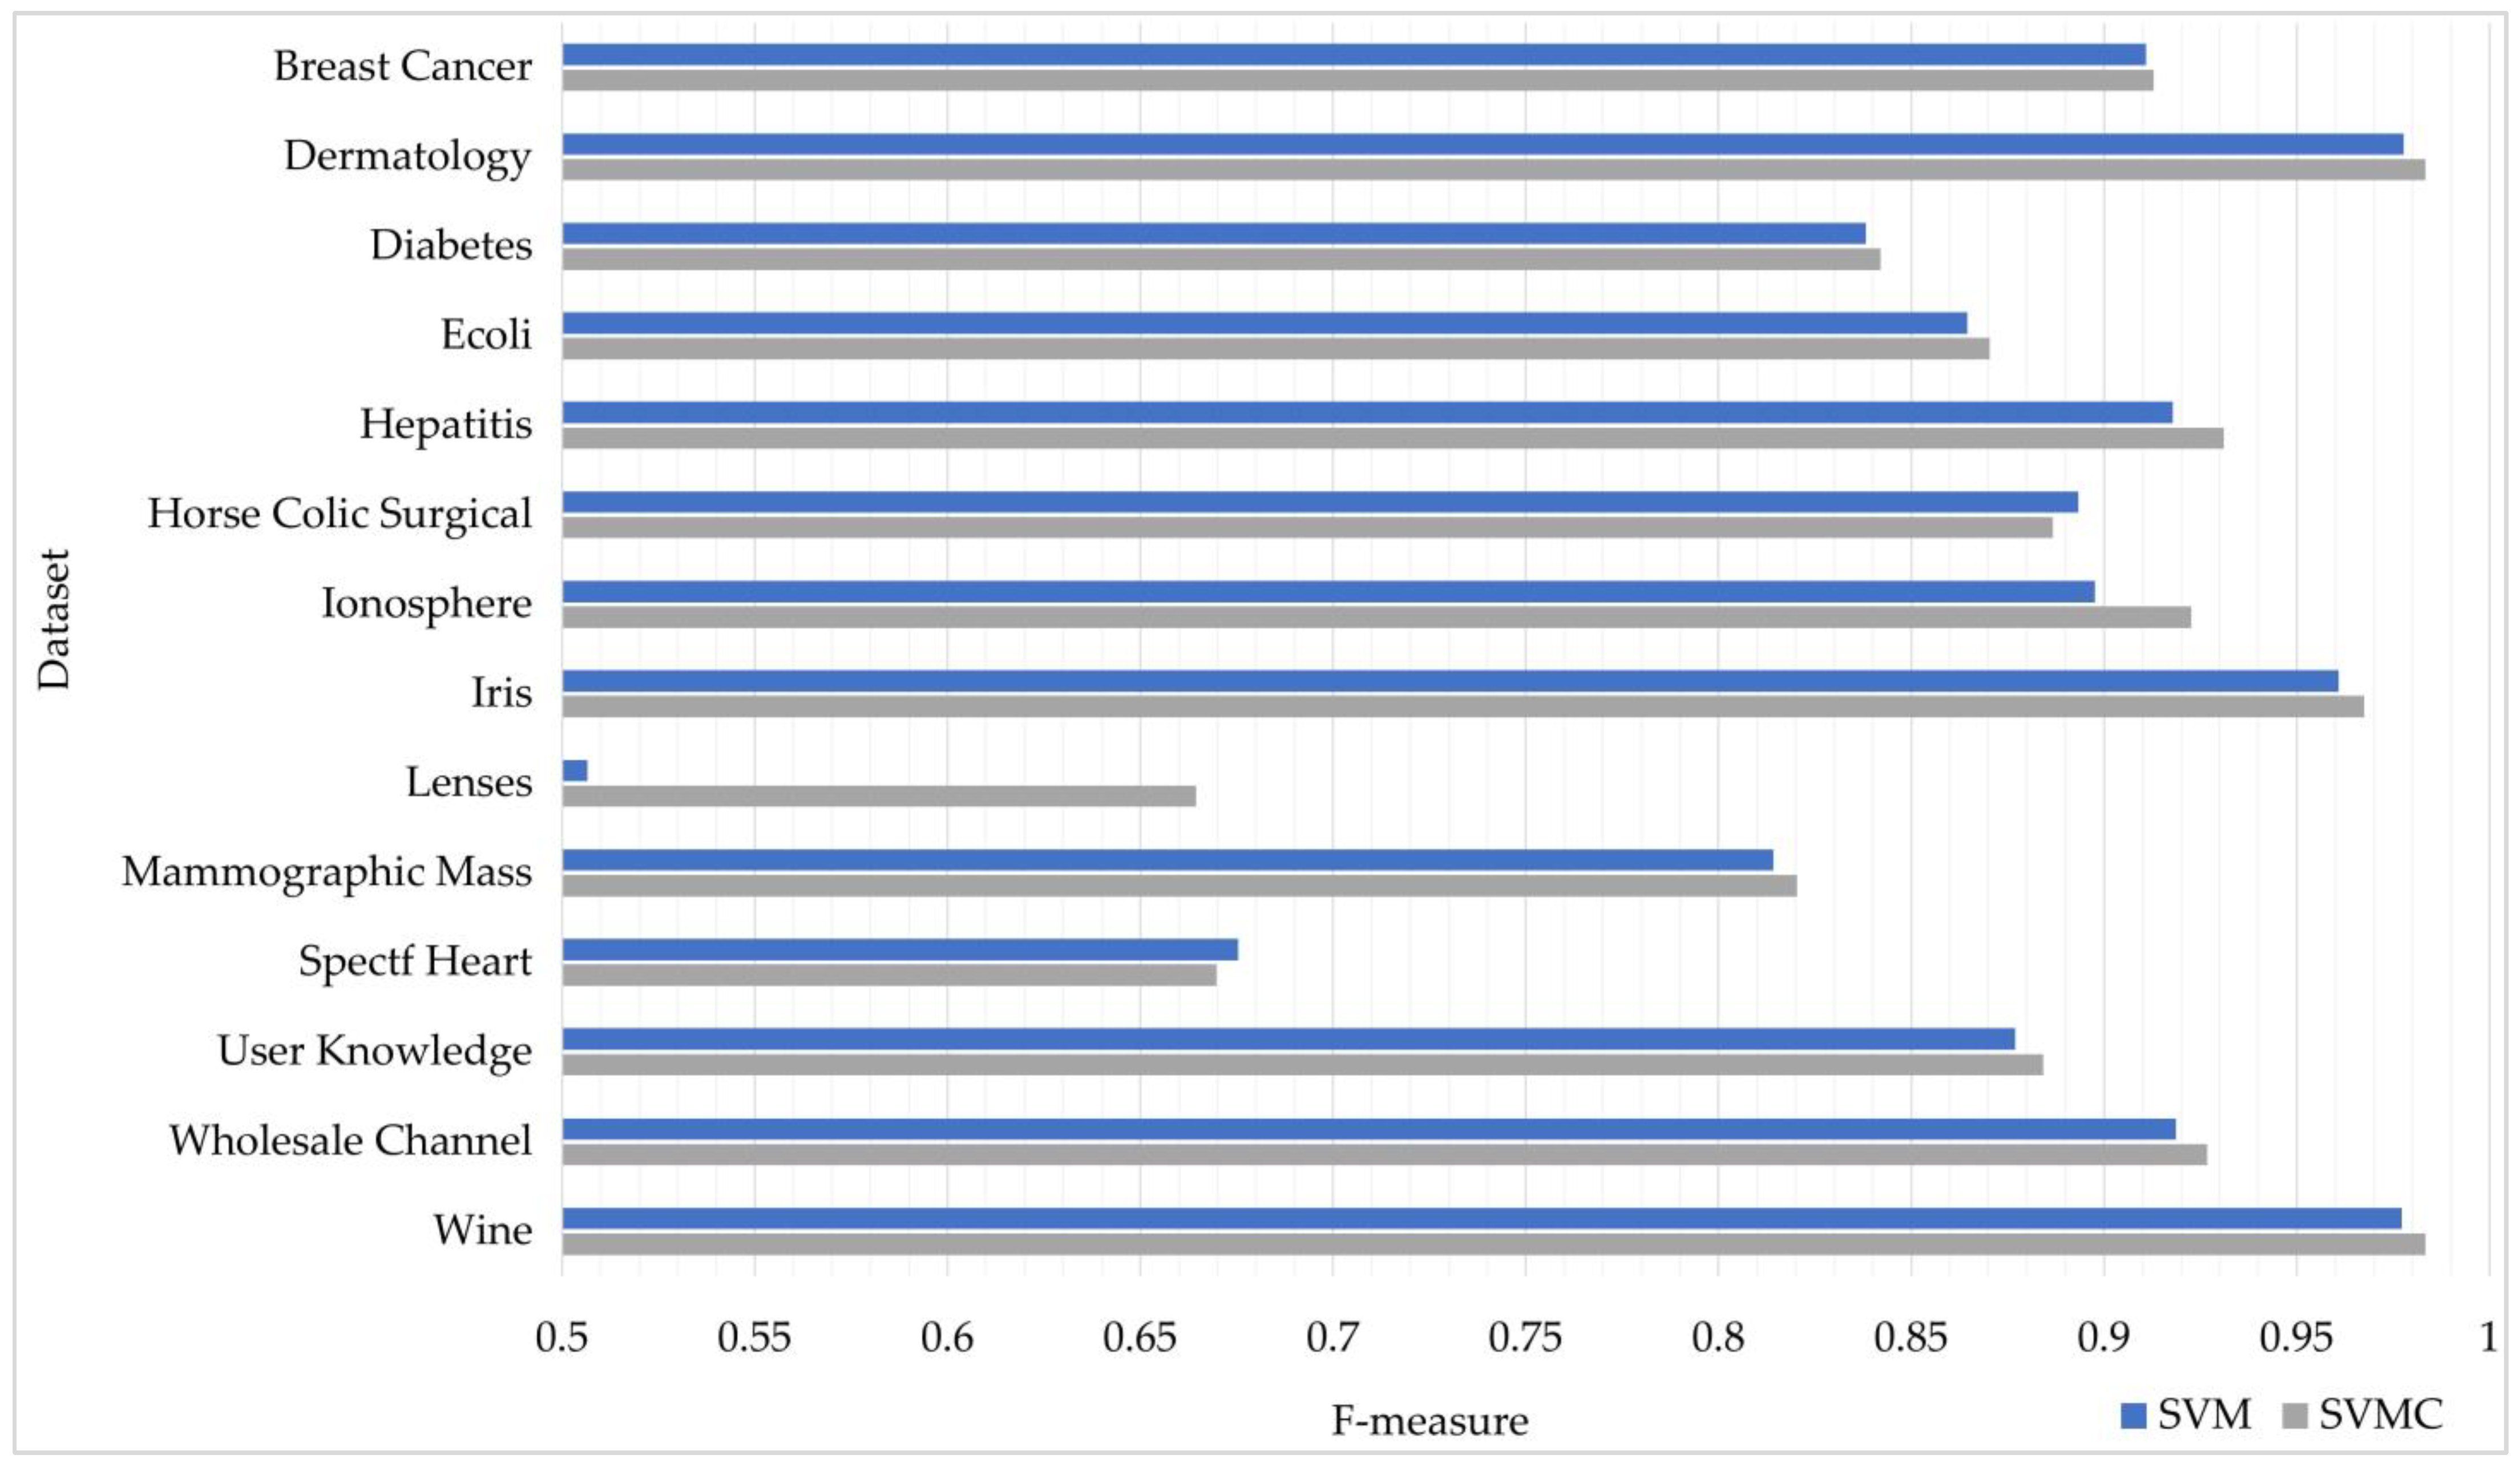
  • Since SVMC is an ensemble-learning-based method, it tends to produce a better success rate than a single SVM model. Although some models make incorrect predictions, other models in the ensemble are predisposed to correct these errors.
  • Most significantly, the rank-based feature elimination strategy in SVMC makes the data less redundant, thus reducing the possibility of decision making based on unimportant and irrelevant features.
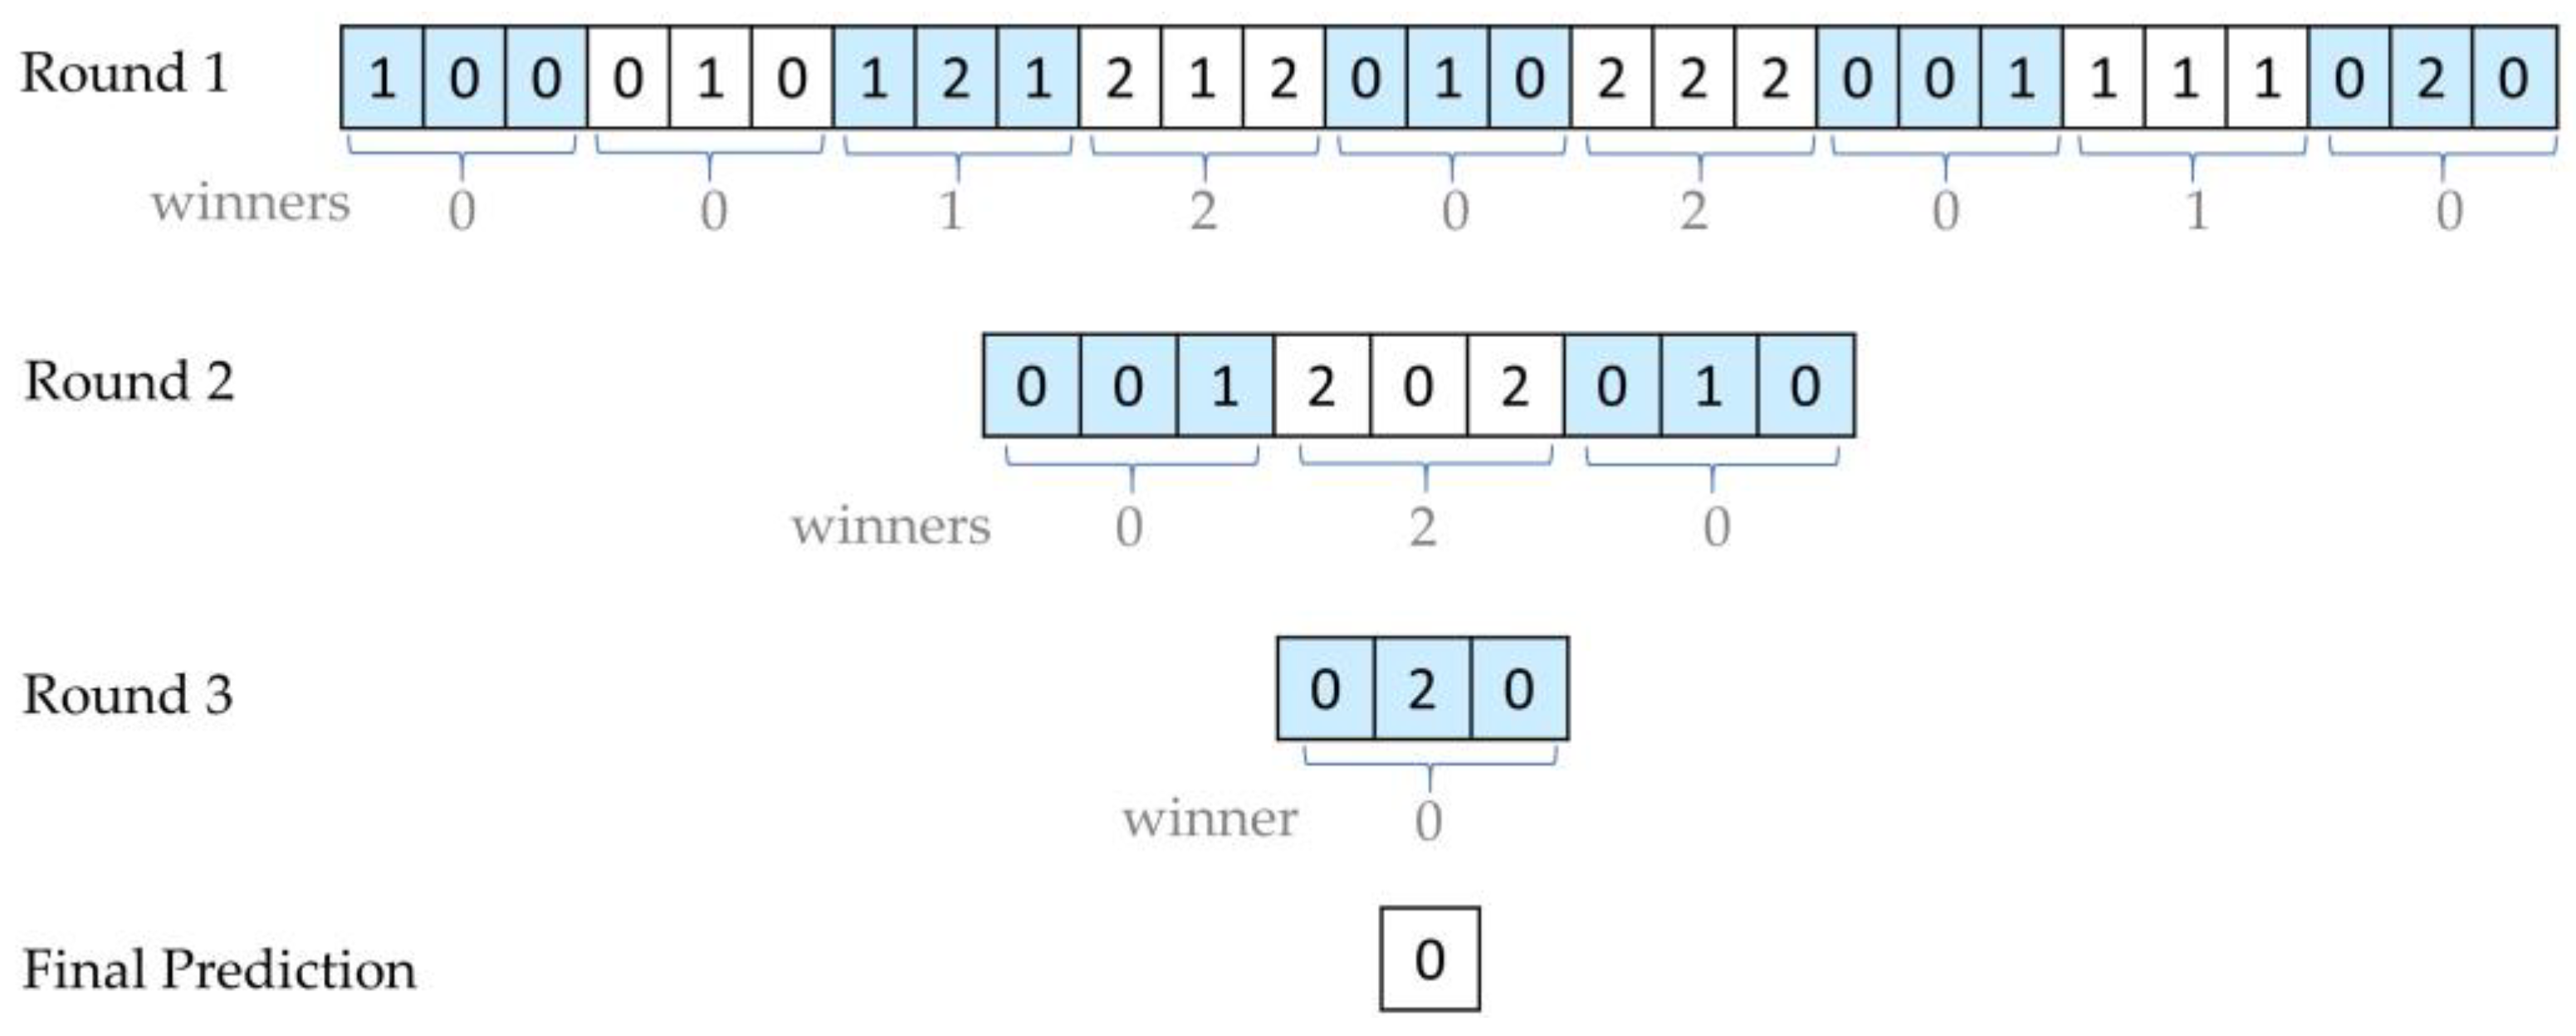
  • The proposed tournament voting aims to achieve correct outcomes by excluding incorrect answers in local groups. It benefits from the strengths of a group of classifiers while overcoming the weaknesses of one classifier in the group.
  • The SVMC handles feature selection, sampling, and model fusion on its own. During the construction of chain classifiers, various subspaces of the dataset are assessed along with sample and feature selection. Therefore, it benefits from the advantages of providing diversity.
  • Many application domains, such as bioinformatics and text mining, usually have many input features, often of several hundreds, where many of them include only a small amount of information. In the analysis of such high-dimensional data, feature selection based on their importance can provide higher accuracy than using all features or choosing features randomly.
  • Another advantage of SVMC is its implementation simplicity. The algorithm is essentially an enhanced ensemble learning algorithm that involves chaining together multiple SVM classifiers in a special structure.
  • If it is required, SVMC can be easily parallelized. It is suitable for distributed and parallel environments.

4. Experimental Studies

In the experiments in this research, the proposed SVMC approach was applied to 14 commonly used and publicly available datasets to demonstrate its classification ability. The application was implemented in the Python programming language. SVM learners were built with default parameters. In the verification step, 10-fold cross-validation was applied to evaluate the stability of the models. The proposed method was compared with the state-of-the-art methods in terms of the accuracy, precision, recall, and F-measure metrics, as given in Equations (3) to (6), respectively.
Accuracy is a widely used criterion to evaluate the performance of a model in the classification task. It is calculated by determining the counts of true positives (TP), false positives (FP), true negatives (TN), and false negatives (FN).
A c c u r a c y =   T P + T N T P + T N + F P + F N
Precision shows how many of the examples that we classify as correct are actually correct. It is particularly crucial in research where false positive estimations are costly. In such cases, the precision value is examined in model selection.
P r e c i s i o n =   T P T P + F P
Recall shows how many of the samples that should be positively predicted are correctly estimated by the model. It is the preferred metric when the cost of false negative predictions is high.
R e c a l l =   T P T P + F N
The F-measure is the harmonic average of the precision and recall values. For datasets that are not evenly distributed, it allows the evaluation of both states and provides a more accurate direction for model selection than accuracy.
F m e a s u r e =   2 P r e c i s i o n R e c a l l P r e c i s i o n + R e c a l l

4.1. Dataset Description

The proposed SVMC method was tested in 14 different real-world datasets, which are available in the UCI Machine Learning Repository []. Table 1 shows the characteristics of the experimental datasets. The datasets are suitable for both binary and multiclass classification. In addition to datasets with only categorical features or numeric features, some datasets have features that include both types. The datasets come from different domains, including health, marketing, animal science, and the environment.
Table 1. Characteristics of experimental datasets (#: The number of elements, √: available).

4.2. Experimental Results

The superiority of the proposed SVMC method over the traditional SVM method was demonstrated on various datasets. In order to assess the model’s effectiveness in a variety of ways, tests were specifically performed on different types of datasets, containing categorical, numerical, or mixed values and having binary or multi-class labels. As seen in Table 2, SVMC outperformed SVM in terms of accuracy in 13 of 14 datasets, which are marked by bullet points. For example, SVMC (89.16%) achieved better classification performance than SVM (86.80%) on the hepatitis dataset. The proposed method obtained the highest improvement (10%) compared to the conventional SVM method on the lenses dataset. On average, SVMC demonstrated higher classification ability than SVM. Similar improvements were also obtained in terms of the precision and recall measures.
Table 2. Comparison of the proposed SVMC method with the standard SVM method (●: higher accuracy).
As some of the datasets were imbalanced according to the target classes, the F-measure values were also assessed. The F-measure values obtained by the SVM and SVMC methods are visually represented in Figure 3. As can be seen, SVMC outperformed SVM in terms of the F-measure in 12 of 14 datasets. For example, SVMC (0.9663) achieved better performance than SVM (0.8976) on the ionosphere dataset. SVMC increased the performance of the model since it applied a special feature selection and sampling strategy to build a chain structure. Another reason is that the final result was reached by tournament voting, rather than majority voting.
Figure 3. Comparison of SVM and SVMC in terms of F-measure.
To demonstrate the efficiency of the proposed voting technique, SVMC was conducted with both tournament voting (TV) and majority voting (MV). In TV, the predictions of the classifiers in the ensemble compete in groups, whereas MV delivers the result with the most votes out of all the outcomes returned from the classifiers. Table 3 presents the accuracy, precision, and recall values obtained by both techniques. According to Table 3, SVMC with TV achieved equal or higher performance compared to SVMC with MV on all the datasets, where the results are marked by bullet points. For example, TV (83.11%) demonstrated higher classification ability over MV (82.53%) on the spectf heart dataset.
Table 3. Comparison of the proposed tournament voting with the majority voting.
The F-measure values obtained by the majority voting and tournament voting techniques are visually displayed in Figure 4. For example, TV (0.9663) demonstrated better performance than MV (0.9103) on the ionosphere dataset. As can be observed, TV usually achieved higher F-measure values than MV. This is because grouping the results and analyzing them locally decreases the disadvantage that can occur in the event of equal votes, as opposed to returning the value that is most prevalent among all outcomes as the final result.
Figure 4. Comparison of tournament voting and majority voting in terms of F-measure.
The results of this study were compared with those of state-of-the-art studies that used the same datasets. The research was organized according to the datasets and the findings are shown in Table 4.
The effectiveness of our method was experimentally verified by comparing the accuracy values of other methods on the same datasets. When we compared it with the decision-tree-based studies, it was observed that the C5.0, conditional inference tree (CTree), recursive partitioning tree (RPART), traditional tree, and Boolean sensing-based tree (BSNSING) methods obtained the maximum of 80.80% accuracy on the hepatitis dataset [], whereas the SVMC method achieved 89.16% accuracy. Similar improvements were also demonstrated for other datasets.
When we compared it with ensemble learning techniques such as random forest (RF) and AdaBoost, our method also outperformed them in terms of accuracy. For instance, SVMC (87.80%) demonstrated its superiority over the classifier ensemble approach based on reduce-error pruning (CEREP) (82.42%), progressive-subspace ensemble learning (PSEL) (83.42%), and the classifier ensemble approach based on complementarity measure pruning (CECMP) (82.82%) methods [] on the ecoli dataset.
When we compared it with the variations of k-nearest neighbor (KNN), such as center-based nearest neighbor (CNN) and k-nearest centroid neighborhood (K-NCN), the SVMC method achieved higher accuracy on the datasets. For instance, in the spectf heart dataset, 79.47%, 79.77%, and 76.05% accuracy rates were obtained with the k-min–max sum (K-MMS), k-min ranking sum (K-MRS) [], and interval valued k-nearest neighbor (IV-KNN) [] methods, respectively, while an 83.11% accuracy rate was obtained with SVMC. Similarly, SVMC (98.30%) outperformed the k-nearest neighbor learning with graph neural networks (KNNGNN) method (94.78%) [] on the wine dataset.
In some studies, genetic algorithm and gene expression programming (GEP) methods were used for the classification task, which offered the opportunity to evaluate our method from different perspectives. For instance, on the ionosphere dataset, SVMC (94.60%) demonstrated a stronger classification ability over the adaptive reference-point-based non-dominated sorting with GEP (AR-NSGEP) method (87.35%) [], generational genetic algorithm (GGA) (90.85%), steady state genetic algorithm (SSGA) (91.04%), and cross-generational elitist selection (CHC) method (90.63%) [].
Table 4. Comparison of the proposed method with the state-of-the-art methods on the same datasets.
Ref.YearMethodAccuracy (%)
DermatologyEcoliHepatitisIonosphereIrisSpectf HeartWine
[]2022C5.094.90-75.9589.2093.40-92.00
CTree93.4079.1090.5094.1089.70
RPART92.8078.9087.0093.0088.90
Tree92.3080.8087.4093.6092.10
BSNSING91.5079.8085.9094.5091.10
[]2021Uniform KNN-81.47-81.9291.14-89.65
Weighted KNN82.9782.1092.3491.39
KNNGNN81.5191.6294.2794.78
[]2018SVM-60.41--90.66-85.39
KNN54.1684.6679.77
C4.555.6592.6641.01
CBCC-IM-EUC83.7894.6697.15
[]2018C4.594.1082.8379.2289.7494.73-93.20
CC4.594.0782.9577.6388.9594.7392.98
AdaptiveCC4.593.9681.7280.6288.2794.1392.47
[]2018AR-NSGEP95.4171.1087.2387.3596.53-94.60
[]2016No TSS96.6278.0086.0889.1793.3379.4996.08
GGA97.3080.9287.6490.8596.5283.1097.07
CHC93.2978.8983.5990.6392.6776.4496.67
SSGA97.4280.4288.3391.0494.0082.3196.88
[]2016PSEL97.5183.42-93.6294.8781.0696.96
Random Subspace 96.9884.3893.3694.6779.4096.33
Random Forest97.3785.3093.5395.1381.1297.69
MultiBoostAB50.2564.5991.2095.2080.8391.91
AdaBoostM150.2564.5992.3795.3380.1591.35
Bagging96.0983.0692.2094.6080.7295.05
CECMP94.8182.8291.4593.7379.8591.40
CEREP 95.0682.4289.9493.6778.7691.46
RTBoost92.5577.1188.3894.2073.7492.86
[]2015IV-KNN-82.7684.6784.3294.6776.0596.60
[]2015PMC98.0076.1987.1093.7396.0072.5197.55
KNN96.9080.6782.5185.1894.0068.1895.49
CNN95.7867.8982.3389.1792.6764.0796.63
[]2015eW KNN ----92.77-96.12
dW KNN95.4096.75
dW-ABC KNN94.1197.04
[]2011NN85.68--85.2495.2072.8171.57
K-NN85.6883.7194.8079.1067.39
K-MRS85.6883.7195.2079.7768.75
K-MMS 85.0884.9094.5379.4769.63
K-NCN89.8992.2596.2779.3271.22
Average90.6976.8682.4488.8293.9777.6589.33Overall Average85.68
SVMC (proposed method)98.3087.8089.1694.6096.6683.1198.30Overall Average92.56
According to Table 4, the overall average accuracy reported in the state-of-the-art studies on the seven datasets was 85.68%, while the proposed method obtained average accuracy of 92.56%. When we take into account the difference between these values, it is clear that our method achieved an average of a 6.88% accuracy improvement compared to its counterparts. The highest improvement (11%) was recorded in the ecoli dataset. As a result, the SVMC method, which includes specific feature selection, sampling, and aggregating processes at the same time, outperformed the methods used in the previous studies on the same datasets.

5. Conclusions and Future Work

The SVMC method is proposed in this paper, in which multiple SVM models are built with bootstrapped samples and features, assessed according to mutual information values in each iteration. The proposed method differs from the conventional machine learning methods with its special chain structure that includes feature selection in a specific manner, sample selection, and model fusion all at once. The predictions of the models on a given new data are combined using a novel voting mechanism, called tournament voting. In this voting process, class labels compete against one another within and between groups until only one finalist is left.
The main contributions of this study are highlighted as follows:
  • It proposes a novel method, called support vector machine chains (SVMC), that has a structure in which the training SVM model is included in the chain by reducing the attributes in the dataset by one at each iteration.
  • It proposes a novel voting mechanism, called tournament voting, in which the outputs of classifiers compete in groups, the common result in each group gradually moves to the next round, and, in the last round, the winning class label is assigned as the final prediction.
  • The results of the experiments showed the superiority of SVMC (88.11%) over SVM (86.71%) in terms of average accuracy on the same datasets.
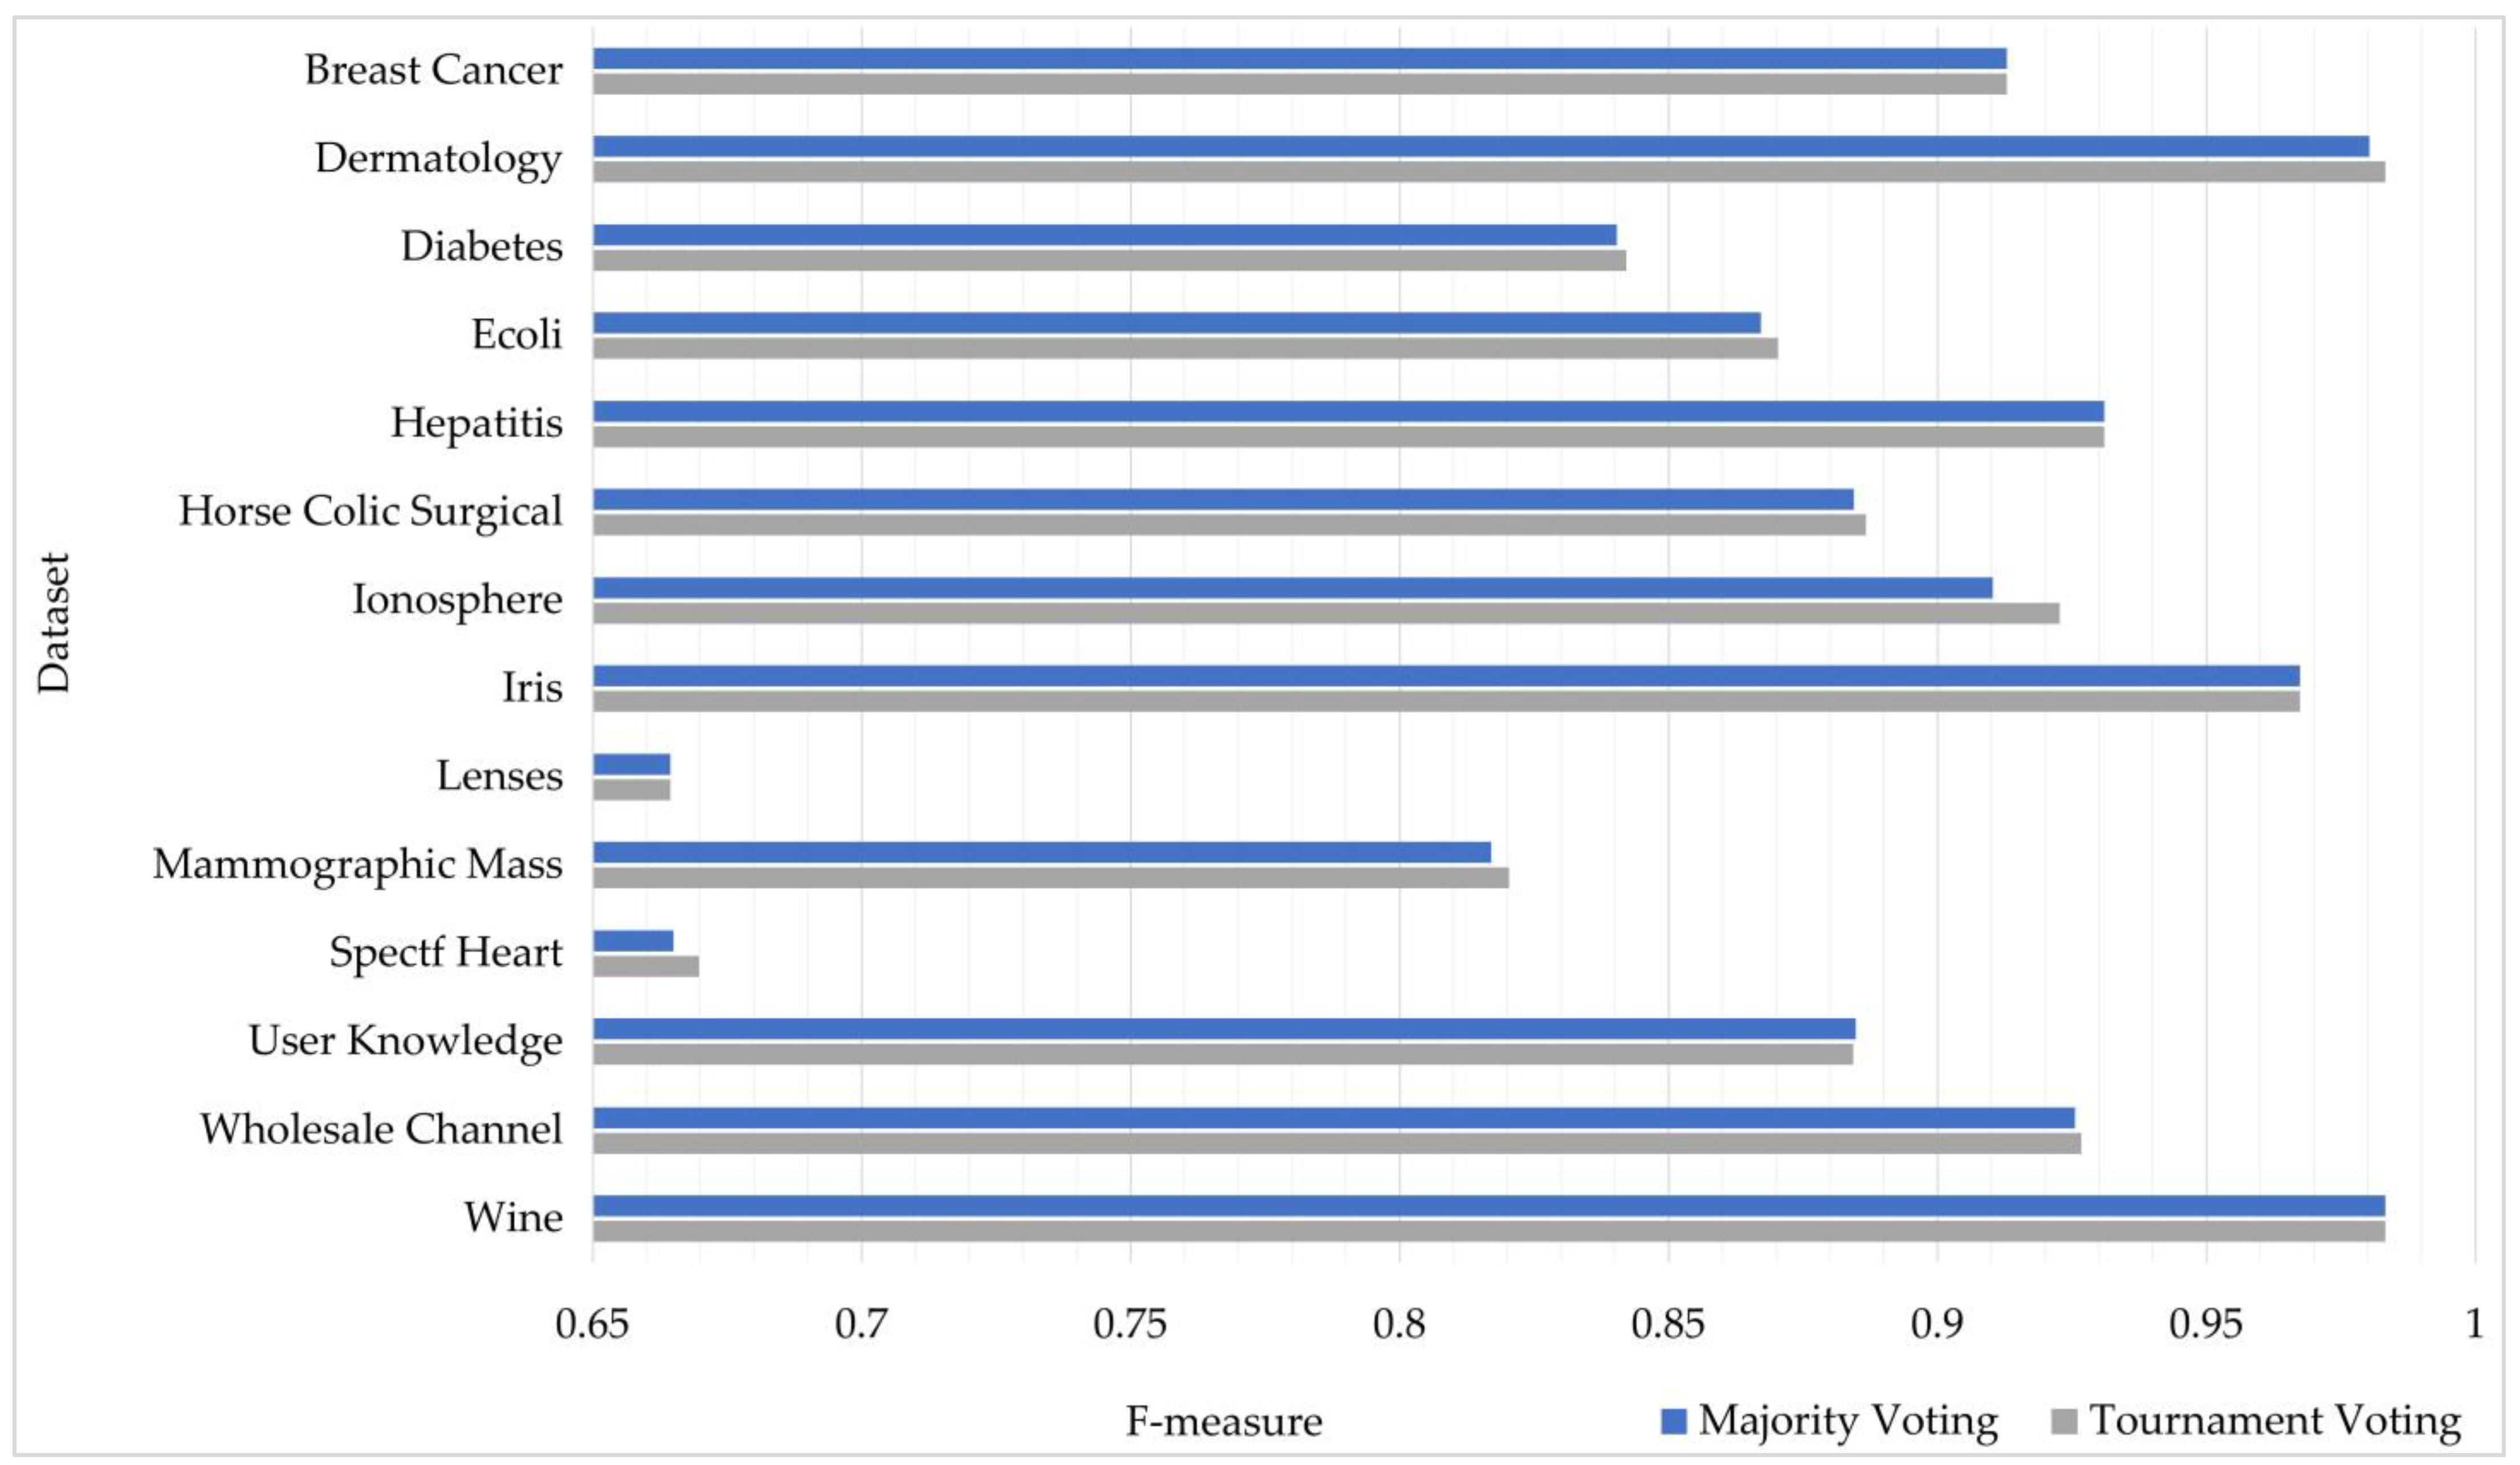
  • The proposed tournament voting achieved higher accuracy than the standard majority voting in terms of the accuracy, recall, precision, and F-measure metrics when they were tested and compared on 14 well-known benchmark datasets.
  • The proposed method outperformed the state-of-the-art methods, with a 6.88% improvement in average accuracy.
One limitation is that the developed version of the SVMC method is suitable for the classification task only. Research and development is necessary to create a version that works for the regression task. In the future, this situation will be addressed.

Author Contributions

Conceptualization, C.A. and D.B.; methodology, C.A., R.Y., D.B. and R.A.K.; software, C.A.; validation, C.A.; formal analysis, C.A., R.Y. and R.A.K.; investigation, C.A., D.B., R.Y. and R.A.K.; resources, C.A. and R.Y.; data curation, R.Y. and R.A.K.; writing—original draft preparation, C.A. and D.B.; writing—review and editing, R.Y. and R.A.K.; visualization, C.A.; supervision, R.A.K. and R.Y.; project administration, R.A.K.; funding acquisition, R.Y. All authors have read and agreed to the published version of the manuscript.

Funding

This study was supported by the project numbered 119C078, carried out within the scope of the TUBITAK 2244 Industry Doctorate Program.

Data Availability Statement

All datasets used in the study are publicly available in the University of California Irvine (UCI) machine learning repository [] (https://archive.ics.uci.edu/mL, accessed on 20 April 2023).

Conflicts of Interest

The authors declare no conflict of interest.

References

  1. Rojo-Álvarez, J.L.; Martínez-Ramón, M.; Muñoz-Marí, J.; Camps-Valls, G. Support Vector Machine and Kernel Classification Algorithms. In Digital Signal Processing with Kernel Methods; IEEE: Manhattan, NY, USA, 2018; pp. 433–502. [Google Scholar] [CrossRef]
  2. Elsadig, M.A.; Altigani, A.; Elshoush, H.T. Breast cancer detection using machine learning approaches: A comparative study. Int. J. Electr. Comput. Eng. 2023, 13, 736–745. [Google Scholar] [CrossRef]
  3. Zhou, C.; Song, J.; Zhou, S.; Zhang, Z.; Xing, J. COVID-19 Detection Based on Image Regrouping and Resnet-SVM Using Chest X-Ray Images. IEEE Access 2021, 9, 81902–81912. [Google Scholar] [CrossRef]
  4. Adarsh, V.; Kumar, P.A.; Lavanya, V.; Gangadharan, G. Fair and Explainable Depression Detection in Social Media. Inf. Process. Manag. 2023, 60, 103168. [Google Scholar] [CrossRef]
  5. Song, T.; Bodin, C.; Coulon, O. Ensemble learning for the detection of pli-de-passages in the superior temporal sulcus. Neuroimage 2023, 265, 119776. [Google Scholar] [CrossRef] [PubMed]
  6. Hayder, I.M.; Al Ali, G.A.N.; Younis, H.A. Predicting reaction based on customer’s transaction using machine learning approaches. Int. J. Electr. Comput. Eng. 2023, 13, 1086–1096. [Google Scholar] [CrossRef]
  7. Shakil, S.; Arora, D.; Zaidi, T. An optimal method for identification of finger vein using supervised learning. Meas. Sensors 2023, 25, 100583. [Google Scholar] [CrossRef]
  8. Maincer, D.; Benmahamed, Y.; Mansour, M.; Alharthi, M.; Ghonein, S.S.M. Fault Diagnosis in Robot Manipulators Using SVM and KNN. Intell. Autom. Soft Comput. 2022, 35, 1957–1969. [Google Scholar] [CrossRef]
  9. Puertas, G.; Cazón, P.; Vázquez, M. A Quick Method for Fraud Detection in Egg Labels Based on Egg Centrifugation Plasma. Food Chem. 2023, 402, 134507. [Google Scholar] [CrossRef]
  10. Malek, N.H.A.; Yaacob, W.F.W.; Wah, Y.B.; Md Nasir, S.A.; Shaadan, N.; Indratno, S.W. Comparison of Ensemble Hybrid Sampling with Bagging and Boosting Machine Learning Approach for Imbalanced Data. Indones. J. Elec. Eng. Comput. Sci. 2023, 29, 598–608. [Google Scholar] [CrossRef]
  11. Al Duhayyim, M.; Alotaibi, S.S.; Al-Otaibi, S.; Al-Wesabi, F.N.; Othman, M.; Yaseen, I.; Rizwanullah, M.; Motwakel, A. An Intelligent Hazardous Waste Detection and Classification Model Using Ensemble Learning Techniques. Comput. Mater. Contin. 2023, 74, 3315–3332. [Google Scholar] [CrossRef]
  12. Bawa, A.; Samanta, S.; Himanshu, S.K.; Singh, J.; Kim, J.J.; Zhang, T.; Chang, A.; Jung, J.; DeLaune, P.; Bordovsky, J.; et al. A Support Vector Machine and Image Processing Based Approach for Counting Open Cotton Bolls and Estimating Lint Yield from UAV Imagery. Smart Agri. Tech. 2023, 3, 100140. [Google Scholar] [CrossRef]
  13. Yu, L.; Yue, W.; Wang, S.; Lai, K.K. Support vector machine based multiagent ensemble learning for credit risk evaluation. Exp. Syst. Appl. 2010, 37, 1351–1360. [Google Scholar] [CrossRef]
  14. Mienye, I.D.; Sun, Y. A Survey of Ensemble Learning: Concepts, Algorithms, Applications, and Prospects. IEEE Access 2022, 10, 99129–99149. [Google Scholar] [CrossRef]
  15. Salama, M.; Abdelkader, H.; Abdelwahab, A. A Novel Ensemble Approach for Heterogeneous Data with Active Learning. Int. J. Eng. Bus. Manag. 2022, 14, 18479790221082605. [Google Scholar] [CrossRef]
  16. Khadse, V.M.; Mahalle, P.N.; Shinde, G.R. A Novel Approach of Ensemble Learning with Feature Reduction for Classification of Binary and Multiclass IoT Data. Turk. J. Comput. Math. Edu. 2021, 12, 2072–2083. [Google Scholar]
  17. Noor, A.; Ucąr, M.K.; Polat, K.; Assiri, A.; Nour, R.; Masciari, E. A Novel Approach to Ensemble Classifiers: FsBoost-Based Subspace Method. Math. Probl. Eng. 2020, 2020, 1–11. [Google Scholar] [CrossRef]
  18. Rojarath, A.; Songpan, W. Cost-sensitive Probability for Weighted Voting in an Ensemble Model for Multi-Class Classification Problems. Appl. Intell. 2021, 51, 4908–4932. [Google Scholar] [CrossRef]
  19. Bhuiyan, M.; Islam, M.S. A New Ensemble Learning Approach to Detect Malaria from Microscopic Red Blood Cell Images. Sensors Int. 2023, 4, 100209. [Google Scholar] [CrossRef]
  20. Shahhosseini, M.; Hu, G.; Pham, H. Optimizing Ensemble Weights and Hyperparameters of Machine Learning Models for Regression Problems. Mach. Learn. Appl. 2022, 7, 100251. [Google Scholar] [CrossRef]
  21. Chongya, S.; Kang, Y.; Alexander, P.; Jin, L. Rank-based Chain-Mode Ensemble for Binary Classification. Int. J. Comput. Syst. Eng. 2020, 14, 153–158. [Google Scholar]
  22. Tuysuzoglu, G.; Birant, D. Enhanced bagging (eBagging): A novel approach for ensemble learning. Int. Arab J. Inf. Tech. 2020, 17, 515–528. [Google Scholar] [CrossRef]
  23. Abdoli, M.; Akbari, M.; Shahrabi, J. Bagging Supervised Autoencoder Classifier for credit scoring. Expert Syst. Appl. 2023, 213, 118991. [Google Scholar] [CrossRef]
  24. Dua, D.; Graff, C. UCI (University of California Irvine) Machine Learning Repository. 2019. Available online: https://archive.ics.uci.edu/ml (accessed on 20 April 2023).
  25. Liu, Y. bsnsing: A decision tree induction method based on recursive optimal boolean rule composition. arXiv 2022, arXiv:2205.15263. [Google Scholar] [CrossRef]
  26. Yu, Z.; Wang, D.; You, J.; Wong, H.S.; Wu, S.; Zhang, J.; Han, G. Progressive subspace ensemble learning. Pattern Recognit. 2016, 60, 692–705. [Google Scholar] [CrossRef]
  27. Altiņcay, H. Improving the K-Nearest Neighbour Rule: Using Geometrical Neighbourhoods and Manifold-Based Metrics. Expert Systems 2011, 28, 391–406. [Google Scholar] [CrossRef]
  28. Derrac, J.; Chiclana, F.; García, S.; Herrera, F. An Interval Valued K-Nearest Neighbors Classifier. In Proceedings of the 2015 Conference of the International Fuzzy Systems Association and the European Society for Fuzzy Logic and Technology, Gijón, Spain, 30 June 2015. [Google Scholar]
  29. Kang, S. K-nearest Neighbor Learning with Graph Neural Networks. Mathematics 2021, 9, 830. [Google Scholar] [CrossRef]
  30. Guerrero-Enamorado, A.; Morell, C.; Ventura, S. A Gene Expression Programming Algorithm for Discovering Classification Rules in the Multi-Objective Space. Int. J. Comp. Intell. Syst. 2018, 11, 540–559. [Google Scholar] [CrossRef]
  31. Verbiest, N.; Derrac, J.; Cornelis, C.; García, S.; Herrera, F. Evolutionary wrapper approaches for training set selection as preprocessing mechanism for support vector machines: Experimental evaluation and support vector analysis. Appl. Soft Comp. J. 2015, 38, 10–22. [Google Scholar] [CrossRef]
  32. Yelipe, U.R.; Porika, S.; Golla, M. An efficient approach for imputation and classification of medical data values using class-based clustering of medical records. Comput. Elec. Eng. 2018, 66, 487–504. [Google Scholar] [CrossRef]
  33. Abellán, J.; Mantas, C.J.; Castellano, J.G. AdaptativeCC4.5: Credal C4.5 with a Rough Class Noise Estimator. Expert Syst. Appl. 2018, 92, 363–379. [Google Scholar] [CrossRef]
  34. Sreeja, N.K.; Sankar, A. Pattern matching based classification using Ant Colony Optimization based feature selection. Appl. Soft Comp. J. 2015, 31, 91–102. [Google Scholar] [CrossRef]
  35. Yigit, H. ABC-based distance-weighted kNN algorithm. J. Exp. Theor. Artif. Intell. 2015, 27, 189–198. [Google Scholar] [CrossRef]
Disclaimer/Publisher’s Note: The statements, opinions and data contained in all publications are solely those of the individual author(s) and contributor(s) and not of MDPI and/or the editor(s). MDPI and/or the editor(s) disclaim responsibility for any injury to people or property resulting from any ideas, methods, instructions or products referred to in the content.

Article Metrics

Citations

Article Access Statistics

Multiple requests from the same IP address are counted as one view.