You are currently viewing a new version of our website. To view the old version click .
Electronics
  • Article
  • Open Access

31 May 2023

Optimal Deployment in Moving Target Defense against Coordinated Cyber–Physical Attacks via Game Theory

and
School of Automation, Nanjing University of Science & Technology, Nanjing 210094, China
*
Author to whom correspondence should be addressed.

Abstract

This work proposes a method for the intelligent deployment of distributed flexible AC transmission system (D-FACTS) devices. In recent years, in the field of moving target defense (MTD) strategies to detect coordinated cyber–physical attacks (CCPAs), establishing how to deploy D-FACTS devices has become an important research point. Although some research results have been proposed, the obtained deployment solutions are unintelligent due to not carefully considering smart attackers’ behaviors. A method for achieving the intelligent deployment of D-FACTS devices is proposed in this paper. First, the basic concept of corrupting CCPAs is summarized; second, based on considering practical constraints and the basic concept, a protected transmission line set is confirmed; and third, a zero-sum game model is formulated, and a robust Nash equilibrium solution is computed. Due to the game’s characteristics, this solution reflects the smart attackers’ sense of action. Relying on the solution, those lines that are most likely to be tripped form a new protected transmission line set. Finally, a comprehensive algorithm using a metric proposed in previous studies is proposed for finding an intelligent solution for the deployment of D-FACTS devices. We validated our results through extensive simulations using IEEE 14-bus, 30-bus, and 118-bus power systems provided by MATPOWER and the real-world load profiles from New York State. Our work, in tracking the targets that attackers are most likely to attack, opens up new ideas for the intelligent deployment of D-FACTS devices.

1. Introduction

In recent years, rapid research and development in cyber–physical systems (CPS) have fueled the transformation of physical infrastructures into smarter and more intelligent ones []. Due to the enormous and advanced devices used in CPS, the safety of CPS is gradually gaining attention []. A smart grid (SG) is a typical CPS. In a modern power system, the deep integration of information and communication transforms a power system into a SG, which facilitates the operation and maintenance of the power system. However, due to the introduction of new computing and communication devices, there are various vulnerabilities in these devices. These vulnerabilities cause SGs to be prone to cyber-attacks.
In the last decade, false data injection attacks [] (FDIAs) have become a significant form of covert cyber-attack on SGs. To detect FDIAs, various methods have been proposed. Due to the integration and mutual cooperation of highly synthetic cyber–physical attacks (CPAs), the harm caused to the power grid is even greater than that caused by FDIAs alone (e.g., Black Energy []). This new type of so-called coordinated CPA denoted as CCPA, is gradually becoming a major focus due to its dangerously covert performance. When a CCPA is launched, a transmission line, generator, or transformer is cut off by the physical attack, and a simultaneous cyber-attack may mask the physical attack by manipulating sensor measurements conveyed to the control center. CCPAs can cause a dangerous situation in the SG due to undiscovered line/generator outages potentially triggering cascading faults, thus attracting significant concern.
To protect SGs against CCPAs, diverse defense methods have been proposed. To guarantee the validity of sensor measurements from field devices, recent studies [,] have presented various strategies. The former was based on securing a set of measurements by encryption, while the latter was based on measurements from known-secure phasor measurement units (PMUs) distributed in the SG. Nevertheless, there is a great deal of devices whose life cycles could last for a very long time in an SG, which makes security upgrades troublesome due to their expensive cost. Moreover, extensive research has indicated that FDIAs can steal measurements from PMUs due to their vulnerabilities []. Machine learning (ML)-based approaches have been proposed to detect FDIAs in the literature [,]. However, in adversarial scenarios, ML-based algorithms seem vulnerable, which was verified by a recent study, and so can significantly reduce their efficacy [].
In recent years, many studies related to the moving target defense (MTD) detection of CCPAs have been carried out. Deng et al. [] first derived the production mechanism of CCPAs and proposed some countermeasures for defending against CCPAs. Lakshminarayana et al. [] proposed sufficient conditions for destroying the construction of CCPAs and first applied a zero-sum game-theoretic framework to defend against CCPAs in the context of MTD. Zhenyong et al. [] proposed more comprehensive sufficient conditions for destroying the construction of CCPAs and presented an algorithm for acquiring an optimal distributed flexible AC transmission system (D-FACTS) deployment, which minimized the number of used D-FACTS devices without sacrificing the protection performance of MTD.
In summary, in terms of detecting cyber-attacks via the MTD strategy, there are basically only two research points: one is the detection capability against FDIAs or CCPAs, and the other is how to deploy D-FACTS devices in a way that ensures minimal operational cost and maximum detection effectiveness. Refs. [,] performed research on this issue and achieved some meaningful results. However, they acquired their deployment solutions without considering the attackers’ point of view and without knowing the targeted lines that are most likely to be attacked by the attackers; therefore, their deployments are unintelligent. Therefore, their suggested deployments could be further optimized.
In our works, based on fully considering the targeted lines that are most likely attacked by the smart attacker, the result of deploying D-FACTS devices is intelligent, which is the most important innovation in this paper, as shown in Figure 1. When analyzing unintelligent deployments of D-FACTS devices, the deployments are essentially based on the knowledge of system topology and mathematical statistics. Despite valuable results being acquired, these results are unintelligent when they do not consider the human factor. When considering the intelligent deployment of D-FACTS devices, subject to practical constraints and real load profiles, there are differences in the flow of power on each line; eventually, the smart attacker will only attack critical lines. Therefore, intelligent deployment can only be achieved by taking into account the aggressive behavior of the smart attacker and confirming the target lines most likely to be attacked.
Figure 1. Comparative diagram of unintelligent and intelligent deployments of D-FACTS devices.
In addition to the above innovation, there are also two other innovations. Refs. [,] both proposed sufficient conditions for disrupting the construction of CCPAs, which did not relate to the essence of the MTD defense against CCPAs. In the paper, the essence is presented, representing the second innovation. In Ref. [], a novel metric formulated as a derivative of the optimal power flow (OPF) cost to each transmission line’s reactance was presented, enduring a weight to each line, such that when the MTD’s efficient detection capability against CCPAs was guaranteed, the optimal operational cost was implemented. In addition, taking into account the practical constraints, Zhenyong et al. [] presented a heuristic algorithm to achieve the deployment of D-FACTS devices; however, the algorithm was not comprehensive and most likely powerless for a large-scale power system. We design a new heuristic algorithm fused with the metric mentioned above, which can acquire more optimal deployment for a large-scale power system.
In brief, the contributions of our works are three-fold.
  • We summarize the essence of MTD against CCPAs. When abiding by the essence and considering the practical constraints, an initial protected transmission line set is obtained;
  • Based on a game model presented in Ref. [], we compute a Nash equilibrium (NE) Minimax robust solution. To acquire the true solution, some real load profiles from New York State are used. This is the first time that the NE robust solution has been analyzed from the perspective of the attacker. Relying on the solution, those lines that are most likely to be tripped form a new protected transmission line set. Due to the game’s characteristics, the new protected transmission line set reflects the smart attacker’s sense of action;
  • On the basis of the new protected transmission lines, we design a more comprehensive algorithm fueled by a metric developed in Ref. [] for achieving the ultimately intelligent deployment of D-FACTS devices.
The rest of this paper is organized as follows. Section 2 provides the related works. Section 3 reviews the theory analysis. The proposed Methodology is introduced in Section 4. Case studies are implemented in Section 5. The discussion is presented in Section 6. Section 7 provides the conclusions and suggestions for future work.

3. Theory Analysis

3.1. State Estimation and Bad Data Detection

In general, a power grid can be characterized by a graph G = ( N , ) , where N = { 1 , , n } is a set of buses, = { 1 , , l } represents the set of transmission lines. The total number of transmission lines is L. A bus is used as the slack bus. For one line k = { i , j } , let b i j be its susceptance. Under the DC power flow model, the power flowing on line k is denoted as
F i j = b i j ( θ i θ j )
where θ i and θ j are the voltage phase angles at bus i and j, respectively. Sensor measurements are denoted as
z = H θ + e
where z M ,   H M × n 1 ,   and   θ n 1 represent the sensor measurements, the measurement matrix, and the vector of voltage phase angles, respectively. e represents the independent measurement noises that are usually assumed to be sampled from a Gaussian distribution [i.e., e i ~ N ( 0 , σ i 2 ) ]. Assume that the system is a full measurement system. According to the composition rule of the measurement matrix elements in the DC power flow model, the k t h row of H i
H k =   { [ 0     0       0     0     0     b i j   0     0 ] ,     i = i ,     j     i [ 0     0 b i j   0     0   b i j   0     0 ] ,     i     i ,   j     i
where i is the reference bus and   b i j is the susceptance of the transmission line k = { i , j } . Based on the weighted least squares (WLS) technique, the estimate of a system’s state is denoted as
θ ^ = ( H T W H ) 1 H T W z
where W is a diagonal matrix whose elements are reciprocals of the variances of measurement errors. r, usually represents the measurement residual, is formulated as
r = z H θ ^
In bad data detection (BDD), the 2-norm of the measurement residual is compared with a predetermined threshold τ. If r 2 > τ , a bad data alarm is triggered.

3.2. Coordinated Cyber–Physical Attacks

3.2.1. Undetectable FDIAs

After the attack vector a M is injected into the sensor measurements, the corrosive sensor measurement is expressed as
z ɑ = z + a
If a is randomly set, z ɑ seldom passes the BDD. However, if the attack vector is expressed as
a = H c
where c n 1 , z ɑ can bypass the BDD []. Such a situation is called an undetectable FDIA.

3.2.2. CCPA

A CPA is a symbiotic attack. In a CPA, the physical attack and the cyber-attack are launched simultaneously. The physical attack disconnects a subset of the transmission lines. The system topology and power flow may be changed. Similar to an undetectable FDIA, the destruction of the power grid caused by a physical attack cannot pass the BDD if the cyber-attack is randomly set. However, if the cyber-attack is carefully designed, the negative effect of the physical attack on the measurement residual can be perfectly eliminated, which can bypass the BDD. In the end, the undesirable destruction in the power grid can be perfectly masked []. Therefore, this CPA is undetectable and termed as a CCPA.
The system parameters, denoted by the subscript “p”, are different from the original state. After a physical attack is launched, the sensor measurements are expressed as z p = z + a p , where a p is a physical attack vector given by
a p = H Δ θ + Δ H θ p
where Δ H   is the difference in the measurement matrix between post-attack and pre-attack, given by
Δ H = H p H
and Δ θ is the difference in the nodal voltage state variable between post-attack and pre-attack, denoted by
Δ θ = θ p θ
For constructing a CCPA [], the impact of the a p on the measurement residual must be erased, which must be realized by a well-designed FDIA denoted as
a = Δ H θ p

3.2.3. Knowledge Required to Launch a CCPA

Assume that a single branch l = { i , j } is disconnected due to a physical attack. Relying on the composition mechanism of the elements in the measurement difference matrix Δ H [], the tripped branch reactance x l only needs to be known for constructing Δ H . Moreover, due to Equation (11), the knowledge required to launch a CCPA includes the branch reactance x l and the difference in phase angles of buses i and j, i.e., θ i , p θ j , p . In Ref. [], the equation of the difference phase angles between buses i and j is given as:
θ i , p θ j , p = m p l k x l m F l m , p
When z p is added with Equation (11), eventually, the sensor measurement may evolve as follows.
z C P A = z P Δ H θ p = H p θ p Δ H θ p + e = ( H + Δ H ) θ p Δ H θ p + e = H θ p + e
At this point, the measurement residual is denoted by
r C P A = z C P A z ^ C P A = r
So, the measurement residual must bypass the BDD.

3.3. Preliminary Moving Target Defense and Accurate Limitation of the Protected Lines

3.3.1. Preliminary of MTD

In Ref. [], the D-FACTS devices were first introduced. These devices can change the transmission lines’ impedances, protect the branch power flows from overflow, and eliminate transmission bottlenecks. They are light and small and can easily be hung on power lines. Moreover, they do not affect the communication of the power grid. At present, the research on their performance and application in different power systems has become a research hotspot.
The method of detecting FDIAs via MTD technology has been a major research point in the last decade years. This method was first named MTD by Rahman et al. [], and the uncertainty caused by MTD distorts the information obtained by potential attackers, which leads to a less successful attack on the targeted power system.
The essence of the MTD is to invalidate the knowledge obtained by the potential attackers, which involves the network topology and system parameters, by actively perturbing the reactances of the transmission lines on which D-FACTS devices are deployed. Consequently, the attackers cannot acquire accurate knowledge again during an MTD’s activity cycle.
Recently, Lakshminarayana et al. [] were the first researchers to propose using the MTD approach to defend against CCPAs. Following this, Zhenyong et al. [] further studied this research point.

3.3.2. Practical Constraints

Any research should be limited by practical constraints. Not all transmission lines in power grids can be tripped by attackers. For example, a cut line [] will not be cut off by a strategic and smart attacker since the power flow’s fluctuations will be easily discovered by the system operator due to system connectivity disruption. As a result, different transmission lines have different probabilities of being cut off by smart attackers. Naturally, the lines most likely to be tripped lines must be considered most. In addition, the number of D-FACTS devices is limited to reduce operational costs. Above all, evaluated according to the practical constraints, the set of protected transmission lines, denoted as L p , is specific.

3.3.3. Protected Transmission Lines’ Accurate Reconstruction via Game Theory []

Assume that the whole system works at an optimal level pre-MTD activation, making generation costs cost-effective. However, due to MTD’s activation, the workstation of the power grid experiences a deviation from the initial optimally operating station, and then an increasing operational cost is incurred. Additionally, to destroy the construction of CCPAs, the deployment of D-FACTS devices is critical to the operational cost, in addition to the efficiency of MTD against CCPAs. A different attack target can affect the deployment of D-FACTS devices, and different deployments of D-FACTS devices can also change the operational cost. So, the interconnection between the attacker and the defender is worthy of being studied. The interconnection between both sides may be formulated as a game model, as presented in Ref. []. Once several of the most likely attack targets are probed, the deployment of D-FACTS devices will obtain an optimal scheme, which leads to a positive effect on the operational cost in addition to the effectiveness of MTD against CCPAs.
Zero-Sum Game Formulation []
A two-player zero-sum game is described in the above interconnection and defined as a triplet Γ ( { A , D } , { S A , S D } , { u A , u D } ) where the elements are: (i) the set of players {A,D}; (ii) SA and SD represent the set of actions used by the attacker and the defender, respectively; and (iii) the payoffs of two players u k : S A × S D   for k { A , D } , where u k ( S A , S D ) is the benefit acquired by player k when the action profile that has been played is s = ( s A , s D ) . In a zero-sum game, the attacker’s payoff is opposite to that of the defender.
S A = { a 0 , a 1 , a N A 1 } is depicted as the attacker’s action set and N A is the cardinality of the set S A . S D = { d 0 , d 1 , d N D 1 } is depicted as the defender’s action set and N D is the cardinality of the set S D . Every action used by the attacker represents the subset of lines tripped physically, and the number of tripped lines is no more than two due to the power flow fluctuations being easily discovered with a larger number of tripped lines. If the action a 0 is taken, this means that no line is tripped. Each action applied by the defender indicates which lines are to be mounted with D-FACTS devices. Each line is only installed with one D-FACTS device. If the action d 0 is taken, this means that no line has its reactance perturbed.
C O P F ( a m , d n ) denotes the OPF cost when a m and d n  are used by the attacker and defender, respectively. The OPF cost problem is formulated as Equation (4), which was provided in Ref. []. Note that 4 is the sequence number provided in Ref. []. Meanwhile, the payoff computation is completely depicted as Algorithm 3 that was also provided in Ref. [].
According to the above, the attacker’s payoff is computed by
u D ( S A , S D ) = { C O P F ( a 0 , d 0 ) C O P F ( S A , S D ) ,   i f   T S = 0 C O P F ( a 0 , d 0 ) C O P F ( a 0 , S D ) ,   i f   T S = 1
The indicator variable, T S , denotes the success ( T S = 1 ) or failure ( T S = 0 ) of a defense. To maximize their own interests, both players select the appropriate action. Obviously, their objectives are conflicting. The specific implications of Equation (15) may be inferred from the literature [].
NE Solution and Machine Learning to Solve the Game
The reason for using the NE is shown in Ref. []. In our works, the selected machine learning (ML) approach is the exponential weights for exploration and exploitation (EXP3) algorithm. An algorithm (4), together with Equations (6)–(8), is used in this paper. Note that 4, 6, 7, and 8 are sequence numbers provided by [].
First, based on the practical constraints, the set of protected lines is specific and denoted as L p . Then, from the attacker’s point of view, the robust NE solution is analyzed. It is expected that L p can be ultimately reconstructed by selecting the maximal actions of the attacker.

4. Proposed Methodology

4.1. MTD against CCPAs

As described in the literature [,], the concept of using MTD against CCPAs is to wreck the construction of CCPAs. That is, if Equations (12) and (14) are disrupted in the attack-preparation stage, there are no CCPAs. To achieve this objective, both [,] give concretely sufficient conditions which are equivalent to each other. Note that we make use of a graph to depict a power grid. In nature, the essence of the sufficient conditions for using MTD against CCPAs is as follows:
Proposition 1.
In any simple graph, there is no loop whose information is transparent for attackers via the MTD strategy, thus enabling no CCPAs, regardless of the tripped transmission lines.
Proof of Proposition 1
. First, the information in the proposition includes the specific topology and parameters of one loop. The specific topology and parameters indicate the connection sequences and all reactances of the transmission lines which form the loop. Second, in any simple graph, assume that there exists a transmission line T k = { i , j }  in a loop. When other loops are excluded, obviously, there are only two paths from bus i to j in the loop. No matter which line is attacked, if the information of any path among the above two paths is not transparent for attackers via the MTD strategy, Equation (12) is corrupted. If this is true for any other loop, for the whole graph, Equation (12) is still corrupted, and thus there are no CCPAs. □

4.2. Deployment of D-FACTS Devices

Considering the practical constraints, Zhenyong et al. [] provided an algorithm (called the old algorithm in the rest of this paper) for obtaining the optimal deployment of D-FACTS devices. Although this algorithm provides an optimal deployment of D-FACTS devices which implements a trade-off between the defending performance and the invested infrastructure cost, there are two deficiencies. One is primary. In line 6 of the old algorithm, a concept of the so-called “border bus” is presented, but there likely are several cases where the number of “border buses” is no less than two. In these cases, it is not clear to which node “the border bus” refers, so the next step of the algorithm is indistinct; the other is less important.
If the metric provided in Ref. [] is integrated, the above question can easily be solved. So we present a more comprehensive algorithm (Algorithm 1), as follows for seeking the optimal deployment of D-FACTS devices.
Algorithm 1: Minimizing the number of used D-FACTS devices
Input: Power grid graph G = ( N , ) ,     L p
Output: ˜ o
1 Set the weight of link l as d C O P F / d x l ;
2 Based on the specific set L p ,   through injecting the real-world load profiles from
   New York State, compute the robust NE solution;
3 From the attacker’s angle, implement to reconstruct the set
L p   through selecting several maximal actions used by the
attacker;
4 Based on the new set L p , construct the subgraph   G P according to N P   and G ;
5 Use the breath-first search (BFS) to find the connected subgraph G P 1 , G P 2 , , G P t of G P ,
   and find the spanning tree T i ,   the remaining transmission lines i , the cut lines
    C i , and the protected transmission lines P i , for each subgraph G P i ;
6 for each G P i   do
7    Compute ˜ i * = min ( T i \ C i , i ) ;
8  Find the set ˜ i of outside transmission lines incident to G P i and the set C i of cut
    lines in ˜ i ; Sum up the number of the border buses of G P i which has the greatest
    number of transmission lines incident to the outside buses;
9    if the number of border buses is equal to one
10       the set of transmission lines that connect the outside
    buses to the border bus are denoted as ˜ i ;
11   else
12       for each of the border buses do
13          Sum up the weight of every transmission line
      which connects the outside buses to a border bus;
14       end for
15          Select the appropriate border bus corresponding to the least sum
       of weights, and the set of transmission lines that connect the border bus to
       the outside buses are denoted as ˜ i ;
16    end if
17    Compute ˜ i * = ( ˜ i * ˜ i ) \ ( C i ˜ i ) ;
18    if the two cardinalities of ˜ i * and P i are different
19          Calculate the minimum set ˜ i o = min ( ˜ i * , P i ) ;
20    else
21       Select a set with the bigger sum of weights between ˜ i * and P i and
       the selected set is ˜ i o ;
22    end if
23 end for
24 Compute ˜ i o = ˜ 1 o ˜ 2 o ˜ t o ;
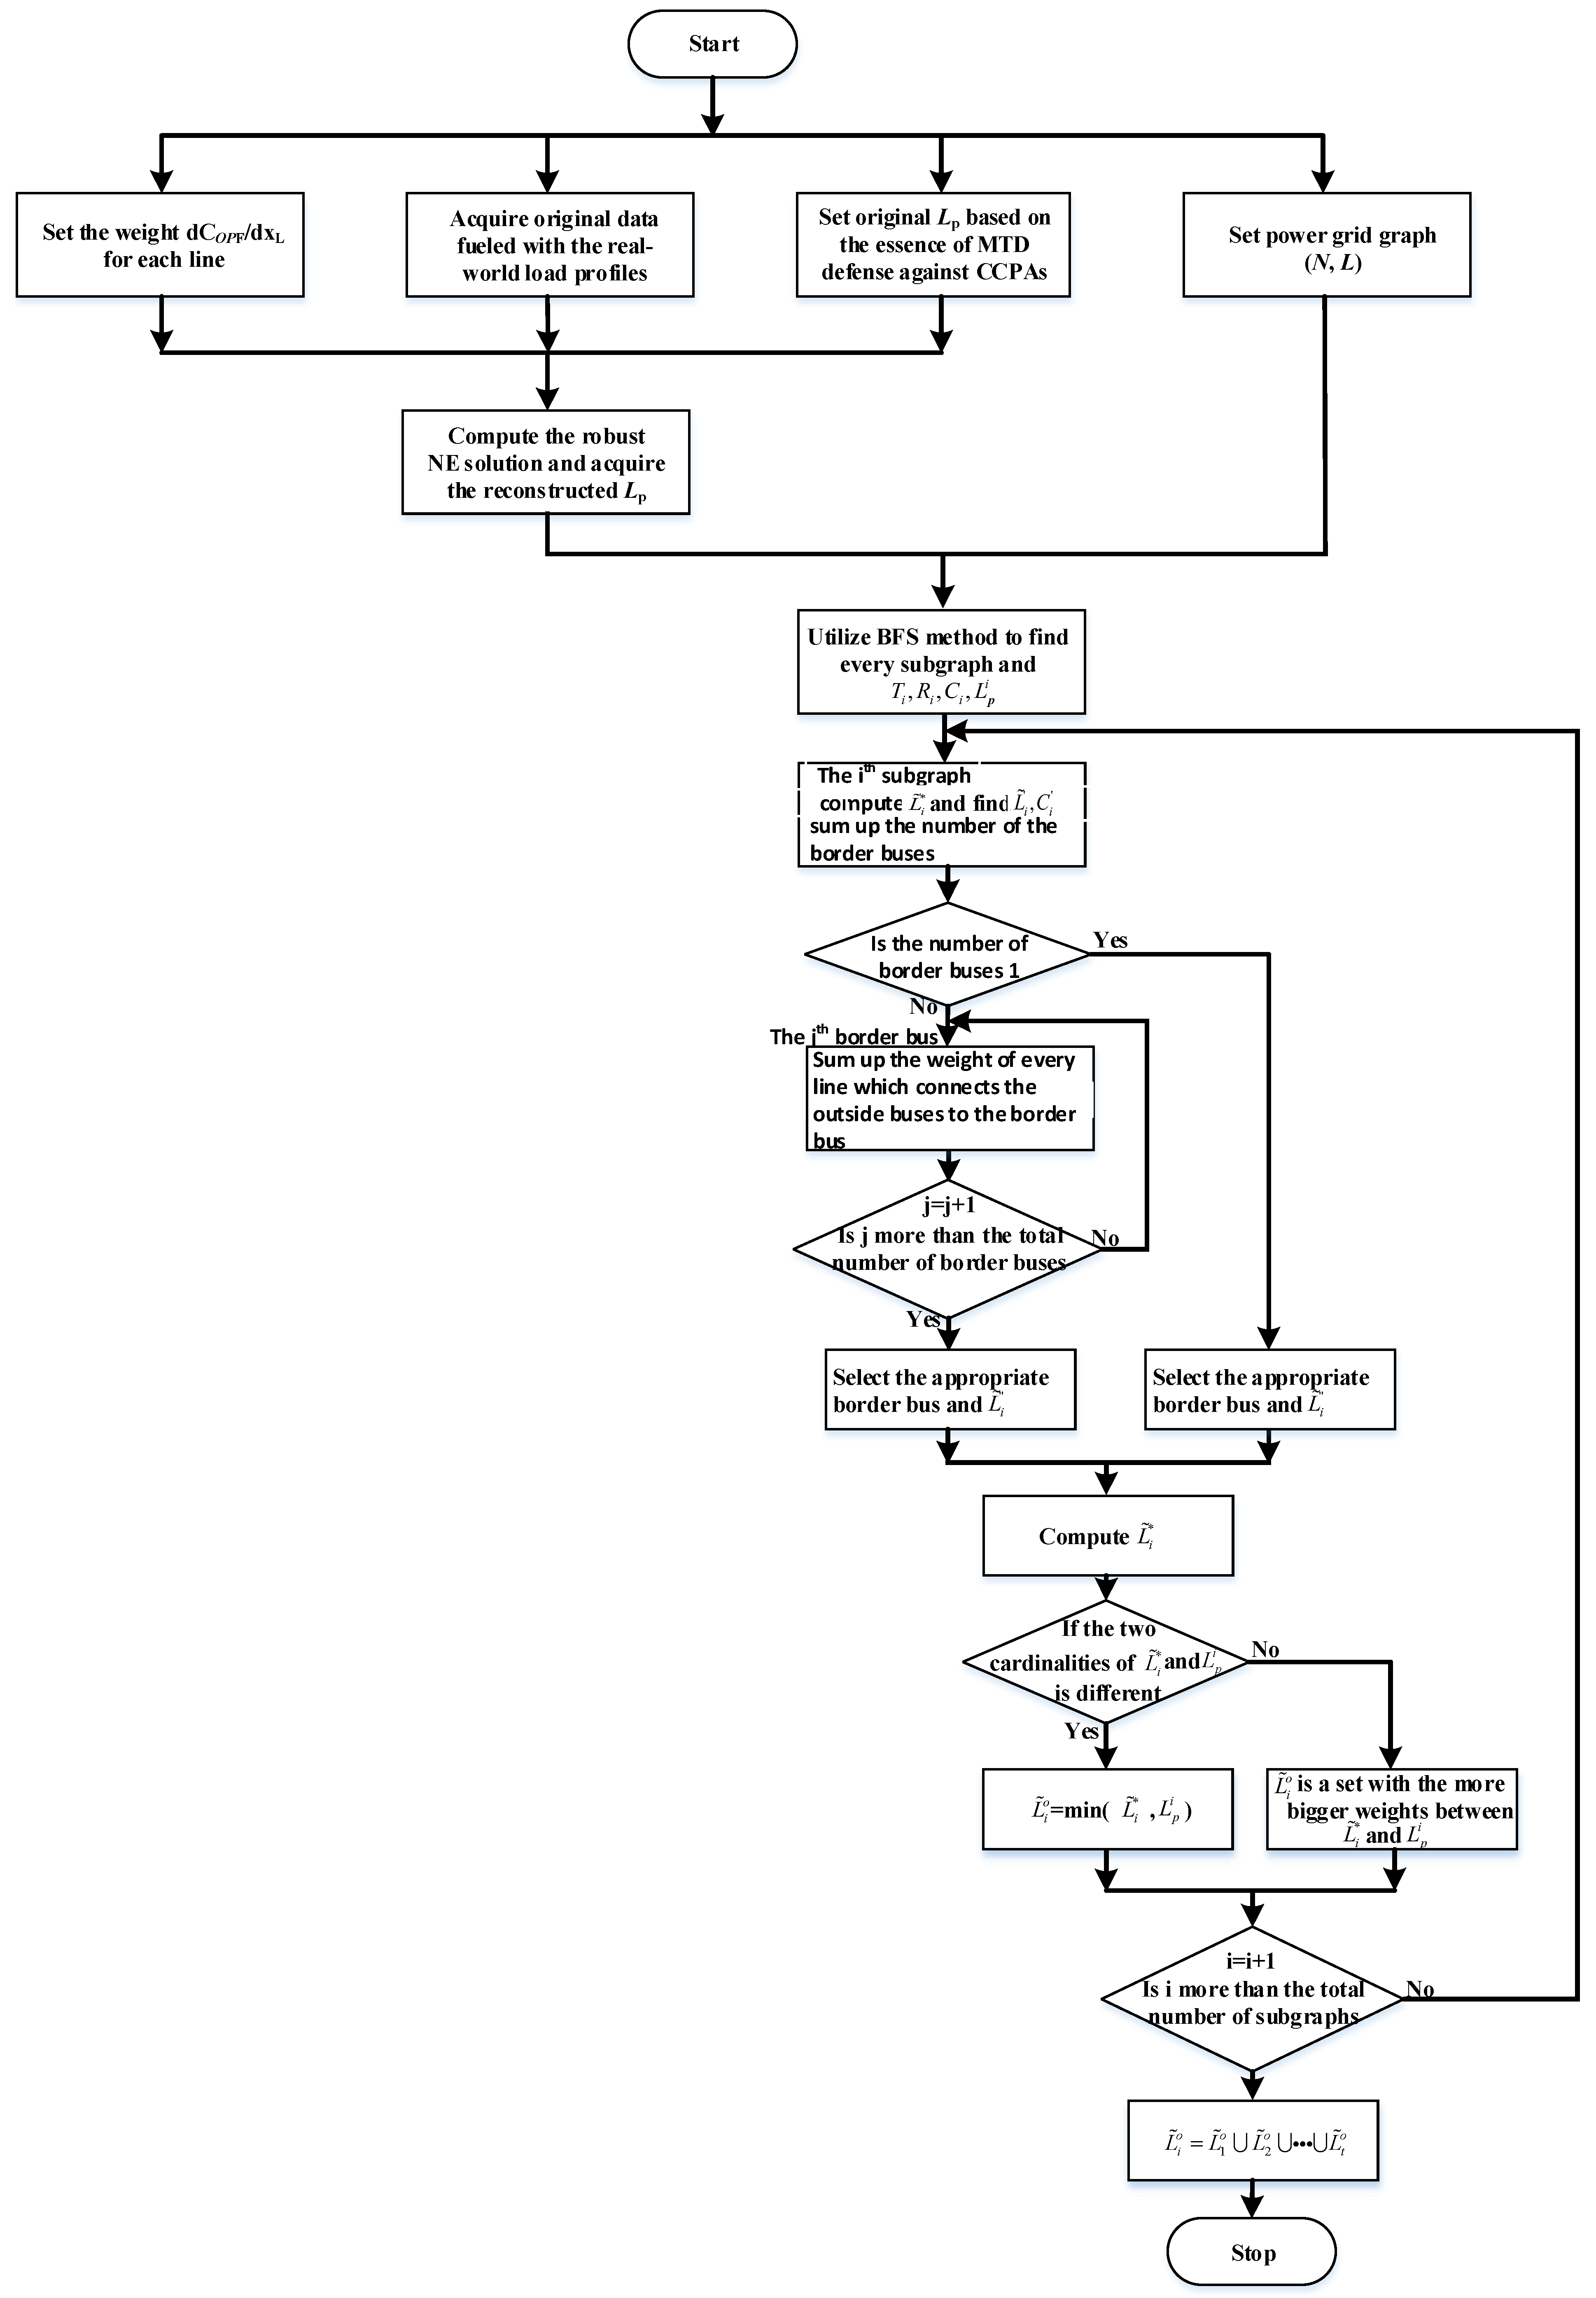
The Algorithm 1 can be fundamentally divided into two steps. The first step is the reconstruction of the protected, denoted as the set Lp. Note that the lines in the Lp are the most likely to be attacked by smart attackers. Due to the real-world load profiles injected, from the perspective of sophisticated and smart attackers, the lines to be tripped are only selected from the Lp. The second step is the process of finding the optimal solution for the deployment of D-FACTS devices. The main implication of the more comprehensive Algorithm 1 may be understood by combining the correlative context of []. In addition, the flow chart of the Algorithm 1 is shown in Figure 3.
Figure 3. The flow chart of the comprehensive Algorithm 1 for the deployment of D-FACTS devices.

5. Simulation

Below, our simulation results performed with the MATPOWER toolbox are presented to show the effectiveness and comprehensiveness of the proposed reconstruction method and algorithm. To be more convincing, we performed extensive simulations for IEEE 14-, 30-, and 118-bus power systems. In the simulations, the real-world load profiles from New York State on 7 June 2020 [] were added to the IEEE 14-bus, IEEE 30-bus, and IEEE 118-bus power systems, respectively.

5.1. Reconstruction of the Specific Protected Transmission Lines

First, based on the practical constraints, assume that the original sets of protected transmission lines, named Lp, are {10, 11, 16, 17, 19, 20}, {7, 17, 18, 21, 22, 24}, and {1, 2, 3, 6, 10, 12, 16, 17, 21, 22, 24, 30, 36, 38, 41, 54, 93, 147, 151, 161, 171, 172} for the IEEE 14-bus power system, IEEE 30-bus power system, and IEEE 118-bus power system, respectively.
Second, set the weight of every line as d C O P F / d x l for the abovementioned power systems. Applying the method from [], the different numbers of MTD perturbation strategies and attack strategies are considered for the defender and attacker, respectively, in the above power systems. Relying on the Lp, we set the appropriate attack strategies for every power system. By avoiding huge fluctuations in the power flow, we limit the number of tripped lines, which is no more than two in each attack strategy. Moreover, the transmission lines are selected from the Lp. Then, after constructing a game model for every power system, the robust NE solutions for each system are obtained by injecting the real-world load profiles from New York State on 7 June 2020 into the three systems. We make use of the EXP3 algorithm [] for computing robust NE solutions.
Lastly, after analyzing the NE solutions, the lines most likely to be cut off are identified for every power system. This causes the number of lines in Lp to be small, which implements the reconstruction of the specific protected transmission lines. We indicate the defender’s and the attacker’s action sets by S D = { d 0 , d 1 , , d N D 1 } and S A = { a 0 , a 1 , , a N A 1 } , respectively, where N D and N A are the cardinality of the above sets, respectively. d 0 denotes that no defenders take action to defend the power systems; a 0 denotes that no attackers take action to disrupt the power systems.

5.1.1. New Lp Reconstructed for the IEEE 14-Bus System

In the IEEE 14-bus power system, five MTD perturbation strategies are considered for the defender, i.e., d 1 = [ 1 ] , d 2 = [ 1 , 3 ] , d 3 = [ 1 , 3 , 5 ] , d 4 = [ 1 , 3 , 5 , 8 ] , and d 5 = [ 1 , 3 , 8 , 9 , 18 , 19 ] . Twenty-one attacker’s strategies are considered, i.e., a 1 = [ 10 ] , a 2 = [ 11 ] , a 3 = [ 16 ] , a 4 = [ 17 ] , a 5 = [ 19 ] , a 6 = [ 20 ] , a 7 = [ 10 , 11 ] , a 8 = [ 10 , 16 ] , a 9 = [ 10 , 17 ] , a 10 = [ 10 , 19 ] , a 11 = [ 10 , 20 ] , a 12 = [ 11 , 16 ] , a 13 = [ 11 , 17 ] , a 14 = [ 11 , 19 ] , a 15 = [ 11 , 20 ] , a 16 = [ 16 , 17 ] , a 17 = [ 16 , 19 ] , a 18 = [ 16 , 20 ] , a 19 = [ 17 , 19 ] , a 20 = [ 17 , 20 ] , and   a 21 = [ 19 , 20 ] .
The used parameters in the game model are mainly referred to in Ref. [], i.e., the generation cost model is denoted as C i ( G i , t ) = c i G i , t , and all of the generators’ capacities are G m a x = 300 ,   2000 ,   1500 ,   1000 ,   20   MW   and   c i = 20 ,   30 ,   40 ,   50 ,   and   35   USD / MW , respectively. The maximal power flow, f m a x , is 160 MW for link 1 and 60 MW for all other links. The operator factors used in the EXP3 algorithm are selected as follows. γ t = β t = 0 ,   η t = 0.01 .
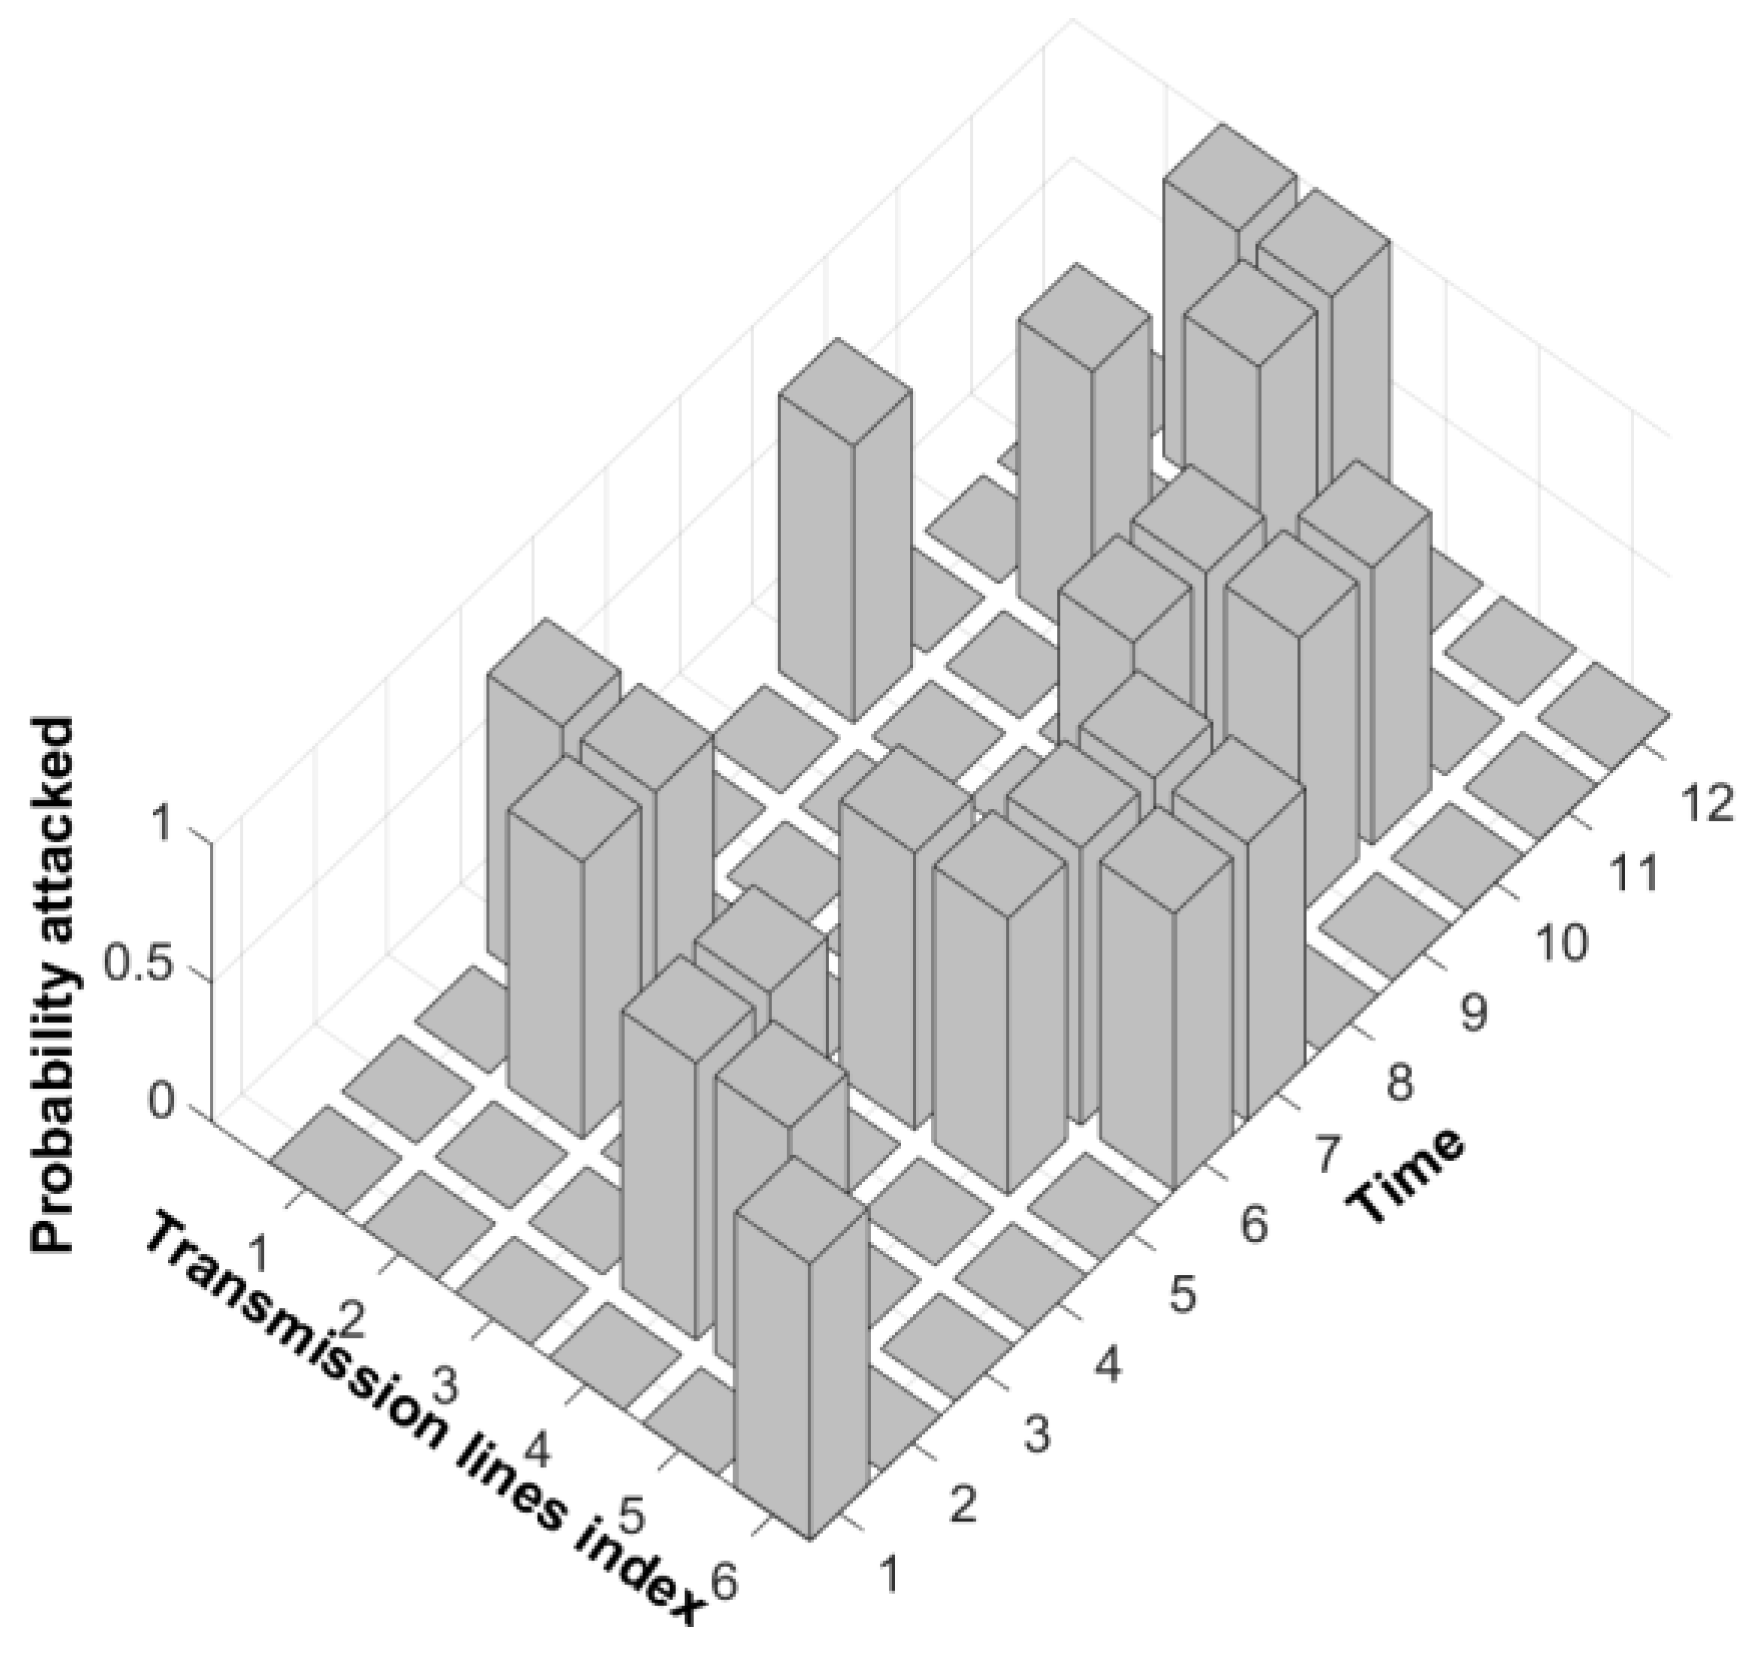
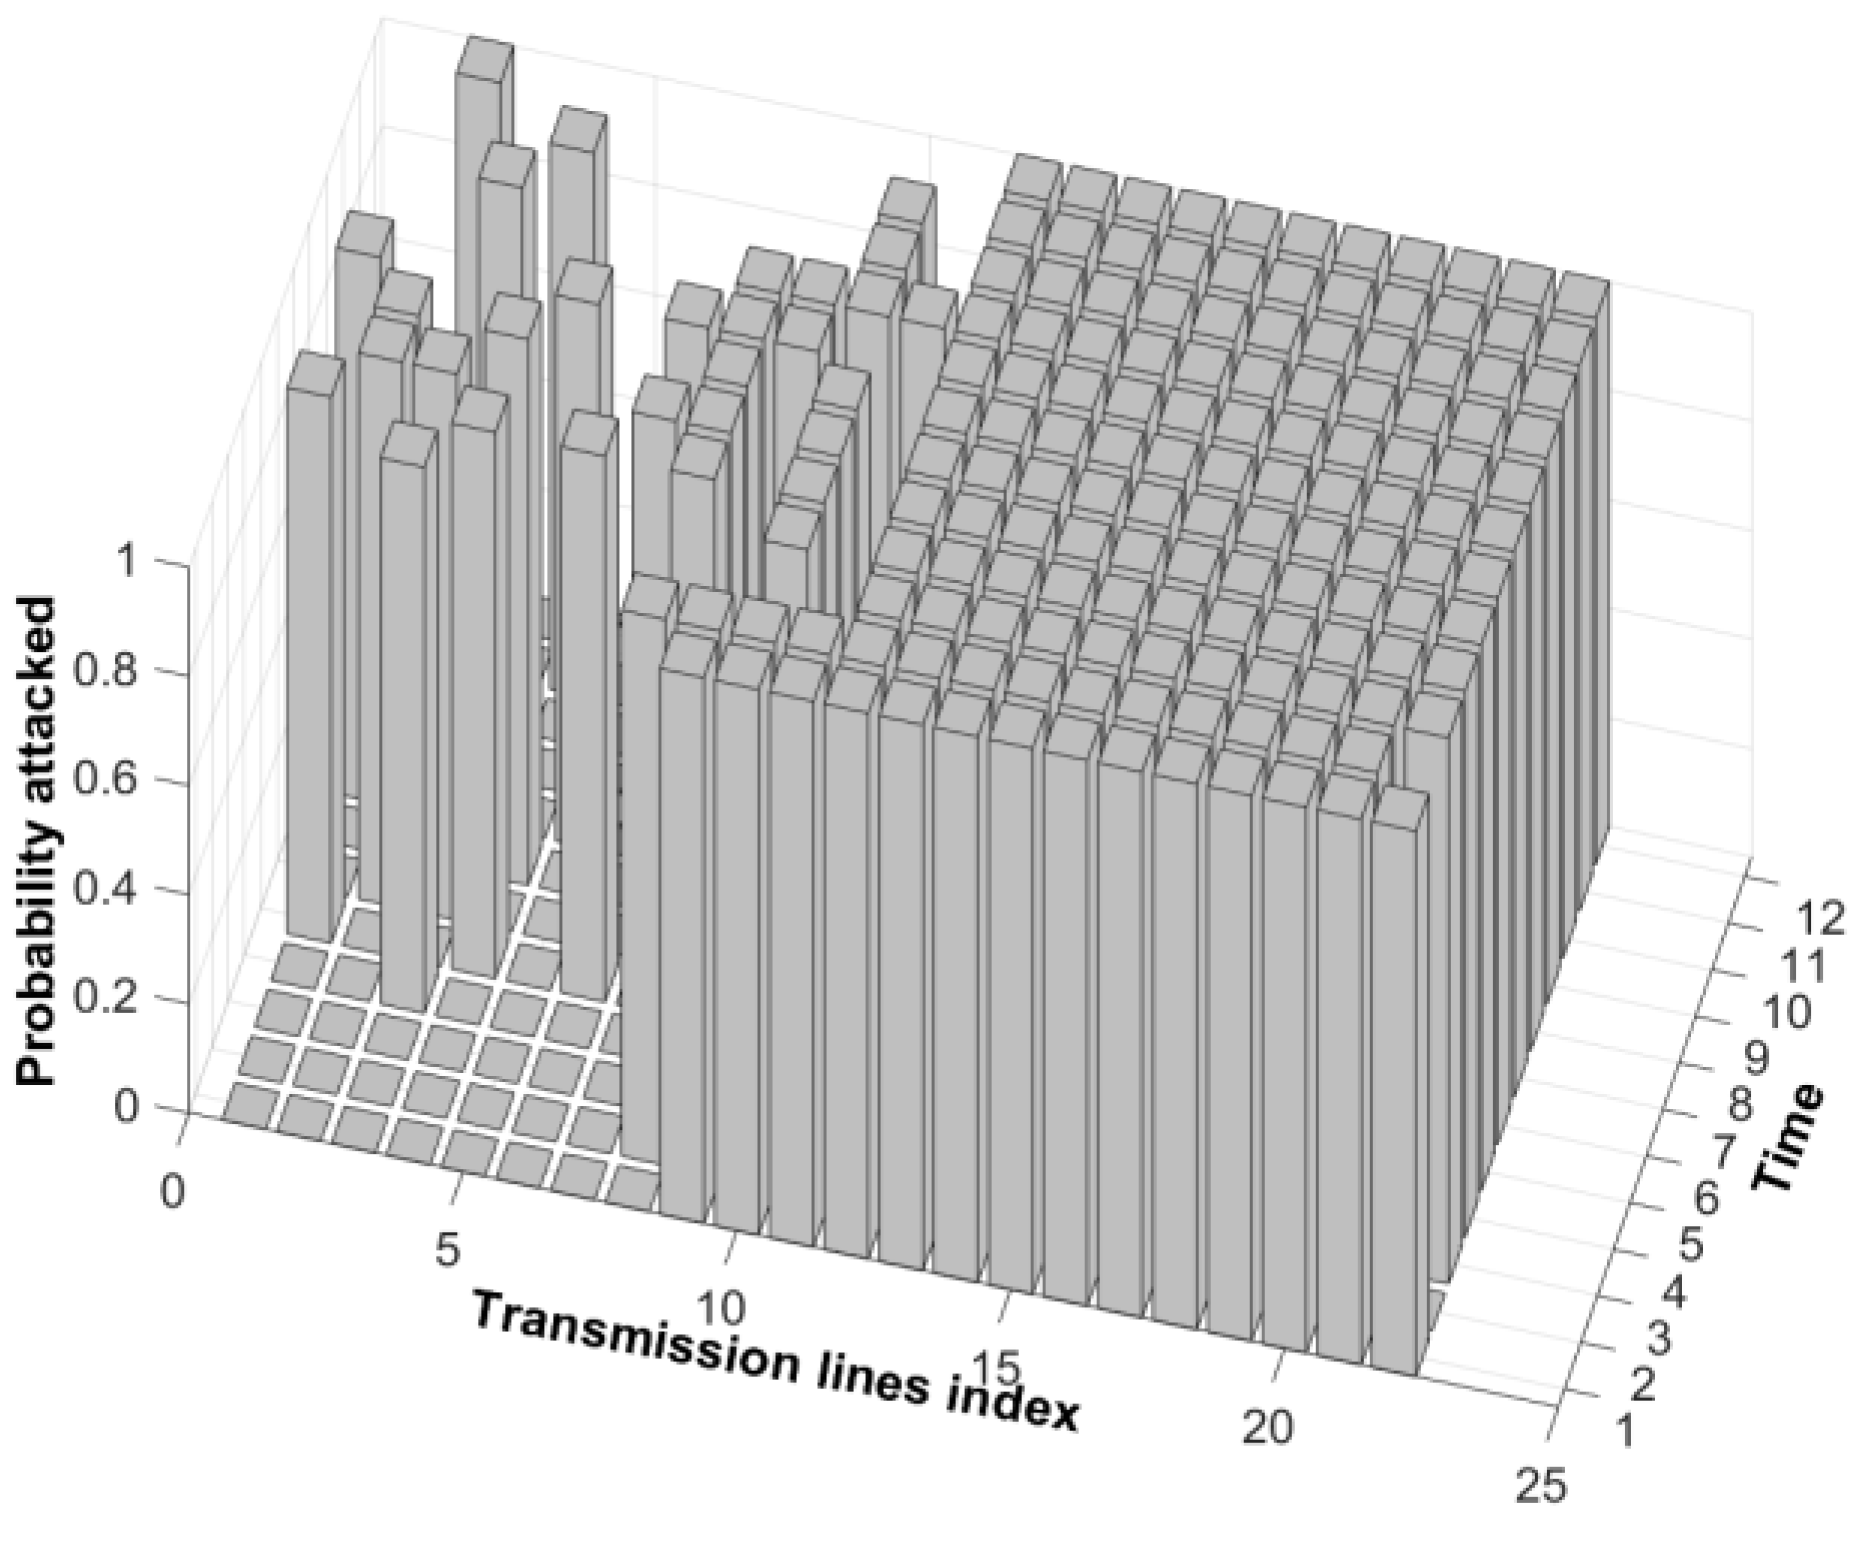
In the first simulation, the real-world load data injected came from time zero in New York State on 7 June 2020. The specific load data are shown in Ref. []. Specifically, the corresponding relationship between load buses with system buses is referred to in Ref. []. The real-world load data are injected at 2 h intervals. When injecting the real-world load data, the convergence rate of EXP3 is also reasonably fast, and the number of iterations is 173. In the end, all of the NE robust solutions are acquired, which are depicted in Figure 4.
Figure 4. The robust NE solution to restructure the transmission lines in Lp for the IEEE 14-bus power system.
In Figure 4, the numbers on the time axis represent the time, i.e., number 1 represents time zero; number 2 represents two o’clock; number 3 represents four o’clock, and so on. The numbers on the other axis in the horizontal plane denote the indexes of links affiliated with the Lp, i.e., every number between 1 and 6 corresponds to one link index, denoting 10, 11, 16, 17, 19, and 20 in sequence. The vertical axis indicates the situation in which the line is being attacked, i.e., the number 1 denotes that the corresponding line has been attacked; the number 0 indicates that the corresponding line has not been attacked. Clearly, from Figure 4, we can see that the most likely lines to be attacked are lines 11, 17, 19, and 20. Compared with the original Lp, The 10th and 16th lines are removed. Lp is reconstructed, which accurately locks the target of the resourceful and sophisticated attacker. The reconstructed set of protected transmission lines is Lp = {11, 17, 19, 20}.

5.1.2. New Lp Reconstructed for the IEEE 30-Bus System

For the IEEE 30-bus power system, the approach and process of computing the robust NE solutions are similar to those for the IEEE 14-bus power system. We consider N D and N A as 8 and 22, respectively. Specifically, besides d 0 , the detailed information regarding the remaining MTD strategies considered is as follows:   d 1 = [ 4 ] , d 2 = [ 4 , 7 ] , d 3 = [ 4 , 7 , 9 ] , d 4 = [ 4 , 7 , 9 , 10 ] , d 5 = [ 4 , 7 , 9 , 10 , 14 , 18 ] , d 6 = [ 4 , 7 , 9 , 10 , 14 , 18 , 24 , 26 , 28 ] , and d 7 = [ 4 ,   7 ,   9 ,   10 ,   14 ,   18 ,   24 ,   26 ,   28 ,   29 ,   37 ,   41 ] . In addition to a 0 , based on Lp, we assign the attacker’s strategies as follows: a 1 = [ 7 ] , a 2 = [ 17 ] ,   a 3 = [ 18 ] ,   a 4 = [ 21 ] ,   a 5 = [ 22 ] ,   a 6 = [ 24 ] ,   a 7 = [ 7 , 17 ] ,   a 8 = [ 7 , 18 ] ,   a 9 = [ 7 , 21 ] ,   a 10 = [ 7 , 22 ] ,   a 11 = [ 7 , 24 ] ,   a 12 = [ 17 , 18 ] ,   a 13 = [ 17 , 21 ] ,   a 14 = [ 17 , 22 ] ,   a 15 = [ 17 , 24 ] ,   a 16 = [ 18 , 21 ] ,   a 17 = [ 18 , 22 ] ,   a 18 = [ 18 , 24 ] ,   a 19 = [ 21 , 22 ] ,   a 20 = [ 21 , 24 ] ,   a 21 = [ 22 , 24 ] . There are six generators in the IEEE 30-bus system. All of the generators’ capacities are G m a x = 300 , 1600 , 300 , 400 ,   and   350   MW   and   c i = 20 , 30 , 40 , 50 , 35 ,   and   30   USD / MWh , respectively.
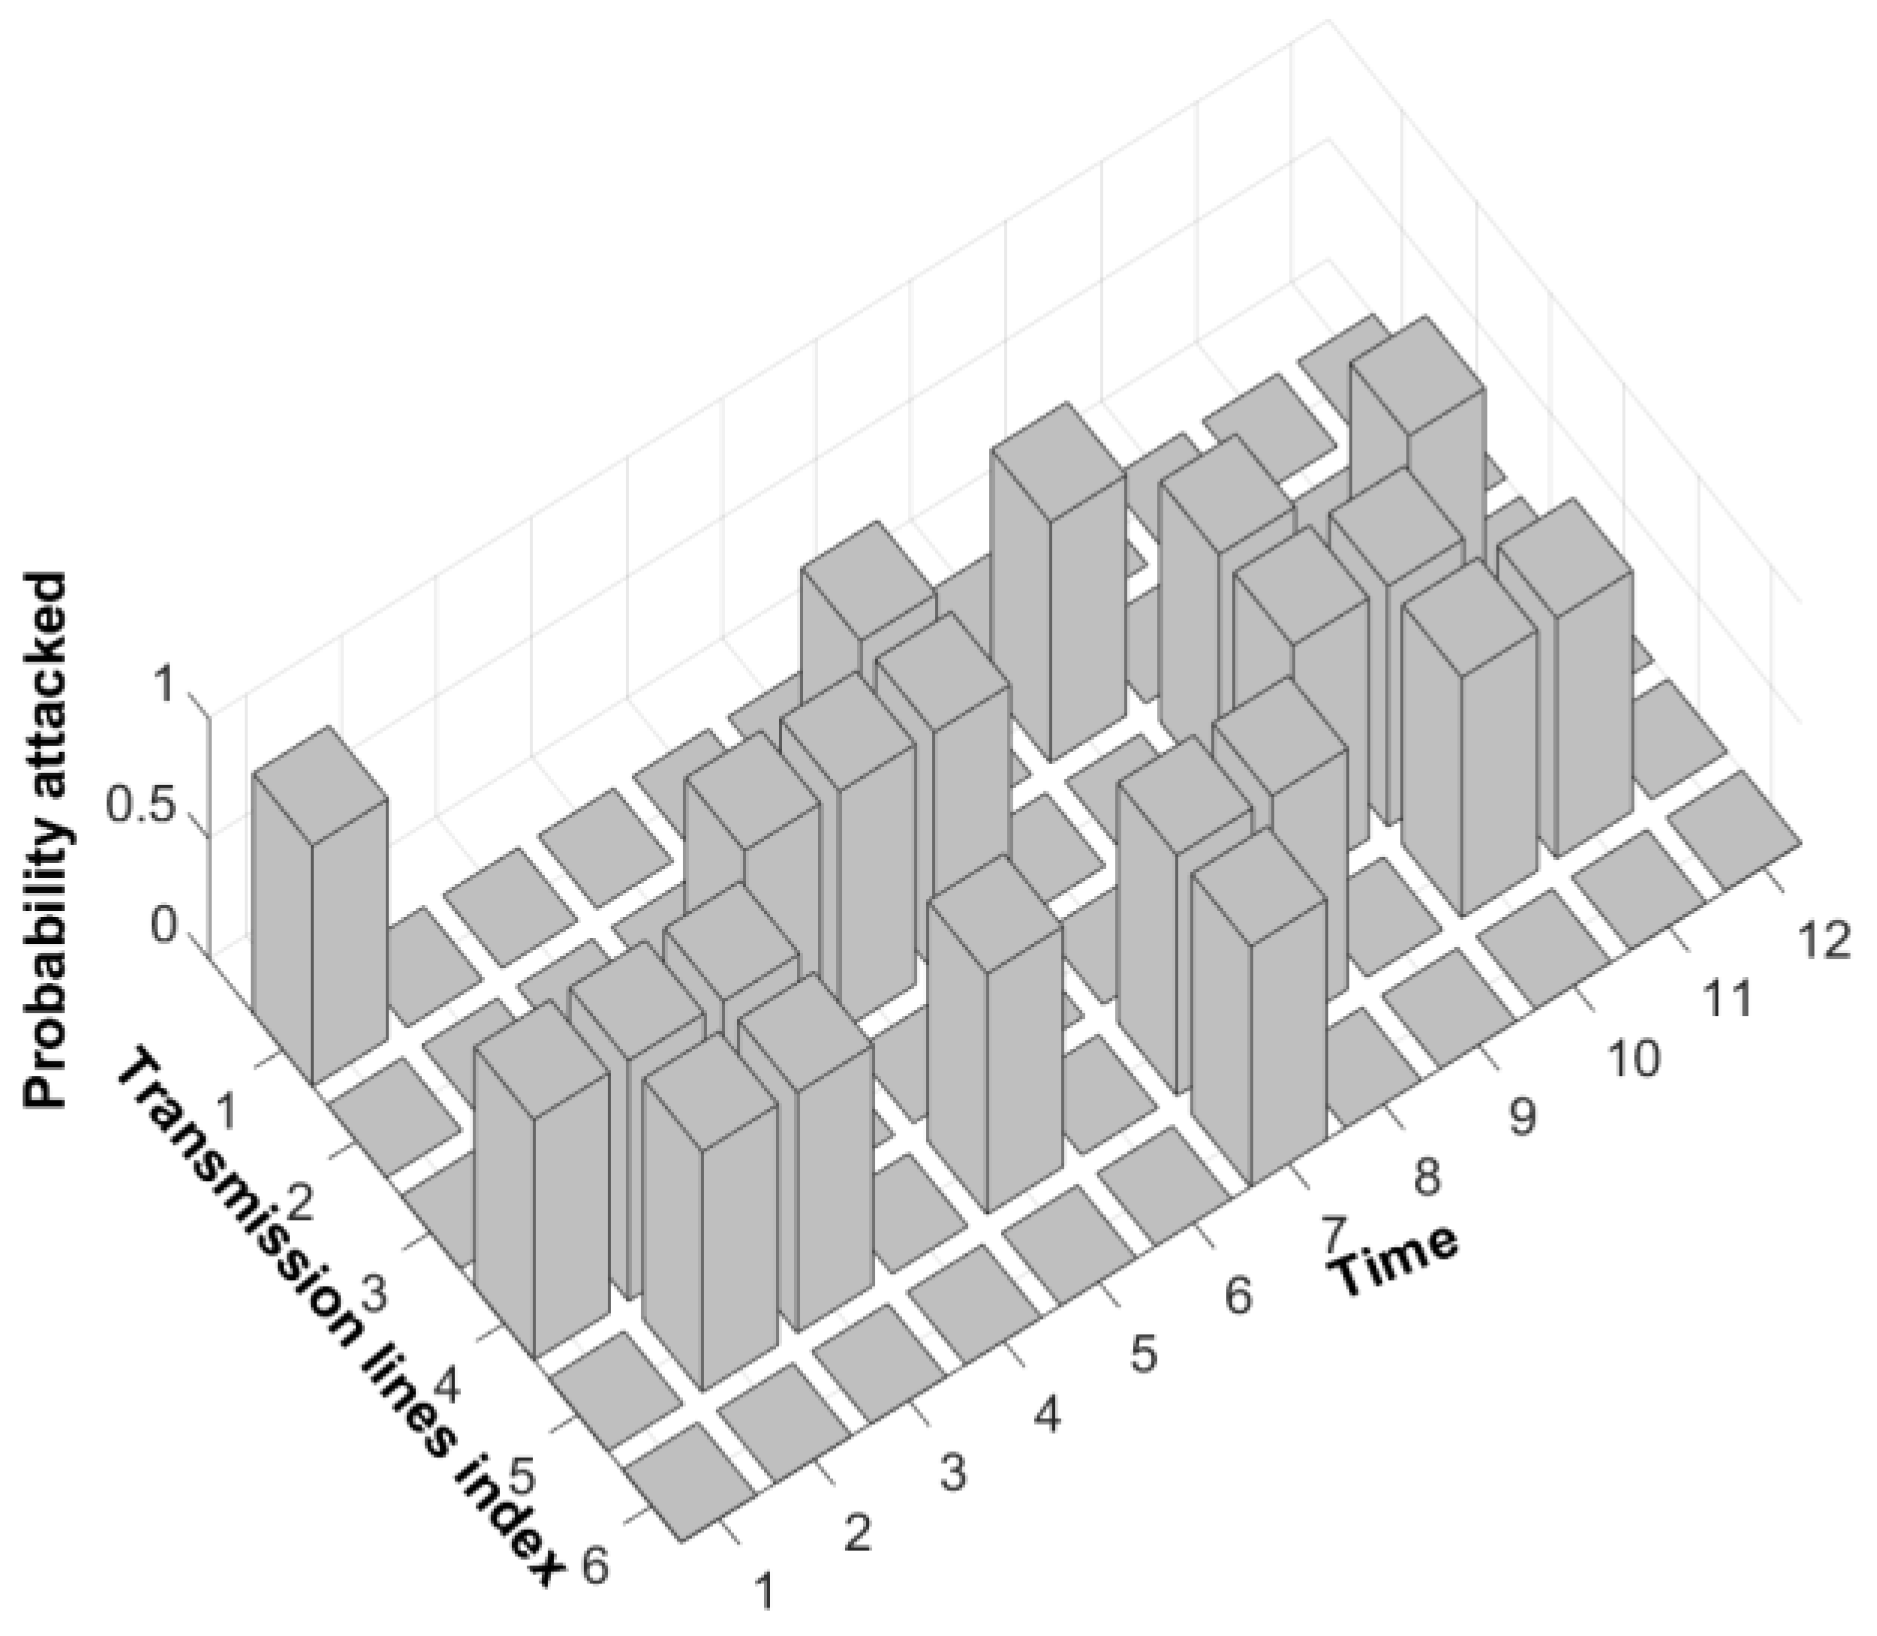
The maximal power flow, f m a x , is 160 MW for link 1 and 60 MW for all other links. The operational factors in the EXP3 algorithm are invariant, γ t = β t = 0 ,   η t = 0.01 . As in the case above, the real-world load data at different times are injected into the game model to compute every robust NE solution in sequence. All of the solutions are presented in Figure 5. In Figure 5, the meaning of the numbers on the three axes remains basically unchanged. One difference is that the numbers on the axis marked as “transmission lines index” indicate different lines, i.e., numbers 1, 2, 3, 4, 5, and 6 refer to the 7th, 17th, 18th, 21st, 22nd, and 24th lines in the IEEE 30-bus system.
Figure 5. The robust NE solution to restructure the transmission lines in Lp for the IEEE 30-bus power system.
Figure 5 shows that the reconstructed set of protected transmission lines should be {17, 18, 21, 22}. Similarly, the target of the resourceful and sophisticated attacker is accurately locked, which reduces the expenditure of the defender in the context of the deployment of D-FACTS devices.

5.1.3. New Lp Reconstructed for the IEEE 118-Bus System

For the IEEE 118-bus power system, according to the successful results of the above two cases, we consider the number of transmission lines tripped in every attack strategy to be only one. We consider N D and N A as 14 and 23, respectively. Specifically, besides d 0  the detailed information regarding the remaining MTD strategies considered is as follows: d 1 = [ 2 , 3 , 6 ] ,   d 2 = [ 2 , 3 , 6 , 8 , 11 , 12 ] , d 3 = [ 2 , 3 , 6 , 8 , 11 , 12 , 17 , 21 , 24 ] , d 4 = [ 2 , 3 , 6 , 8 , 11 , 12 , 17 , 21 , 24 , 26 , 30 , 32 ] ,   d 5 = [ 2 , 3 , 6 , 8 , 11 , 12 , 17 , 21 , 24 , 26 , 30 , 32 , 40 , 43 , 46 ] , d 6 = [ 2 , 3 , 6 , 8 , 11 , 12 , 17 , 21 , 24 , 26 , 30 , 32 , 40 , 43 , 46 , 50 , 51 , 55 ] , d 7 = [ 2 , 3 , 6 , 8 , 11 , 12 , 17 , 21 , 24 , 26 , 30 , 32 , 40 , 43 , 46 , 50 , 51 , 55 , 56 , 63 , 65 ] , d 8 = [ 2 , 3 , 6 , 8 , 11 , 12 , 17 , 21 , 24 , 26 , 30 , 32 , 40 , 43 , 46 , 50 , 51 , 55 , 56 , 63 , 65 , 68 , 69 , 71 , 75 , 76 ] ,   d 9 = [ 2 , 3 , 6 , 8 , 11 , 12 , 17 , 21 , 24 , 26 , 30 , 32 , 40 , 43 , 46 , 50 , 51 , 55 , 56 , 63 , 65 , 68 , 69 , 71 , 75 , 76 , 77 , 81 , 87 , 88 , 89 , 91 ] , d 10 = [ 2 , 3 , 6 , 8 , 11 , 12 , 17 , 21 , 24 , 26 , 30 , 32 , 40 , 43 , 46 , 50 , 51 , 55 , 56 , 63 , 65 , 68 , 69 , 71 , 75 , 76 , 77 , 81 , 87 , 88 , 89 , 91 , 92 , 98 , 99 , 100 , 106 ] , d 11 = [ 2 , 3 , 6 , 8 , 11 , 12 , 17 , 21 , 24 , 26 , 30 , 32 , 40 , 43 , 46 , 50 , 51 , 55 , 56 , 63 , 65 , 68 , 69 , 71 , 75 , 76 , 77 , 81 , 87 , 88 , 89 , 91 , 92 , 98 , 99 , 100 , 106 , 112 , 113 , 115 , 117 , 119 , 121 , 124 , 127 ] , d 12 = [ 2 , 3 , 6 , 8 , 11 , 12 , 17 , 21 , 24 , 26 , 30 , 32 , 40 , 43 , 46 , 50 , 51 , 55 , 56 , 63 , 65 , 68 , 69 , 71 , 75 , 76 , 77 , 81 , 87 , 88 , 89 , 91 , 92 , 98 , 99 , 100 , 106 , 112 , 113 , 115 , 117 , 119 , 121 , 124 , 127 , 132 , 135 , 139 , 140 , 143 , 148 , 150 , 152 , 154 ] , d 13 = [ 2 , 3 , 6 , 8 , 11 , 12 , 17 , 21 , 24 , 26 , 30 , 32 , 40 , 43 , 46 , 50 , 51 , 55 , 56 , 63 , 65 , 68 , 69 , 71 , 75 , 76 , 77 , 81 , 87 , 88 , 89 , 91 , 92 , 98 , 99 , 100 , 106 , 112 , 113 , 115 , 117 , 119 , 121 , 124 , 127 , 132 , 135 , 139 , 140 , 143 , 148 , 150 , 152 , 154 , 156 , 158 , 161 , 162 , 166 , 171 , 175 , 178 ] .
In addition to a 0 , based on Lp, we assign the attacker’s strategies as follows: a 1 = [ 1 ] , a 2 = [ 2 ] , a 3 = [ 3 ] , a 4 = [ 6 ] , a 5 = [ 10 ] , a 6 = [ 12 ] , a 7 = [ 16 ] ,   a 8 = [ 17 ] ,   a 9 = [ 21 ] ,   a 10 = [ 22 ] , a 11 = [ 24 ] ,   a 12 = [ 30 ] ,   a 13 = [ 36 ] , a 14 = [ 38 ] , a 15 = [ 41 ] , a 16 = [ 54 ] , a 17 = [ 93 ] , a 18 = [ 147 ] , a 19 = [ 151 ] , a 20 = [ 161 ] , a 21 = [ 171 ] , and   a 22 = [ 172 ] .
In the IEEE 118-bus power system, there are fifty-four generators. The first six generators’ capacities are G m a x = 2000 ,   1000 ,   1000 ,   1500 ,   500 ,   and   1000   MW   and   c i = 20 ,   30 ,   40 ,   50 ,   35 ,   and   30   USD / MWh . The rest of the generators’ capacities are the same, G m a x = 500     MW and c i = 36   USD / MWh .
The maximal power flow, f m a x , is 500 MW for all links. The operational factors and the injection method with regard to the real-world load data are completely unchanged. All of the robust NE solutions are presented in Figure 6. Homoplastically, in Figure 6, the numbers on the axis marked as “transmission lines index” indicate different lines, i.e., the numbers 1, 2, 3, 4, 5, 6, 7, 8, 9, 10, 11, 12, 13, 14, 15, 16, 17, 18, 19, 20, 21, and 22 refer to the 1st, 2nd, 3rd, 6th, 10th, 12th, 16th, 17th, 21st, 22nd, 24th, 30th, 36th, 38th, 41st, 54th, 93rd, 147th, 151st, 161st, 171st, and 172nd lines in the IEEE 118-bus power system. Figure 6 indicates that the reconstructed set of protected transmission lines should be {30, 36, 38, 41, 54, 93, 147, 151, 161, 171, and 172}. The number of original protected transmission lines is 22; however, through the results of the robust NE solutions, the number of authentically protected transmission lines is greatly reduced to only 11 links, which evidently reduces the expenditure of the defender in the context of the deployment of D-FACTS devices.
Figure 6. The robust NE solution to restructure the transmission lines in Lp for the IEEE 118-bus power system.
Note that we mainly use the fmincon package during the process of computing the robust NE solutions. For a large-scale power system, i.e., the IEEE 118 system, it is non-trivial to make sure that a feasible solution can be invariably acquired in every iteration with the fmincon package and the convergence of the EXP3 algorithm. Therefore, for the IEEE 118-bus power system, we consider using the relaxed constraints during the process of computing the NE solutions.

5.1.4. Analysis of the Results of the New Lp Reconstructed

The detailed results of the reconstruction of the protected transmission lines are shown in Table 3 as follows. In Table 3, after reconstruction, the number of protected transmission lines is small. Moreover, the larger the system size, the more significant the effect is. In the IEEE 118-bus power system, the number of original required transmission lines is 22, and the number of required lines in the new system is only 11. Although the number of required lines is small, all remaining lines are the main targets for resourceful and sophisticated attackers who do not randomly select their targets. So, on the basis of defense effectiveness, the number of required lines is small, which facilitates the better deployment of D-FACTS devices and will improve operational costs.
Table 3. The two sets of protected transmission lines before reconstruction and after reconstruction.

5.2. Optimal Deployment of D-FACTS Devices and Analysis of the Results

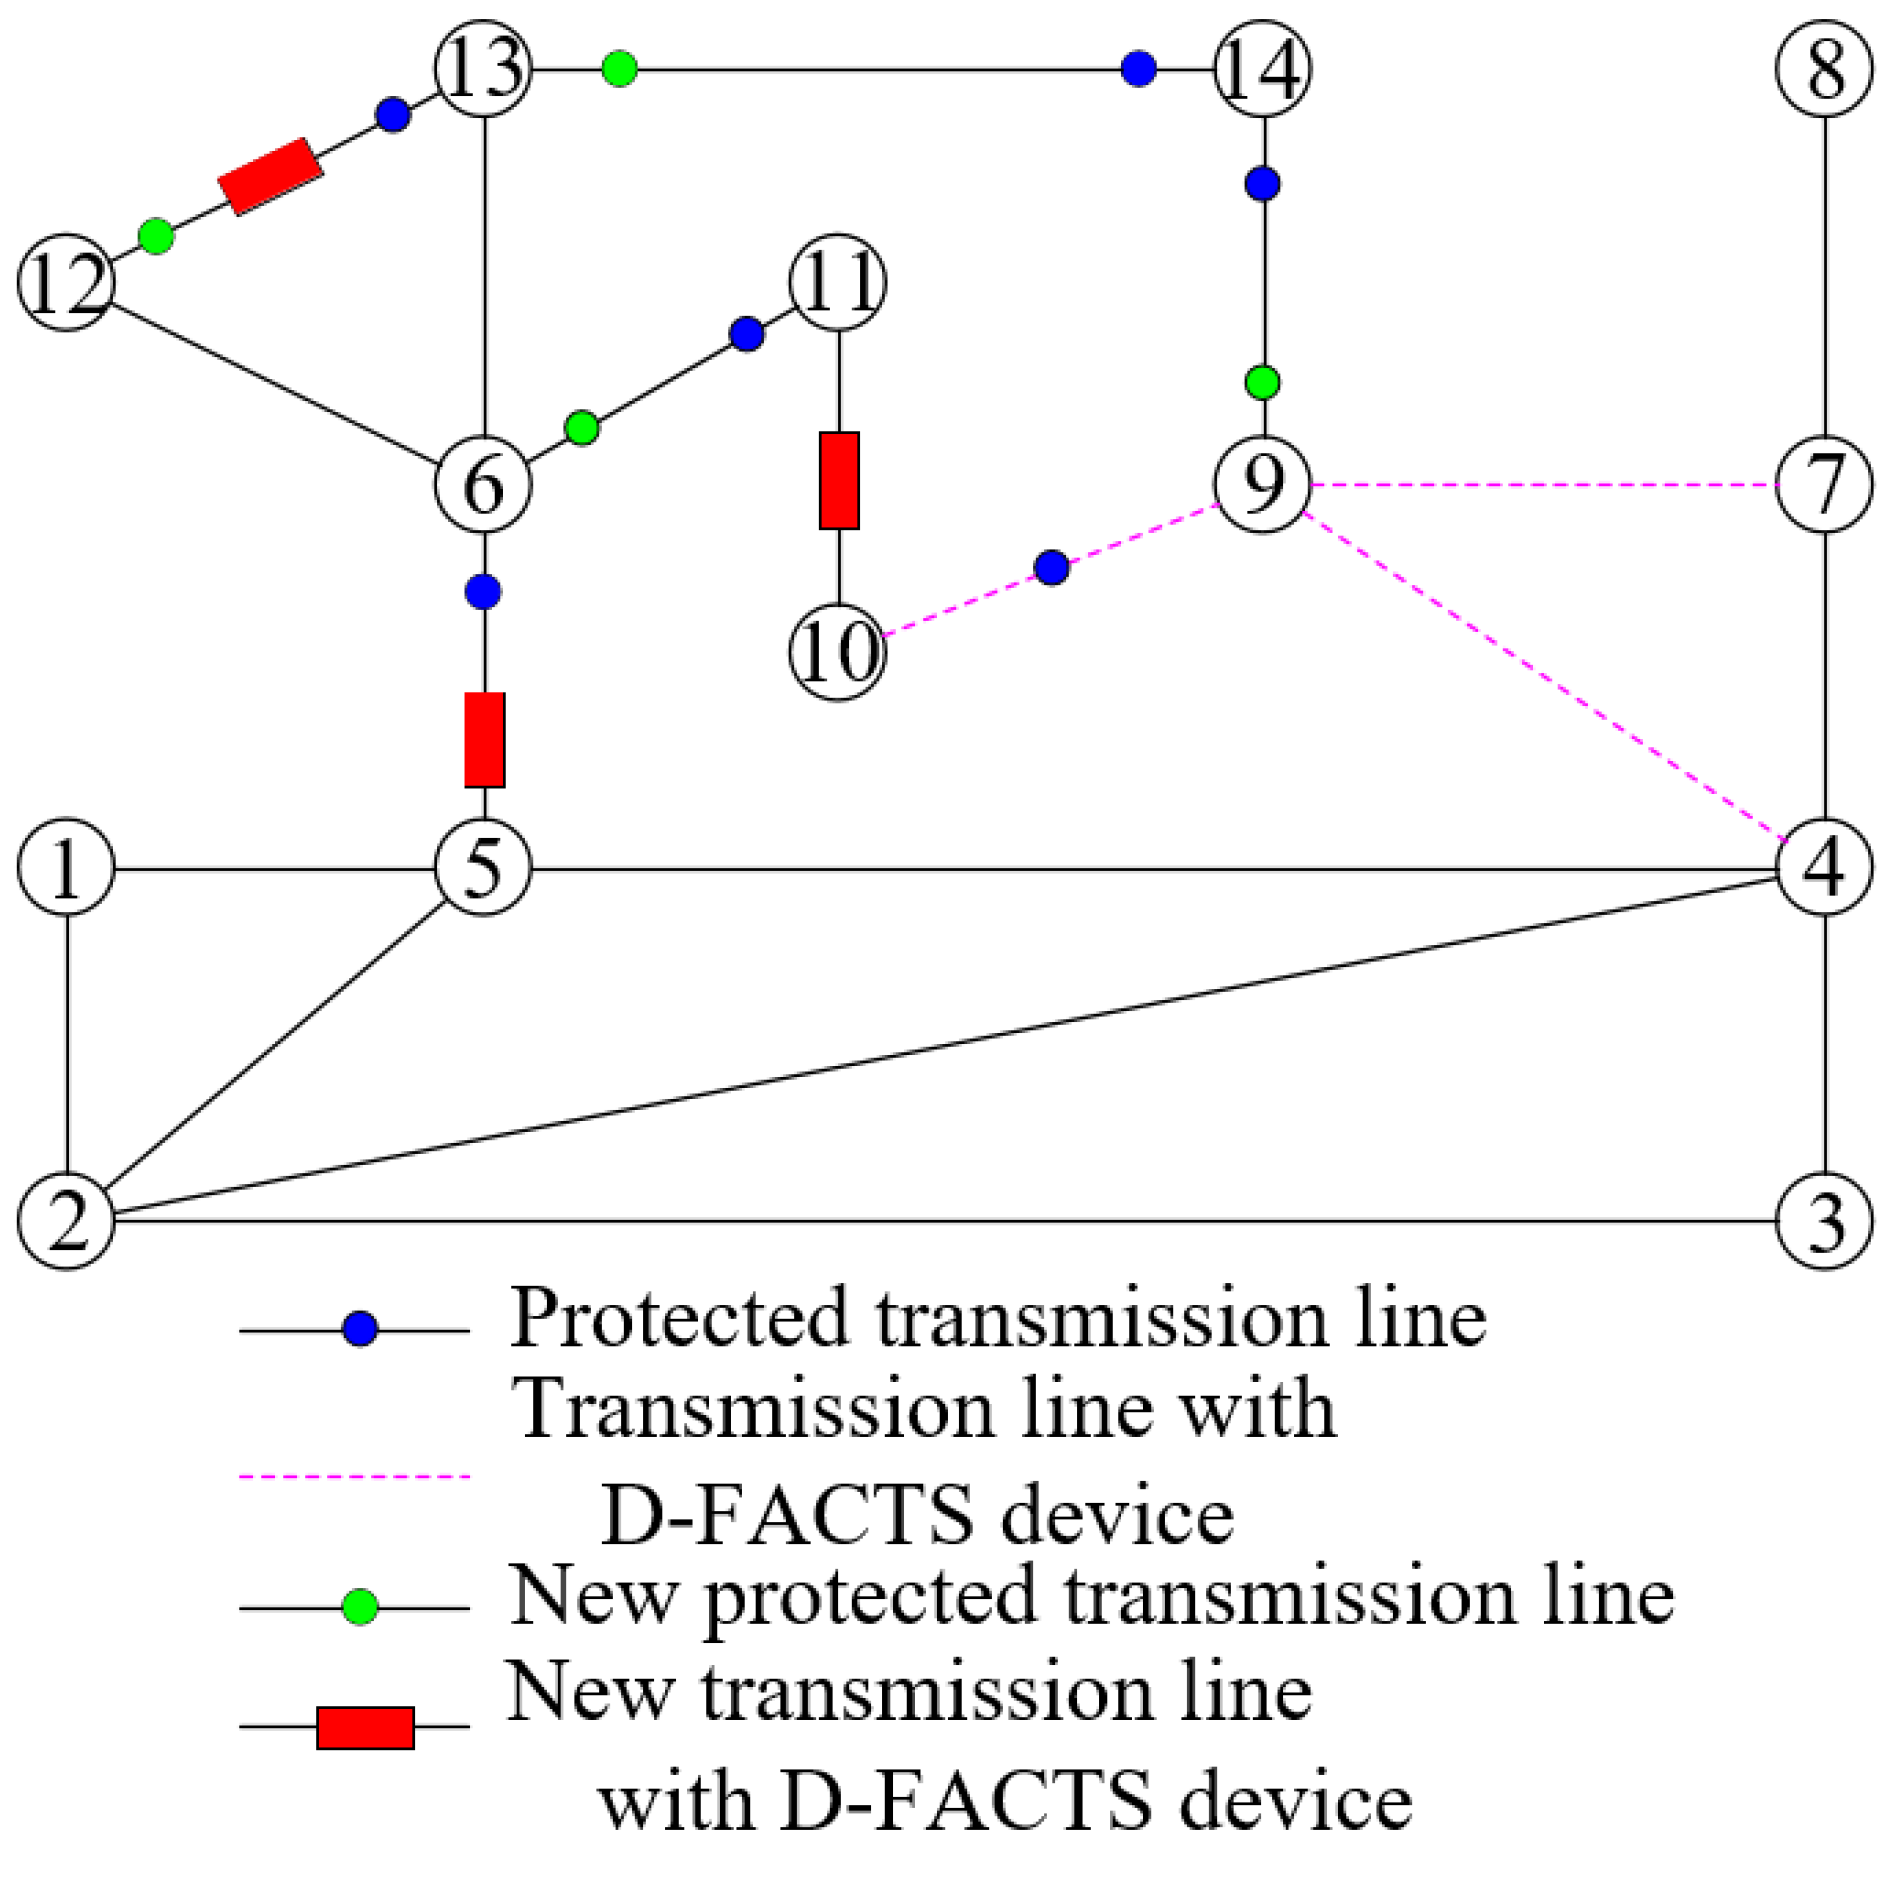
For the IEEE 14-bus system, the new set of the protected lines, Lp, is {11, 17, 19, 20}, as depicted in Figure 7. In Figure 7, the new protected transmission lines are represented by red circles. The covered buses, shown as N P , are N P = { 6 ,   9 ,   11 ,   12 ,   13 ,   14 } . According to the old algorithm, the buses in   N P and the transmission lines in P * = { { 6 , 11 } , { 6 , 12 } , { 6 , 13 } , { 12 , 13 } , { 13 , 14 } , { 9 , 14 } } form a subgraph G P . In G P , a spanning tree T = { { 6 , 11 } , { 6 , 12 } , { 6 , 13 } , { 9 , 14 } , { 13 , 14 } } may be obtained, then = { { 12 , 13 } } . So, ˜ * = { { 12 , 13 } } is acquired, and the output set is ˜ = { { 5 , 6 } , { 10 , 11 } , { 9 , 10 } , { 4 , 9 } , { 7 , 9 } } . The border bus denoted in the old algorithm is bus 9 and ˜ = { { 9 , 10 } , { 4 , 9 } , { 7 , 9 } } . In the end, ˜ * = { { 12 , 13 } , { 5 , 6 } , { 10 , 11 } } is computed, then ˜ o = ˜ * , in which the transmission lines are deployed with D-FACTS devices. The minimum number of required D-FACTS devices is three. In Figure 7, based on the original set of protected lines, the transmission lines requiring D-FACTS devices are {{4, 9},{7, 9},{9, 10}}. The minimum number of required D-FACTS devices is also three. Due to the IEEE 14-bus power system being small, the new approach does not seem to have any advantage, and the process seeking the results of the deployment of D-FACTS devices relies on the old algorithm. However, once the power system is large-scale, the situation will be completely different.
Figure 7. The two optimal deployments of D-FACTS devices with the IEEE 14-bus power system.
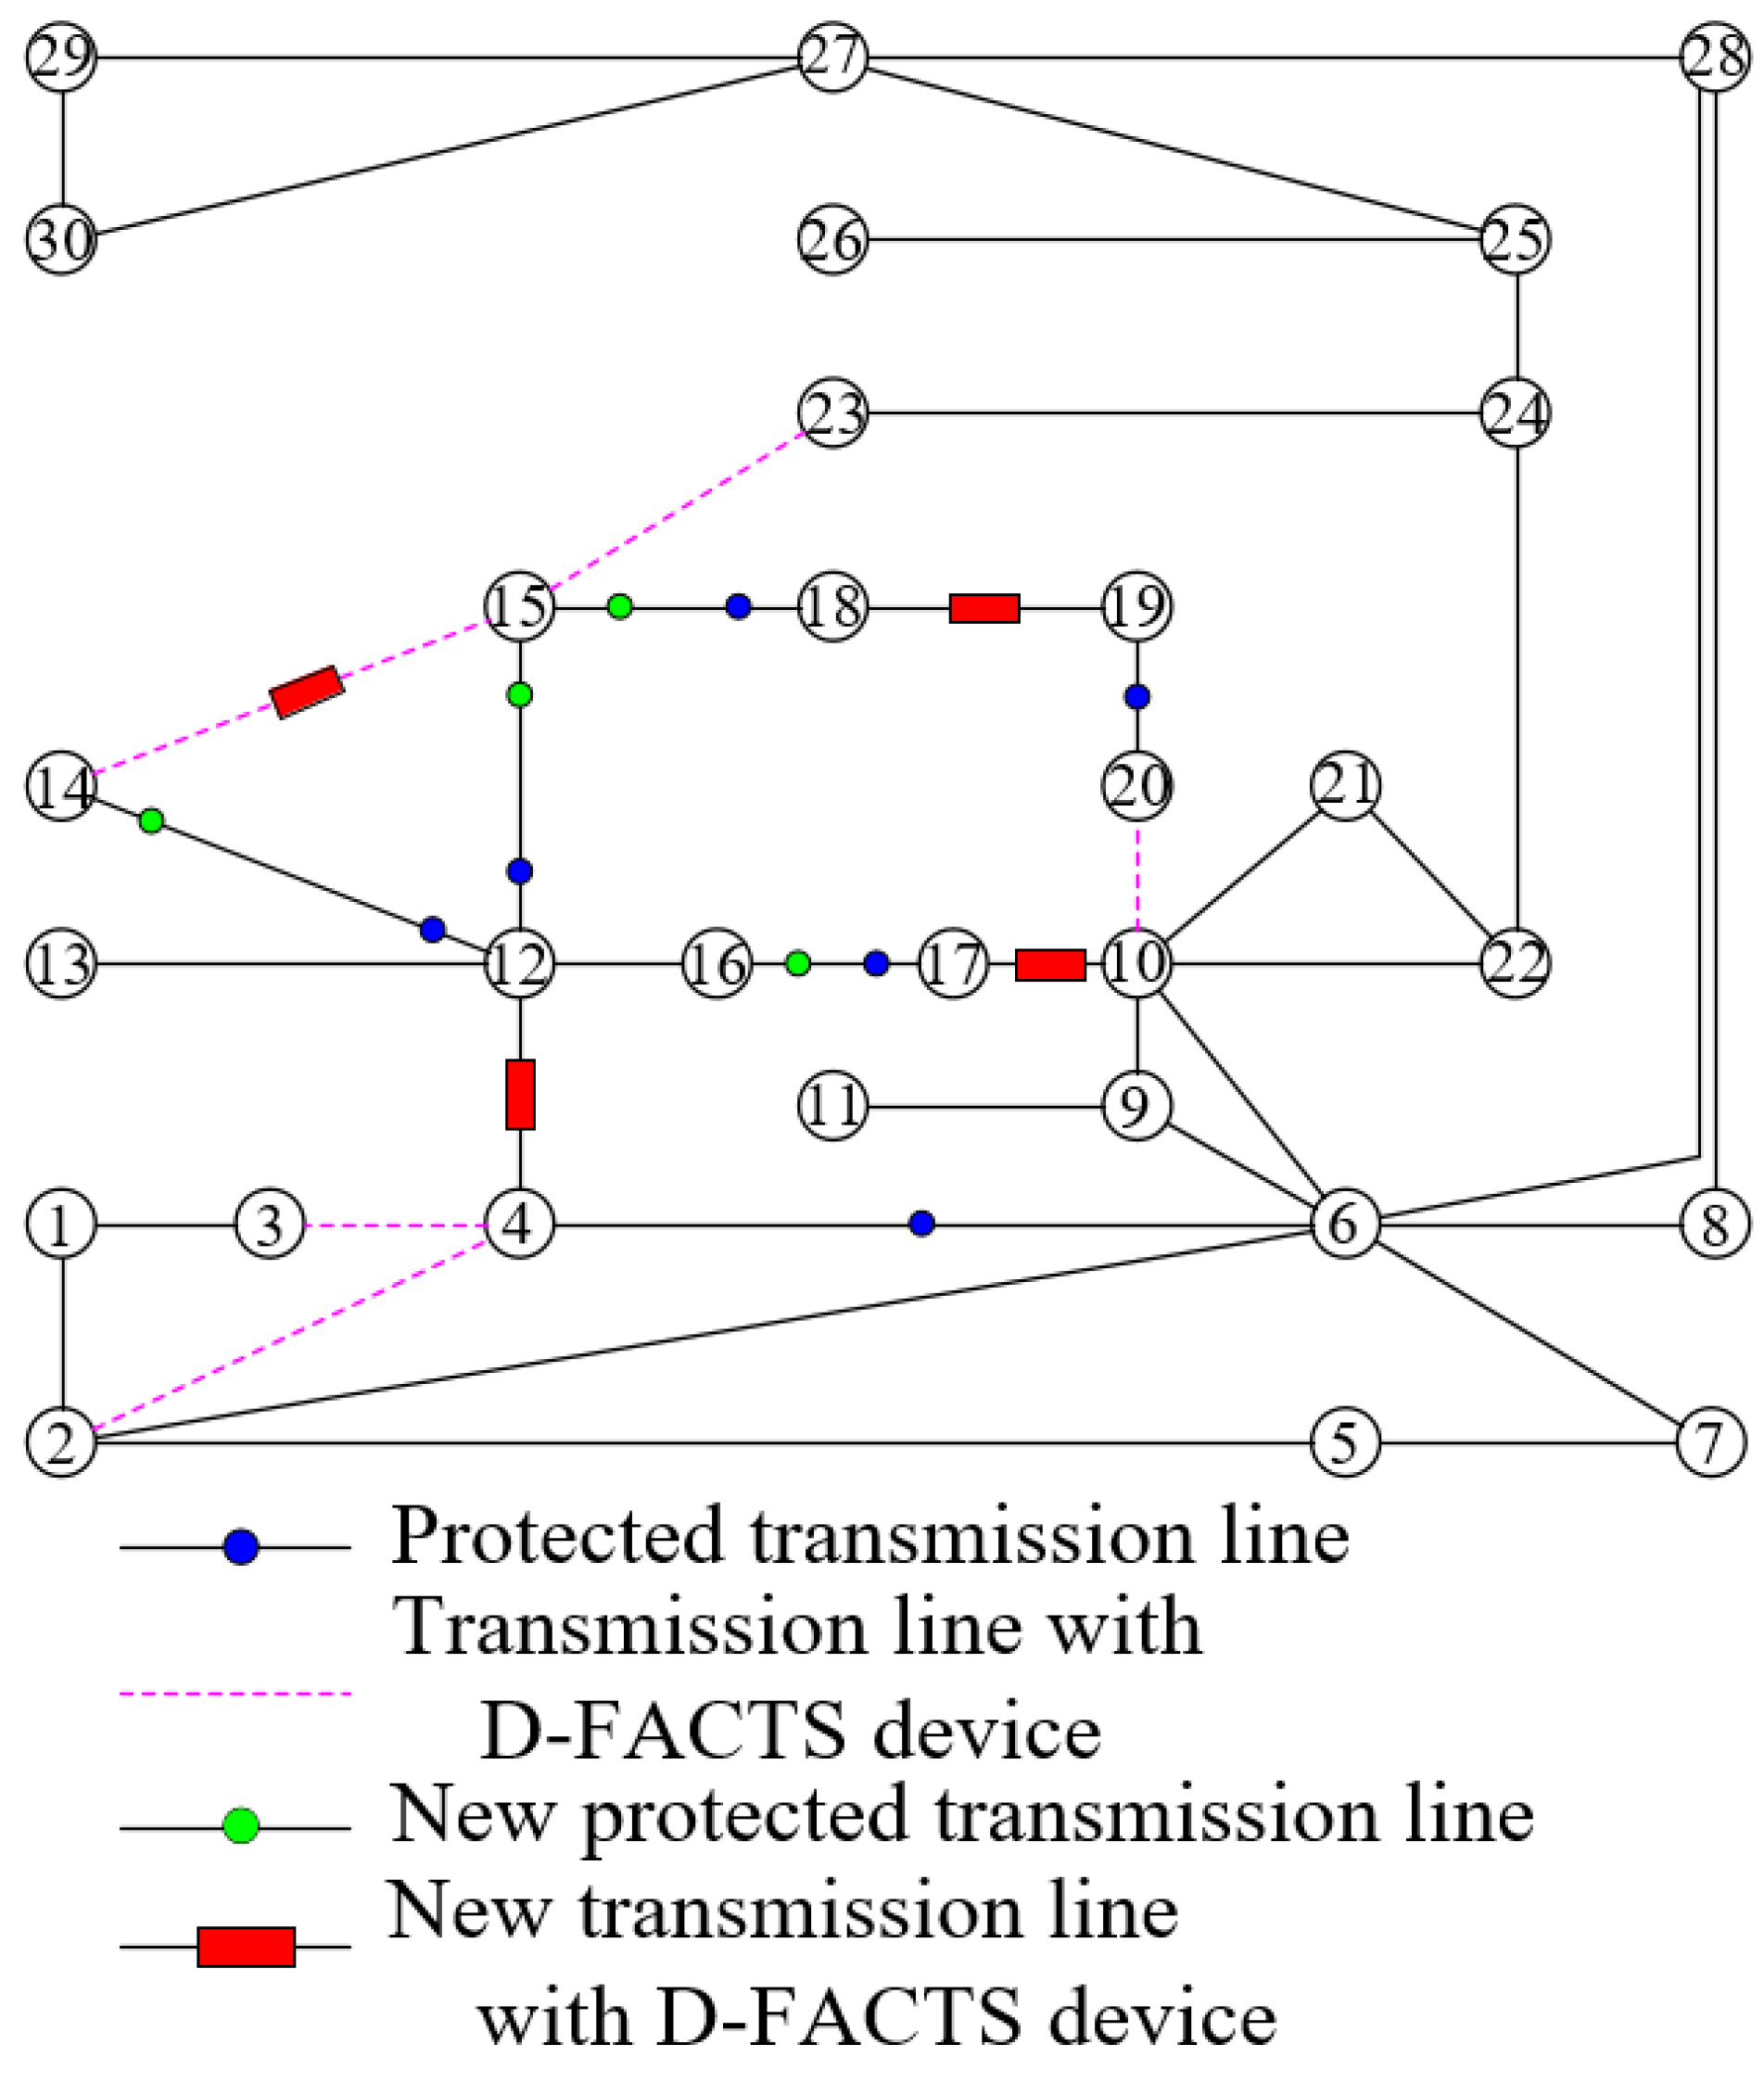
For the IEEE 30-bus power system, the new set of protected transmission lines, Lp, is {17,18,21,22}, as depicted in Figure 8. The covered buses, shown as N P , are N P = { 12 , 14 , 15 , 16 , 17 , 18 } . A subgraph G P is formed with the buses in N P and transmission lines in P * = { { 12 , 14 } , { 12 , 15 } , { 14 , 15 } , { 15 , 18 } , { 12 , 16 } , { 16 , 17 } } . In G P , a spanning tree T = { { 12 , 14 } , { 12 , 15 } , { 12 , 16 } , { 16 , 17 } , { 15 , 18 } } may be selected, then = { { 14 , 15 } } . So, ˜ * is confirmed, depicted as { { 14 , 15 } } . The output set is ˜ = { { 4 , 12 } , { 12 , 13 } , { 15 , 23 } , { 18 , 19 } , { 10 , 17 } } and the set of cut lines in ˜ is C = { { 12 , 13 } } . Then, there is a question to be considered. From Figure 8, based on the old algorithm, the border bus is bus 12. However, the line {{12, 13}} is a cut line, and a D-FACTS device does not need to be deployed on it, so this line should not be considered. Therefore, there are four schemes for confirming the border bus. Buses 12, 15, 17, and 18 are all likely to be the border bus. The old algorithm is powerless to confirm the bus. Meanwhile, the border bus is easily determined based on the proposed algorithm in this paper. Through separately examining the weights of the four lines, which are {{4, 12}}, {{15, 23}}, {{18, 19}} and {{17, 10}}, respectively, we can finally confirm that bus 15 is selected as the border bus due to the minimum weight in {{15, 23}}. Next, it is easy to determine ˜ = { { 15 ,   23 } } and ˜ * = { { 14 , 15 } , { 4 , 12 } , { 18 , 19 } , { 10 , 17 } } . According to the old algorithm, there is also an intractable question since the numbers for both the set ˜ * and Lp is four. How do we achieve the suitable deployment of D-FACTS devices? Similarly, after computing the sum of the line weights in the above two sets, we confirm that the suitable set of transmission lines requiring D-FACTS devices is ˜ * due to the sum of the weights corresponding to ˜ * being bigger, and thus ˜ o = ˜ * . Clearly, the new algorithm proposed in this paper is more comprehensive than the old algorithm. In particular, we can also guarantee both defense effectiveness and operational costs.
Figure 8. The two optimal deployments of D-FACTS devices with the IEEE 30-bus power system.
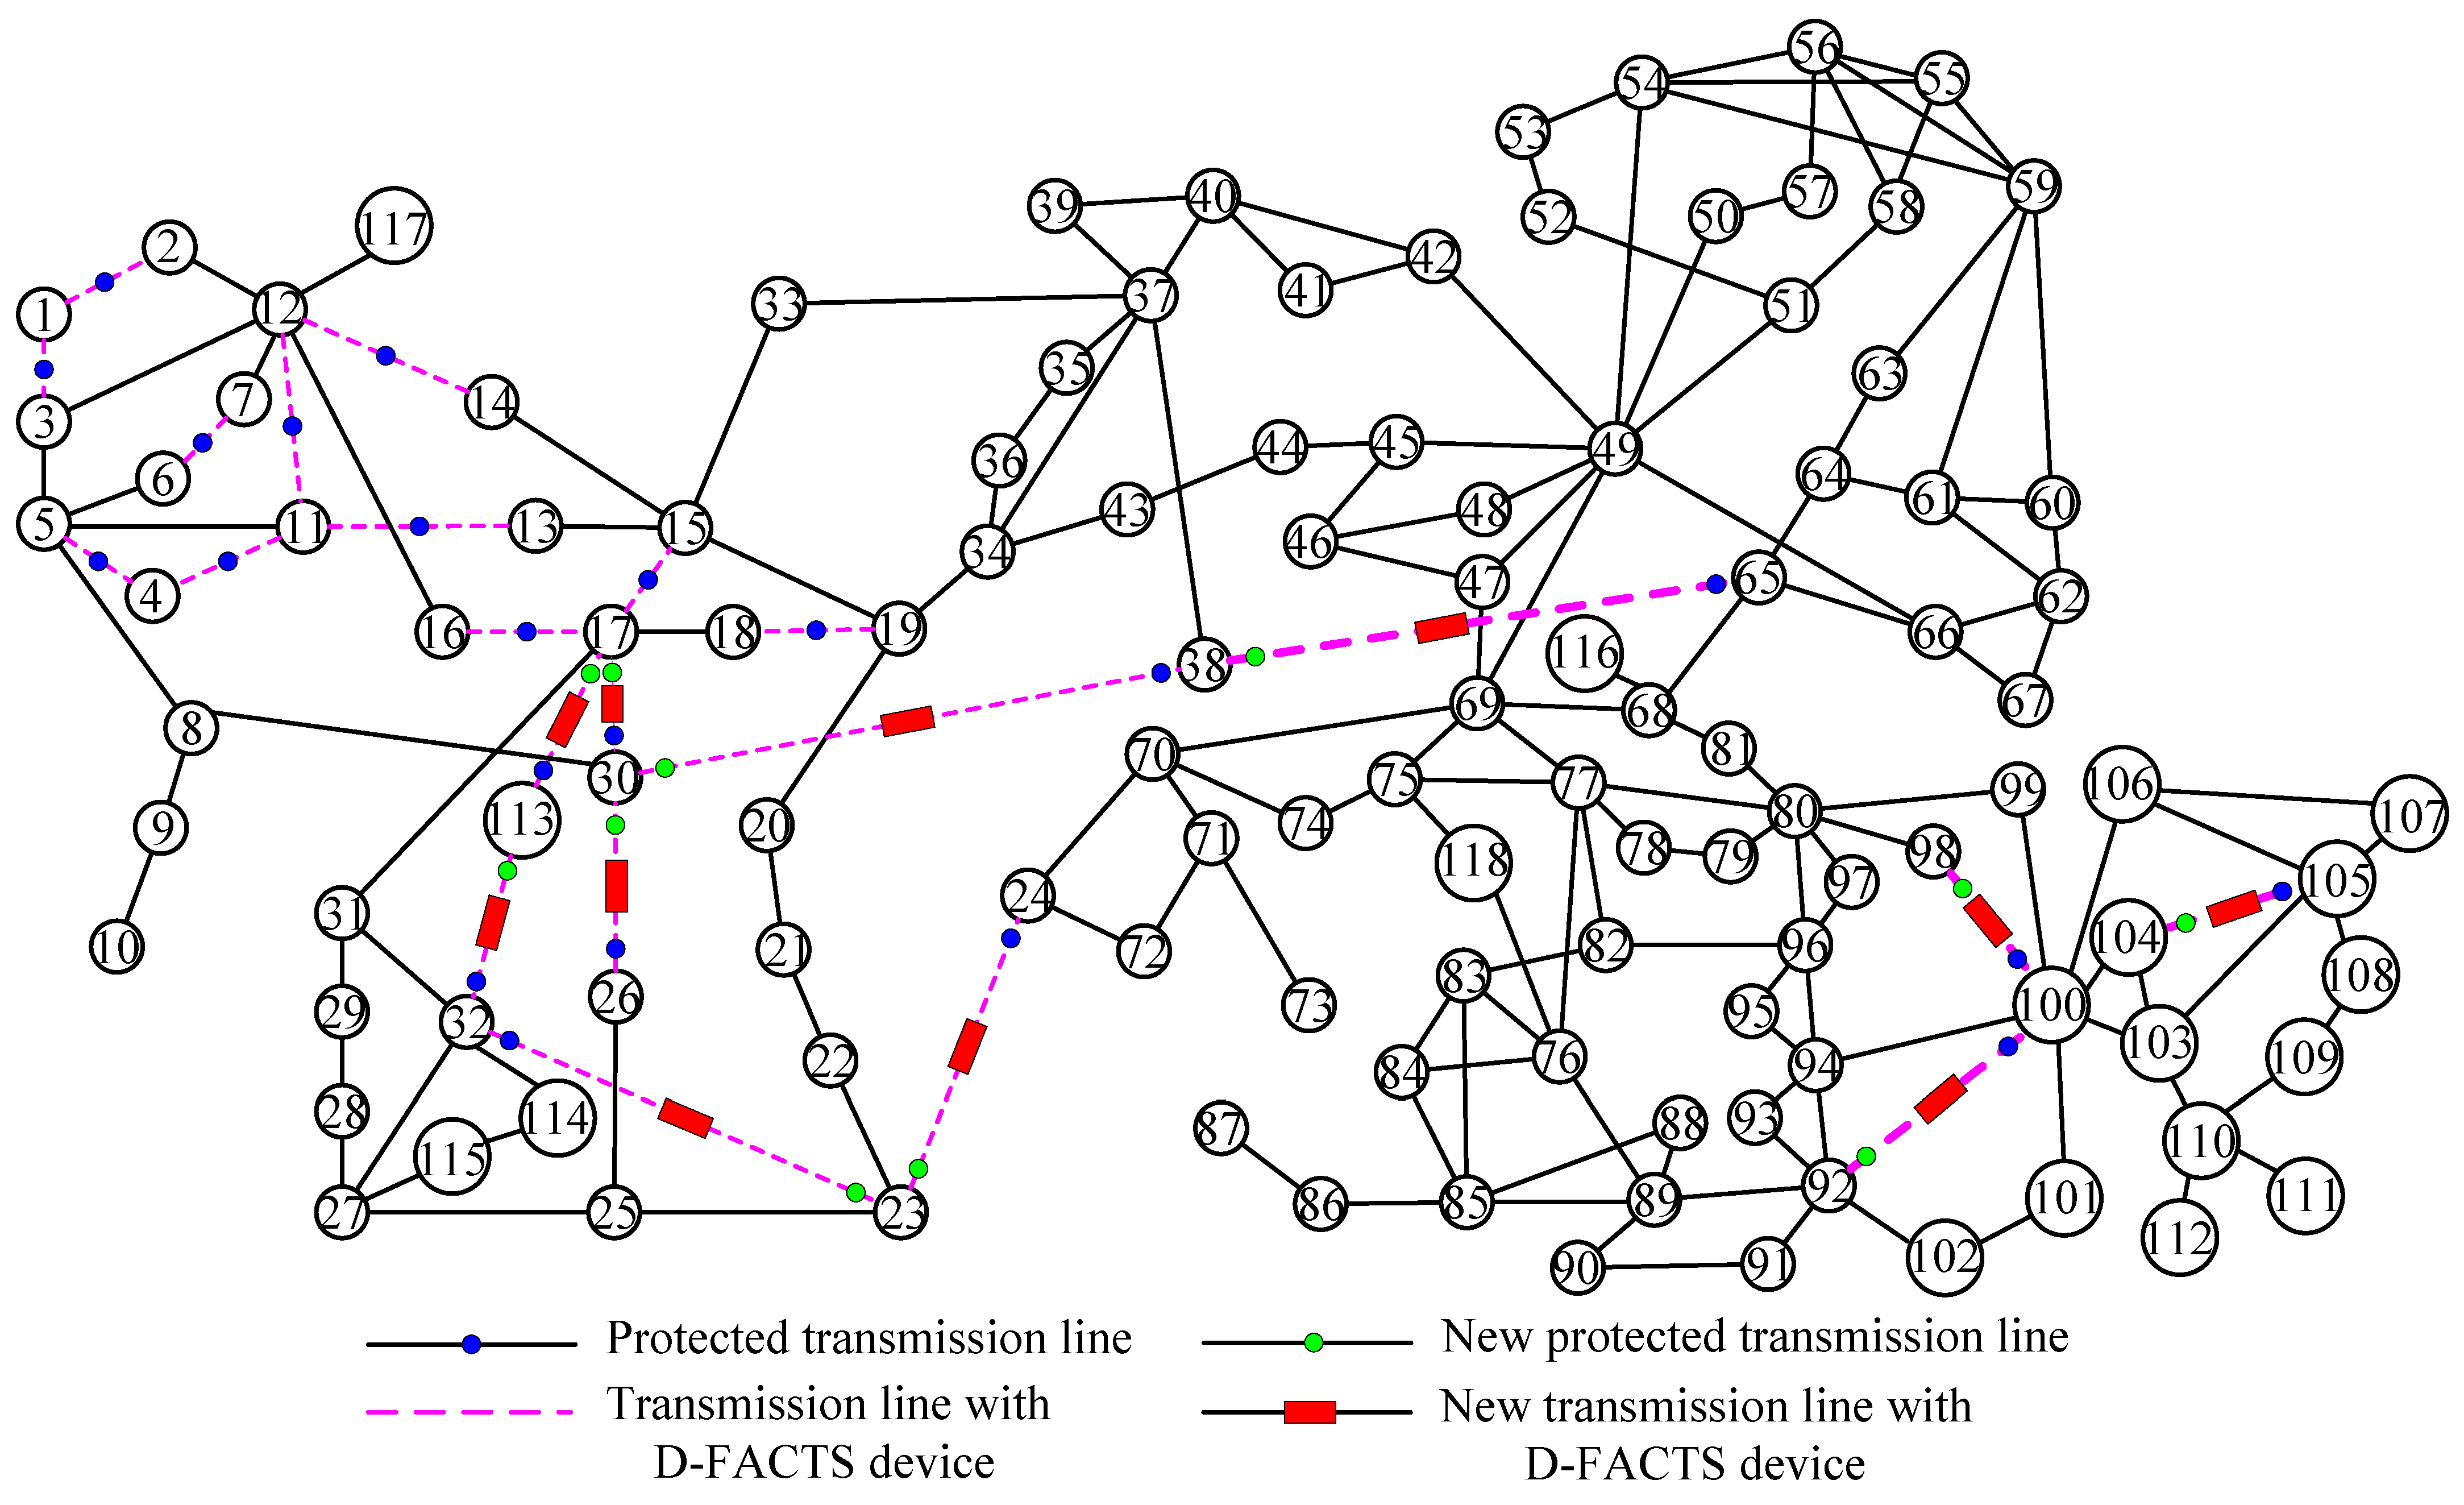
For the more large-scale IEEE 118-bus power system, the approach toward the reconstruction of the specific protected transmission lines and the proposed algorithm in our work is more powerful. In Figure 9, the new set of protected transmission lines is {30, 36, 38, 41, 54, 93, 147, 151, 161, 171, 172}. The covered buses are N P = { 17 ,   23 ,   24 ,   26 ,   30 ,   32 ,   38 ,   65 ,   92 ,   98 ,   100 ,   104 ,   105 ,   113 } . The two subgraphs G P 1   a n d   G P 2 are formed by N P and transmission lines P * = { { 17 , 113 } , { 113 , 32 } , { 17 , 30 } , { 26 , 30 } , { 23 , 32 } , { 23 , 24 } , { 30 , 38 } , { 38 , 65 } , { 92 , 100 } , { 98 , 100 } , { 100 , 104 } , { 104 , 105 } } . The following steps are carried out according to the new algorithm. In G P 1 , G P 1 is just a spanning tree and 1 is a null set. So, ˜ 1 * is also a null set. ˜ 1 = { { 31 , 32 } , { 32 , 114 } , { 27 , 32 } , { 15 , 17 } , { 16 , 17 } , { 17 , 18 } , { 17 , 31 } ,   { 23 , 25 } , { 25 , 26 } , { 24 , 70 } , { 24 , 72 } , { 37 , 38 } , { 64 , 65 } , { 65 , 66 } , { 65 , 68 } , { 22 , 23 } } and the set C 1 ={} are known. In G P 1 , the border bus is bus 17, and the set ˜ 1 = { { 15 , 17 } , { 16 , 17 } , { 17 , 18 } , { 17 , 31 } } is obtained. The set ˜ 1 * = { { 31 , 32 } , { 32 , 114 } , { 27 , 32 } , { 23 , 25 } , { 25 , 26 } , { 24 , 70 } , { 24 , 72 } , { 37 , 38 } , { 64 , 65 } , { 65 , 66 } , { 65 , 68 } , { 22 , 23 } } , and it cardinality is 12; nevertheless, the number for the set P 1 is 8, so the set ˜ 1 o = P 1 is confirmed. In another subgraph, G P 2 is also a spanning tree and 2 is a null set. So, ˜ 2 * is also null. ˜ 2 = { { 89 , 92 } , { 91 , 92 } , { 92 , 93 } , { 92 , 94 } , { 92 , 102 } , { 80 , 98 } , { 94 , 100 } , { 99 , 100 } , { 100 , 106 } , { 101 , 100 } , { 100 , 103 } , { 103 , 104 } , { 103 , 105 } , { 105 , 106 } , { 105 , 107 } } . Although the number of transmission lines incident to buses 92 and 100 is 5, by computing the sum of the weights of the selected transmission lines, we can confirm that the border bus is bus 92, and then ˜ 2 = { { 89 , 92 } , { 91 , 92 } , { 92 , 93 } , { 92 , 94 } , { 92 , 102 } } due to the first sum is more smaller. Then, ˜ 2 * = { { 80 , 98 } , { 94 , 100 } , { 99 , 100 } , { 100 , 106 } , { 101 , 100 } , { 100 , 103 } , { 103 , 104 } , { 103 , 105 } , { 105 , 106 } , { 105 , 107 } } is obtained. In the end, ˜ 2 o = P 2 = {{92, 100},{98, 100},{104, 105}} is acquired. So, the suitable set of transmission lines for the deployment of D-FACTS devices is just the new set of protected transmission lines reconstructed. The required number of D-FACTS devices is only 11, in contrast to the required number of D-FACTS devices being 22 based on the original set of protected transmission lines. Obviously, this provides a quite competitive cost-benefit on the basis of guaranteeing defensive effectiveness.
Figure 9. The two optimal deployments of D-FACTS devices with the IEEE 118-bus power system.
Overall, although the topologies of the three abovementioned power systems are completely different, the new algorithm presented in this study can be easily used for acquiring the optimal deployment of D-FACTS devices in all three cases.

6. Discussion

6.1. Research Motivation

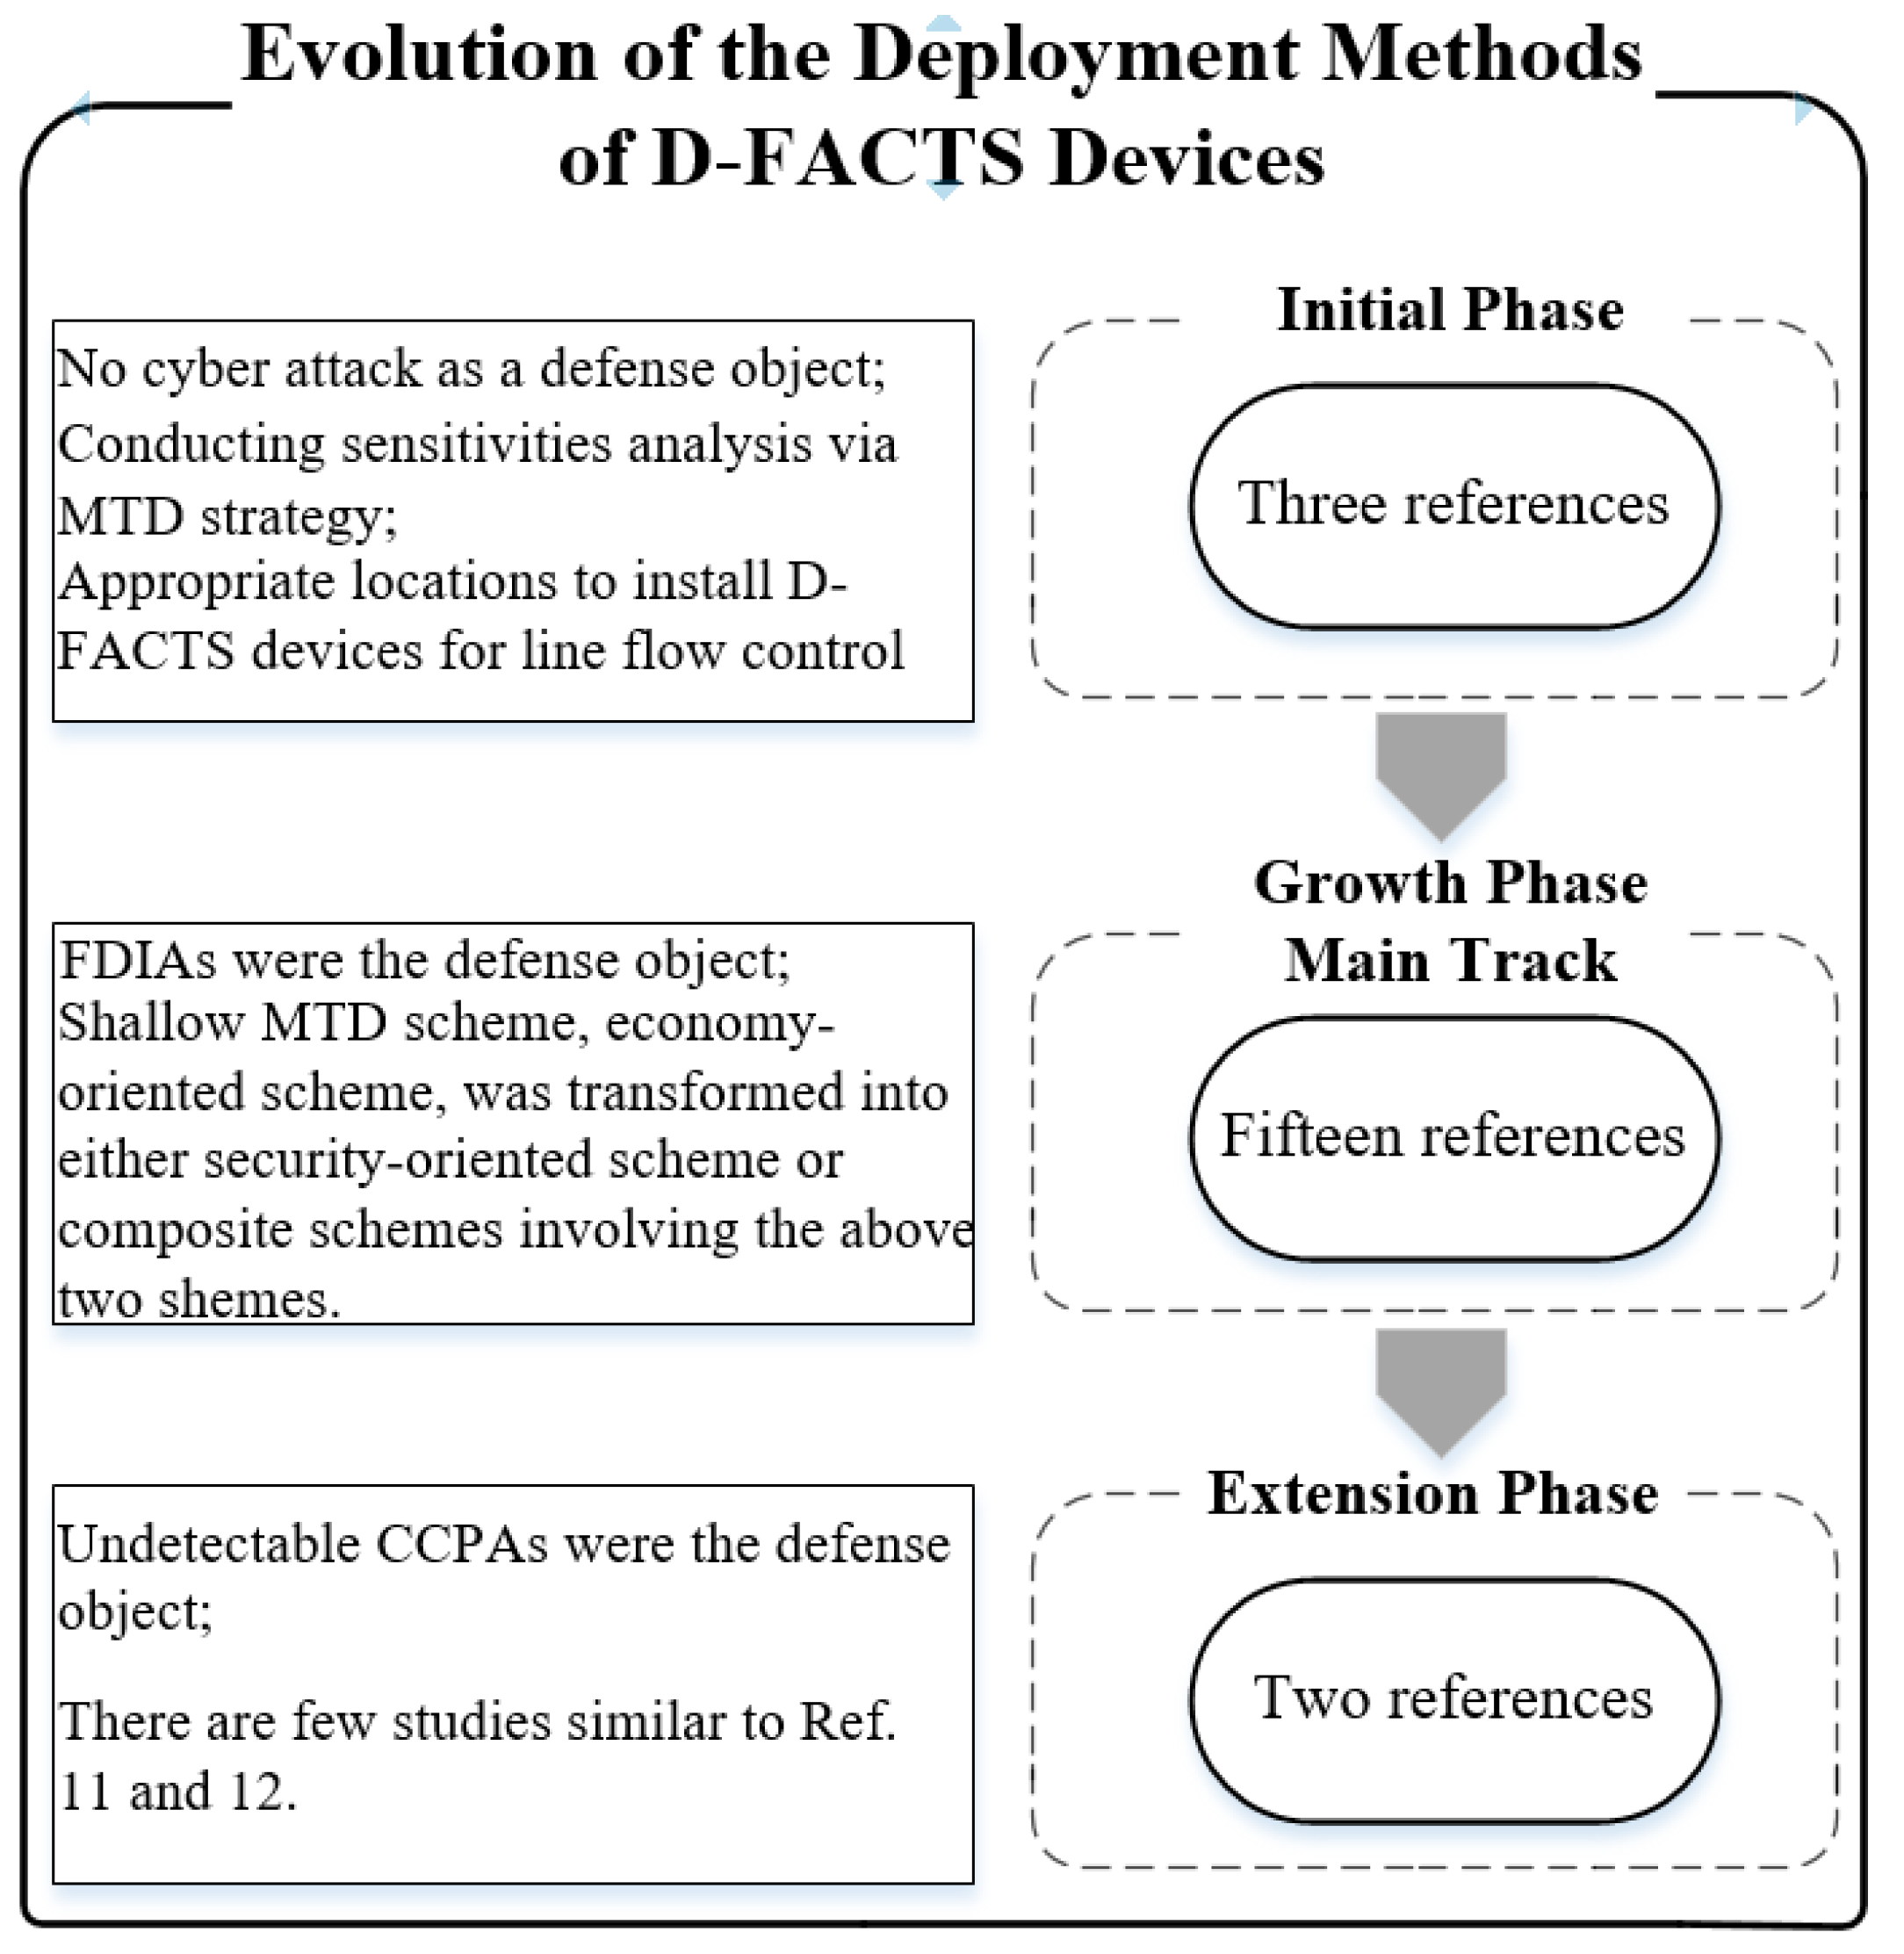
Section 2 presents the achievements of using the MTD method to defend against malicious attacks on SGs in detail and fully analyzes previous methods to solve the deployment of D-FACTS devices, and this graphically shows the evolution in the field of deploying D-FACTS devices. Some findings have been revealed. (1) As the MTD method has become mainstream in the field of defense against multiple covert cyber-attacks, how to deploy D-FACTS devices has become a research hotspot. (2) Although several valuable approaches have been presented on how to deploy D-FACTS devices, they are essentially based on the knowledge of system topology and mathematical statistics knowledge. However, from the macro level of defending against malicious attacks, attack, and defense are opposite and unified, which is an organic whole. Without considering the attack characteristics of a smart attacker, the followed defense is certainly not the most effective and intelligent. In fact, for one specific medium and large-scale power system, due to different system topologies and load profiles, the power flow distribution must be distinct. The aggressive behavior of a smart attacker is intelligent, e.g., a line constituting a “cut” set is not attacked, nor are lines with small power flows. As long as it is deciphered, which lines are most likely to be attacked, the defender can afford the targeted deployment of D-FACTS devices. This is certainly better than the deployments merely based on mathematical knowledge, which ensures not only MTD’s effectiveness against cyber-attacks but also achieves optimal cost and operational loss. In our works, a zero-sum game is formulated. After acquiring a robust NE solution utilizing the EXP3 algorithm, from the point of view of the sophisticated attacker, the lines of the most likely to be attacked may be identified, and then the deployment of D-FACTS devices can be intelligent. This is the first time that the game result was analyzed from the perspective of an attacker.

6.2. Research Value

By analyzing a game solver from the perspective of the attacker and confirming the lines that the attacker is most likely to attack, the defender can intelligently deploy D-FACTS devices. This may represent the research value of our work. Moreover, in the field of MTD defense against CCPAs, the accurate location associated with tripped lines should be the next research point. At present, the research results are very rare, and only one study in the literature [] has provided a method. The authors in Ref. [] proposed finding the location of tripped lines by applying a CNN. We believe that this approach is feasible. However, locating faulty lines is a multi-classification problem. As the system becomes larger, the number of categories becomes larger and larger. For example, when supposing that the maximum number of tripped lines is two, there are 210 categories for the IEEE 14-bus power system, and for the IEEE 118-bus system, the number is 15931. The larger the number of categories, the more complex the composition of CNN. In addition to these conditions, the data to train and test the CNN will also be huge, which puts forward higher requirements for computer hardware and software. Thus, this is likely to be unsolved. If the concept of this paper is adopted, the actual number of classifications will significantly decrease. For example, the number of classifications is 10 for the IEEE 14-bus power system; the number is only 66 for the IEEE 118-bus power system. From 15,931 to only 66 on the IEEE 118-bus power system, when applying a CNN to locate tripped lines, it undoubtedly greatly reduces the requirements of computer hardware and software. At present, we are conducting this work. Considering the attackers’ attack behaviors, this method can also be applied to intelligent detection and operational maintenance.

7. Conclusions and Future Work

In the MTD strategies against CCPAs, defensive effectiveness and operational cost are two of the main research points. The relationship between the two points is often opposite, and so an important question as to what the optimal deployment strategy for D-FACTS devices is has evolved to effectively eliminate this antagonism. For any resourceful and sophisticated attacker, when completely dividing their aggressive behaviors, the deployment solutions must not be intelligent.
In this paper, we propose a new method for finding intelligent deployment solutions for D-FACTS devices. Specifically, first, the basic concept of corrupting CCPAs is summarized; second, based on the practical constraints and the basic concept, a protected transmission line set is confirmed; and third, a zero-sum game model is formulated, and a robust NE solution is computed. Due to the game’s characteristics, this solution reflects the smart attackers’ sense of action. Relying on the solution, those lines that are most likely to be tripped form a new protected transmission line set. Finally, a comprehensive algorithm using a metric proposed in predecessors is proposed for finding an intelligent solution for the deployment of D-FACTS devices. We validated the results through extensive simulations using IEEE 14-bus, 30-bus, and 118-bus power systems provided by MATPOWER and real-world load profiles from New York State. Our study, in tracking the targets that attackers are most likely to attack, opens up new ideas for the intelligent deployment of D-FACTS devices.
In addition, tracking the target most likely to be attacked will achieve efficient defense. The work in this paper is a meaningful attempt to improve defense efficiency. In the future, on the basis of making use of the concepts presented in this study, we can explore several meaningful questions, such as establishing the location of tripped transmission line [] and better MTD strategies.

Author Contributions

Conceptualization and methodology J.Y.; software, J.Y.; validation, J.Y. and Q.L.; formal analysis, J.Y. and Q.L.; writing—original draft, J.Y.; writing—review and editing, Q.L. All authors have read and agreed to the published version of the manuscript.

Funding

This research received no external funding.

Institutional Review Board Statement

Not applicable.

Data Availability Statement

The original data used to support the results of this study are from MATPOWER and the literature [].

Acknowledgments

The authors would like to thank the editors and anonymous reviewers for their careful reading and insightful remarks.

Conflicts of Interest

The authors declare no conflict of interest.

Nomenclature

CPSCyber–physical system
SGSmart grid
FDIAsFalse data injection attacks
CCPAsCoordinated cyber–physical attacks
PMUsPhasor measurement units
MLMachine learning
MTDMoving target defense
D-FACTSDistributed flexible AC transmission system
NENash equilibrium
SEState estimation
OPFOptimal power flow
SPASmallest principal angle
WLSWeighted least squares
BDDBad data detection
EXP3Exploration and exploitation
BFSBreath-first search
G Graph representing the topology of the system
N Set of the buses in the system
Set of the lines in the system
i, jBus index
b i j Susceptance of the line between buses i and j
z Vector of all measurements
HMeasurement matrix
e Measurement error vector
θVoltage phase angles vector
θ i Voltage phase angle at bus i
HkThe kth row of H
rMeasurement residual vector
τThreshold of BDD system
AReduced branch-bus incidence matrix
DDiagonal branch susceptance matrix
aAttack vector
z a Compromised vector of all measurements
apPhysical attack vector
H p Measurement matrix after a physical attack
θ p Voltage phase angles vector after a physical attack
Δ H Measurement difference matrix between post-attack and pre-attack

References

  1. Lydia, M.; Kumar, G.E.P.; Selvakumar, A.I. Securing the cyber-physical system: A review. Cyber-Physical Syst. 2022, 1–31. [Google Scholar] [CrossRef]
  2. Shetu, S.F.; Saifuzzaman, M.; Moon, N.N.; Nur, F.N. A survey of botnet in cyber security. In Proceedings of the ICCT, Jaipur, India, 28–29 September 2019; pp. 174–177. [Google Scholar]
  3. Liu, Y.; Ning, P.; Reiter, M.K. False data injection attacks against state estimation in electric power grids. In Proceedings of the 16th of ACM Conference on Computer and Communications Security, Chicago, IL, USA, 9–13 November 2009. [Google Scholar]
  4. E-ISAC. Analysis of the Cyber Attack on the Ukrainian Power Grid; DUC Tech. Rep. 5; Electricity Information Sharing and Analysis Center: Washington, DC, USA, 2016; Available online: https://ics.sans.org/media/E-ISACsANSUkraineDUC5.pdf (accessed on 18 March 2016).
  5. Li, Z.; Shahidehpour, M.; Alabdulwahab, A.; Abusorrah, A. Bilevel model for analyzing coordinated cyber-physical attacks on power systems. IEEE Trans. Smart Grid 2016, 7, 2260–2272. [Google Scholar] [CrossRef]
  6. Deng, R.; Zhuang, P.; Liang, H. CCPA: Coordinated cyber-physical attacks and countermeasures in smart grid. IEEE Trans. Smart Grid 2017, 8, 2420–2430. [Google Scholar] [CrossRef]
  7. Shepard, D.P.; Humphreys, T.E.; Fansler, A.A. Evaluation of the vulnerability of phasor measurement units to GPS spoofing attacks. Int. J. Crit. Infrastruct. Prot. 2012, 5, 146–153. [Google Scholar] [CrossRef]
  8. Ozay, M.; Esnaola, I.; Vural, F.T.Y.; Kulkarni, S.R.; Poor, H.V. Machine learning methods for attack detection in the smart grid. IEEE Trans. Neural Netw. Learn. Syst. 2016, 27, 1773–1786. [Google Scholar] [CrossRef]
  9. He, Y.; Mendis, G.J.; Wei, J. Real-time detection of false data injection attacks in smart grid: A deep learning-based intelligent mechanism. IEEE Trans. Smart Grid 2017, 8, 2505–2526. [Google Scholar] [CrossRef]
  10. Sayghe, A.; Anubi, O.M.; Konstantinou, C. Adversarial examples on power systems state estimate. In Proceedings of the IEEE Power Energy Society Innovative Smart Grid Technologies Conference (ISGT), Washington, DC, USA, 1–5 February 2020. [Google Scholar]
  11. Lakshminarayana, S.; Belmega, E.V.; Poor, H.V. Moving-target defense against cyber-physical attacks in power grids via game theory. IEEE Trans. Smart Grid 2021, 12, 5244–5257. [Google Scholar] [CrossRef]
  12. Zhang, Z.; Tian, Y.; Deng, R.; Ma, J. A double-benefit moving target defense against cyber-physical attacks in smart grid. IEEE Internet Things J. 2022, 9, 17912–17925. [Google Scholar] [CrossRef]
  13. Morrow, K.L.; Heine, E.; Rogers, K.M.; Bobba, R.B.; Overbye, T.J. Topology perturbation for detecting malicious data injection. In Proceedings of the Hawaii ICSS, Maui, HI, USA, 4–7 February 2012. [Google Scholar]
  14. Davis, K.R.; Morrow, K.L.; Bobba, R.; Heine, E. Power flow cyberattacks and perturbation-based defense. In Proceedings of the IEEE SmartGridComm, Taiwan, China, 5–8 November 2012. [Google Scholar]
  15. Esmalifalak, M.; Shi, G.; Han, Z.; Song, L. Bad data injection attack and defense in electricity market using game theory study. IEEE Trans. Smart Grid 2013, 4, 160–169. [Google Scholar] [CrossRef]
  16. Sanjab, A.; Saad, W. Data injection attacks on smart grids with multiple adversaries: A game-theoretic perspective. IEEE Trans. Smart Grid 2016, 7, 2038–2049. [Google Scholar] [CrossRef]
  17. Habibi, M.R.; Baghaee, H.R.; Dragičević, T.; Blaabjerg, F. False data injection cyber-attacks mitigation in parallel DC/DC converters based on artificial neural networks. IEEE Trans. Circuits Syst. II Express Briefs 2021, 68, 717–721. [Google Scholar] [CrossRef]
  18. Rahman, M.A.; Al-Shaer, E.; Bobba, R.B. Moving target defense for hardening the security of the power system state estimation. In Proceedings of the ACM MTD, Scottsdale, AZ, USA, 3 November 2014. [Google Scholar]
  19. Yang, Q.; Li, D.; Yu, W.; Liu, Y.; An, D.; Yang, X.; Lin, J. Toward data integrity attacks against optimal power flow in smart gird. IEEE Internet Things J. 2017, 4, 1726–1738. [Google Scholar] [CrossRef]
  20. Liu, C.; Wu, J.; Long, C.; Kundur, D. Reactance perturbation for detecting and identifying fdi attacks in power system state estimation. IEEE J. Sel. Top. Signal Process. 2018, 12, 763–776. [Google Scholar] [CrossRef]
  21. Lakshminarayana, S.; Yau, D.K. Cost-benefit analysis of moving target defense in power grids. IEEE Trans. Power Syst. 2021, 36, 1152–1163. [Google Scholar] [CrossRef]
  22. Tian, J.; Tan, R.; Guan, X.; Liu, T. Enhanced hidden moving target defense in smart grids. IEEE Trans. Smart Grid 2019, 10, 2208–2223. [Google Scholar] [CrossRef]
  23. Zhang, Z.; Deng, R.; Yau, D.K.Y.; Cheng, P.; Chen, J. Analysis of moving target defense against false data injection attacks on power grid. IEEE Trans. Inf. Forensics Secur. 2020, 15, 2320–2335. [Google Scholar] [CrossRef]
  24. Liu, B.; Wu, H. Optimal D-FACTS placement in moving target defense against false data injection attacks. IEEE Trans. Smart Grid 2020, 11, 4345–4357. [Google Scholar] [CrossRef]
  25. Soltan, S.; Yannakakis, M.; Zussman, G. Joint cyber and physical attacks on power grids: Graph theoretical approaches for information recovery. In Proceedings of the ACM SIGMETRICS, Portland, OR, USA, 15–19 June 2015. [Google Scholar]
  26. Zhang, Z.; Deng, R.; Cheng, P.; Chow, M.-Y. Strategic protection against FDI attacks with moving target defense in power grids. IEEE Trans. Control Netw. Syst. 2022, 9, 245–256. [Google Scholar] [CrossRef]
  27. Divan, D.; Johal, H. Distributed FACTS—A new concept for realizing grid power flow control. IEEE Trans. Power Electron. 2007, 22, 2253–2260. [Google Scholar] [CrossRef]
  28. Rogers, K.M.; Overbye, T.J. Some applications of distributed flexible AC transmission system (D-FACTS) devices in power systems. In Proceedings of the 2008 40th North American Power Symposium, Calgary, AB, Canada, 28–30 September 2008. [Google Scholar]
  29. Rogers, K.M.; Overbye, T.J. Power flow control with distributed flexible AC transmission system (D-FACTS) devices. In Proceedings of the 41st North American Power Symposium, Starkville, MS, USA, 4–6 October 2009. [Google Scholar]
  30. Li, B.; Xiao, G.; Lu, R.; Deng, R.; Bao, H. Data injection attacks on power grid state estimation using D-FACTS devices. IEEE Trans. Ind. Inform. 2020, 16, 854–864. [Google Scholar] [CrossRef]
  31. Liu, B.; Wu, H. Optimal planning and operation of hidden moving target defense for maximal detection effectiveness. IEEE Trans. Smart Grid 2021, 12, 4447–4459. [Google Scholar] [CrossRef]
  32. Liu, B.; Wu, H. Systematic planning of moving target defense for maximizing detection effectiveness against false data injection attacks in smart grid. IET Cyber-Phys. Syst. Theory Appl. 2021, 6, 151–163. [Google Scholar] [CrossRef]
  33. Liu, M.; Zhao, C.; Zhang, Z.; Deng, R. Explicit analysis on effectiveness and hiddenness of moving target defense in AC power systems. IEEE Trans. Power Syst. 2022, 37, 4732–4746. [Google Scholar] [CrossRef]
  34. Wang, J.; Tian, J.; Liu, Y.; Yang, D.; Liu, T. MMTD: Multi-stage moving target defense for security-enhanced D-FACTS operation. IEEE Internet Things J. 2023, 1. [Google Scholar] [CrossRef]
  35. Xu, W.; Jaimoukha, I.M.; Teng, F. Robust moving target defense against false data injection attacks in power grids. IEEE Trans. Inf. Forensics Secur. 2023, 18, 29–40. [Google Scholar] [CrossRef]
  36. Zhang, Z.; Deng, R.; Yau, D.K.Y.; Cheng, P.; Chow, M.-Y. Security enhancement of power system state estimation with an effective and low-cost moving target defense. IEEE Trans. Syst. Man Cybern. Syst. 2023, 53, 3066–3081. [Google Scholar] [CrossRef]
  37. Chen, Y.; Lakshminarayana, S.; Teng, F. Localization of coordinated cyber-physical attacks in power grids using moving target defense and deep learning. In Proceedings of the IEEE SmartGridComm, Singapore, 25–28 October 2022. [Google Scholar]
  38. Biswas, R.S.; Pal, A.; Werho, T.; Vittal, V. A graph theoretic approach to power system vulnerability identification. IEEE Trans. Power Syst. 2021, 36, 923–935. [Google Scholar] [CrossRef]
  39. Tushar, W.; Yuen, C.; Saha, T.K.; Nizami, S.; Alam, M.R.; Smith, D.B.; Poor, H.V. A survey of cyber-physical systems from a game-theoretic perspective. IEEE Access 2023, 11, 9799–9834. [Google Scholar] [CrossRef]
  40. Etesami, S.R.; Başar, T. Dynamic games in cyber-physical security: An overview. Dyn. Games Appl. 2019, 9, 884–913. [Google Scholar] [CrossRef]
  41. NYISO Load Data. 2020. Available online: https://www.nyiso.com/load-data (accessed on 7 June 2020).
Disclaimer/Publisher’s Note: The statements, opinions and data contained in all publications are solely those of the individual author(s) and contributor(s) and not of MDPI and/or the editor(s). MDPI and/or the editor(s) disclaim responsibility for any injury to people or property resulting from any ideas, methods, instructions or products referred to in the content.

Article Metrics

Citations

Article Access Statistics

Multiple requests from the same IP address are counted as one view.