Abstract
Alzheimer’s disease (AD) is one of the most common diseases causing cognitive impairment in middle-aged and elderly people, and the high cost of the disease poses a challenge for health systems to cope with the expected increasing number of cases in the future. With the advance of aging of the society, China has the largest number of Alzheimer’s disease patients in the world. Therefore, how to diagnose Alzheimer’s disease early and accurately and intervene positively is an urgent problem. In this paper, the improved MultiRes + UNet network is used to effectively segment the brain tissue in the preprocessing. This method expands the convolutional field by null convolution to integrate the global information, mitigates the differences between encoder–decoder features by using MultiRes block and Res path structure, greatly reducing the memory requirement, and improving its accuracy, applicability, and robustness. The non-local means the attention model is introduced to make the mapped organization categories free from noise interference. In the classification problem, this paper adopts the improved VoxCNN network model for binary classification of AD, EMCI, LMCI, and NC. Experiments showed that the model classification performance and the accuracy rate improved significantly with the combined effect of the improved MultiRes + UNet network and VoxCNN network, the binary classification accuracy was 98.35% for AD vs. NC, 89.46% for AD vs. LMCI, 83.95% for LMCI vs. EMCI, and 88.27% for EMCI vs. NC.
1. Introduction
Alzheimer’s disease (AD), commonly known as dementia, is a neurodegenerative disease that has a slow onset process and worsens gradually over time, with a combined probability of 60% to 70% of dementias, and as one of the diseases that cannot be effectively treated at present, it is a disease that occurs in old age and preaging [1,2,3]. It is a persistent neurodegenerative disease with a slow onset and deterioration over time. Its true cause is still unknown and treatment is expensive, and in recent years, more and more scholars at home and abroad have focused their research on the early diagnosis of AD. It is estimated that the number of people with dementia worldwide is currently 47.5 million and will reach 75 million by 2030. The number of people with dementia is expected to be nearly three times larger by 2050 than it is today [4,5]. The high cost of the disease poses a challenge for the health system to cope with the expected increasing number of cases in the future. With the deepening aging of Chinese society, China already has the largest number of Alzheimer’s disease patients in the world.
With the advancement and development of electronic medical imaging technology, it has become mainstream to observe information related to medical imaging to help diagnose brain diseases [6,7]. As one of the most common forms of medical imaging today, magnetic resonance imaging (MRI) [8] can display the soft tissue and structural morphology being examined, and in contrast to other medical imaging modalities, it can avoid the effects of ionizing radiation on the body [9,10,11]. For Alzheimer’s disease, MRI image [12] analysis has an excellent performance in reflecting the shrinkage of brain tissue in AD and Mild Cognitive Impairment(MCI) patients. With the rapid development of electronic information technology and computer science and technology, the application of deep learning in the field of medical diagnosis is becoming more and more common. At present, more and more scholars have started to devote themselves to the comprehensive study of AD classification by combining deep learning and a large amount of medical image data.
In recent years, scholars have also begun to pay attention to the emerging direction of MRI + deep learning, especially the classification of Alzheimer’s disease based on the combination of MRI and information feature extraction. In 2014, Suk et al. [13] used the Deep Boltzmann Machine (DBM) to extract characteristic image information from Positron Emission Tomography (PET) and MRI data from 398 subjects in the Alzheimer’s Disease Neuroimaging Initiative (ADNI), and tried to classify AD and normal control (NC), MCI and NC, and achieved good results. In 2015, Suk et al. [14] again used the Selection Auto Encoder (SAE) algorithm to extract PET, MRI, and CSF (Cerebral Spinal Fluid) data features from the subject sample information to dichotomize AD and NC, MCI and NC, and AD and MCI, achieving more promising classification results. In the same year, Liu et al. [15] similarly used classification SAE in a study to extract highly informative features from PET and MRI data and quadruple-classify between AD, pMCI, sMCI, and NC with an average accuracy of 46.3% level of classification. In 2016, Sarraf et al. [16] achieved an average accuracy of 46.3% by studying the use of Convolutional Neural Network (CNN) to extract feature information from processed MRI images as well as fMRI images, respectively, the accuracy of AD and NC dichotomous classification was further improved and has reached a very satisfactory level. Liu et al. [17] used CNN feature learning for pre-trained convolutional models for feature extraction of images and achieved good results in AD, MCI, and NC classification; Hosseini-Asl et al. [18] applied the 3DCNN approach for the classification of AD episodes and also achieved good results. However, the things like parameter settings of the classifier of traditional machine learning were not stated in the article; Li et al. [19] proposed a brain network construction method based on multi-scale subcortical thickness differences. This method solved the problem that only the inter-mean relationships of brain regions were considered in the previous network construction and the local characteristics within the brain regions were ignored. Liu et al. [20] extracted discriminative image blocks of AD-related regions from MRI images as input data and trained them using 3D-CNN, and obtained 91.09% (AD vs. NC) and 76.90% (Early Mild Cognitive Impairment, EMCI vs. Late Mild Cognitive Impairment, LMCI) accuracy rates. Korolev et al. [21] proposed a VoxCNN neural network architecture, which was well trained for neural network models. They classified brain MRI images of NC and AD, and the results showed that the classification accuracy of the model was 79% respectively, and although the values were relatively low, their model building process was much simpler.
Brain MRI images are inherently susceptible to noise, partial volume effects, and uneven grayscale. The brain itself has a complex structure, and the distribution of gray matter (GM), white matter (WM), and cerebrospinal fluid (CSF) are scattered and the ratio varies greatly, making it difficult to segment accurately and effectively. Accurate and effective segmentation of the three tissue fluids in brain tissue can help doctors to make effective diagnosis and treatment of brain diseases of patients, which has very important medical significance; on the other hand, it also has research significance for the exploration of the human brain.
Currently, MRI image segmentation schemes can be divided into the following three categories: image segmentation based on regional features [22,23], image segmentation based on atlas features [24,25], and image segmentation based on deep learning [26,27,28]. The regional feature-based image segmentation method divides the image according to the basic features, such as the texture, grayscale, and gradient of the image to divide the image. Since the grayscale difference between different regions of brain MRI images is not very large, the segmentation effect is not very satisfactory. The method of image segmentation based on spectrum feature is to select suitable template image and suitable image matching algorithm, the pixel points on the template are mapped to the points on the image to be aligned, and each pixel point on the image to be aligned is labeled. Since the segmentation results are very dependent on the similarity between the template image and the image to be aligned, the segmentation results are not very satisfactory; image segmentation based on deep learning utilizes nonlinear feature extraction capability, high-dimensional features of the image are obtained and then the image or pixel points are classified, the back-propagation algorithm is used to reduce the loss function and gradually improve the processing results. Under the condition of a sufficient number of images and high-quality annotation results, a suitable network model is selected, and by training and tuning of parameters, better results can be obtained in the end.
The work in this paper is developed based on this background, focusing on the topic of MCI recognition, using MRI and deep learning as research tools, proposing the application of MultiRes + UNet network for brain tissue segmentation and binary classification of AD, EMCI, LMCI, and NC with an improved VoxCNN network. The aim is to find excellent methods of discriminating diseases and to improve the efficiency of computer-aided diagnosis, as well as to promote the study of pathophysiological mechanisms of diseases.
The rest of this article is organized as follows: the second part reviews the relevant research work, the third part describes the experimental design and algorithm evaluation criteria, the fourth part analyzes the experimental results, and the last part is the conclusion for the article.
2. Related Work
2.1. Brain Tissue Segmentation
This paper provides a brain MRI image segmentation method based on the improved MultiRes + UNet network [29], which can accurately and efficiently segment GM, WM, and CSF in brain MRI. The improved MultiRes + UNet network still uses the basic UNet architecture. The network structure is divided into two symmetric parts: an encoder that extracts spatial features from the images (down-sampling) and a decoder that constructs segmentation maps from the encoded features (up-sampling). Figure 1 shows the overall architecture of the modified MultiRes + UNet algorithm. The structure consists of the Dilated Convolution, MultiRes module, and Res Path structure. To better coordinate the global information of the image, the dilated convolution is introduced to expand the perceptual field; all the modules in UNet are converted into MultiRes modules in the network, which is extended by multiple 3 × 3 × 3 convolution blocks and residual connections to make the network have a better local topology and thus better handle the size problem. Res Path is also introduced to reduce the semantic gap generating between encoder and decoder features through nonlinear operations. The non-local means attention model was used to redistribute the 3D eigenvalues and input them to the last layer of the network for image segmentation to obtain the segmentation effect of the three brain tissues.
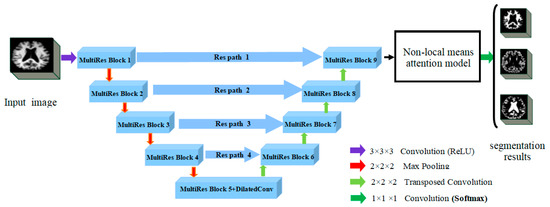
Figure 1.
The improved MultiRes + Unet (Reprinted with permission from Ref. [29]. Copyright 2020 Elsevier) algorithm architecture diagram.
2.1.1. Dilated Convolution
In the pixel-level prediction task, the prediction result is end-to-end pixel-level output, and the size of the output image should be consistent with the input image. To address the problem that down-sampling will reduce image resolution and lose feature information, this paper introduces Dilated Convolution [30], which further extracts features at different scales by stuffing spaces between convolution kernel elements to increase the perceptual field during convolution, and fuses features at different scales to obtain more expressive integrated features. Thus, the global information of the image is learned better and the target is pinpointed. In this network, MultiRes block5 replaces the regular convolution with the dilated Convolution.
The dilated convolution formula can be expressed as:
In the formula: is the input three-dimensional image and its domain; is the expansion factor; is the cavity convolution; is the kernel function; and is the domain of the dilated convolution.
When the model is stuffed with the number of spaces, the size of the convolution kernel of the null convolution can be expressed as:
where: k denotes the convolution kernel size; d is the dilated convolution sampling rate.
The size of the output feature map after dilated convolution can be expressed as:
where: denotes the size of the input dilated convolution; represents the number of complementary zeros in the convolution process; is the size of the new convolution kernel after the hole convolution; and is the convolution step size.
2.1.2. MultiRes Block + Res Path Structure
MultiRes block, as shown in Figure 2, this module replaces the convolutional layers in the UNet structure to coordinate learning features at different scales. At its core, it uses a series of smaller 3 × 3 × 3 convolutional blocks to decompose the 5 × 5 × 5 and 7 × 7 × 7 convolutional layers. The output of the 2nd and 3rd 3 × 3 × 3 convolutional blocks effectively approximates the 5 × 5 × 5 and 7 × 7 × 7 convolutional operations, respectively. Thus, the number of network parameters is reduced, the depth of the network is increased, and the training speed of the network is accelerated. The outputs from the three convolution blocks are obtained and concatenated to extract spatial features at different scales. A residual structure connection (1 × 1 × 1 convolution kernel) for size preservation is also added, and finally, add fusion is used. The memory requirement is greatly reduced by the improvement of this method.
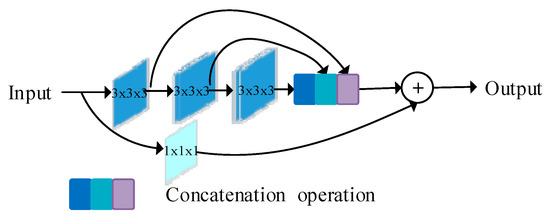
Figure 2.
MultiRes block diagram (Reprinted with permission from Ref. [29]. Copyright 2020 Elsevier).
The Res path structure is shown in Figure 3. A shortcut connection is used in the UNet structure to enable the network to propagate from the encoder to the decoder, but the features in the encoder have a large semantic gap due to the shallow convolution layers (lower-level features), while the corresponding features in the decoder have a large semantic gap due to the deeper convolution layers (higher-level features), and it is not appropriate to directly splice the two. In this structure, to mitigate the difference between encoder–decoder features, the encoder features are subjected to convolution operation before being connected with the corresponding features in the decoder. By the nonlinear operation of 3 × 3 × 3 convolutional layers with 1 × 1 × 1 residual structure, the encoder–decoder has a consistent depth before the concatenation, and 4, 3, 2, 1 convolutional layer are used in ResPath1, 2, 3, and 4, respectively.
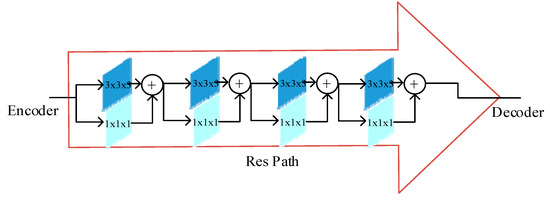
Figure 3.
Res path frame diagram (Reprinted with permission from Ref. [29]. Copyright 2020 Elsevier).
The 3D feature values of MultiRes Block9 were redistributed by the non-local means attention model. The 3D feature values of the redistributed feature values were input to the Softmax layer for image segmentation, and the segmentation results of the three brain tissues were obtained.
2.2. Classification Structure
The network framework of this paper is an improved VoxCNN based on the VGG network. VoxCNN architecture has four convolutional modules for extracting image features, and the number of filters set between layers keeps increasing. The image size input in this experiment is 110 × 110 × 110. To optimize the neural network, Set BatchNorm layer for batch standardization before classification output, and a Dropout layer is set up for regularization to prevent overfitting of the model. Finally, the classification output with Softmax nonlinear output is performed.
The paper takes the VoxCNN network as the baseline for improvement—firstly, Double Conv3D blocks in the VoxCNN network from 8, 16, 32, 64 channels to 16, 32, 64, 128 channels [31]. Secondly, since feature extraction is performed by four Con3D blocks in the model, an MS-SE-Inception block is added after the output of the second convolutional layer. This module mainly contains Inception Block [32], MS-CAM [33], and SE Layer [34]. Inception block uses convolutional kernels of 1 × 1 × 1, 3 × 3 × 3, and 5 × 5 × 5 scales to increase the network width and extract more features so that the network has an excellent local topology. Introduce the MS-CAM module. Two branches with different scales were used to extract channel attention weights. One is the global feature branch and one is the local feature branch. The global branch is based on SE-Net, but the full connection layer is replaced by Point-wise Conv, and the local branch is directly used by Point-Wise Conv. The core idea of MS-CAM is that channel attention can be realized at multiple scales by changing the size of the spatial pool. To make it as lightweight as possible, just add the local context to the global context in the Attention module. The point-wise convolution (PWConv) is selected as the channel context fender, which only uses the point-to-channel fusion at each spatial location. The initial module of SE-Layer is introduced to operate global Average pooling as Squeeze. When ReLu is activated, it ascends back to the original dimension through a fully connected layer. Connect the activation function Sigmoid to get the normalized weight between 0 and 1. After passing through the 1 × 1 × 1 convolutional layer, the CBAM module is introduced, and its output weight is added into the output of the fusion strategy, which is connected to the next Conv3D blocks as the output of the MS-SE-Inception block. Its structure is shown in Figure 4.
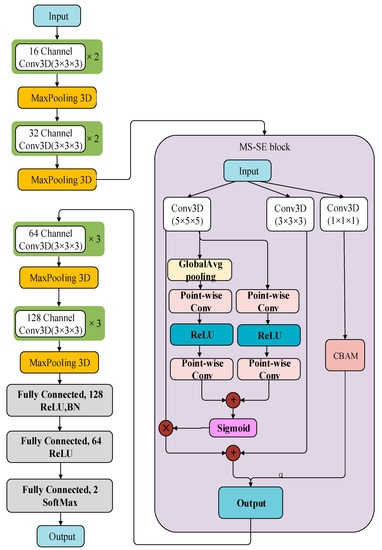
Figure 4.
Structure of the improved VoxCNN model.
3. Experimental Design and Algorithm Evaluation Criteria
3.1. Experimental Data
The Internet Brain Segmentation Repository 18 (IBSR 18) is used for the Segmentation of Brain tissue. The dataset provides 18 sets of normal real Brain MRI images and manual guided expert Segmentation results. Expert segmentation results are composed of four categories: background, WM, GM, and CSF. The size of the image is 256 × 128 × 256 voxels.
The T1-weighted images used in this experiment were obtained from the ADNI database [35,36,37], and after filtering out some data with incomplete information, a total of 329 ADNI samples were selected as data for this experiment. As shown in Table 1, this dataset contains 108 diseased samples (AD), 55 early mild cognitive impairment (EMCI), 56 late mild cognitive impairment (LMCI), and 110 normal samples (NC). Due to the small size of the dataset used in this experiment, we used 5-fold cross validation to divide the sample into five equal parts, and 20% of the data from each part was taken as test data. Then, we carried out five iterations of training and validation to ensure that each fold was used only once in the test. Therefore, for each round of cross-validation, each performance of the model can be obtained, thus reducing the variance of the results. Through data augmentation operation, the amount of training data increased by 10 times. Finally, 2650 training MRIs and 66 test MRIs were fed into the proposed method for the classification.

Table 1.
Experimental data details.
3.2. Experimental Method
The image preprocessing part of this paper includes steps such as head movement correction, alignment, cranial rejection, image enhancement, and segmentation. For the segmentation part, the segmentation network of WM, GM, and CSF was established, and the network is established, trained, and tested based on the PaddlePaddle framework developed by Baidu. The software environment is Windows, relying on Python 3.6, Opencv-Python, Paddlepaddle-GPU, and imgaug.
The input for training was a 3D MRI image of 110 × 110 × 110 size, and a modified version of Cycle LR strategy with faster convergence Adam was used. The experimental flow chart of this paper is shown in Figure 5, including the training stage and test stage of the image pretreatment classification network, and the steps are as follows.
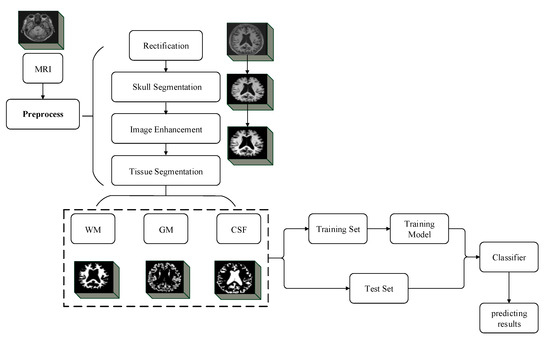
Figure 5.
Experimental flow chart of the method in this paper.
- (1)
- The MRI images of AD, EMCI, LMCI, and NC were input into the trained MultiRes + UNet model, and the MRI images were segmented into WM, GM, and CSF.
- (2)
- The segmented images are fed into the improved VoxCNN, Adam was used for training, and the learning rate was 0.001, with a total of 150 epochs.
- (3)
- The MRI images of AD/NC, AD/LMCI, LMCI/EMCI, and EMCI/NC were respectively input into the improved VoxCNN to train the binary classification network.
- (4)
- In the test phase, the MRI images of unknown classification were directly input into the trained improved VoxCNN, and the classification results were given.
The classification module adopts the improved VoxCNN, as shown in Figure 4. The input of the network is also a 3D MRI image of 110 × 110 × 110 size, and the Batch Size is set to 5. Each model is trained with 150 Epochs. The model data are saved for each iteration of Epoch training, and the validation set data are used to calculate the correct classification rate of the current model. When all Epoch iterations are completed, the network selects the model with the best classification performance in the validation set to perform the final classification on the test set data and calculates the correct and accurate rate of the model classification. The Adam algorithm is applied to optimize the network parameters during the training process, and the initial learning rate is set to 27 × 10−6.
3.3. Segmentation Evaluation Method
In this paper, two evaluation metrics, Jaccard coefficient (JS) and Dice coefficient (DSC), are used as segmentation evaluation criteria, where the Jaccard coefficient indicates the overlap between the segmented image and the standard segmented image, and a higher Jaccard coefficient represents a higher overlap between the two images; the Dice coefficient is used to evaluate the accuracy of the segmentation algorithm, and it can likewise describe the overlap between the segmented image and the standard segmentation map. They are calculated as Equations (4) and (5):
where Ai represents the part of the standard segmented image belonging to category i and Bi represents the part of the image belonging to category i after segmentation with the segmentation algorithm.
3.4. Classification Evaluation Method
In this paper, the classification algorithm accuracy (Acc), sensitivity (Sens), and specificity (Spec) metrics are evaluated according to the following three evaluation criteria. Accuracy represents the proportion of correctly classified samples in the total samples, which can be found in Equation (6):
The sensitivity represents the proportion of correctly identified samples in the overall sample, as can be seen in Equation (7):
Specificity indicates the proportion of correctly identified healthy samples out of the total healthy samples, as can be seen in Equation (8):
In the equation: (True Positive) indicates the number of samples with the same predicted and actual results; (True Negative) indicates the number of abnormalities in both actual and detected results; (False Positive) indicates the number of samples with other results misclassified as this class; (False Negative) indicates the number of samples with this result misclassified as other classes.
4. Experiments and Analysis of Results
4.1. Segmentation Experiments
To visualize the performance advantages of the method in this paper for the brain tissue segmentation task, a comparison with commonly used models in terms of two evaluation metrics, JS and DSC, were performed. Table 2 shows the comparison of the evaluation metrics of the four methods. It can be seen that the segmentation accuracy of the algorithm proposed in this paper is higher than the other three segmentation algorithms for the three tissues of brain white matter, brain gray matter, and cerebrospinal fluid, which proves that combining biometric features can effectively improve the segmentation accuracy of brain tissues.
Table 2.
Comparison of segmentation results of three segmentation algorithms.
As shown in Figure 6, the segmentation effect of the proposed method is the best. Compared with the results of other segmentation methods, the quality of the segmentation graph generated by the proposed method is obviously better than that of other methods. Detailed data are shown in Table 2 and Figure 7.
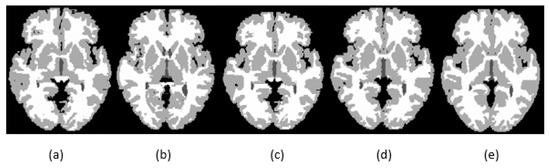
Figure 6.
Segmentation results for GM, CSF, and WM for existing methods and the proposed method using IBSR_11: (a) segmentation results generated by SegNet; (b) segmentation results generated by U-net; (c) segmentation results generated by MultiRes + UNet; (d) segmentation results generated by the proposed method; (e) ground-truth segmentation map.
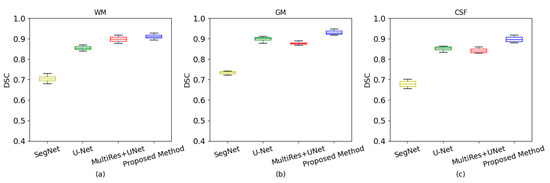
Figure 7.
Box plots with different segmentation methods. (a) White matter of dice coefficient; (b) gray matter of dice coefficient; (c) cerebrospinal fluid of dice coefficient.
4.2. Classification Results of the Proposed Method
Figure 8 shows the accuracy and loss curves of the AD and NC classification results obtained from the training set and the validation set after the image data segmented by the improved MultiRes + UNet algorithm passes through the classification network proposed in this paper. The figure shows that the accuracy and loss of the training process have converged after 50 iterations, and a high training and verification accuracy has been achieved.
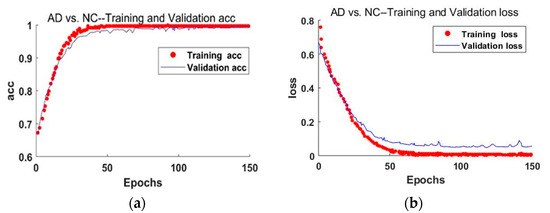
Figure 8.
The accuracy and loss curves of the AD and NC classification results. (a) The accuracy curve of the improved training network; (b) schematic diagram of the loss rate curve of the improved training network.
The experimental results of the four binary classifications shown in Table 3, observing the data, found that the binary classification of AD, EMCI, LMCI, and NC under the improved VoxCNN model proposed in this paper are significant, and this training network model can accurately classify the condition stages of mild cognitive impairment within the standard deviation.
Table 3.
Comparison of results of several classification algorithms.
The algorithm was compared with three classical networks: 3D CNN, 3D ResNet, and VoxCNN. The 3D CNN network consists of 9 3D-convolution layers, the size of the convolution filters was 3 × 3 × 3, a step size of 1 × 1 × 1. Each of the two convolutional layers were followed by a pooling layer, with a total of four 2 × 2 × 2 maximum pooling layers, and two fully connected layers were constructed at the end of the network. 3D ResNet introduces a residual unit that connects the current layer with the previous layer to solve the degradation problem. Four residual modules were introduced into the 3D CNN, skipping the connection makes 3D ResNet deeper; VoxCNN contains ten 3 × 3 × 3 convolution layers for feature learning. Two fully connection layers use batch normalization and drop-out for regularization, and one output full connection layer uses softmax for classification. The general parameter settings of the three networks were the same as those of the proposed method.
The improved VoxCNN model collects more features by enlarging the feature filter channels, introduces the multi-scale channel attention module, extracts the channel attention through branches with different scales, and integrates the attention features. The accuracy of this method for AD/NC, AD/LMCI, LMCI/EMCI, and EMCI / NC was 98.35%, 89.46%, 83.95%, and 88.27%. On the same data set, compared with popular networks such as 3D CNN, 3D ResNet, and VoxCNN, the proposed method has better performance. For AD vs. NC, the accuracy (ACC), sensitivity (SEN), and specificity (SPE) of 3D CNN were less than 90%. 3D ResNet improved the accuracy to 93.02%, and VoxCNN improved the accuracy to 94.85%. The proposed model achieves the highest accuracy of 98.35%. For AD vs. LMCI, the accuracy of using 3D CNN was 81.26%. The accuracy of the improved VoxCNN was 89.46%. For LMCI vs. EMCI, the difference in classification accuracy of the first three networks was not obvious due to the small difference in their features. The proposed improved VoxCNN model has obvious advantages in this classification, with the highest accuracy of 83.95%. The results were summarized in Table 3. The improved VoxCNN results in this paper are generally superior to other commonly used networks, which indicates that the improvement of AD diagnostic classification performance based on MRI is effective.
Although the proposed model has achieved good performance in both segmentation and classification, there are still some limitations that need to be solved in the future.
First, for brain tissue segmentation, the improved MultiRes + UNet is pre-trained on other large scale 3D medical image datasets, and fine-tuned on the datasets to improve the generalization ability. Secondly, in the Course Classification in Alzheimer’s disease, the size of training samples is still relatively small. It is hoped to collect more neuroimaging data from MRI studies and use the generation model to expand the training samples.
5. Conclusions
The work of this paper is mainly embodied in the study of precise segmentation of brain tissue using an improved MultiRes + UNet network in image preprocessing. Enlarge the dilated convolution receptive field through the dilated convolution to coordinate the global information. Combined with a non-local means attention model, the segmentation of brain tissue is not affected by noise. For the automatic classification of Alzheimer’s disease and normal patients in MRI scans, the improved VoxCNN network is used to effectively classify brain magnetic images. This study found that the performance of the network can be improved by adding the filter, and the introduction of the MS-SE-inception block makes the improved VoxCNN model have a better Acc.
Author Contributions
M.L. and C.H. designed the method and wrote the paper; Z.L. and Y.Z. performed the experiments and analyzed the data. All authors have read and agreed to the published version of the manuscript.
Funding
This work was supported by the National Natural Science Foundation of China (No. 61701097).
Informed Consent Statement
Informed consent was obtained from all subjects involved in the study.
Data Availability Statement
Data collection and sharing for this project were funded by the Internet Brain Segmentation Repository 18 (IBSR 18), Alzheimer’s Disease Neuroimaging Initiative (ADNI).
Acknowledgments
We thank all anonymous reviewers for their insightful and constructive suggestions, which increased the quality of this article.
Conflicts of Interest
The authors declare that there is no conflict of interest regarding the publication of this paper.
References
- Lane, C.A.; Hardy, J.; Schott, J.M. Alzheimer’s disease. Eur. J. Neurol. 2018, 25, 59–70. [Google Scholar] [CrossRef] [PubMed]
- Weller, J.; Budson, A. Current understanding of Alzheimer’s disease diagnosis and treatment. F1000 Res. 2018, 7, 1161. [Google Scholar] [CrossRef] [PubMed] [Green Version]
- Guo, X.; Xiong, N.N.; Wang, H.; Ren, J. Design and Analysis of a Prediction System about Influenza-Like Illness from the Latent Temporal and Spatial Information. IEEE Trans. Syst. Man Cybern. Syst. 2021, 99, 66–77. [Google Scholar] [CrossRef]
- Liu, G.; Lin, Q.; Xiong, N.N.; Xin, W. Unsupervised Denoising Feature Learning for Classification of Corrupted Images. Big Data Res. 2022, 27, 100305. [Google Scholar] [CrossRef]
- Liu, M.; Zhou, M.; Zhang, T.; Xiong, N. Semi-supervised learning quantization algorithm with deep features for motor imagery EEG Recognition in smart healthcare application. Appl. Soft Comput. 2020, 89, 106071. [Google Scholar] [CrossRef]
- Li, D.; Liu, H.; Zhang, Z.; Lin, K.; Fang, S.; Li, Z.; Xiong, N.N. CARM: Confidence-aware recommender model via review representation learning and historical rating behavior in the online platforms. Neurocomputing 2021, 455, 283–296. [Google Scholar] [CrossRef]
- Wu, C.; Luo, C.; Xiong, N.; Zhang, W.; Kim, T.-H. A greedy deep learning method for medical disease analysis. IEEE Access 2018, 6, 20021–20030. [Google Scholar] [CrossRef]
- Wang, X.; Ren, Y.; Yang, Y.; Zhang, W.; Xiong, N.N. A weighted discriminative dictionary learning method for depression disorder classification using fMRI data. In Proceedings of the 2016 IEEE International Conferences on Big Data and Cloud Computing (BDCloud), Social Computing and Networking (SocialCom), Sustainable Computing and Communications (SustainCom) (BDCloud-SocialCom-SustainCom), Atlanta, GA, USA, 8–10 October 2016; IEEE: Piscataway, NJ, USA, 2016; pp. 618–623. [Google Scholar]
- Lu, W.; Wang, Z.; He, Y.; Yu, H.; Xiong, N.; Wei, J. Breast cancer detection based on merging four modes MRI using convolutional neural networks. In Proceedings of the 2019 IEEE International Conference on Acoustics, Speech and Signal Processing (ICASSP), Brighton, UK, 12–17 May 2019; IEEE: Piscataway, NJ, USA, 2019; pp. 1035–1039. [Google Scholar]
- Liu, R.W.; Shi, L.; Yu, S.C.H.; Xiong, N.; Wang, D. Reconstruction of undersampled big dynamic MRI data using non-convex low-rank and sparsity constraints. Sensors 2017, 17, 509. [Google Scholar] [CrossRef] [Green Version]
- Xu, Y.; Yang, H.; Li, J.; Liu, J.; Xiong, N. An effective dictionary learning algorithm based on FMRI data for mobile medical disease analysis. IEEE Access 2018, 7, 3958–3966. [Google Scholar] [CrossRef]
- Mao, Z.; Su, Y.; Xu, G.; Wang, X.; Huang, Y.; Yue, W.; Sun, L.; Xiong, N. Spatio-temporal deep learning method for ADHD fMRI classification. Inf. Sci. 2019, 499, 1–11. [Google Scholar] [CrossRef]
- Suk, H.I.; Lee, S.W.; Shen, D. Hierarchical feature representation and multimodal fusion with deep learning for AD/MCI diagnosis. NeuroImage 2014, 101, 569–582. [Google Scholar] [CrossRef] [PubMed] [Green Version]
- Suk, H.I.; Lee, S.W.; Shen, D. Latent feature representation with stacked auto-encoder for AD/MCI diagnosis. Brain Struct. Funct. 2015, 220, 841–859. [Google Scholar] [CrossRef] [PubMed]
- Liu, S.; Cai, W.; Wen, L.; Feng, D.D.; Pujol, S.; Kikinis, R.; Fulham, M.J.; Eberl, S. Multi-Channel neurodegenerative pattern analysis and its application in Alzheimer’s disease characterization. Comput. Med. Imaging Graph. 2014, 38, 436–444. [Google Scholar] [CrossRef] [PubMed] [Green Version]
- Sarraf, S.; Desouza, D.D.; Anderson, J.A.E.; Tofighi, G. DeepAD: Alzheimer’s Disease Classification via Deep Convolutional Neural Networks using MRI and fMRI. BioRxiv 2016, 070441. [Google Scholar]
- Liu, F.; Shen, C. Learning Deep Convolutional Features for MRI Based Alzheimer’s Disease Classification. arXiv 2014, arXiv:1404.3366. [Google Scholar]
- Asl, E.H.; Keynton, R.; El-Baz, A. Alzheimer’s Disease Diagnostics by Adaptation of 3D Convolutional Network. In Proceedings of the 2016 IEEE International Conference on Image Processing (ICIP), Phoenix, AZ, USA, 25–28 September 2016; IEEE: Piscataway, NJ, USA, 2016. [Google Scholar]
- Yang, L.; Wang, Y.; Wu, G.; Feng, S.; Shen, D. Discriminant analysis of longitudinal cortical thickness changes in Alzheimer’s disease using dynamic and network features. Neurobiol. Aging 2012, 33, 427.e15–427.e30. [Google Scholar]
- Liu, S.; Liu, S.; Cai, W.; Che, H.; Fulham, M.J. Multimodal Neuroimaging Feature Learning for Multiclass Diagnosis of Alzheimer’s Disease. IEEE Trans. Biomed. Eng. 2015, 62, 1132–1140. [Google Scholar] [CrossRef] [Green Version]
- Korolev, S.; Safiullin, A.; Belyaev, M.; Dodonova, Y. Residual and plain convolutional neural networks for 3D brain MRI classification. In Proceedings of the 2017 IEEE 14th International Symposium on Biomedical Imaging (ISBI 2017), Melbourne, Australia, 18–21 April 2017; IEEE: Piscataway, NJ, USA, 2017. [Google Scholar]
- Huang, H.; Meng, F.; Zhou, S.; Jiang, F.; Manogaran, G. Brain Image Segmentation Based on FCM Clustering Algorithm and Rough Set. IEEE Access 2019, 7, 12386–12396. [Google Scholar] [CrossRef]
- Hiralal, R.; Menon, H.P. A Survey of Brain MRI Image Segmentation Methods and the Issues Involved. In The International Symposium on Intelligent Systems Technologies and Applications; Springer: Cham, Switzerland, 2016. [Google Scholar]
- Liu, Y.; Wei, Y.; Wang, C. Subcortical Brain Segmentation Based on Atlas Registration and Linearized Kernel Sparse Representative Classifier. IEEE Access 2019, 7, 31547–31557. [Google Scholar] [CrossRef]
- Van der Lijn, F.; De Bruijne, M.; Klein, S.; den Heijer, T.; Hoogendam, Y.Y.; van der Lugt, A.; Breteler, M.M.B.; Niessen, W.J. Automated Brain Structure Segmentation Based on Atlas Registration and Appearance Models. IEEE Trans. Med. Imaging 2012, 31, 276–286. [Google Scholar] [CrossRef] [Green Version]
- Ari, A.; Hanbay, D. Deep learning based brain tumor classification and detection system. Turk. J. Electr. Eng. Comput. Sci. 2018, 26, 2275–2286. [Google Scholar] [CrossRef]
- Wang, G.; Li, W.; Zuluaga, M.A.; Pratt, R.; Patel, P.A.; Aertsen, M.; Doel, T.; David, A.L.; Deprest, J.; Ourselin, S. Interactive Medical Image Segmentation using Deep Learning with Image-specific Fine-tuning. IEEE Trans. Med. Imaging 2018, 37, 1562–1573. [Google Scholar] [CrossRef]
- Han, Y.; Zhang, Z. Deep Learning Assisted Image Interactive Framework for Brain Image Segmentation. IEEE Access 2020, 8, 117028–117035. [Google Scholar] [CrossRef]
- Ibtehaz, N.; Rahman, M.S. MultiResUNet: Rethinking the U-Net architecture for multimodal biomedical image segmentation. Neural Netw. 2019, 121, 74–87. [Google Scholar] [CrossRef] [PubMed]
- Piao, S.; Liu, J. Accuracy improvement of UNet based on dilated convolution. J. Phys. Conf. Ser. 2019, 1345, 052066. [Google Scholar] [CrossRef]
- Turkan, Y.; Tek, F.B. Convolutional Attention Network for MRI-based Alzheimer’s Disease Classification and its Interpretability Analysis. In Proceedings of the 2021 6th International Conference on Computer Science and Engineering (UBMK); IEEE: Piscataway, NJ, USA, 2021; pp. 1–6. [Google Scholar]
- Szegedy, C.; Ioffe, S.; Vanhoucke, V.; Alemi, A. Inception-v4, Inception-ResNet and the Impact of Residual Connections on Learning. In Proceedings of the 31st AAAI Conference on Artificial Intelligence, San Francisco, CA, USA, 4–10 February 2016. [Google Scholar]
- Dai, Y.; Gieseke, F.; Oehmcke, S.; Wu, Y.; Barnard, K. Attentional Feature Fusion. In Proceedings of the IEEE/CVF Winter Conference on Applications of Computer Vision, Waikoloa, HI, USA, 3–8 January 2021. [Google Scholar]
- Jie, H.; Li, S.; Gang, S.; Albanie, S. Squeeze-and-Excitation Networks. In Proceedings of the IEEE Conference on Computer Vision and Pattern Recognition, Honolulu, HI, USA, 21–26 July 2017; IEEE: Piscataway, NJ, USA, 2017. [Google Scholar]
- Hinrichs, C.; Singh, V.; Xu, G.; Johnson, S.C. Predictive markers for AD in a multi-modality framework: An analysis of MCI progression in the ADNI population. Neuroimage 2011, 55, 574–589. [Google Scholar] [CrossRef] [PubMed] [Green Version]
- Weiner, M.W.; Veitch, D.P.; Aisen, P.S.; Beckett, L.A.; Cairns, N.J.; Green, R.C.; Harvey, D.; Jack, C.R.; Jagust, W.; Liu, E. The Alzheimer’s Disease Neuroimaging Initiative: A review of papers published since its inception. Alzheimer’s Dement. 2013, 9, e111–e194. [Google Scholar] [CrossRef] [PubMed] [Green Version]
- Misra, C.; Fan, Y.; Davatzikos, C. Baseline and longitudinal patterns of brain atrophy in MCI patients, and their use in prediction of short-term conversion to AD: Results from ADNI. Neuroimage 2009, 44, 1415–1422. [Google Scholar] [CrossRef] [PubMed] [Green Version]
Publisher’s Note: MDPI stays neutral with regard to jurisdictional claims in published maps and institutional affiliations. |
© 2022 by the authors. Licensee MDPI, Basel, Switzerland. This article is an open access article distributed under the terms and conditions of the Creative Commons Attribution (CC BY) license (https://creativecommons.org/licenses/by/4.0/).