1. Introduction
Nowadays, one of the popular subfields of electronics and electrical engineering is transferring electric power without wires—wireless power transfer (WPT). It is more reliable and convenient than traditional power transmission with wires.
While a wireless battery charging of mobile electronic devices is often considered as an unnecessary extra, some applications of wireless power transfer should receive attention. They include: wireless charging of the batteries for electrical vehicles [
1,
2,
3]; wireless charging of mobile robots; wireless charging of the batteries for biomedical implanted devices [
4]; dynamic electrical vehicle charging [
5]; WPT to moving sensors [
6]; WPT to wireless sensor networks nodes [
7,
8]. WPT also may have some more useful but unusual applications: WPT of solar energy from space to the Earth [
9]; wireless charging of the batteries for drones while hovering [
10]; wireless charging of the batteries for unmanned autonomous submarines [
11,
12]; wireless powering of unmanned autonomous aircrafts [
13,
14].
Currently, the most popular WPT technique is definitely an inductive-resonant WPT technique. It is suitable for small-gap applications [
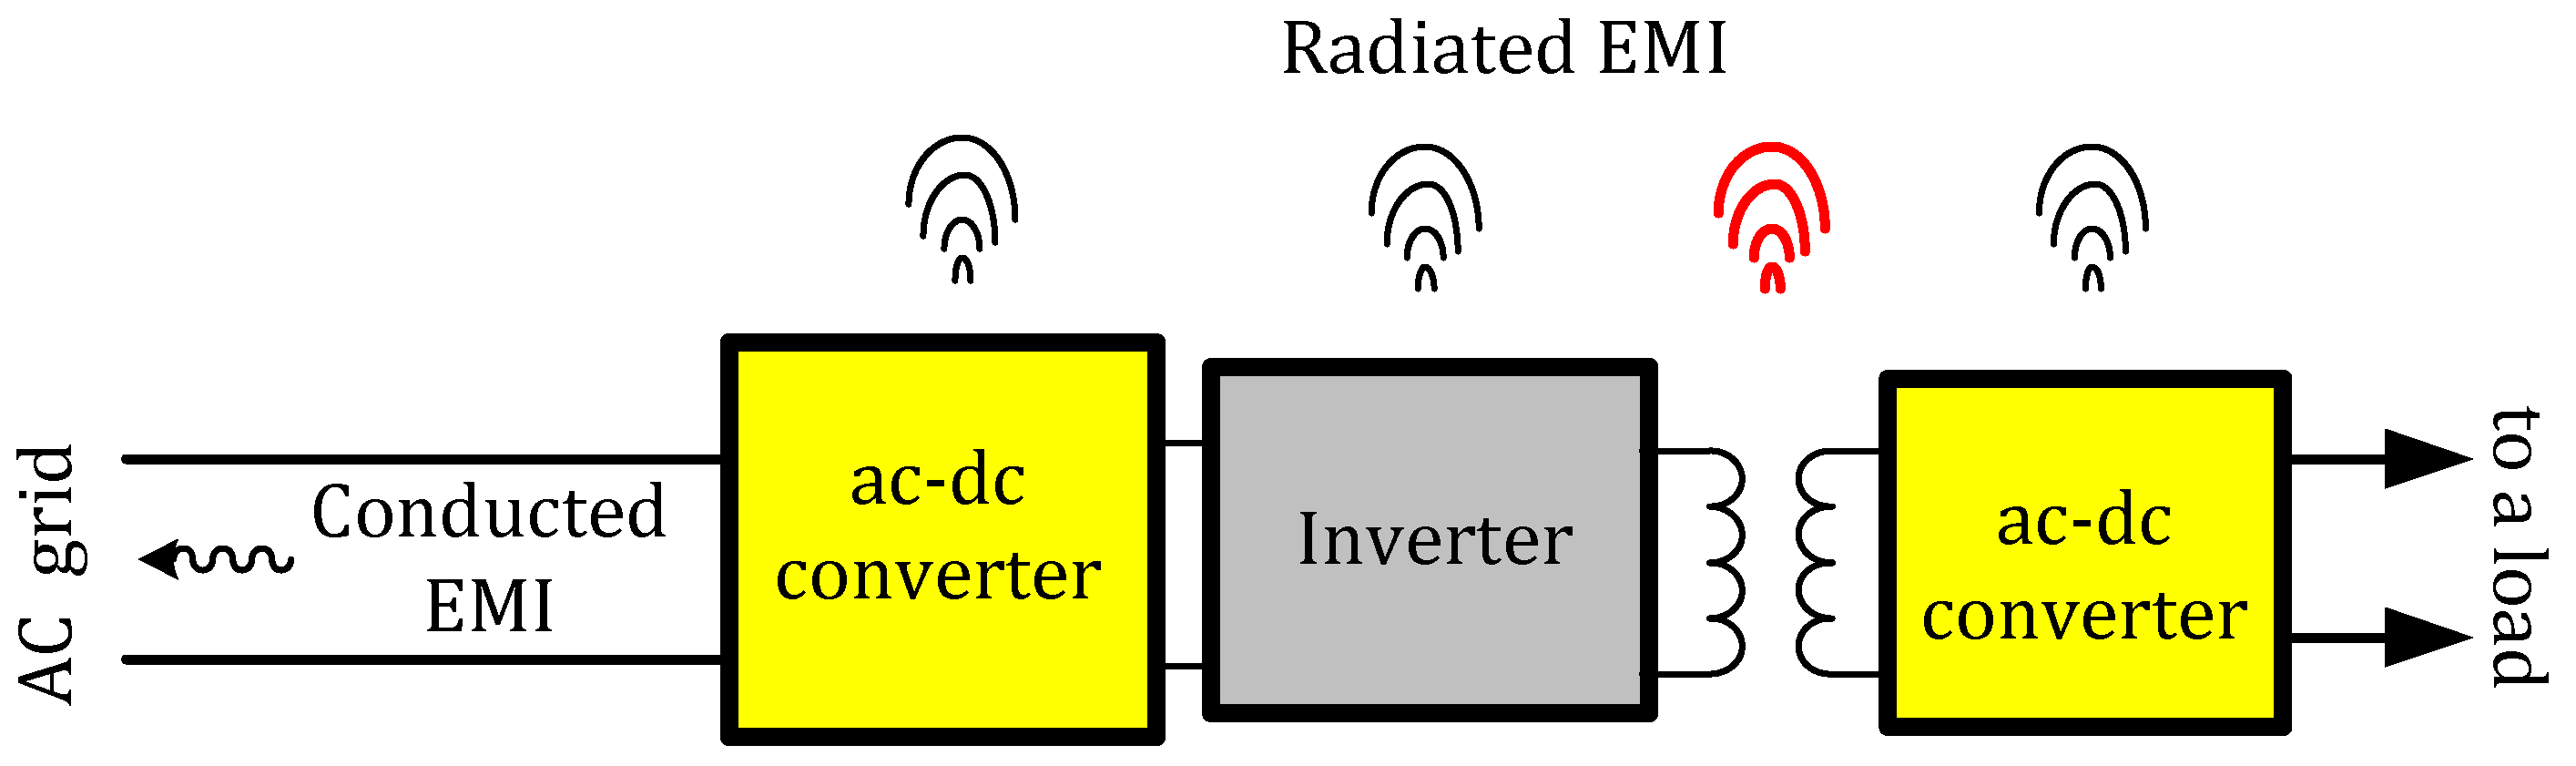
15] when electric power should be transferred wirelessly over a distance up to some 10 s of cm. The inductive-resonant WPT method may be used at low power levels for battery charging of mobile electronic devices or implanted pacemakers as well as at mid and high power levels for the charging of batteries for light-duty electrical vehicles (e.g., passenger cars, etc.) and heavy-duty electrical vehicles (e.g., electrical tractors or buses) as well as mobile robots. Usually, inductive-resonant WPT systems are designed to operate in kHz range, however sometimes they can also be designed to operate in MHz range (e.g., at 6.78 MHz) to achieve higher transmission distance, better special freedom and lower size. Having switch mode power converters inside, the inductive-resonant WPT systems are potential sources of electromagnetic interference (EMI) to sensitive electronic equipment as shown in
Figure 1. EMI can take the form of conducted emissions propagating through input wires to the electric grid and radiated emissions (time-varying magnetic fields or even radio waves) which can even destabilize the normal operation of sensitive electronic devices. Therefore, the emissions must be reduced. This paper is devoted to the reduction of radiated EMI.
WPT systems are often considered ISM (industrial, scientific and medicine) devices. Therefore, they should comply with CISPR 11 electromagnetic compatibility (EMC) standard requirements. Since for kHz WPT systems the main emission energy is concentrated within frequency range below 30 MHz, a new CISPR 11 standard edition including guidelines on measurement methods and limits of near-field WPT systems radiated emissions below 30 MHz is due to appear, at the time of writing. Moreover, there is also the International Commission on Non-Ionizing Radiation Protection (ICNIRP) which published guidelines on limiting electromagnetic field exposure.
As a traditional way for conducted EMI reduction—input EMI filtering—adds noticeable cost, size and weight to the inductive-resonant WPT system, a spread-spectrum technique based on modulation of WPT system inverter switching frequency has been applied to inductive-resonant WPT systems [
16,
17,
18,
19,
20,
21,
22]. A typical approach for the reduction of radiated emissions is shielding, but shields are expensive and they increase the size and cost of the WPT systems. This is the reason why the spread-spectrum approach has been proposed by some researchers.
There are many papers related to the reduction of conducted emissions using a spread-spectrum approach in WPT systems [
16,
17,
18,
19,
21,
22], but there is only one paper [
20] about the suppression of radiated emissions using the approach in WPT systems. As shown in [
20], fundamental components of the radiated emissions of the inductive-resonant WPT system can be reduced by up to 8.3 dB when the spread-spectrum technique based on the random modulation of inverter-switching frequency is used. Despite the fact that the effect of the spread-spectrum technique on the radiated emissions of an inductive-resonant WPT system was analyzed in [
20], the research presented in [
20] has some drawbacks: (1) only the effect of random frequency modulation on radiated emissions was considered, but the application of classical (periodic) switching frequency modulation (SFM) was not analyzed; (2) the effect of resolution bandwidth (RBW) on the emission measurement results was not taken into account; (3) to implement the modulation, a quite expensive control block based on digital signal processor (DSP) and a field-programmable gate array (FPGA) were used. In contrary to other research [
20], the novelty of this paper is an experimentally based analysis of the effect of periodic SFM as well as the multi-frequency technique on radiated emissions of an inductive-resonant WPT system also considering the effects of the RBW of a spectrum analyzer and the efficiency. For the first time it will be shown also that for a similar decrease in the efficiency of the inductive-resonant WPT system, the implementation of the spread-spectrum technique based on the multi-frequency scheme can lead to a radiated emission reduction equal to or better than that obtained in [
20] with random frequency modulation, but using a much cheaper approach—a cheap 8-MHz microcontroller, such as Atmega AVR 328p.
This paper is partly based on the results of a master’s thesis, “Effect of Spread Spectrum Technique on Radiated Emissions Generated by Wireless Power Transfer Systems”, defended by Padmapriya Padmanaban in June 2021 at Riga Technical University under the supervision of D. Stepins.
3. Experimental Setup
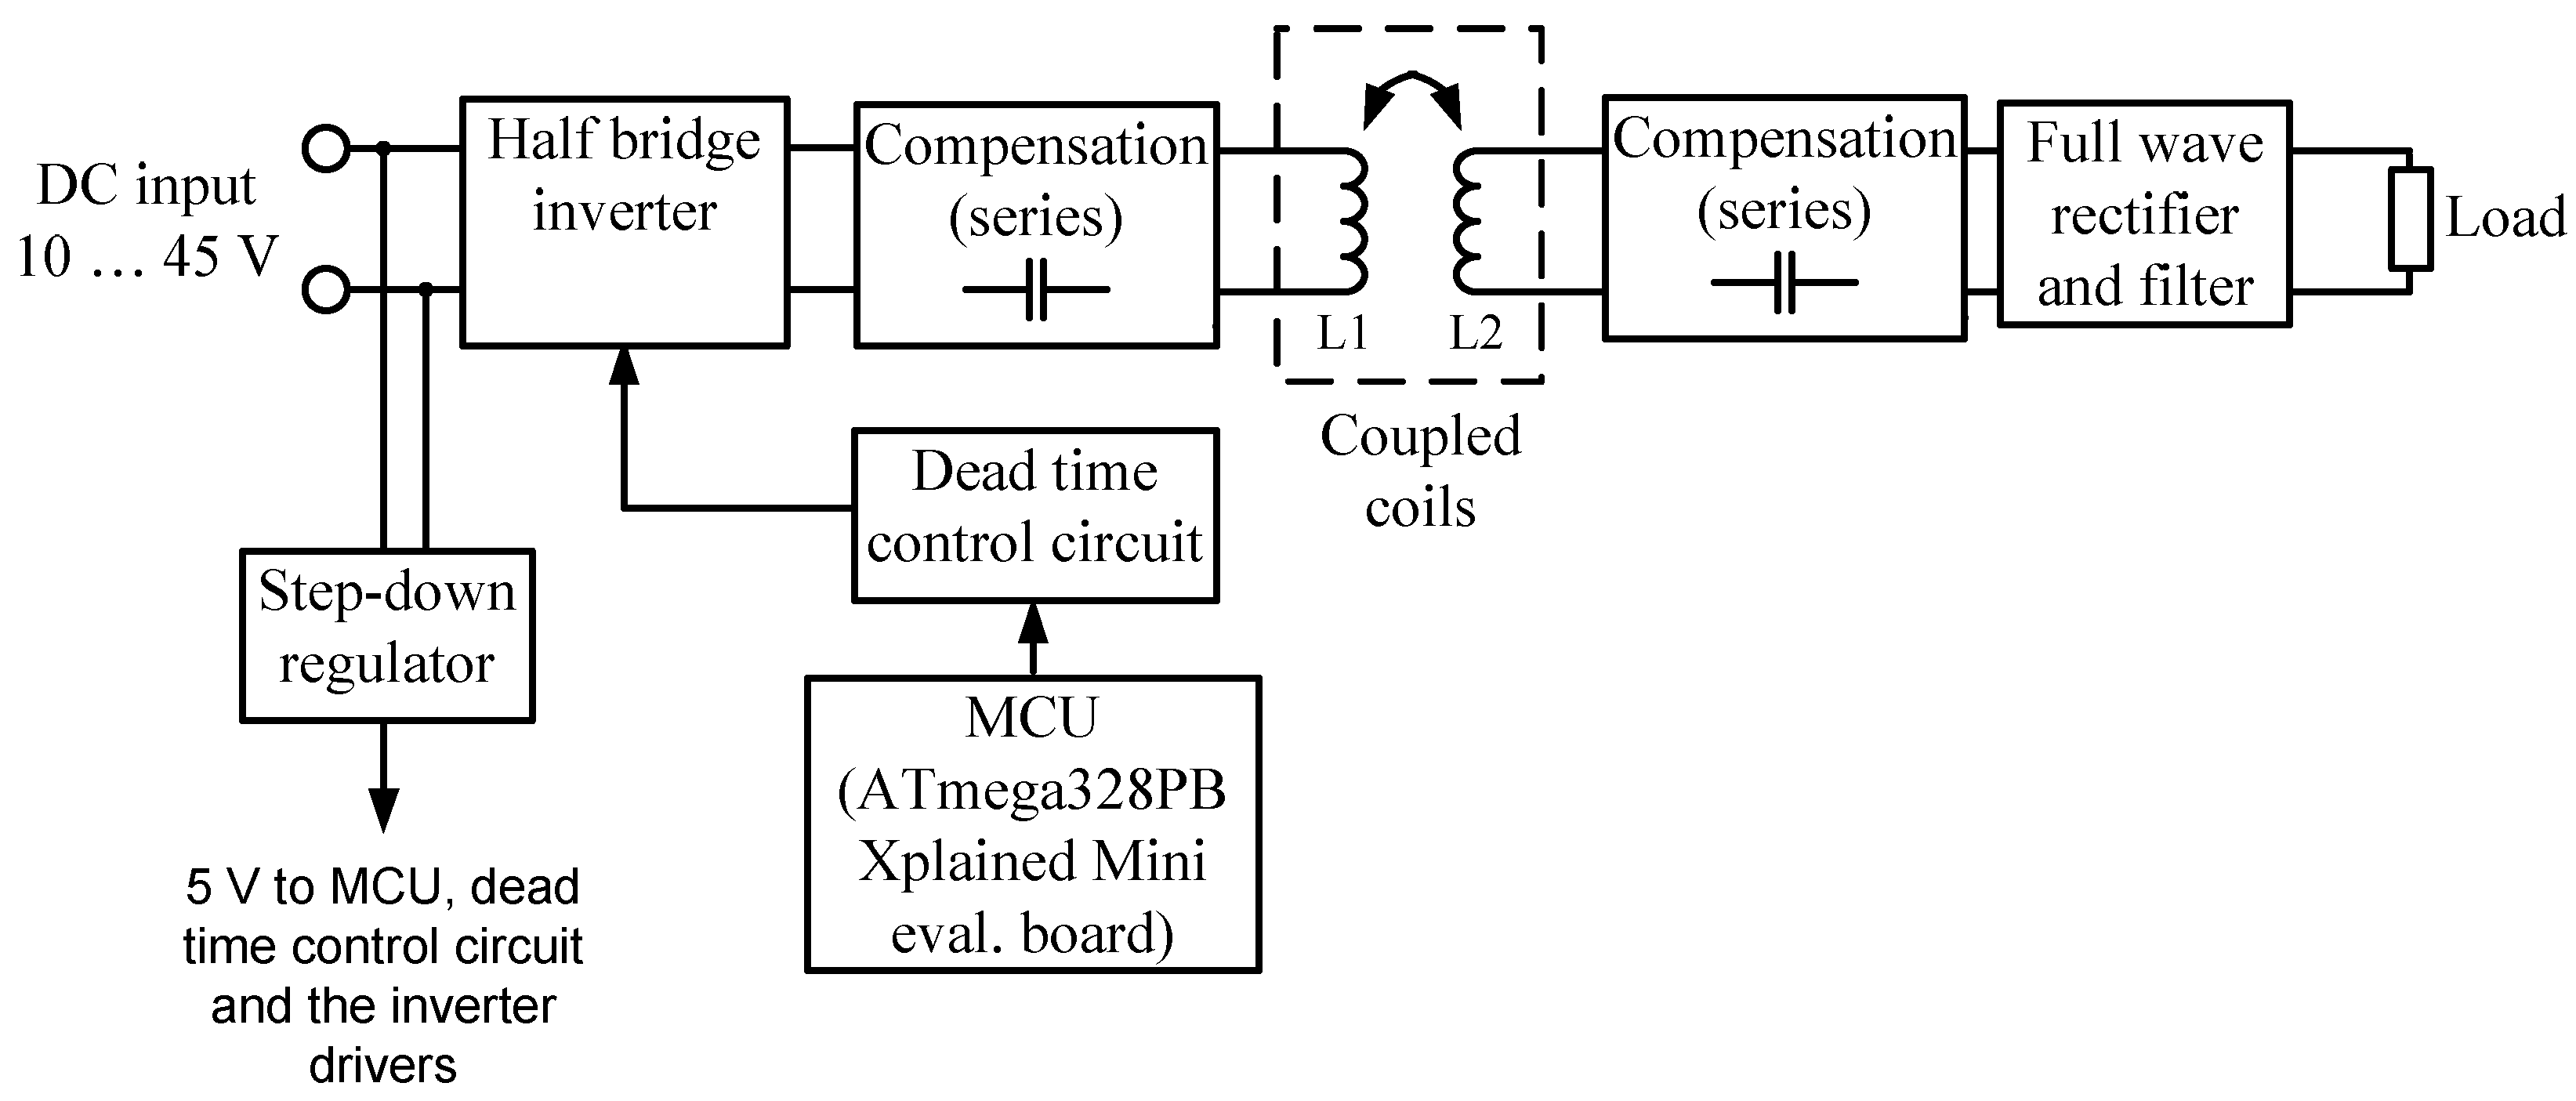
In order to study the effect of periodic SFM and multi-frequency technique on the radiated emissions and the efficiency of the inductive-resonant WPT system, an experimental prototype of the system has been designed and practically built. A block diagram of the prototype is depicted in
Figure 5. It consists of half bridge inverter (EVB GSWP050W from GaN systems), the half-bridge inverter dead-time control circuit, a microcontroller (ATmega328PB Xplained Mini evaluation board), the primary-side and the secondary-side series compensation circuit (based on parallel connected capacitors to increase overall current rating), inductively coupled coils, secondary-side high-frequency full-wave rectifier with high-frequency ripple filter and step-down regulator at the primary side to feed the microcontroller (MCU), the dead-time control circuit and the inverter GaN transistors drivers. The dead-time control circuit generates two square signals to control the half-bridge stage transistors introducing some delay to prevent the stage from the shoot-through phenomenon. The half-bridge inverter input is connected to the output of the DC power supply whose output voltage can be adjusted. Two parallel connected resistors with suitable heatsink and a cooling fan are used as a load. Transmitting and receiving coils are factory-made ones from Wurth Elektronik. The primary and the secondary compensation capacitances were calculated so that the primary and secondary-side resonant tanks are tuned to the resonance (at
f0). The WPT system was designed for the operation within the Qi standard allowed range of frequencies (this is why the central switching frequency
f0 is 150 kHz).
The values of the main parameters of the designed WPT system are shown in
Table 1.
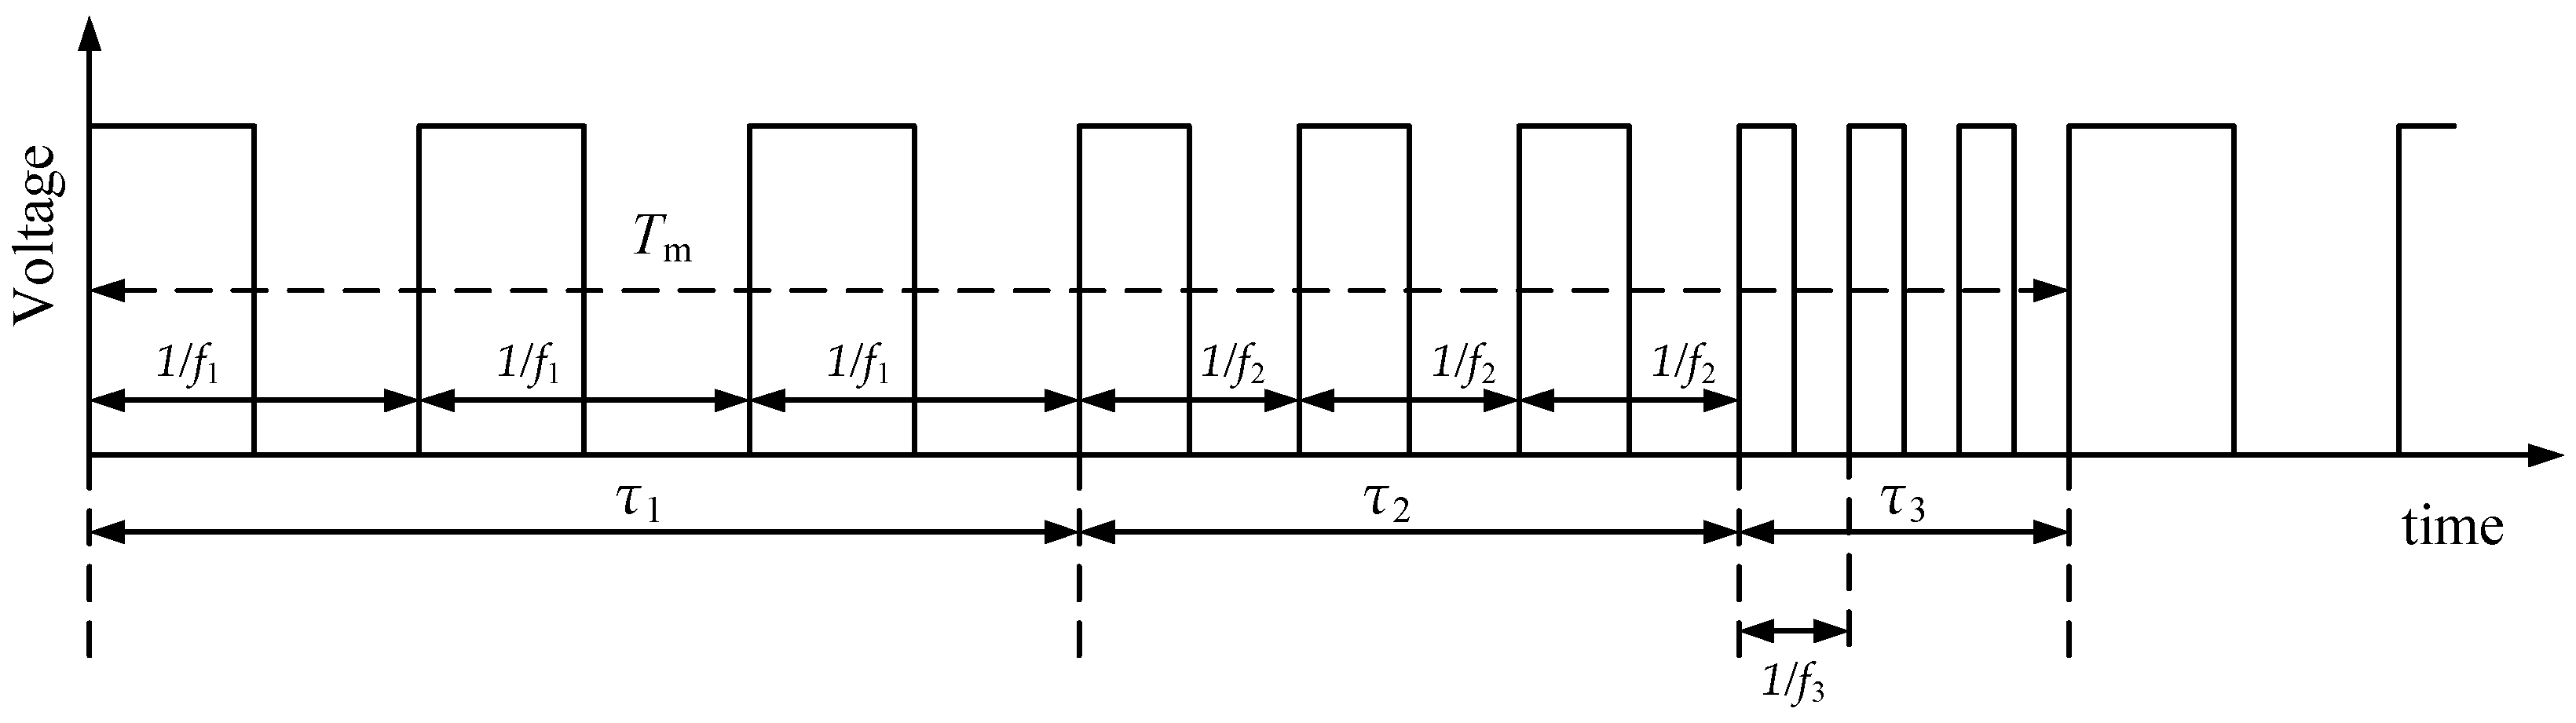
Since at the time of writing the paper we had only a cheap 8 MHz 8-bit MCU evaluation board, accurate implementation of periodic SFM was impossible, because the MCU time resolution (1/8 × 10
6 = 125 ns) was insufficient to generate frequency-modulated square signal (e.g., shown in
Figure 2) accurately with timings, presented, for example, in
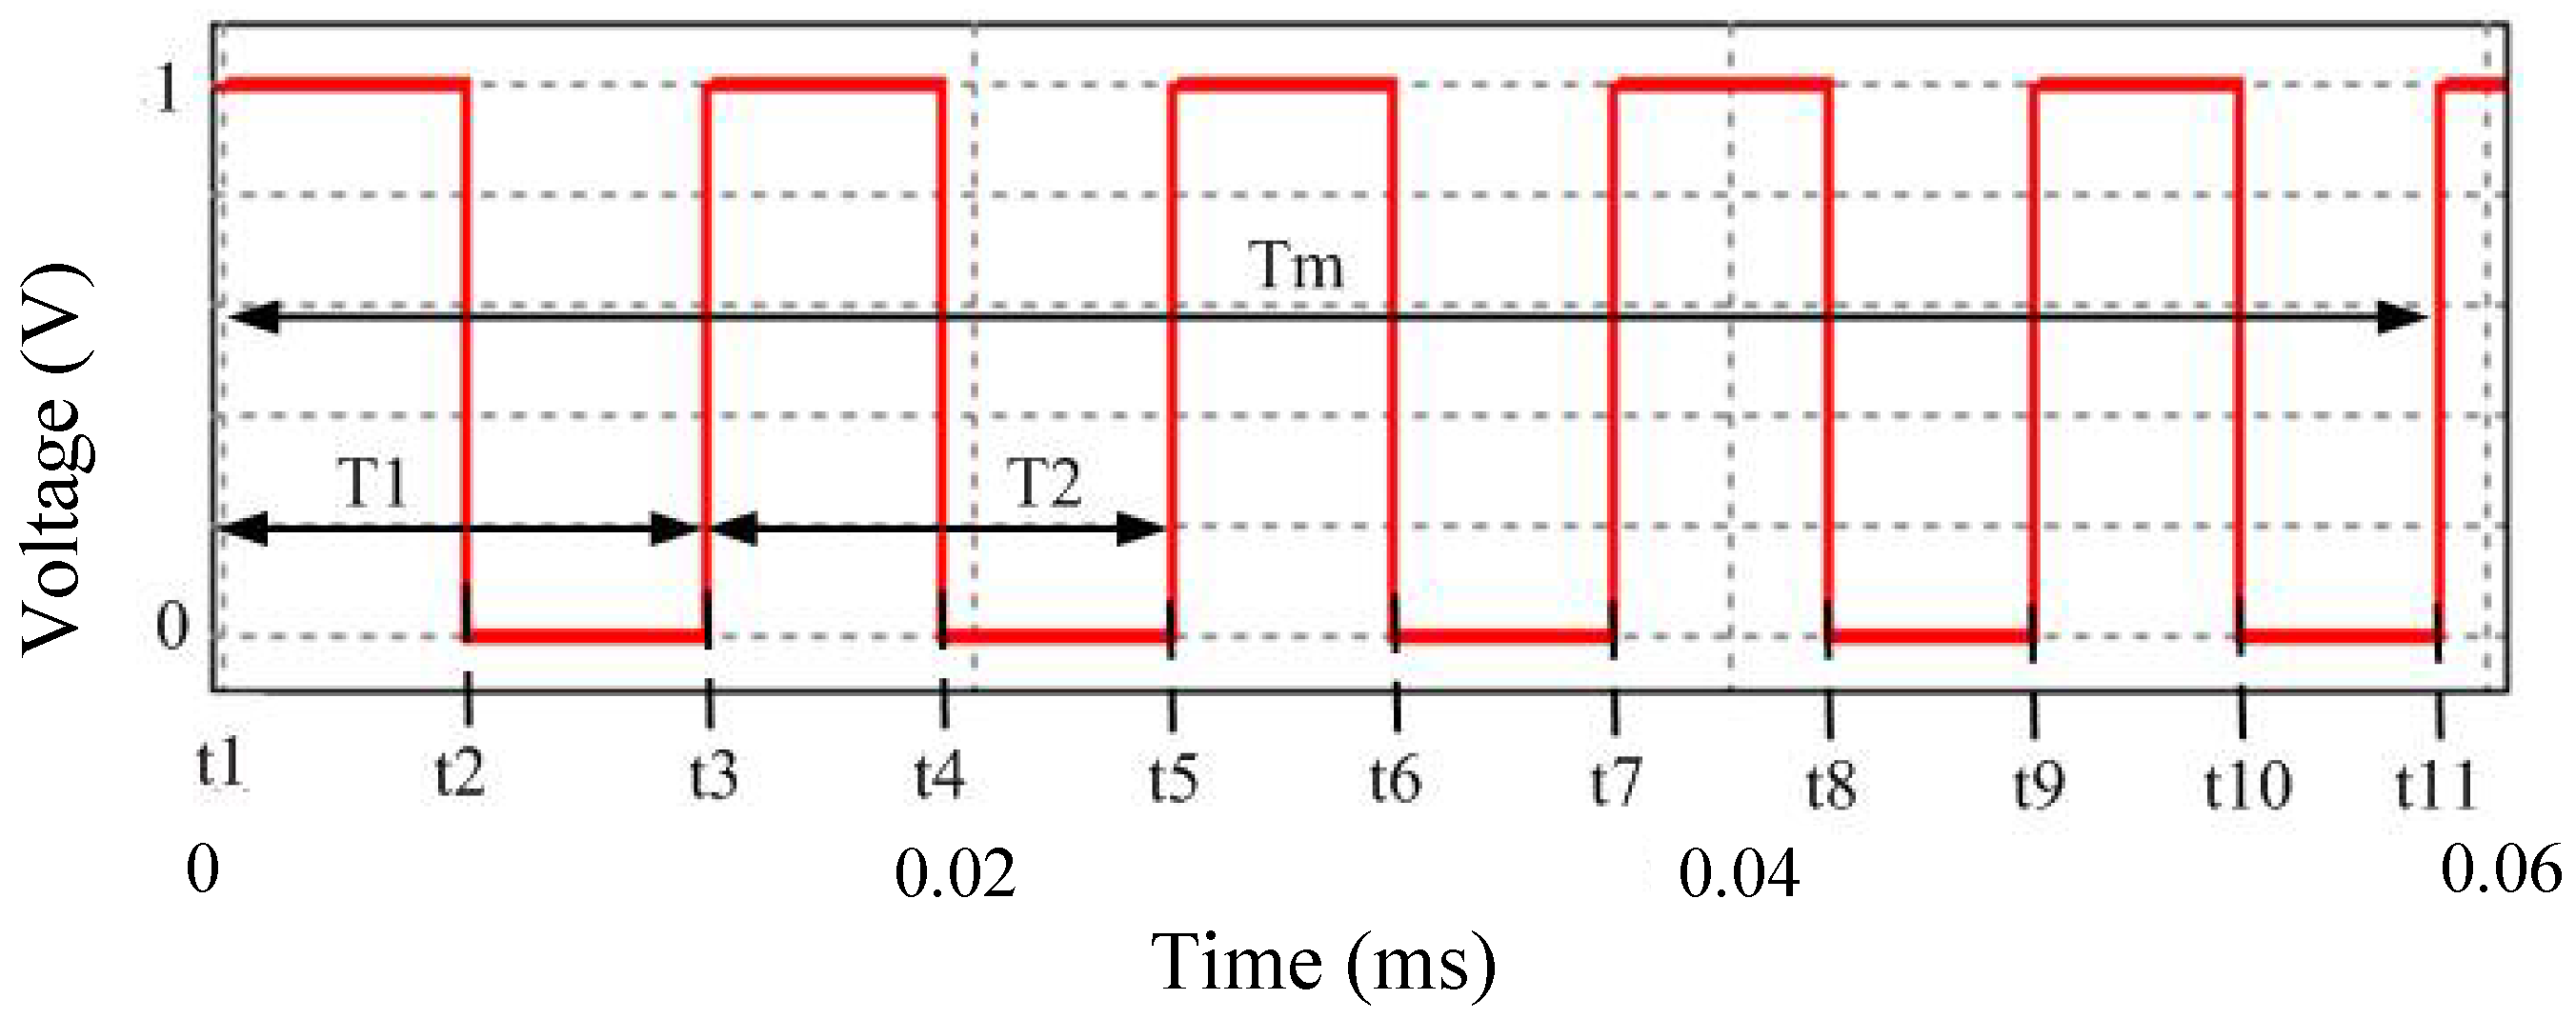
Section 2. Therefore, instead of an MCU, a signal generator Tektronix AFG3022C was used to generate square signal with periodic SFM. The signal generator has a built-in frequency modulator mode and all modulation parameters can be set by it. However, multi-frequency technique (with 2–4 switching frequencies) does not require accurate timings and therefore, a cheap low-resolution microcontroller can be used. So, for obtaining a square signal with multiple frequencies as shown in
Figure 4, we used the MCU ATmega328PB Xplained Mini evaluation board. For generation of the pulse sequence, a direct MCU port manipulation (using
delay_us) was used. By composing the MCU program code, modulation (repetition) frequency
fm and maximum difference between switching frequencies Δ
f =
fmax −
fmin can be simply achieved. Note that when the signal generator was connected to the input of the dead-time circuit, the microcontroller evaluation board was switched off and disconnected from the dead-time control circuit and vice versa.
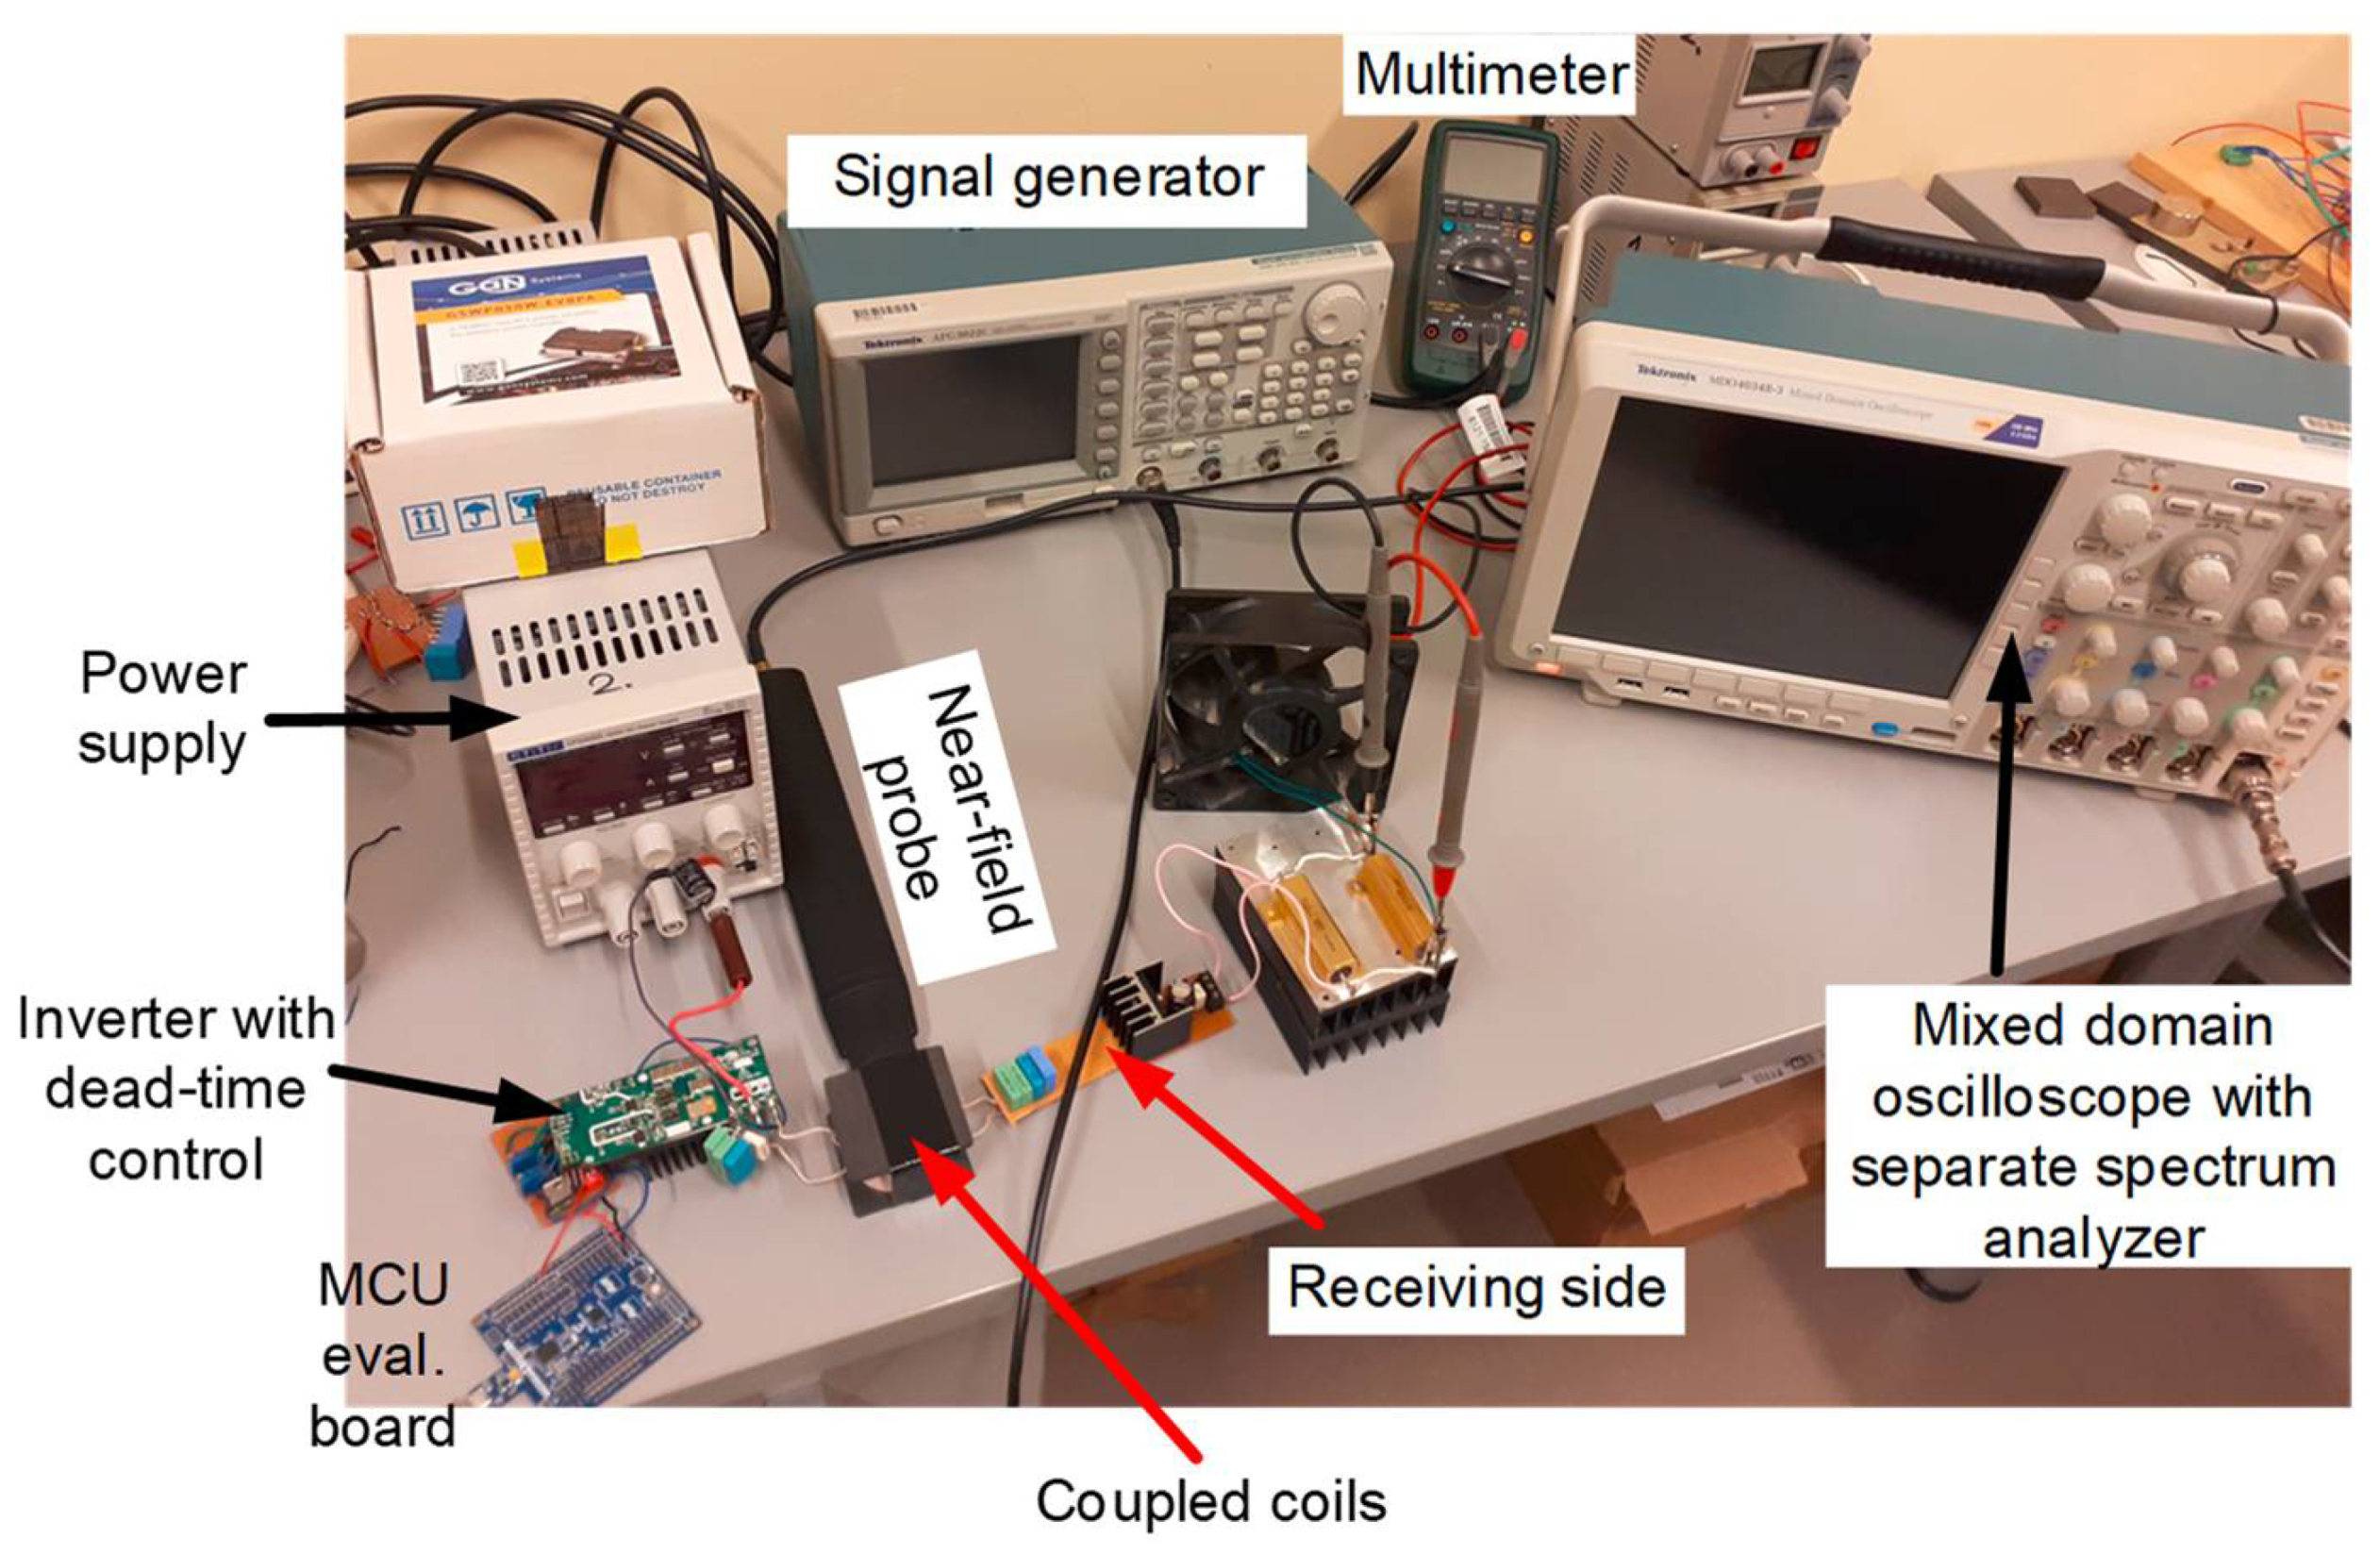
A photo of the experimental setup is shown in
Figure 6. Since at the time of submission of the manuscript the CISPR11 guidelines on limits and measurement methods of the radiated emissions from the inductive-resonant WPT systems were not available, to measure the radiated emissions we used the approach similar to that in [
20]: a near-field H probe (Rohde&Schwarz, HZ-14, 9 kHz–30 MHz) connected to a mixed-domain digital oscilloscope Tektronix MDO4034B with separate spectrum analyzer input to analyze radiated magnetic field in the near-field region. Since output quantity of the near field probe is a voltage level
Vprobe (expressed in dBµV), but we should know the magnetic field strength level
H (expressed in dBμA/m), the near field probe HZ-14 antenna factor AF (taken from the manufacturer datasheet) was added to the output voltage measurement results in dBμV as follows:
The efficiency was calculated as the ratio of measured output real power to measured input real power of the inductive-resonant WPT system.
4. Results and Discussion
The measurements were made within the range 100 kHz … 1 MHz, because in this range the most significant emission levels were measured. The measurements were made for a maximum distance between the coils (1.8 cm) that corresponds to the minimum coupling coefficient of 0.21 (because it was experimentally found out that at the maximum distance between the coils, the radiated emissions levels are the highest). A peak detector was used during the measurements. The obtained results were saved in CSV format files and then postprocessed by using Matlab to take into account the antenna factor of the probe. Since the emission measurement results for fm < RBW were very unstable, we did not calculate the radiated emission reduction coefficients in this case. Moreover, when RBW was chosen to be 10 kHz, the results obtained for modulation frequencies below 8 kHz with peak detector and maxHold function were even worse than those without SFM. For fm ≥ RBW, the measurement results were quite stable and peak detector with averaging of 16 consecutive sweeps was used to achieve better accuracy. The measurements were made with three different RBWs, namely, 100 Hz, 1 kHz and 10 kHz.
During the emissions measurements, it was concluded that the main sources of the radiated magnetic fields are the transmitting and the receiving coils. Since we were interested only in relative measurements, a distance (5 mm) between the probe and the coils was chosen so that quite high levels of the magnetic field emissions could be measured.
Despite the fact that the WPT system was examined in an open-loop mode, the output voltage was measured and adjusted to be 10 V (by adjusting the input power supply output voltage) in order to imitate the closed-loop mode with constant output voltage. This action made the comparable measurements under different control schemes possible, because when different spread-spectrum techniques are applied, the output voltage can be changed.
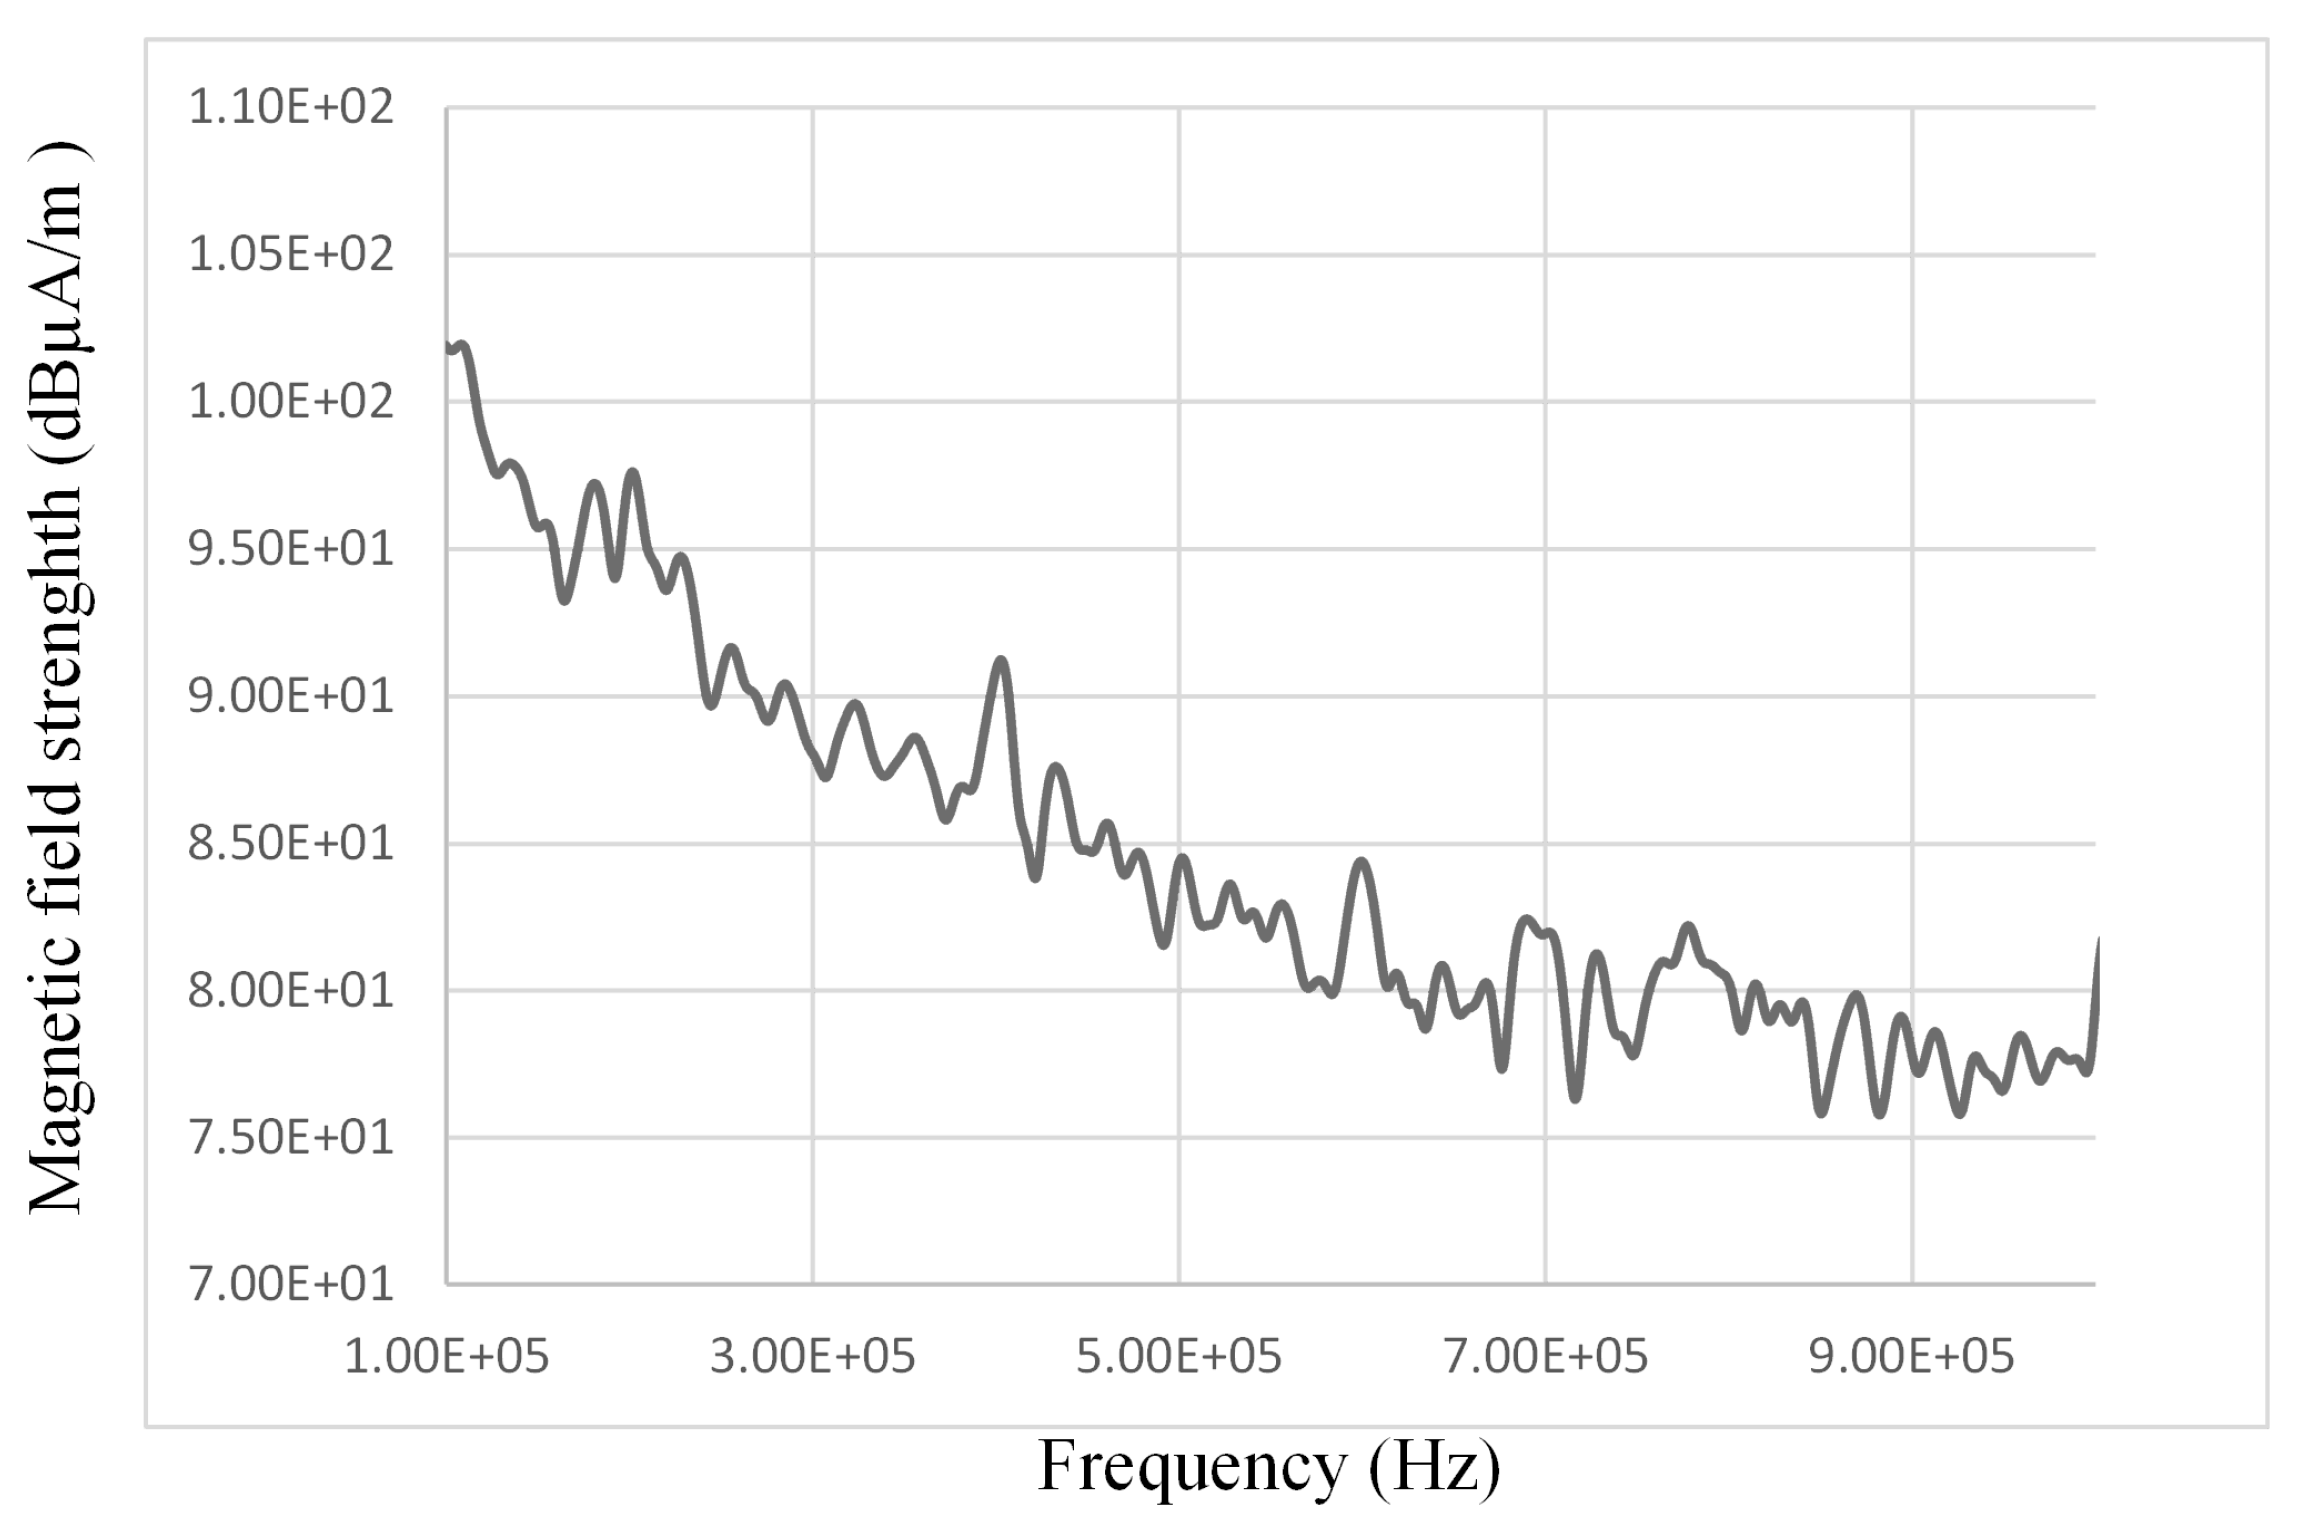
The operation of the signal generator and the power supply does not have any influence on the measured radiated magnetic fields coming from the WPT system under the test. When the WPT system was switched off, the measured emission levels were similar to the noise floor of the spectrum analyzer itself, as may be seen in
Figure 7.
4.1. Analysis of the Radiated Emissions Measurement Results
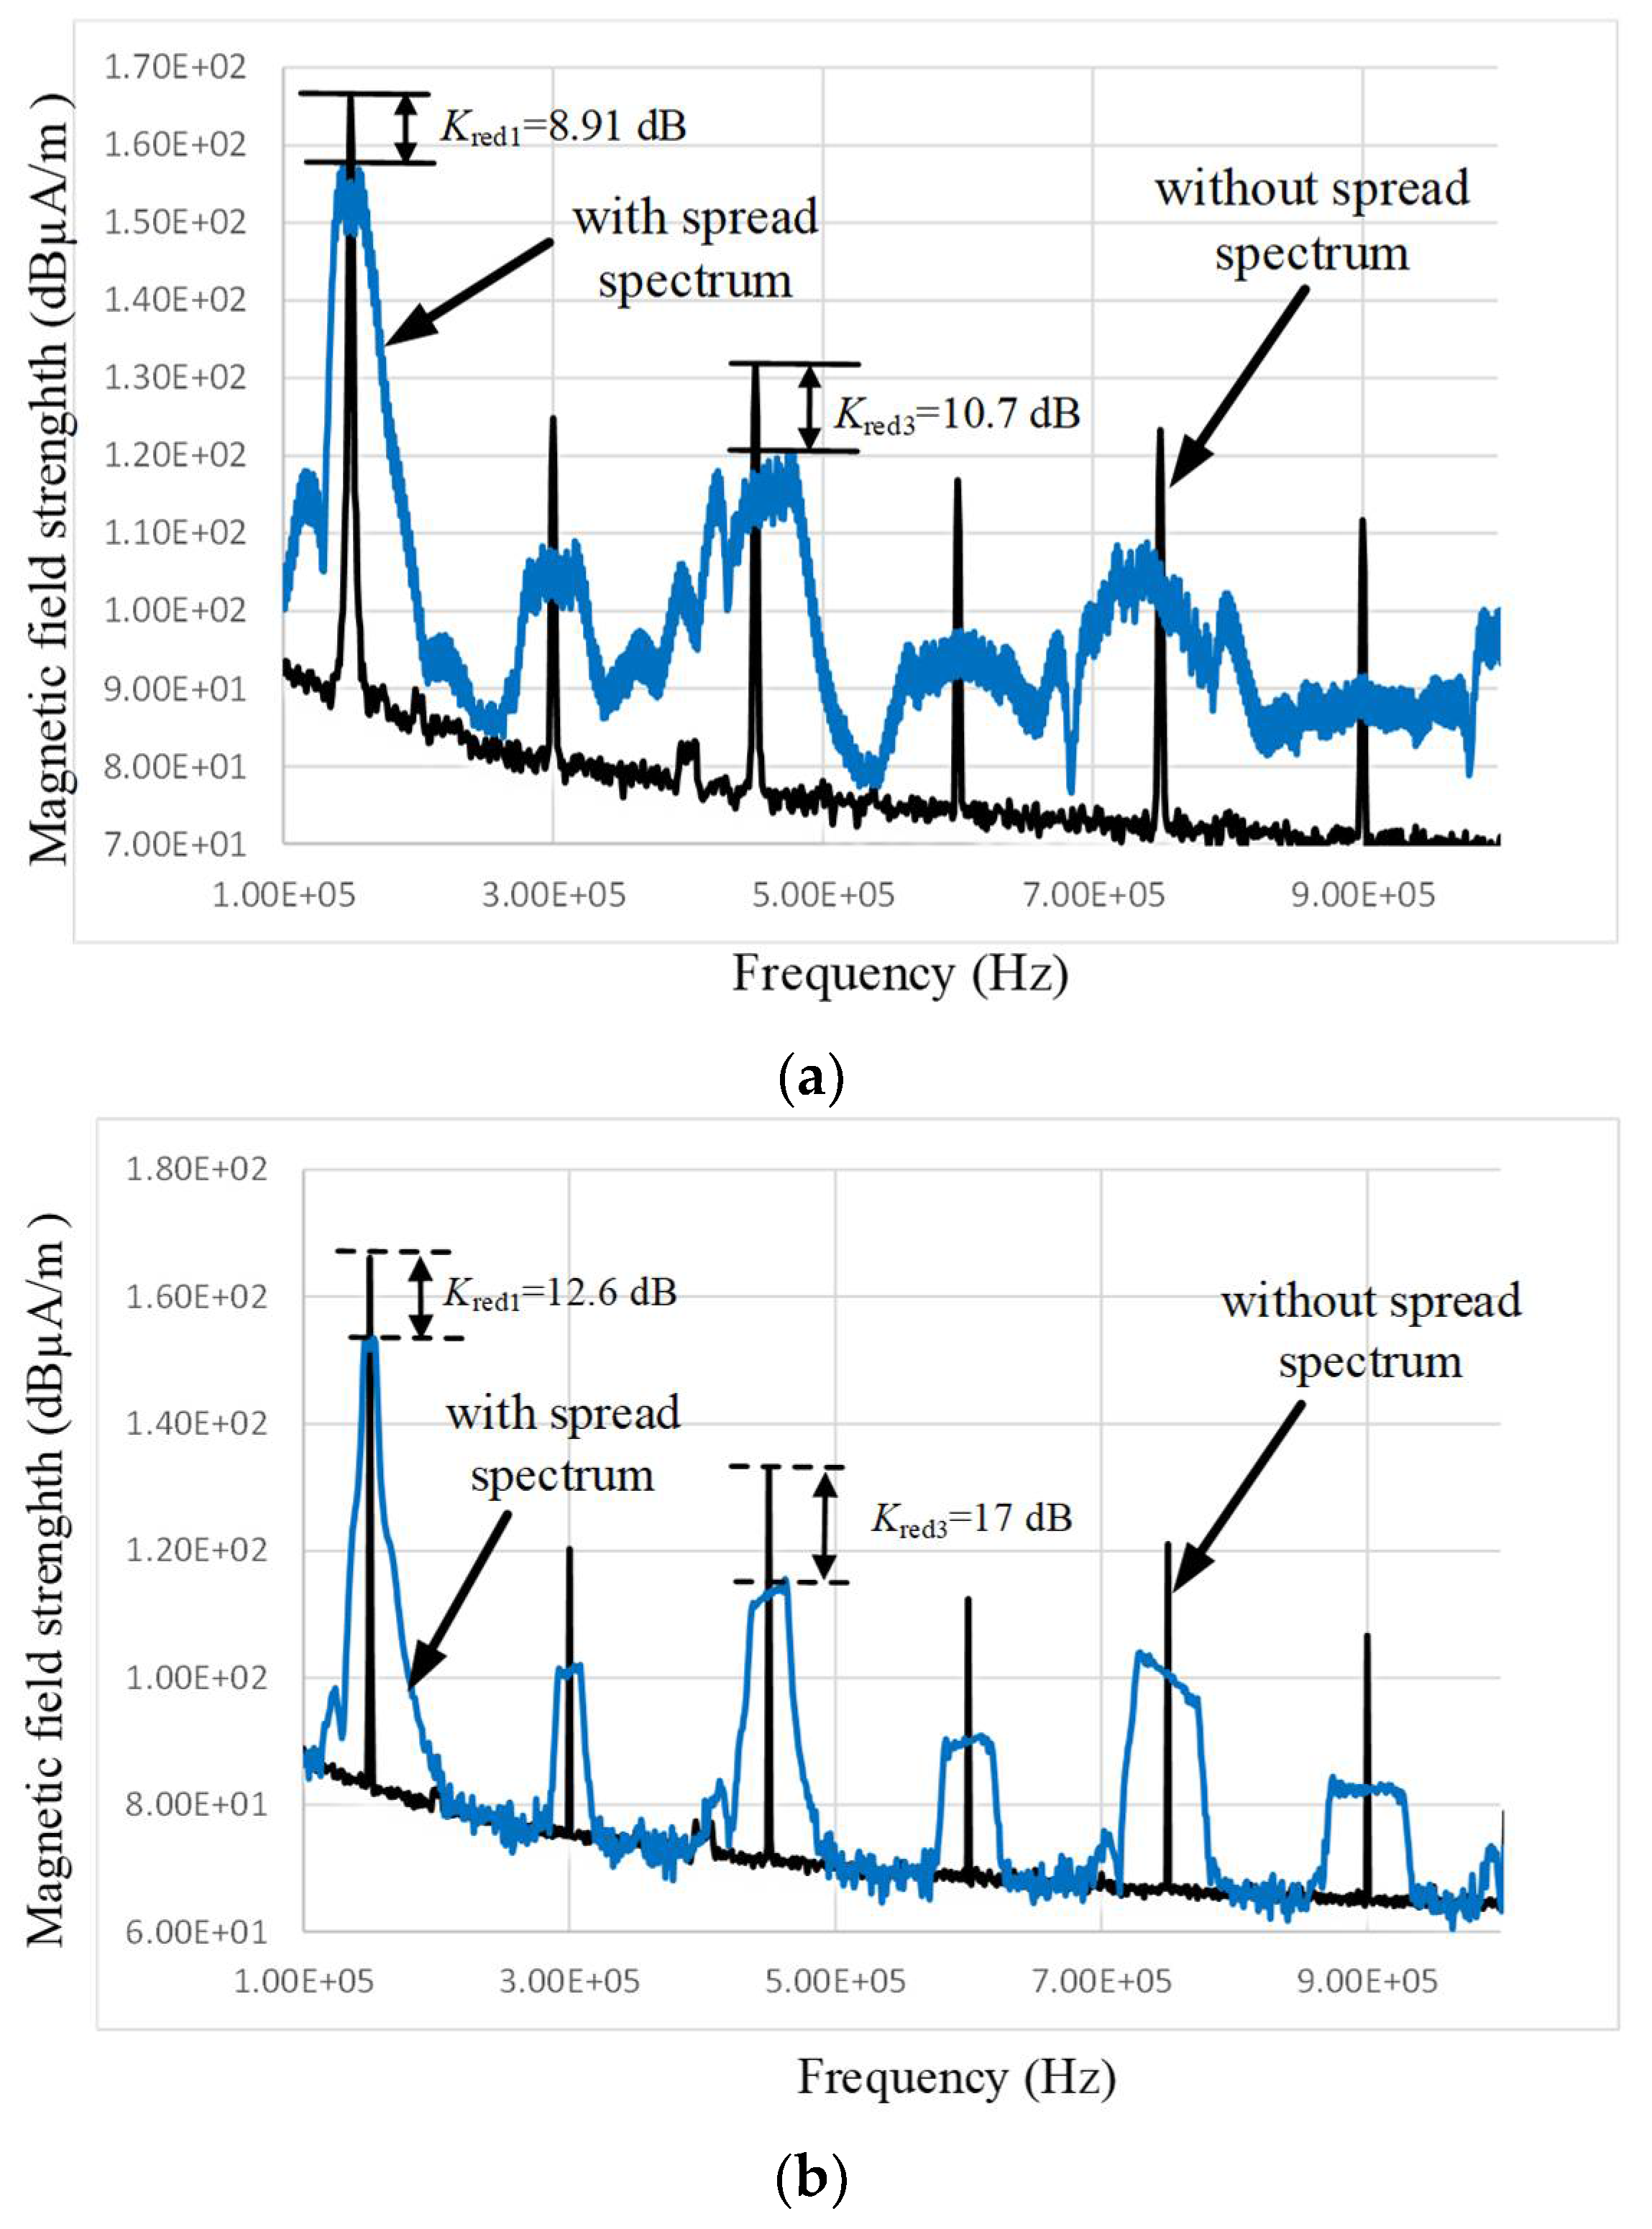
As may be seen from these results, both periodic SFM and multi-frequency techniques lead to a noticeable radiated magnetic fields reduction (when
fm > RBW) as shown in
Figure 8,
Figure 9,
Figure 10,
Figure 11 and
Figure 12. However, when
fm is lower than RBW, then no reduction can be observed. Sometimes, the peak radiated emissions levels may be even higher than those measured without the spread spectrum, because many spectrum components appear within the bandwidth of an intermediate filter of the spectrum analyzer in this case and, therefore, it is not able to distinguish the adjacent spectrum components which are
fm apart. Moreover, as can be seen in
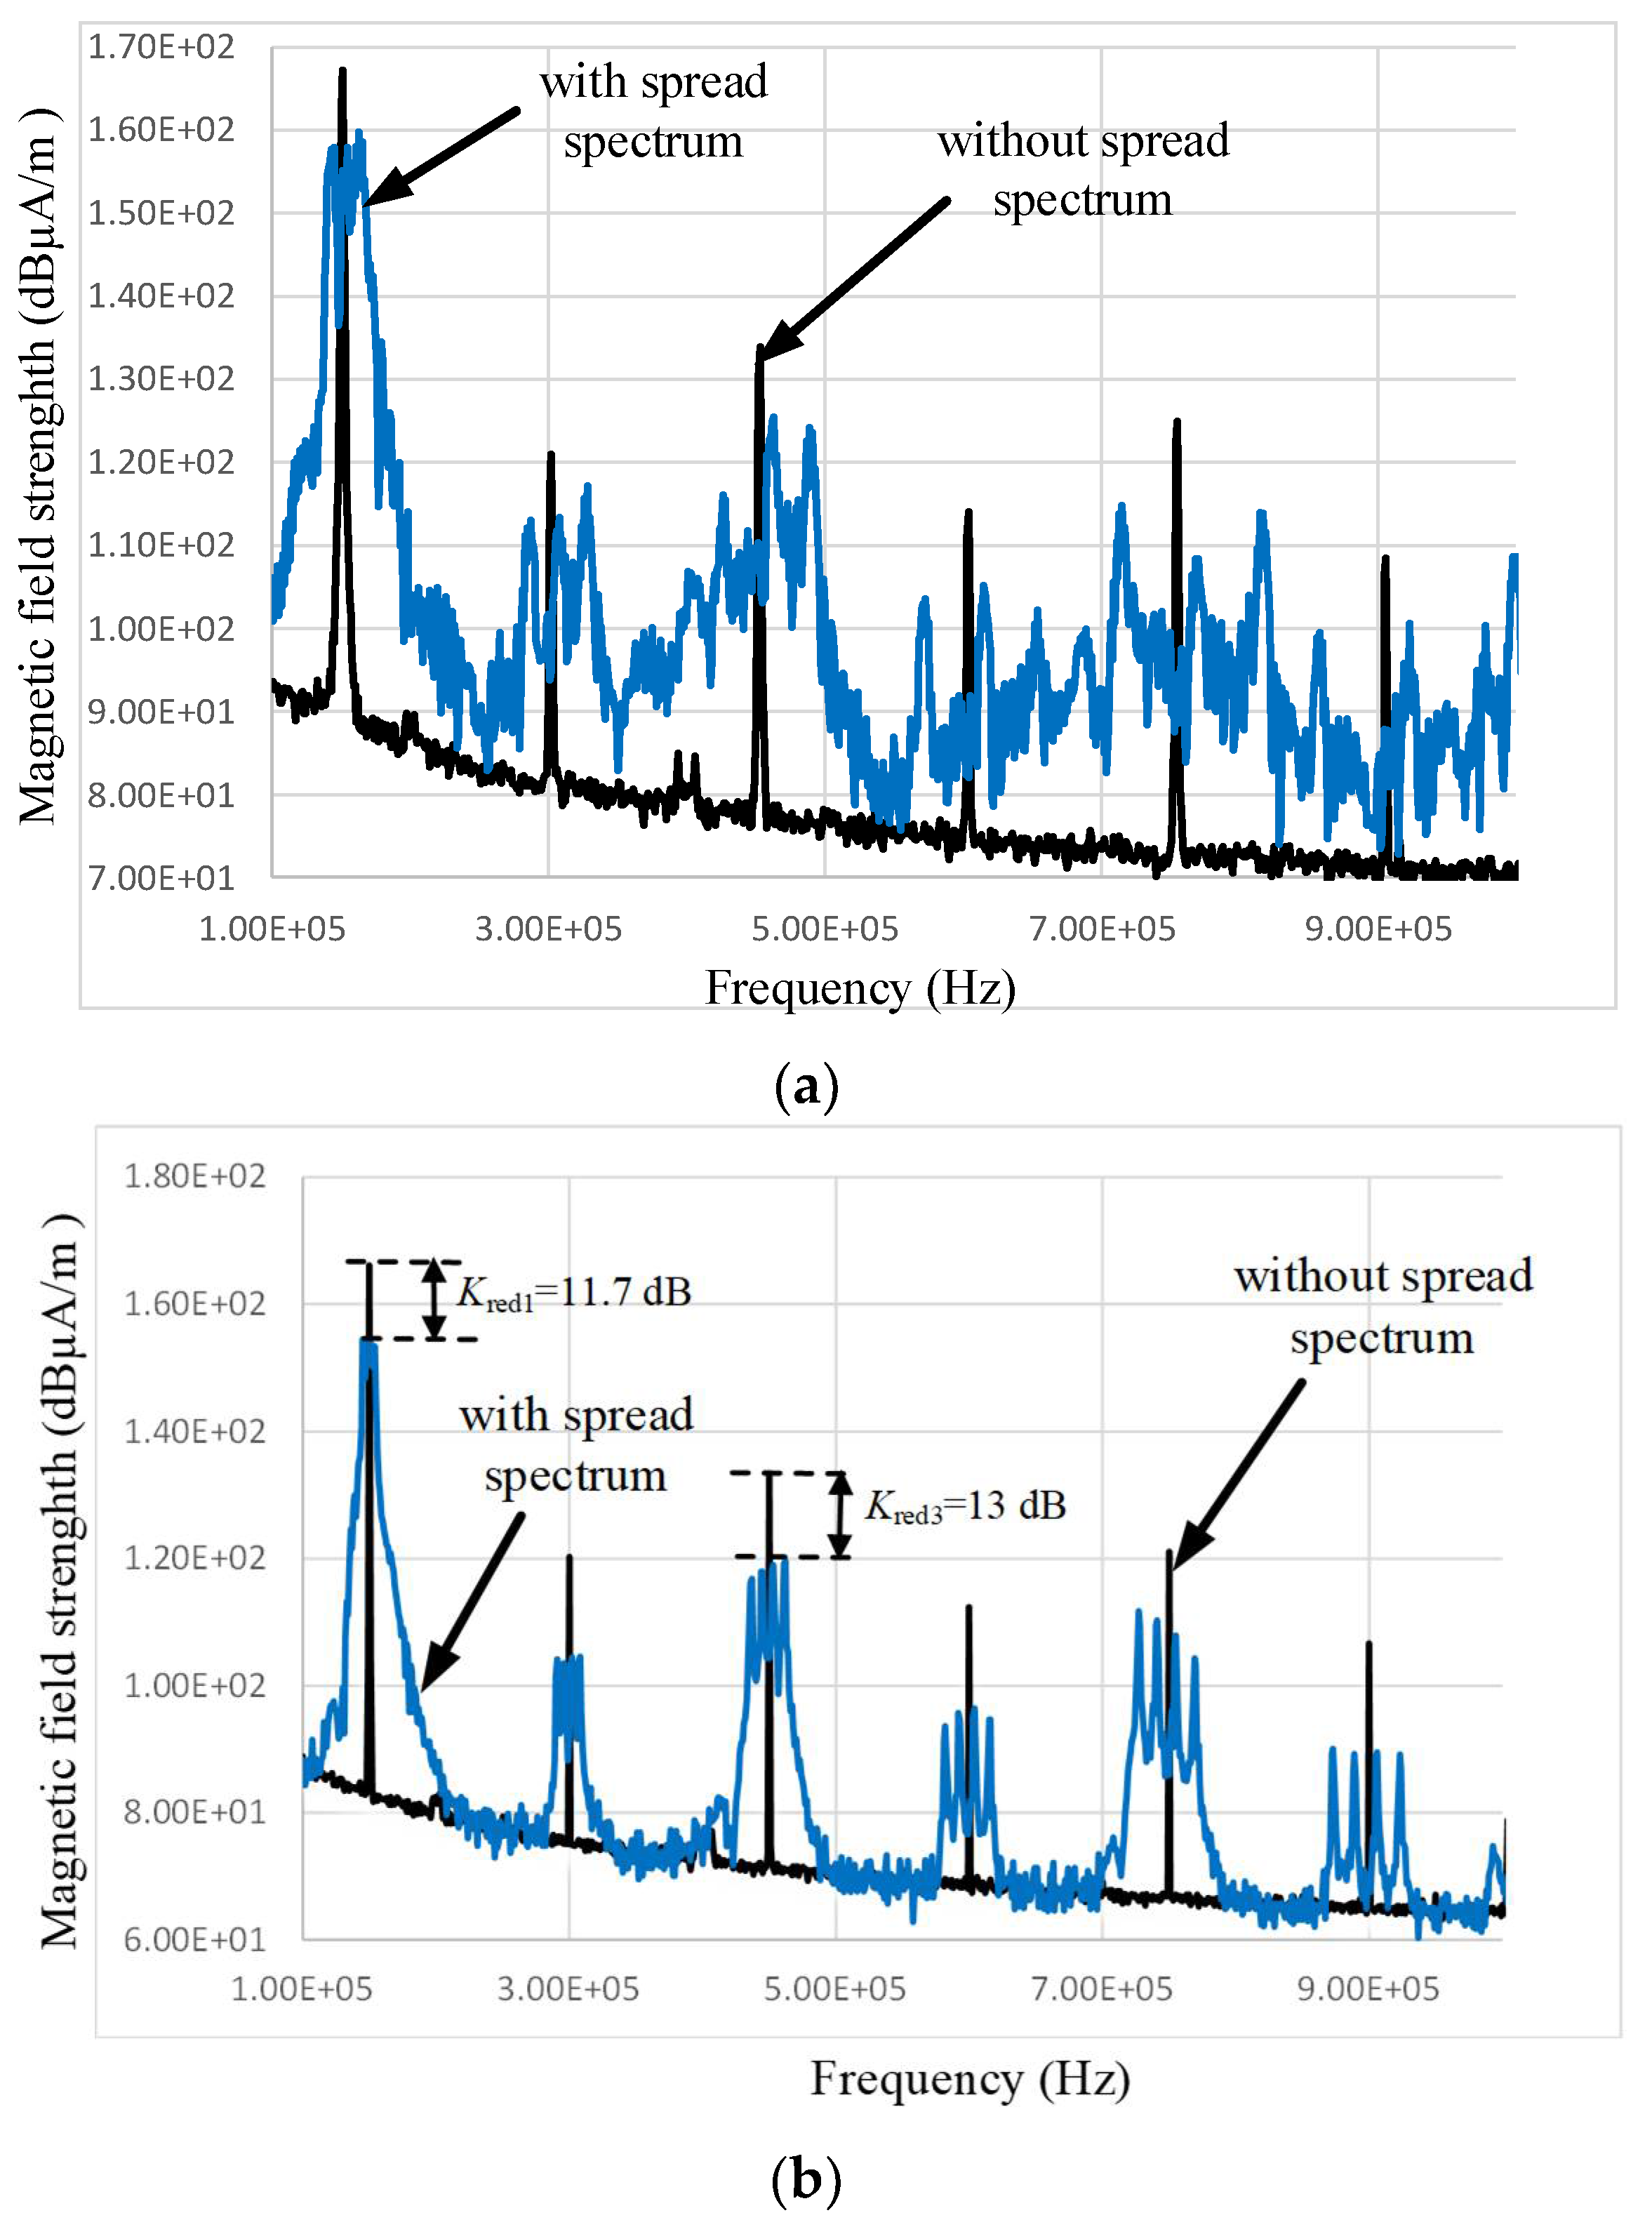
Figure 9, when RBW = 10 kHz, then spectrum components of the radiated emissions of the WPT system without the spread spectrum were visually wider when compared to that if RBW = 1 kHz. In an ideal case, a spectrum component should be a vertical line. As RBW of an intermediate filter of the spectrum analyzer increases, “width” of the spectrum components on the analyzer screen also increases. In
Figure 9b, we can see also that when spread spectrum is used and if
fm is not much higher than RBW, then we cannot see vertical spectrum lines, but we see an envelope (blue line in
Figure 9b).
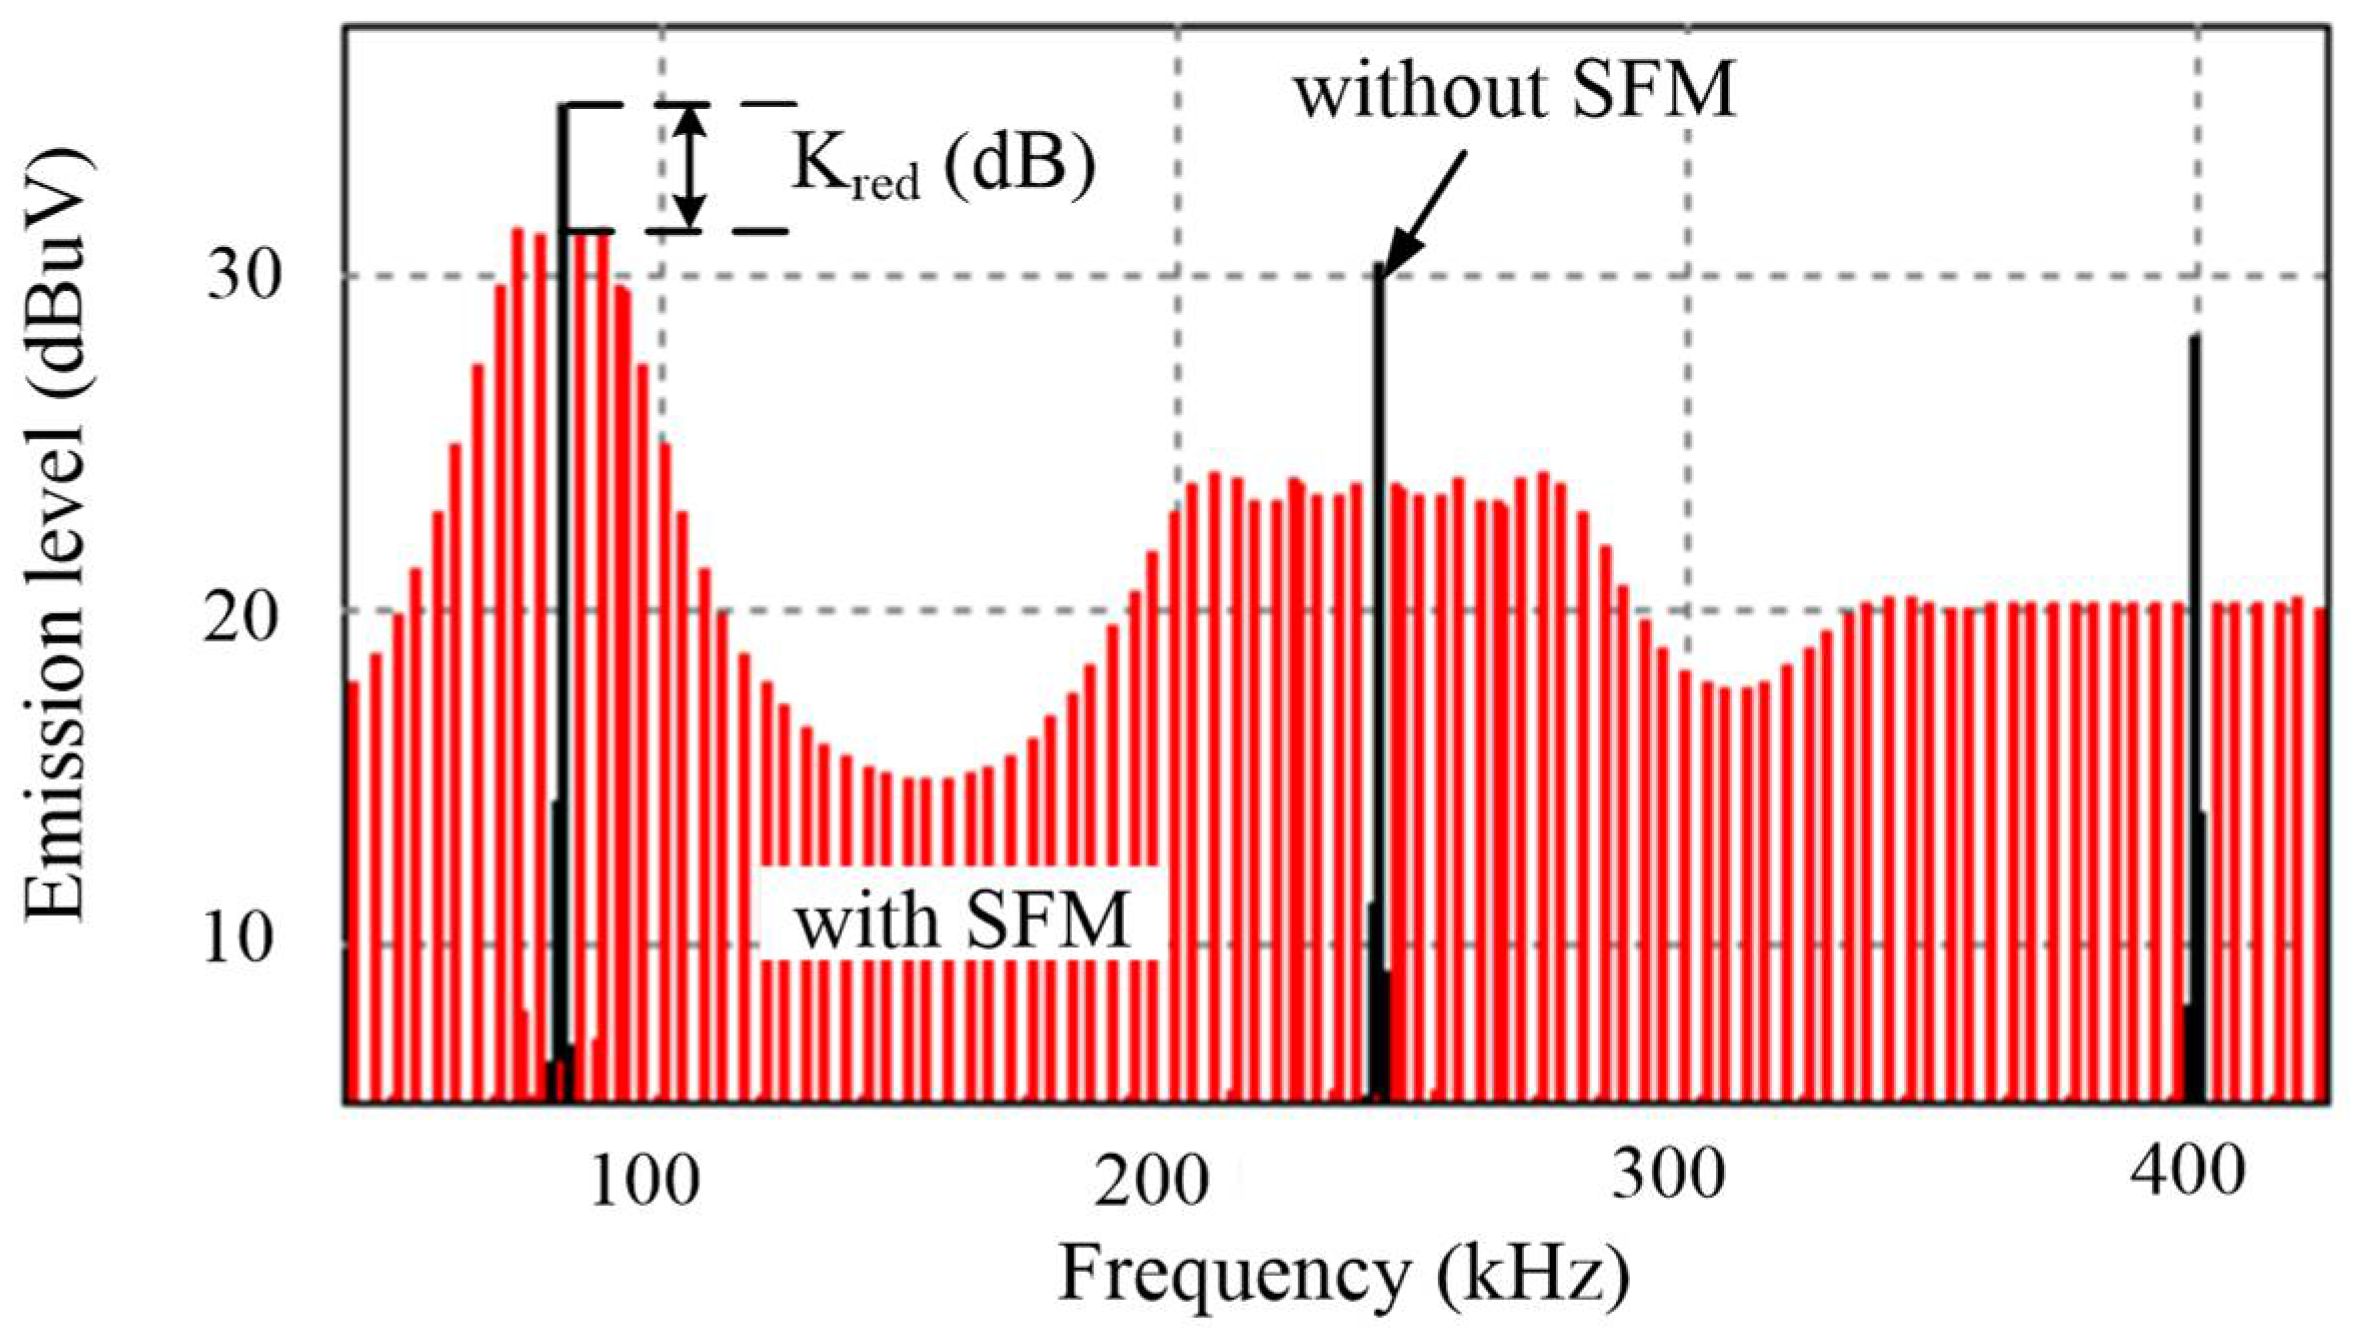
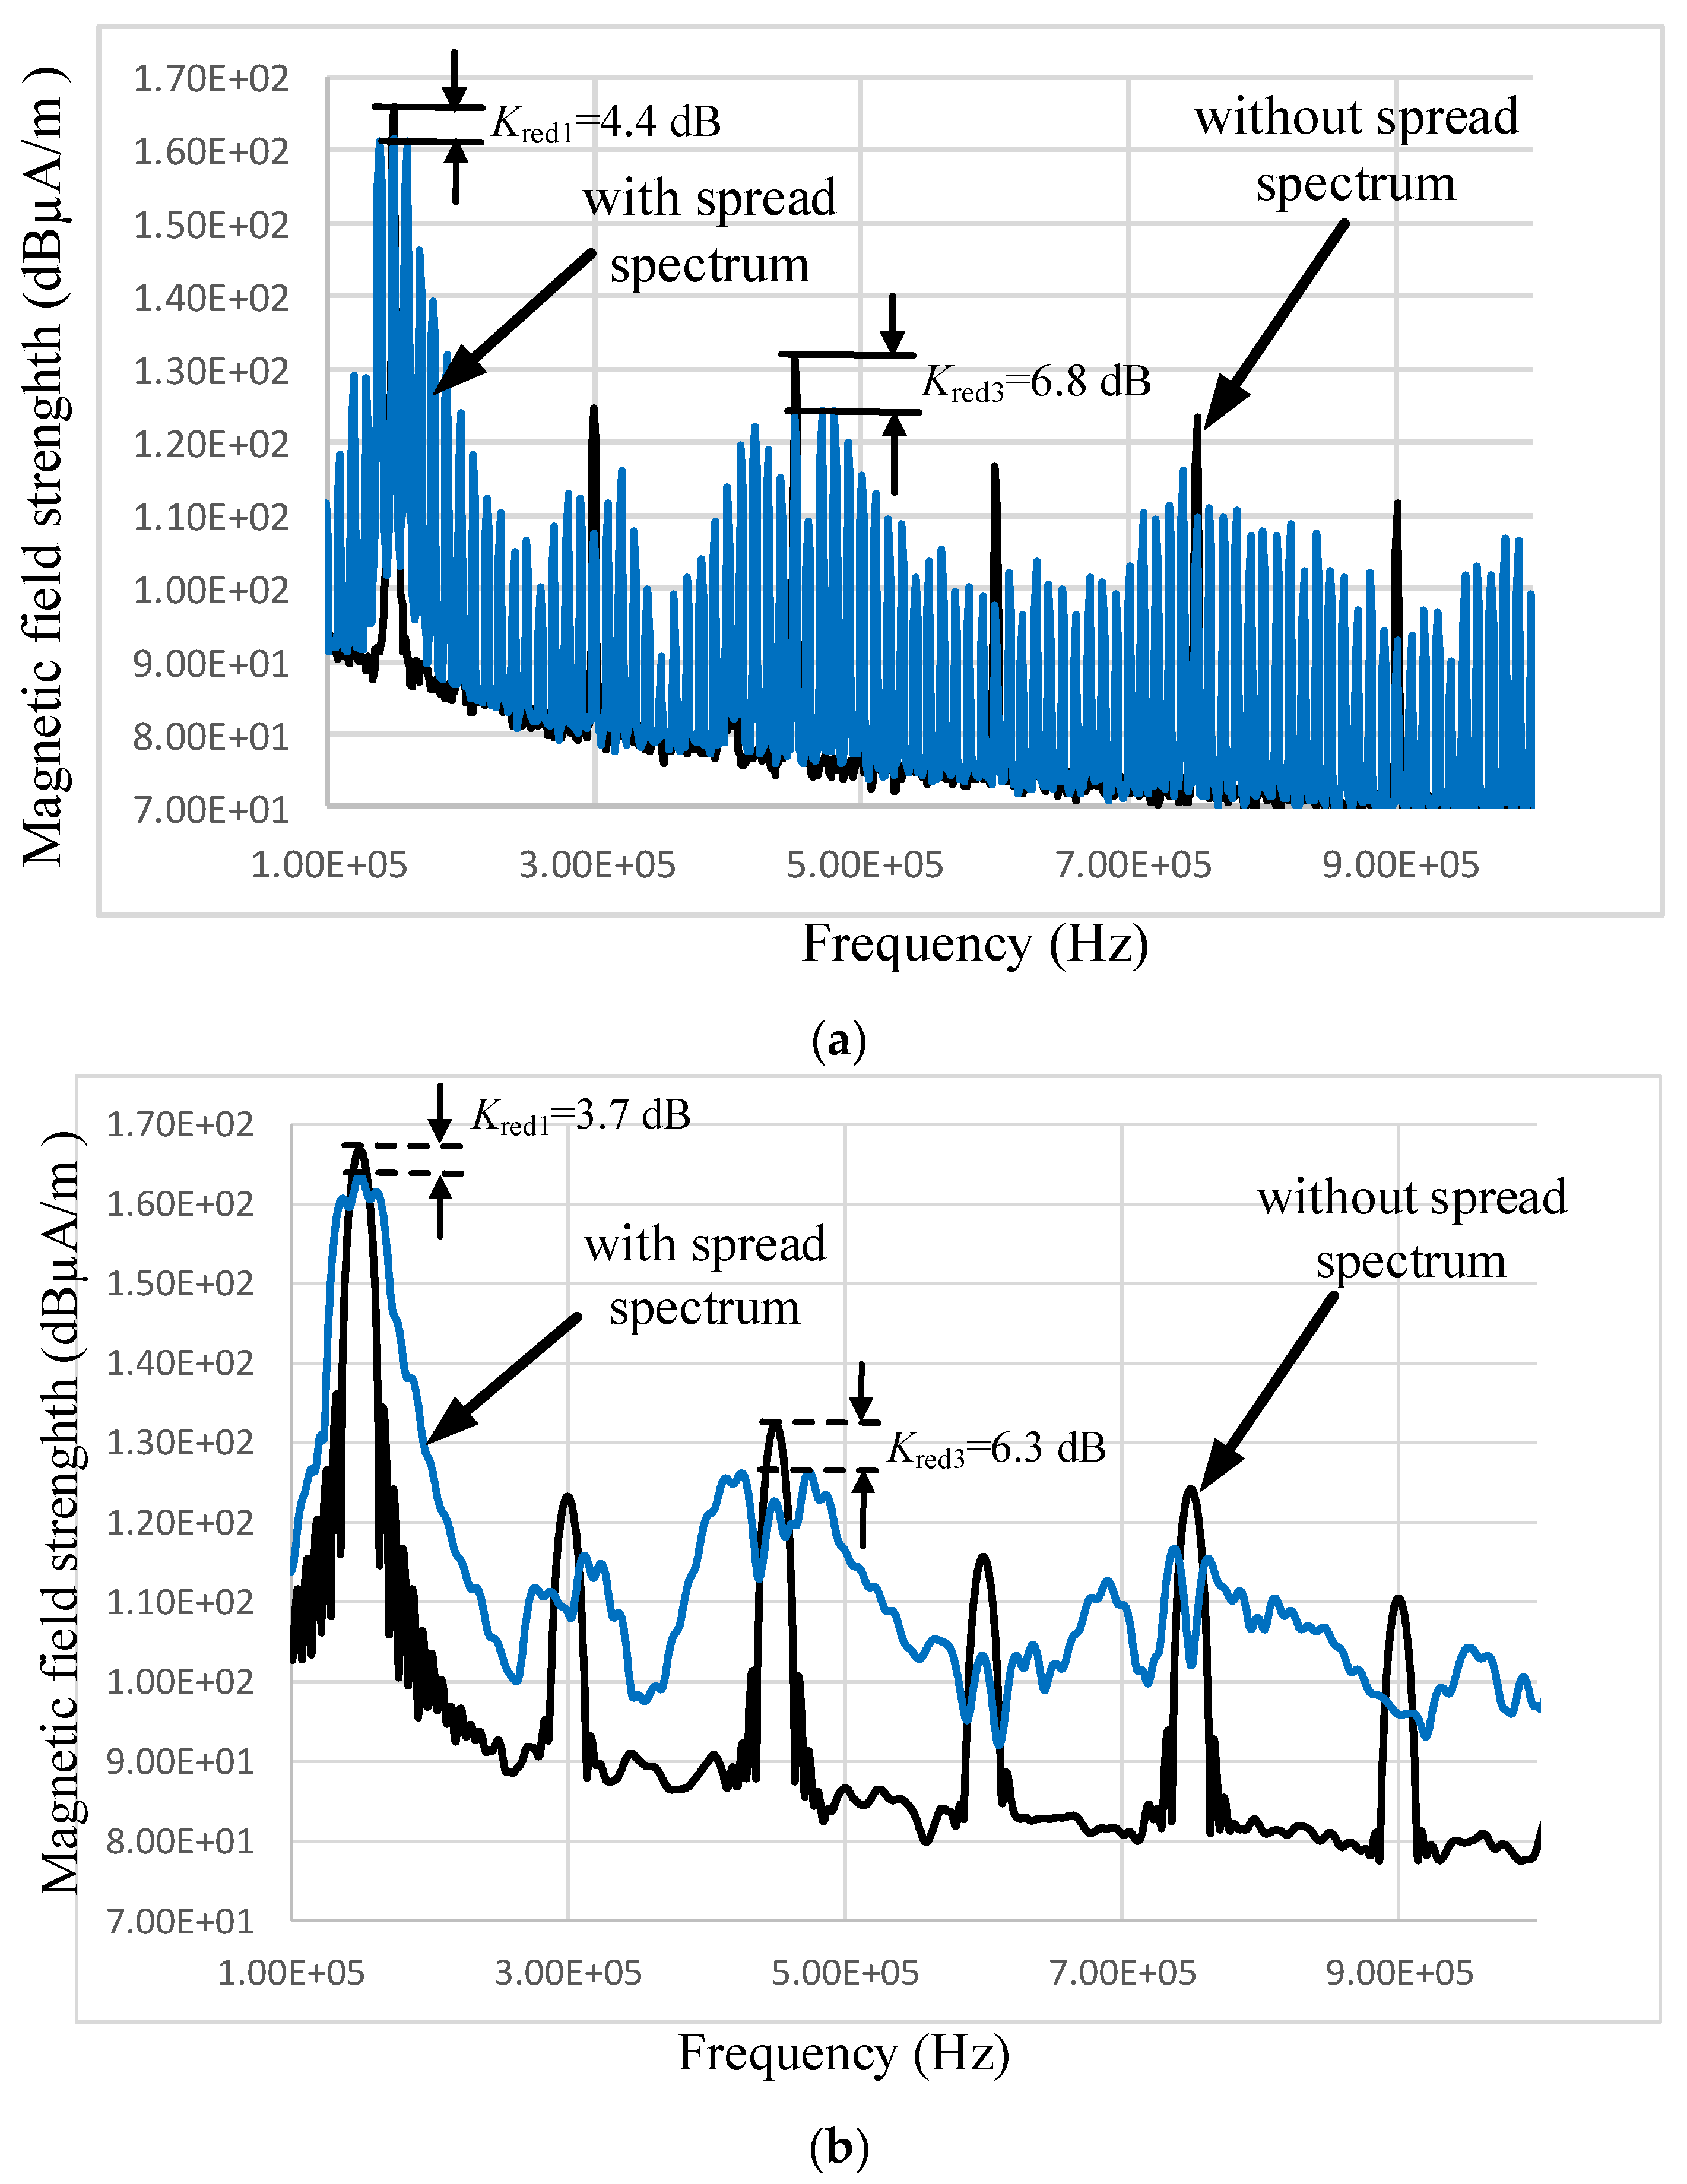
In order to quantitatively assess the radiated emission reduction, fundamental emission harmonic and the third emission harmonic amplitudes reduction coefficients, Kred1 and Kred3, respectively, were calculated from the measurements, because these harmonics are the most dominant ones (especially the first harmonic).
For periodic SFM, the coefficients of the radiated emission reduction are the functions of SFM parameters:
fm, Δ
fpeak and modulation waveforms. The reduction of the amplitudes of the radiated emission higher-order harmonics is better than the reduction of the fundamental harmonic amplitude (see e.g.,
Figure 8) in the frequency range of interest for all modulation waveforms. The multi-frequency technique also gives better reduction of the amplitudes of higher-order harmonics than the reduction of the fundamental one (
Figure 10). At high modulation indexes (
β = Δ
fpeak/
fm > 2.5), the ramp SFM is the best choice, but at lower
β sine SFM is the best choice (see
Figure 11). As the modulation frequency increases, the radiated emissions reduction becomes worse. This, actually, coincides with the Bessel functions theory: higher arguments (
β) of the Bessel functions give lower values of the functions.
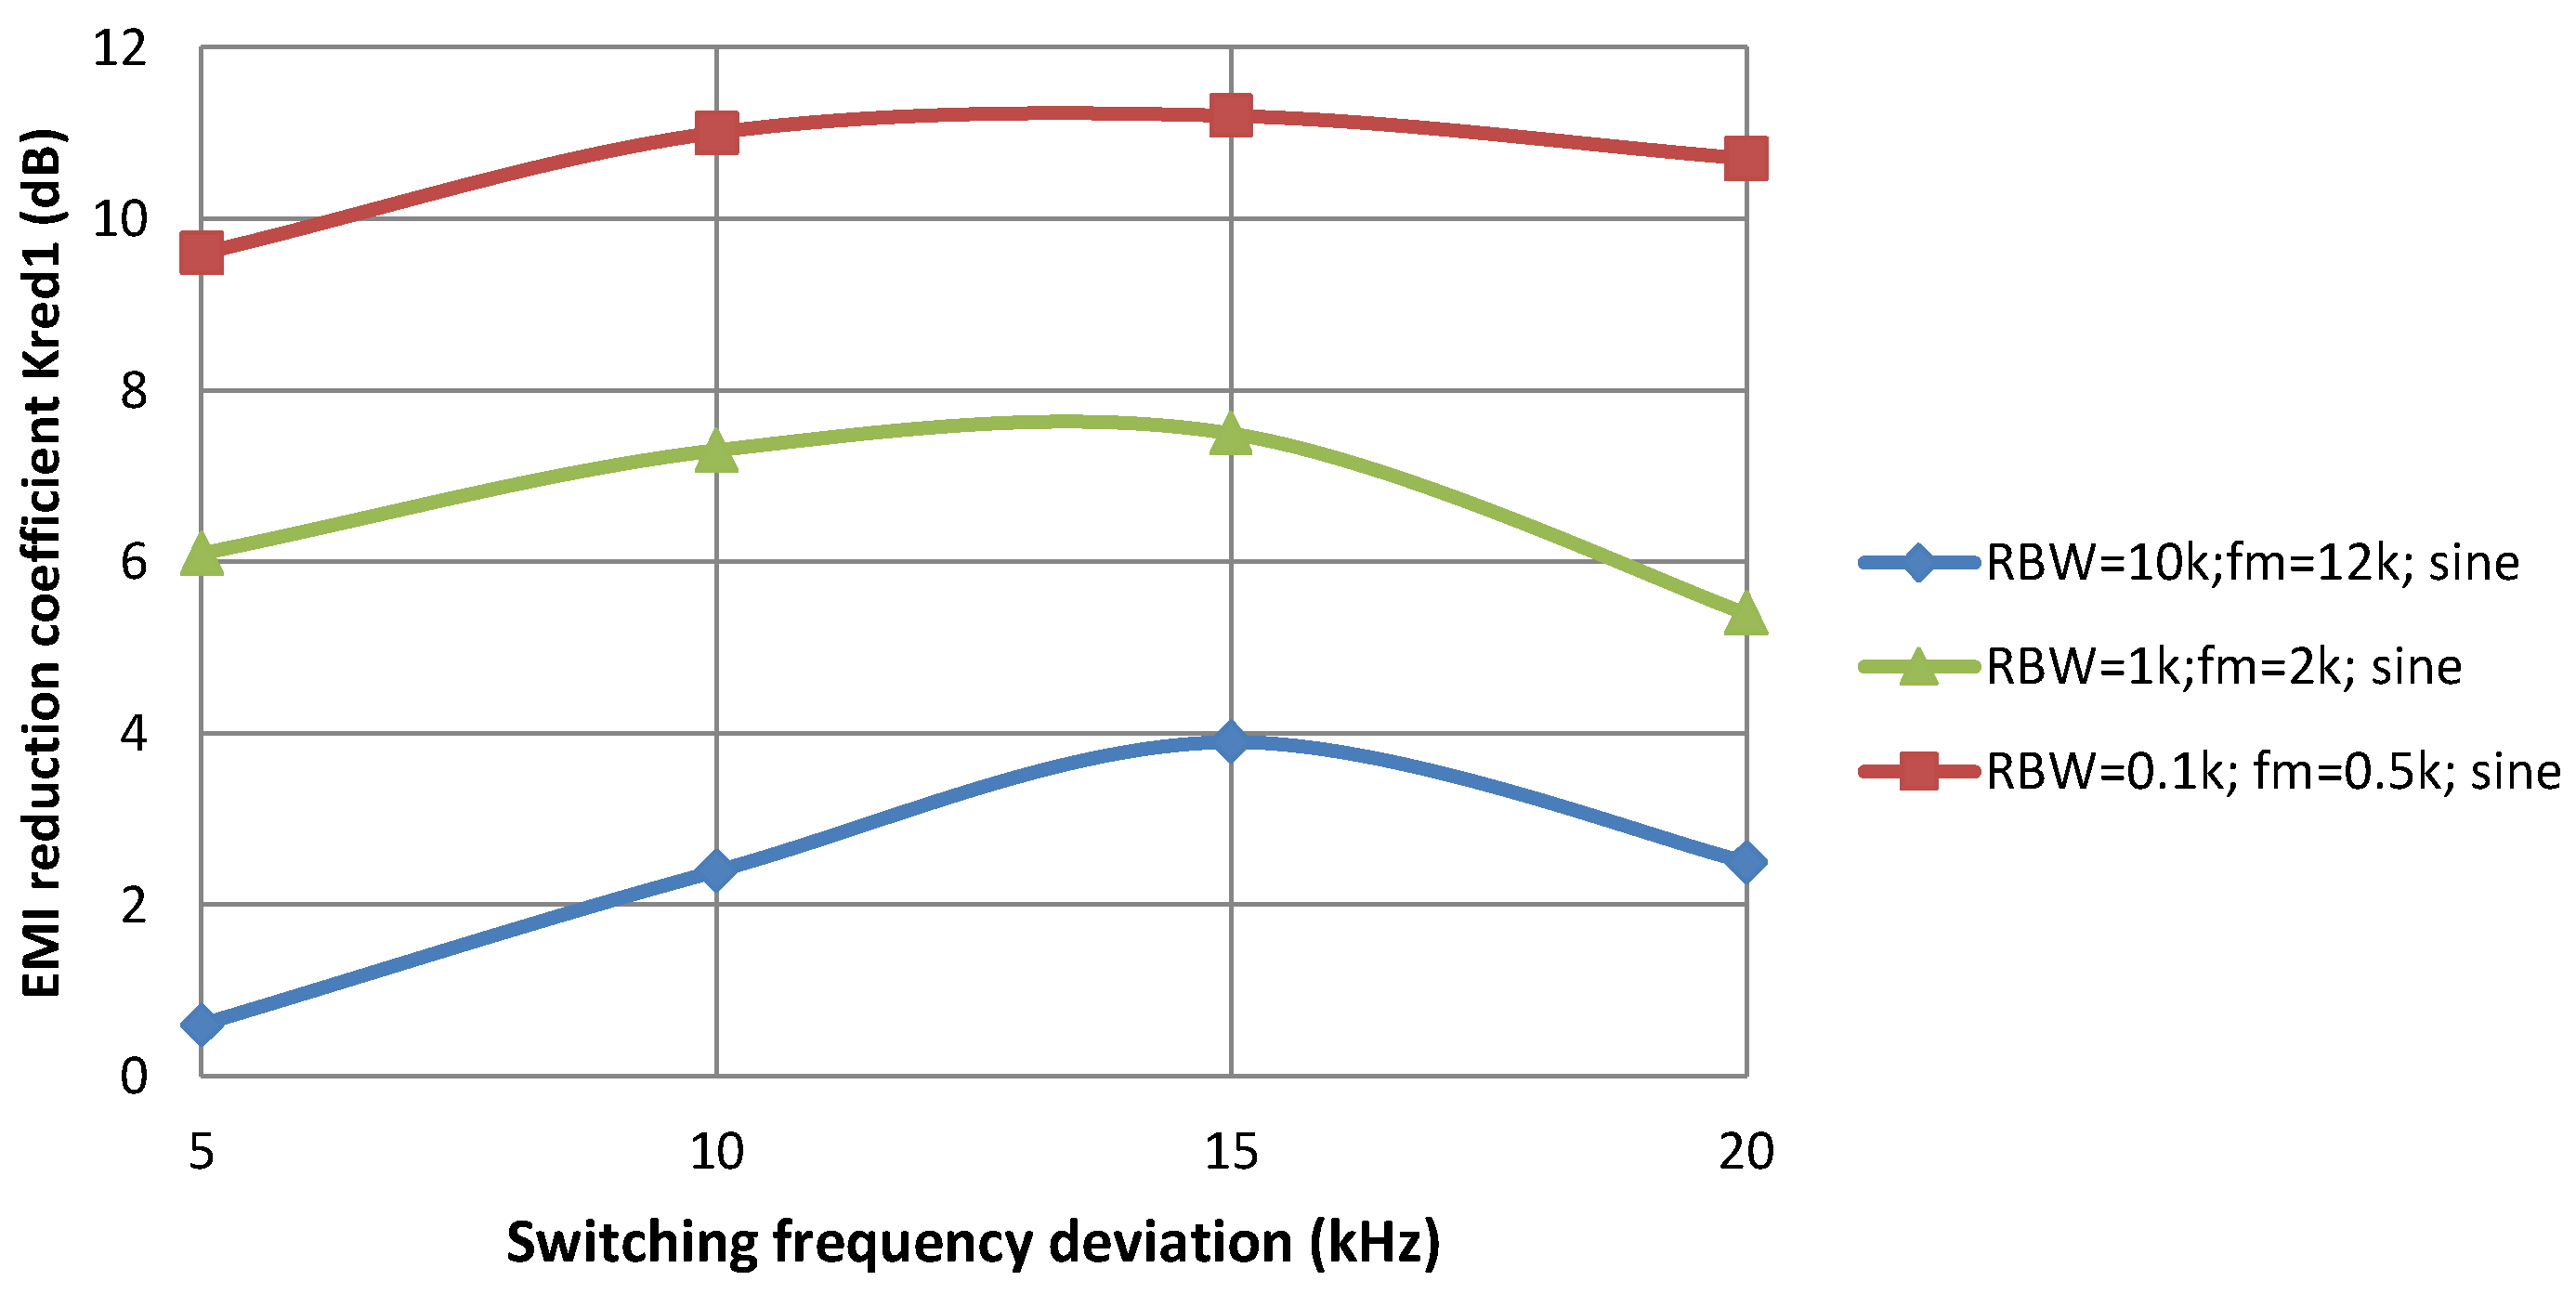
However, the dependence of the fundamental harmonic reduction coefficient
Kred1 on Δ
fpeak is more interesting:
Kred1 improves as Δ
fpeak increases, but when Δ
fpeak exceeds 13–16 kHz, the emissions reduction worsens (
Figure 12). Increasing of
Kred1 with Δ
fpeak increasing is logical and can be easily described by the Bessel functions theory. However, why does the emission reduction become smaller at high Δ
fpeak? This can be described by the interaction between the SFM and the WPT system operating with the coupling coefficient larger than its critical value. When coupling coefficient between the receiving and transmitting coils is above its critical value, then well-known “frequency splitting phenomena” takes place, due to which there are two output power (and the coils’ currents) peaks. For the WPT system under the study, there are two output power maxima at frequencies 149 ± 13 kHz (at 149 kHz there was power minimum) when
k = 0.21. Since the main power of modulated emissions lies within the bandwidth of 2Δ
fpeak (for fundamental frequency component), for Δ
fpeak exceeding 13 kHz, the frequency components of the emissions due to the modulations appearing in the vicinity of the output power maxima can be significantly amplified owing to the frequency splitting phenomenon. As a result, there is worsening of the radiated emissions reduction coefficient
Kred1 observed for Δ
fpeak > 12 kHz. However, it is very important to note that the higher-order harmonics reduction coefficients improve, as Δ
fpeak increase even up to Δ
fpeak = 30 kHz. The reason for this is that the frequency splitting phenomenon does not occur at these frequencies.
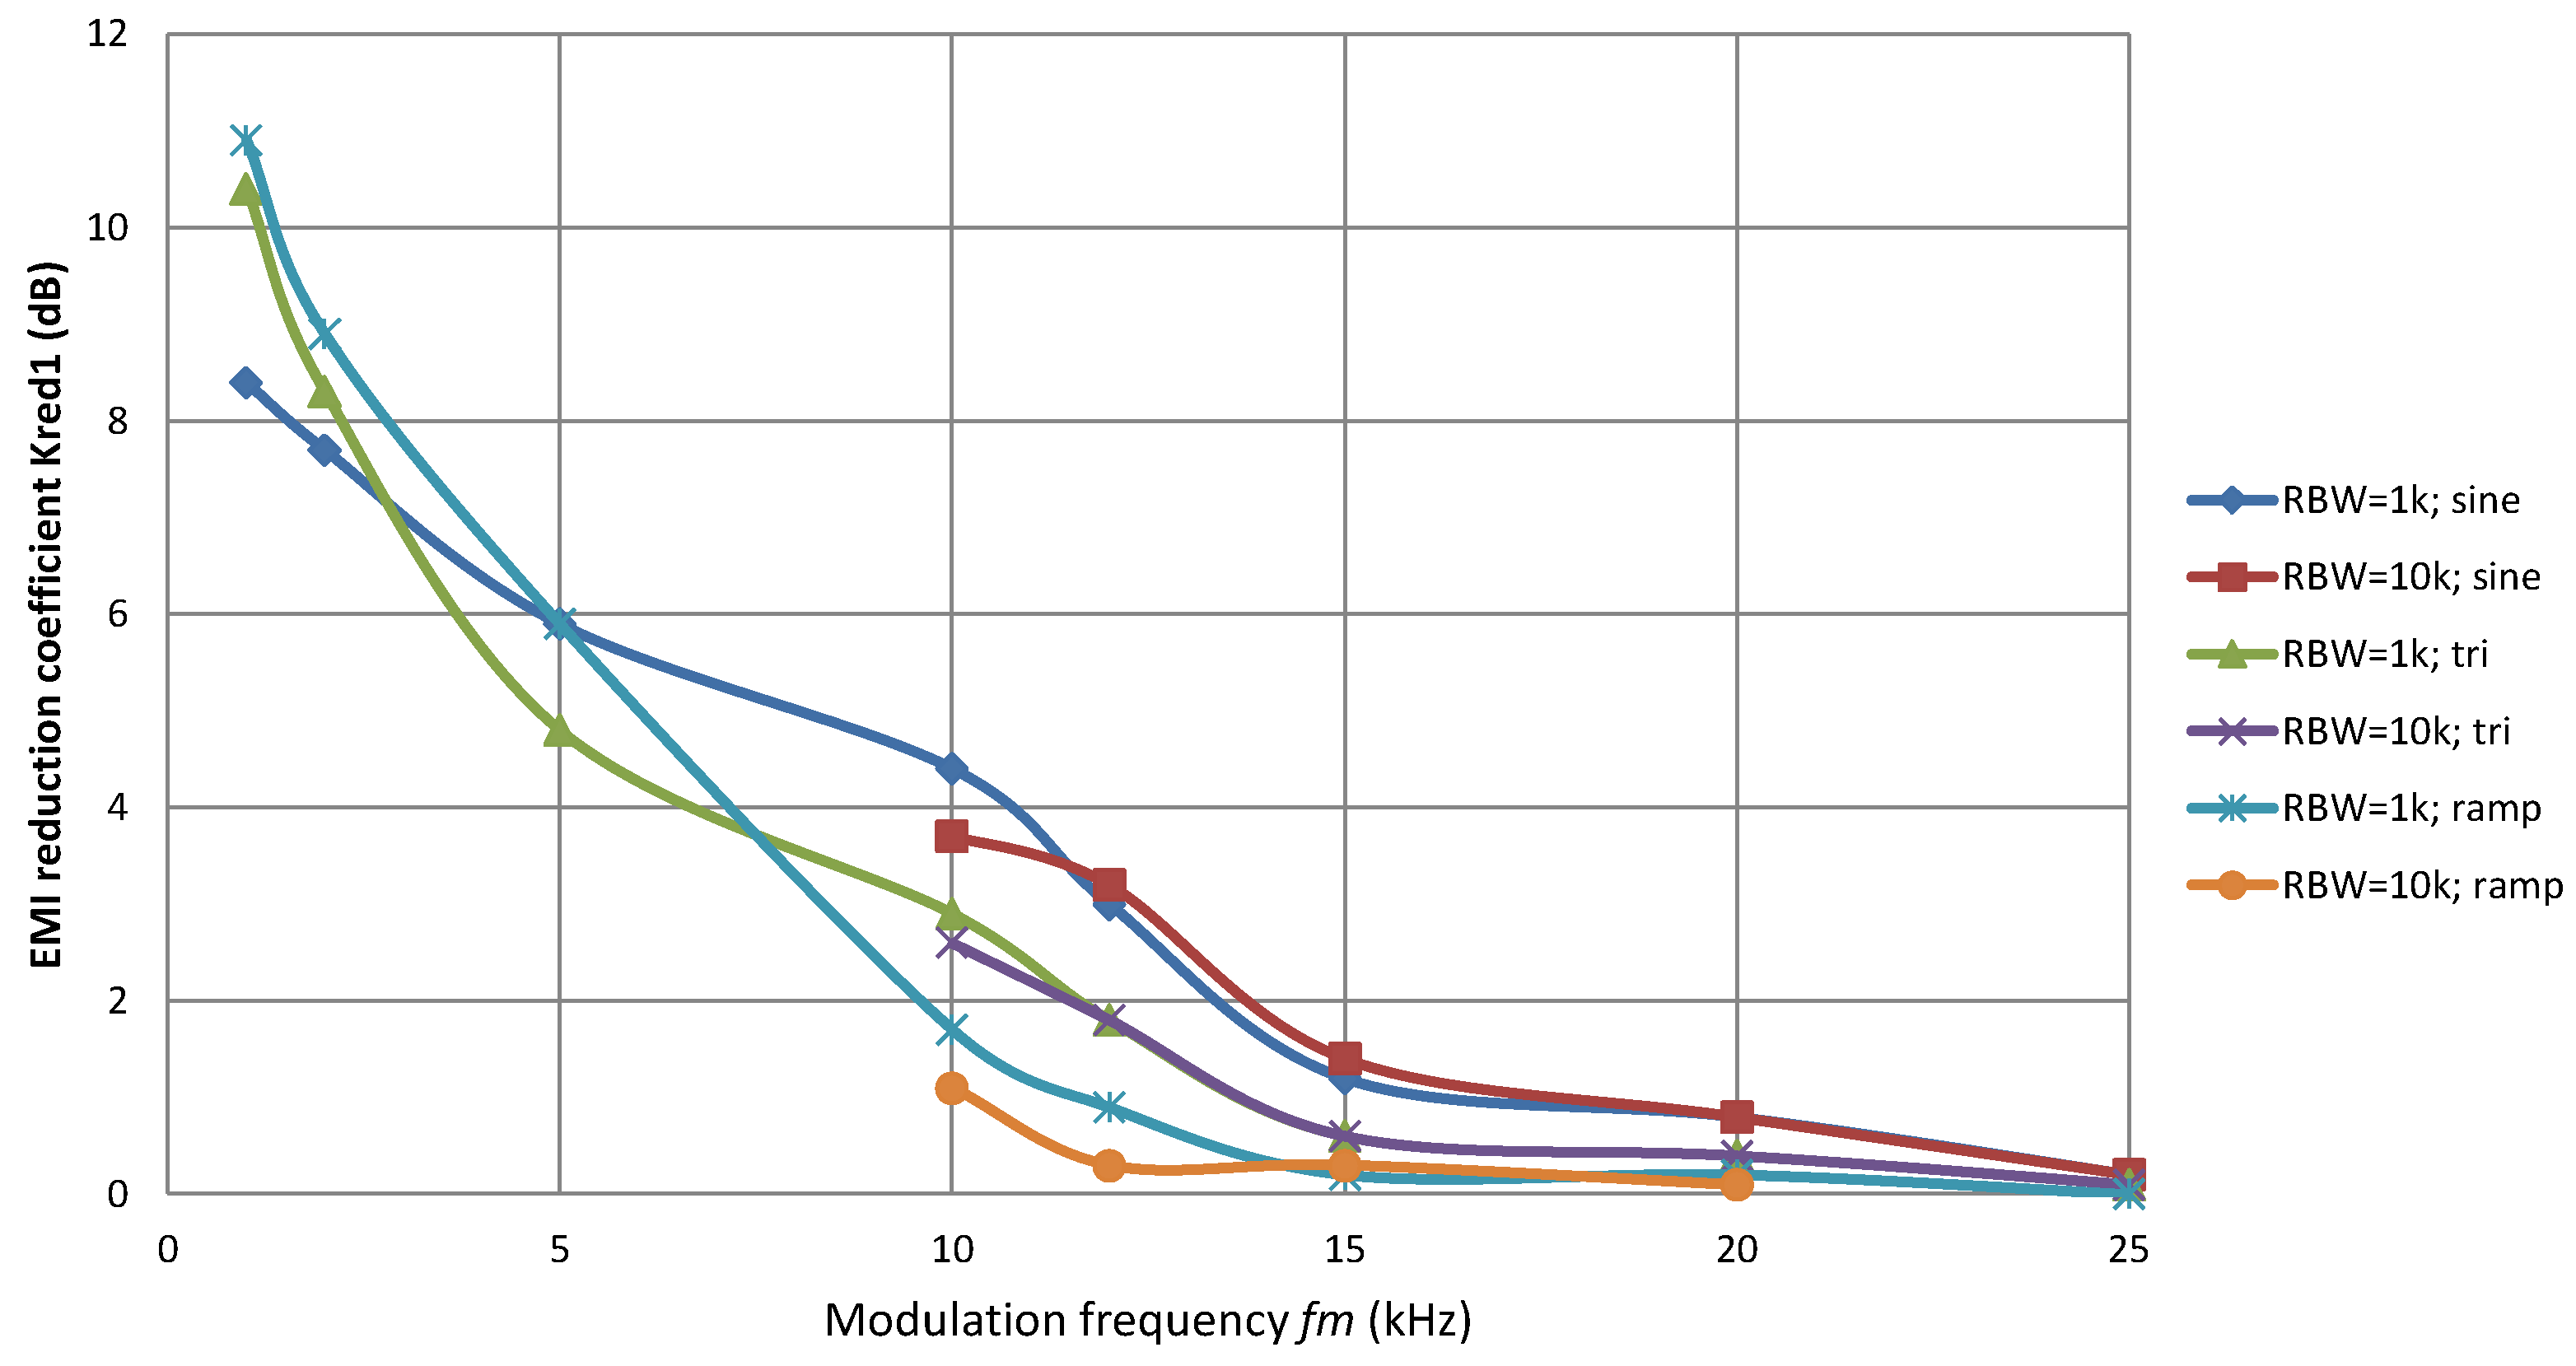
For
fm > RBW, the emissions reduction coefficients have almost the same values regardless of RBW value for a given value of
fm and Δ
fpeak (
Figure 11).
For the multi-frequency scheme, lower value of
fm gives better
Kred1 (correct only if
fm ≥ RBW) as may be seen in
Table 3. Reduction of the higher-order harmonics is better than that of the fundamental harmonic within frequency range of interest (see
Table 3). The 4-frequency technique provides better
Kred1 and
Kred3 than 3-frequency technique for the same Δ
f.
4.2. Analysis of the Efficiency Measurement Results
Along with the positive effect in terms of the radiated emissions reduction, the periodic SFM and the multi-frequency technique, unfortunately, can lead to a noticeable reduction of the WPT system efficiency (
Figure 13,
Figure 14 and
Figure 15 and
Table 3).
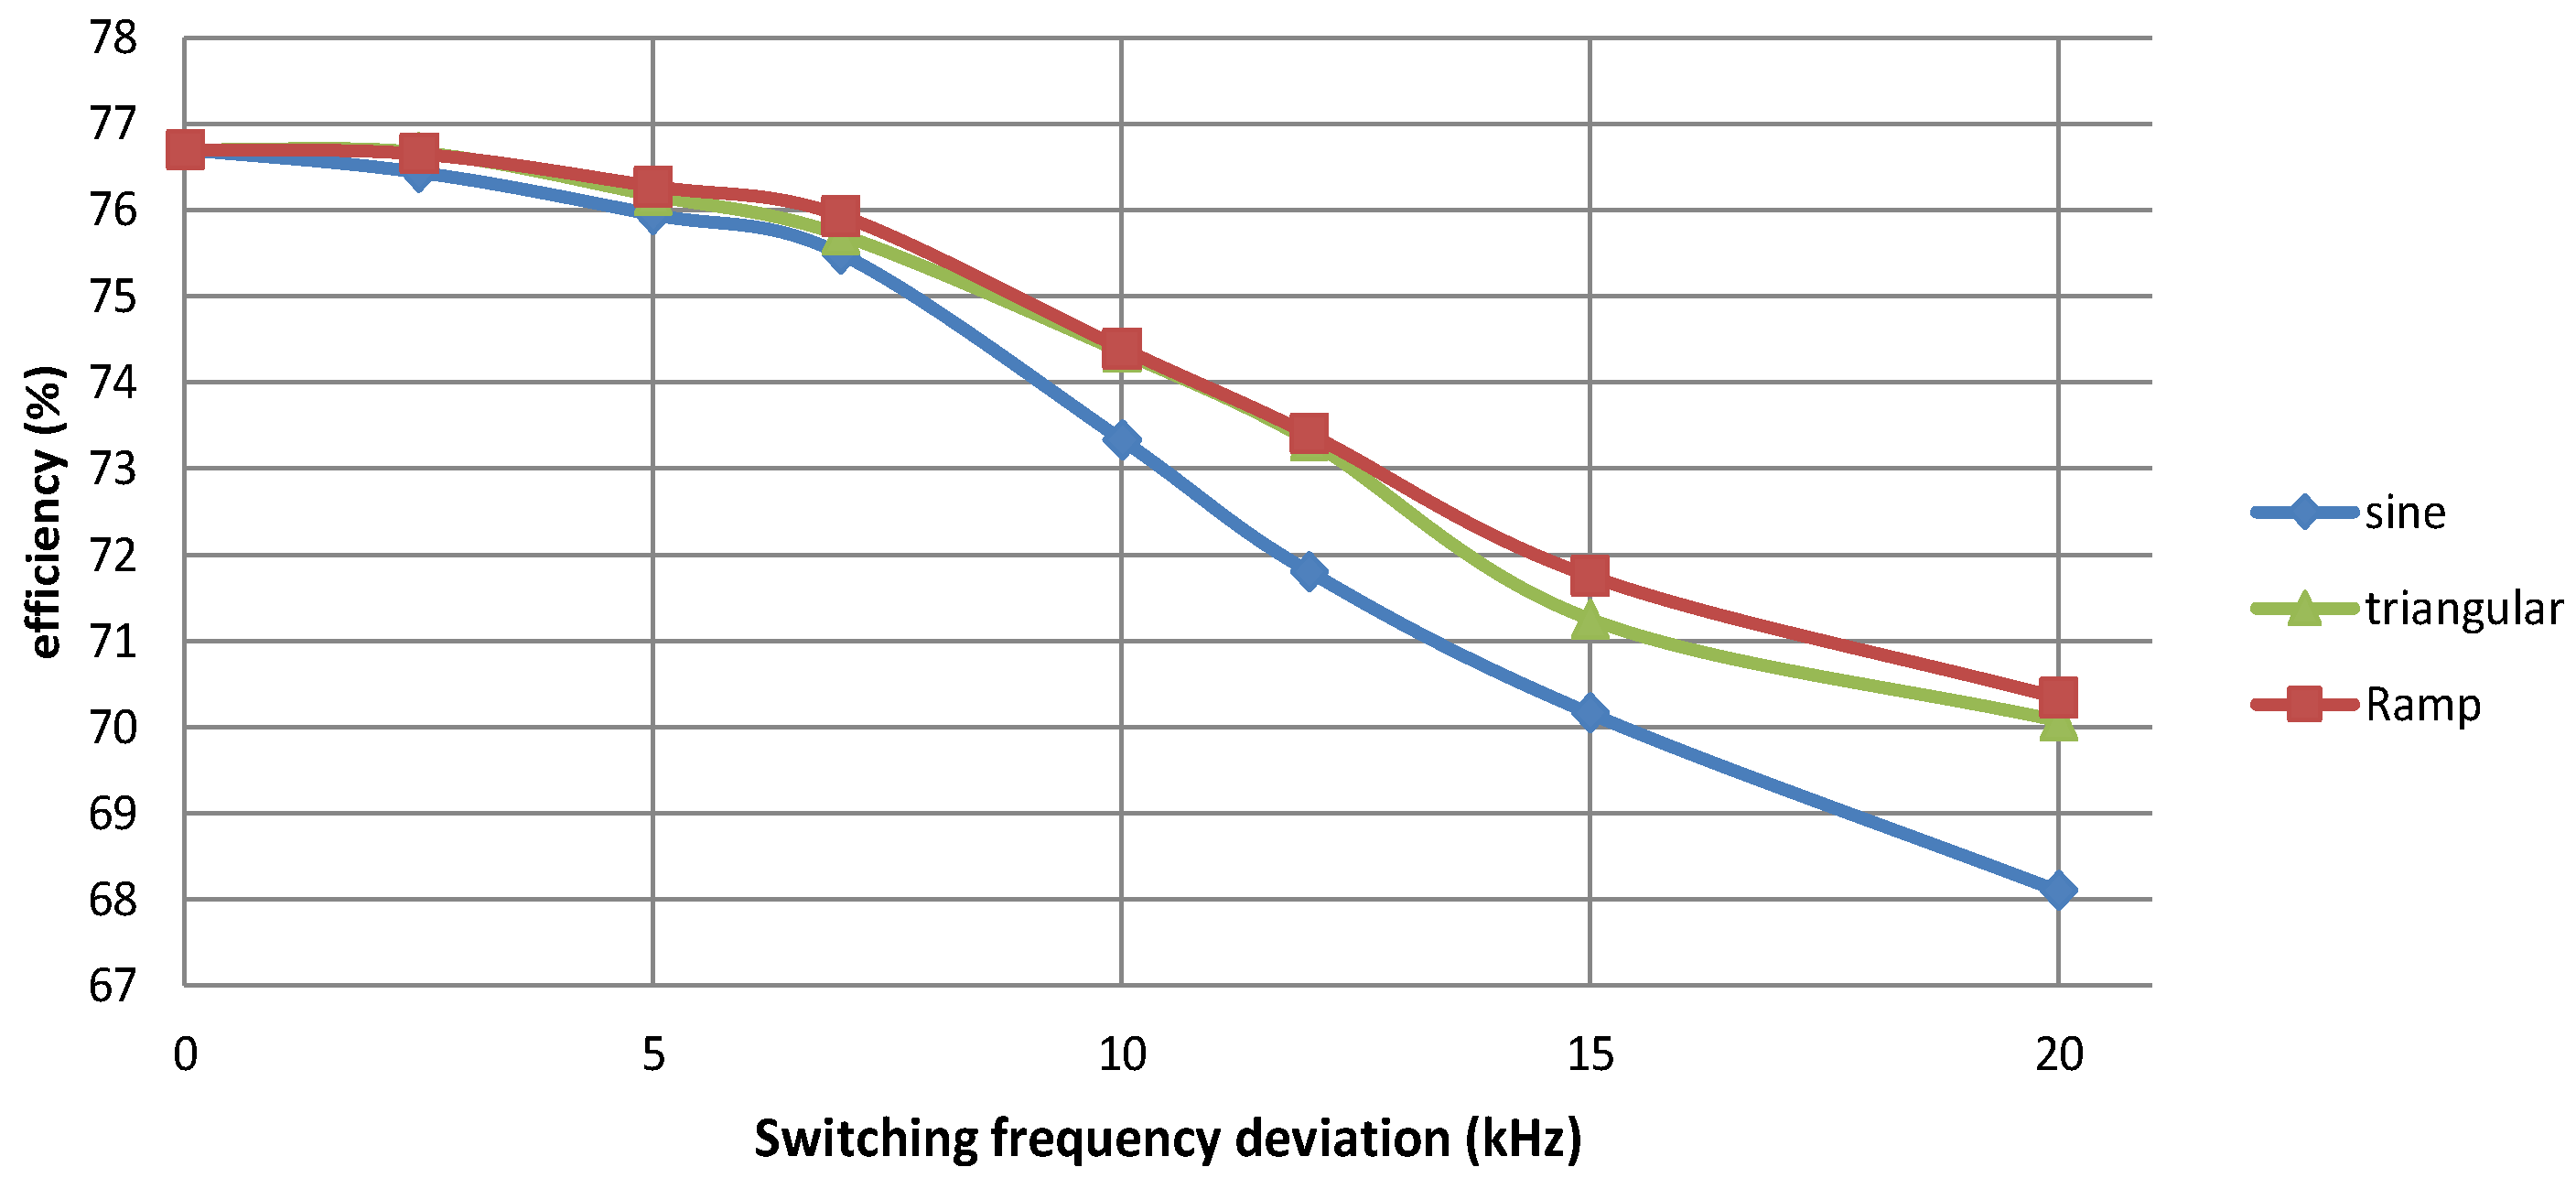
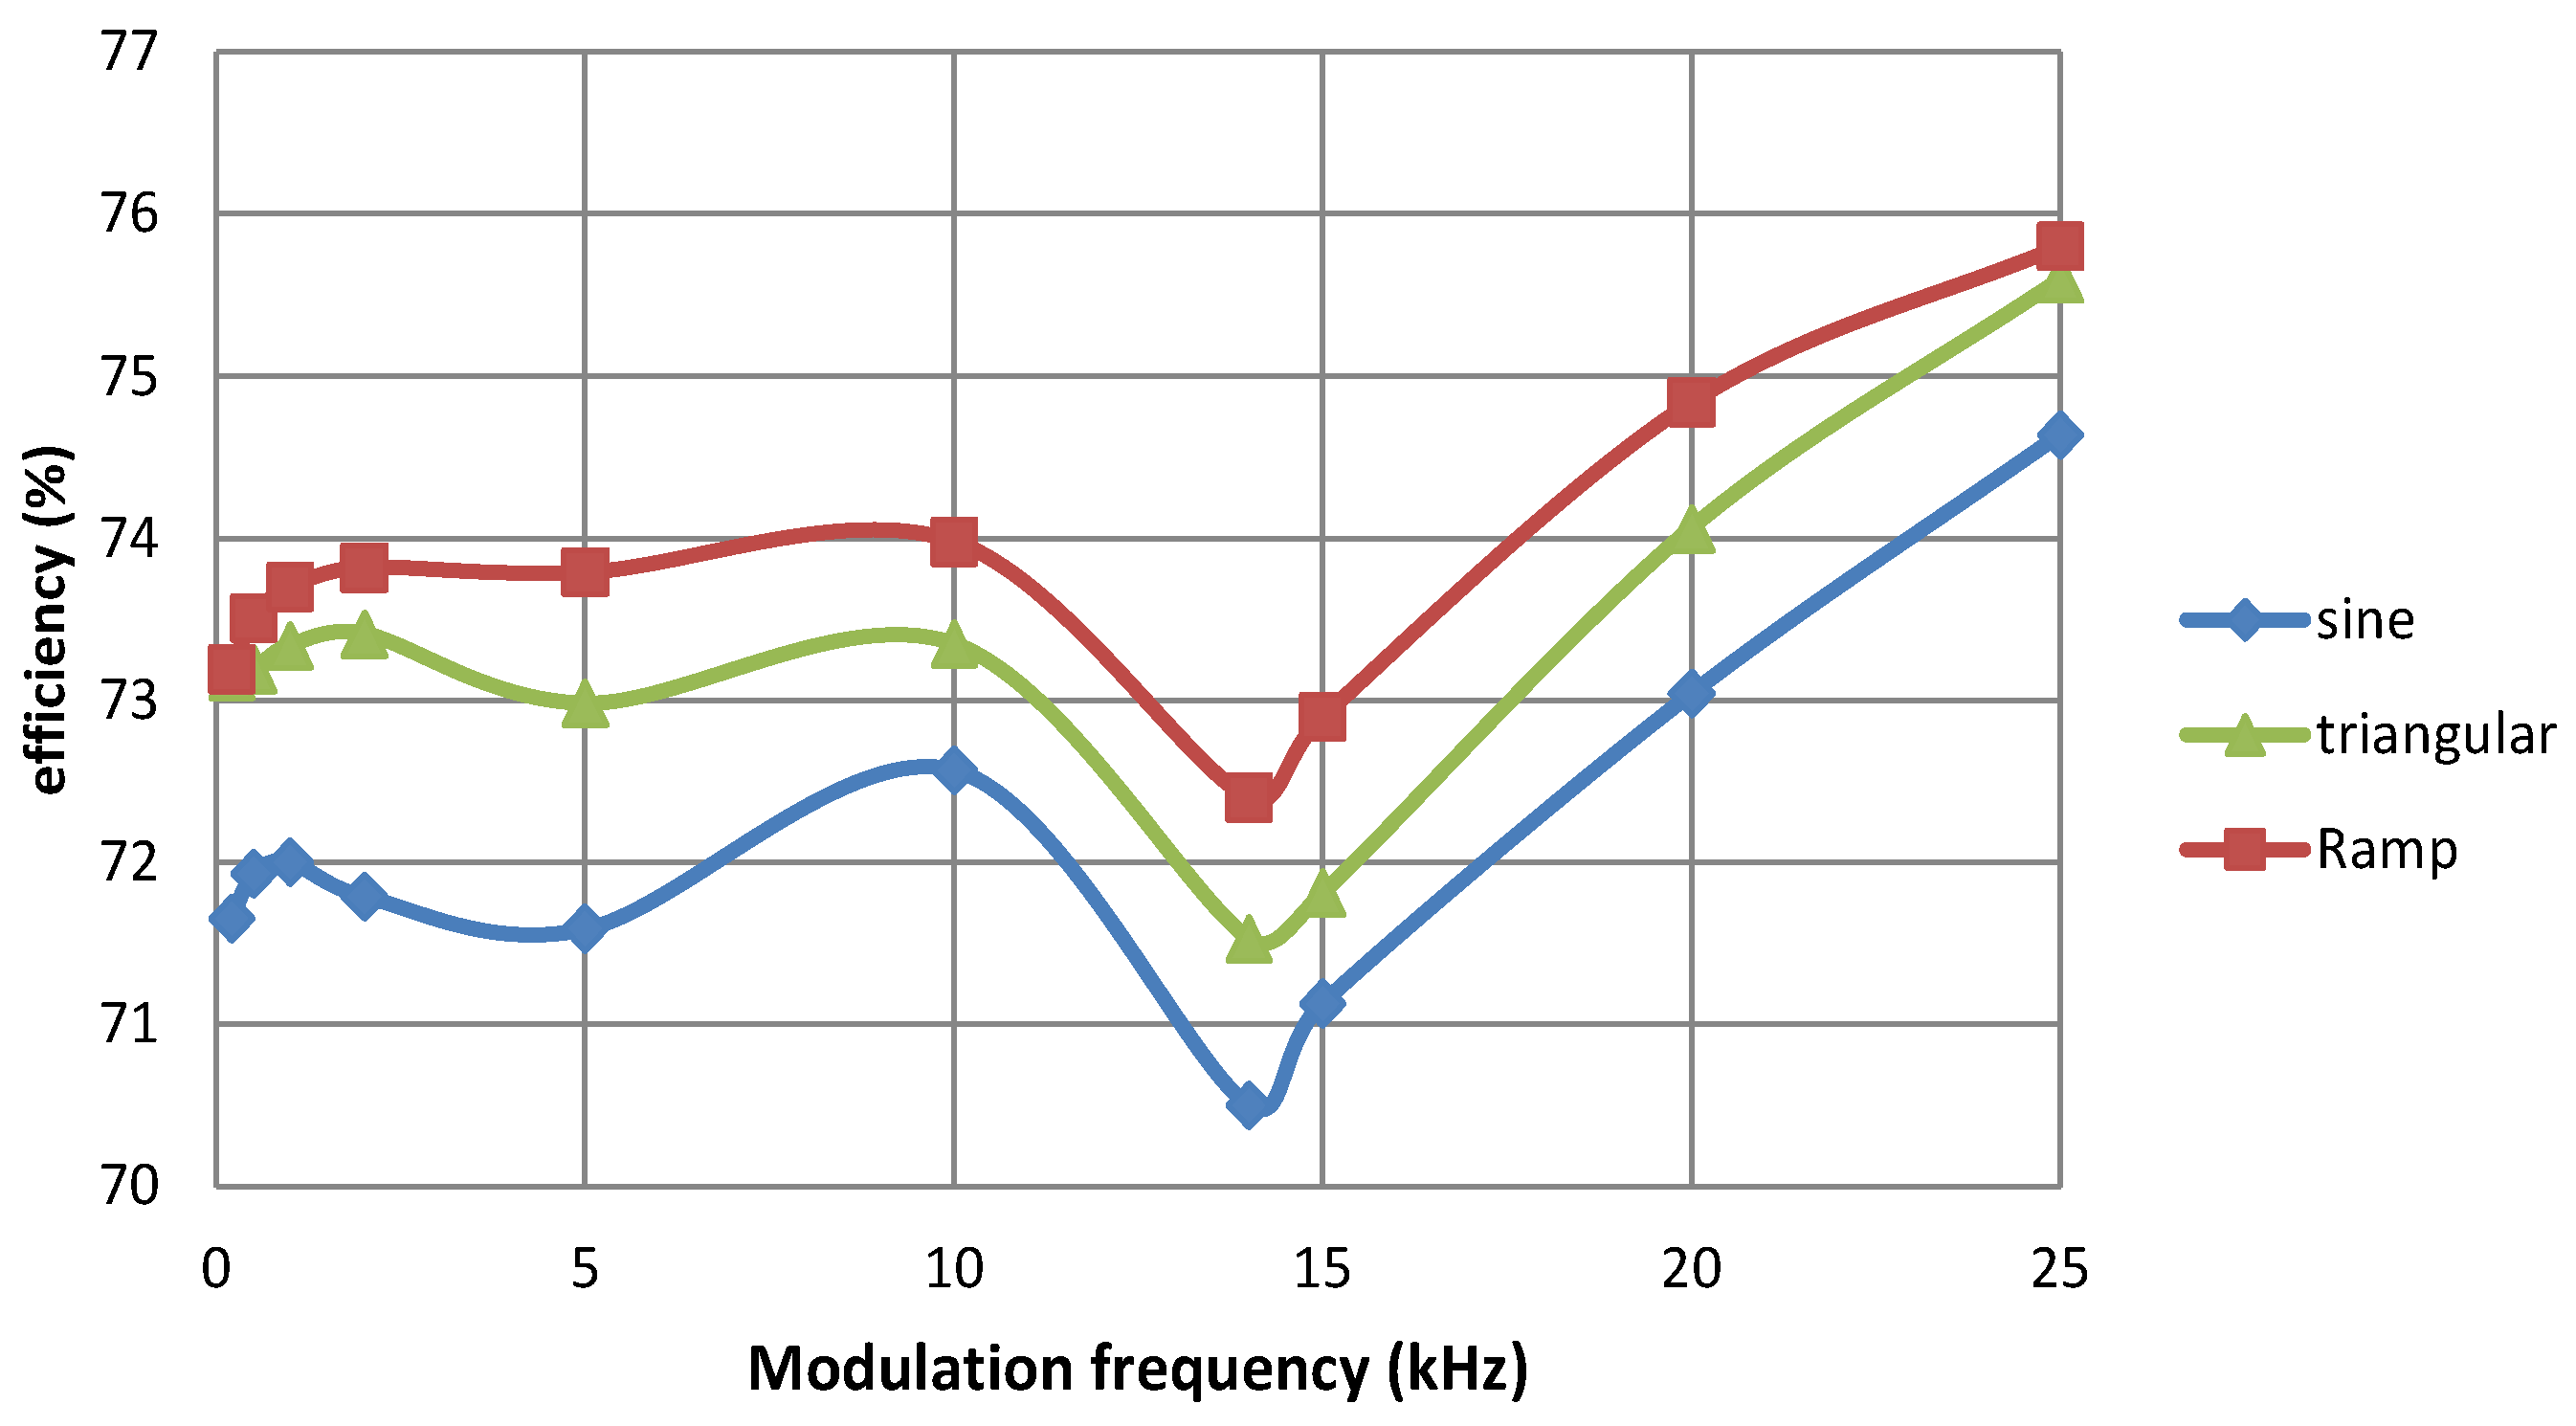
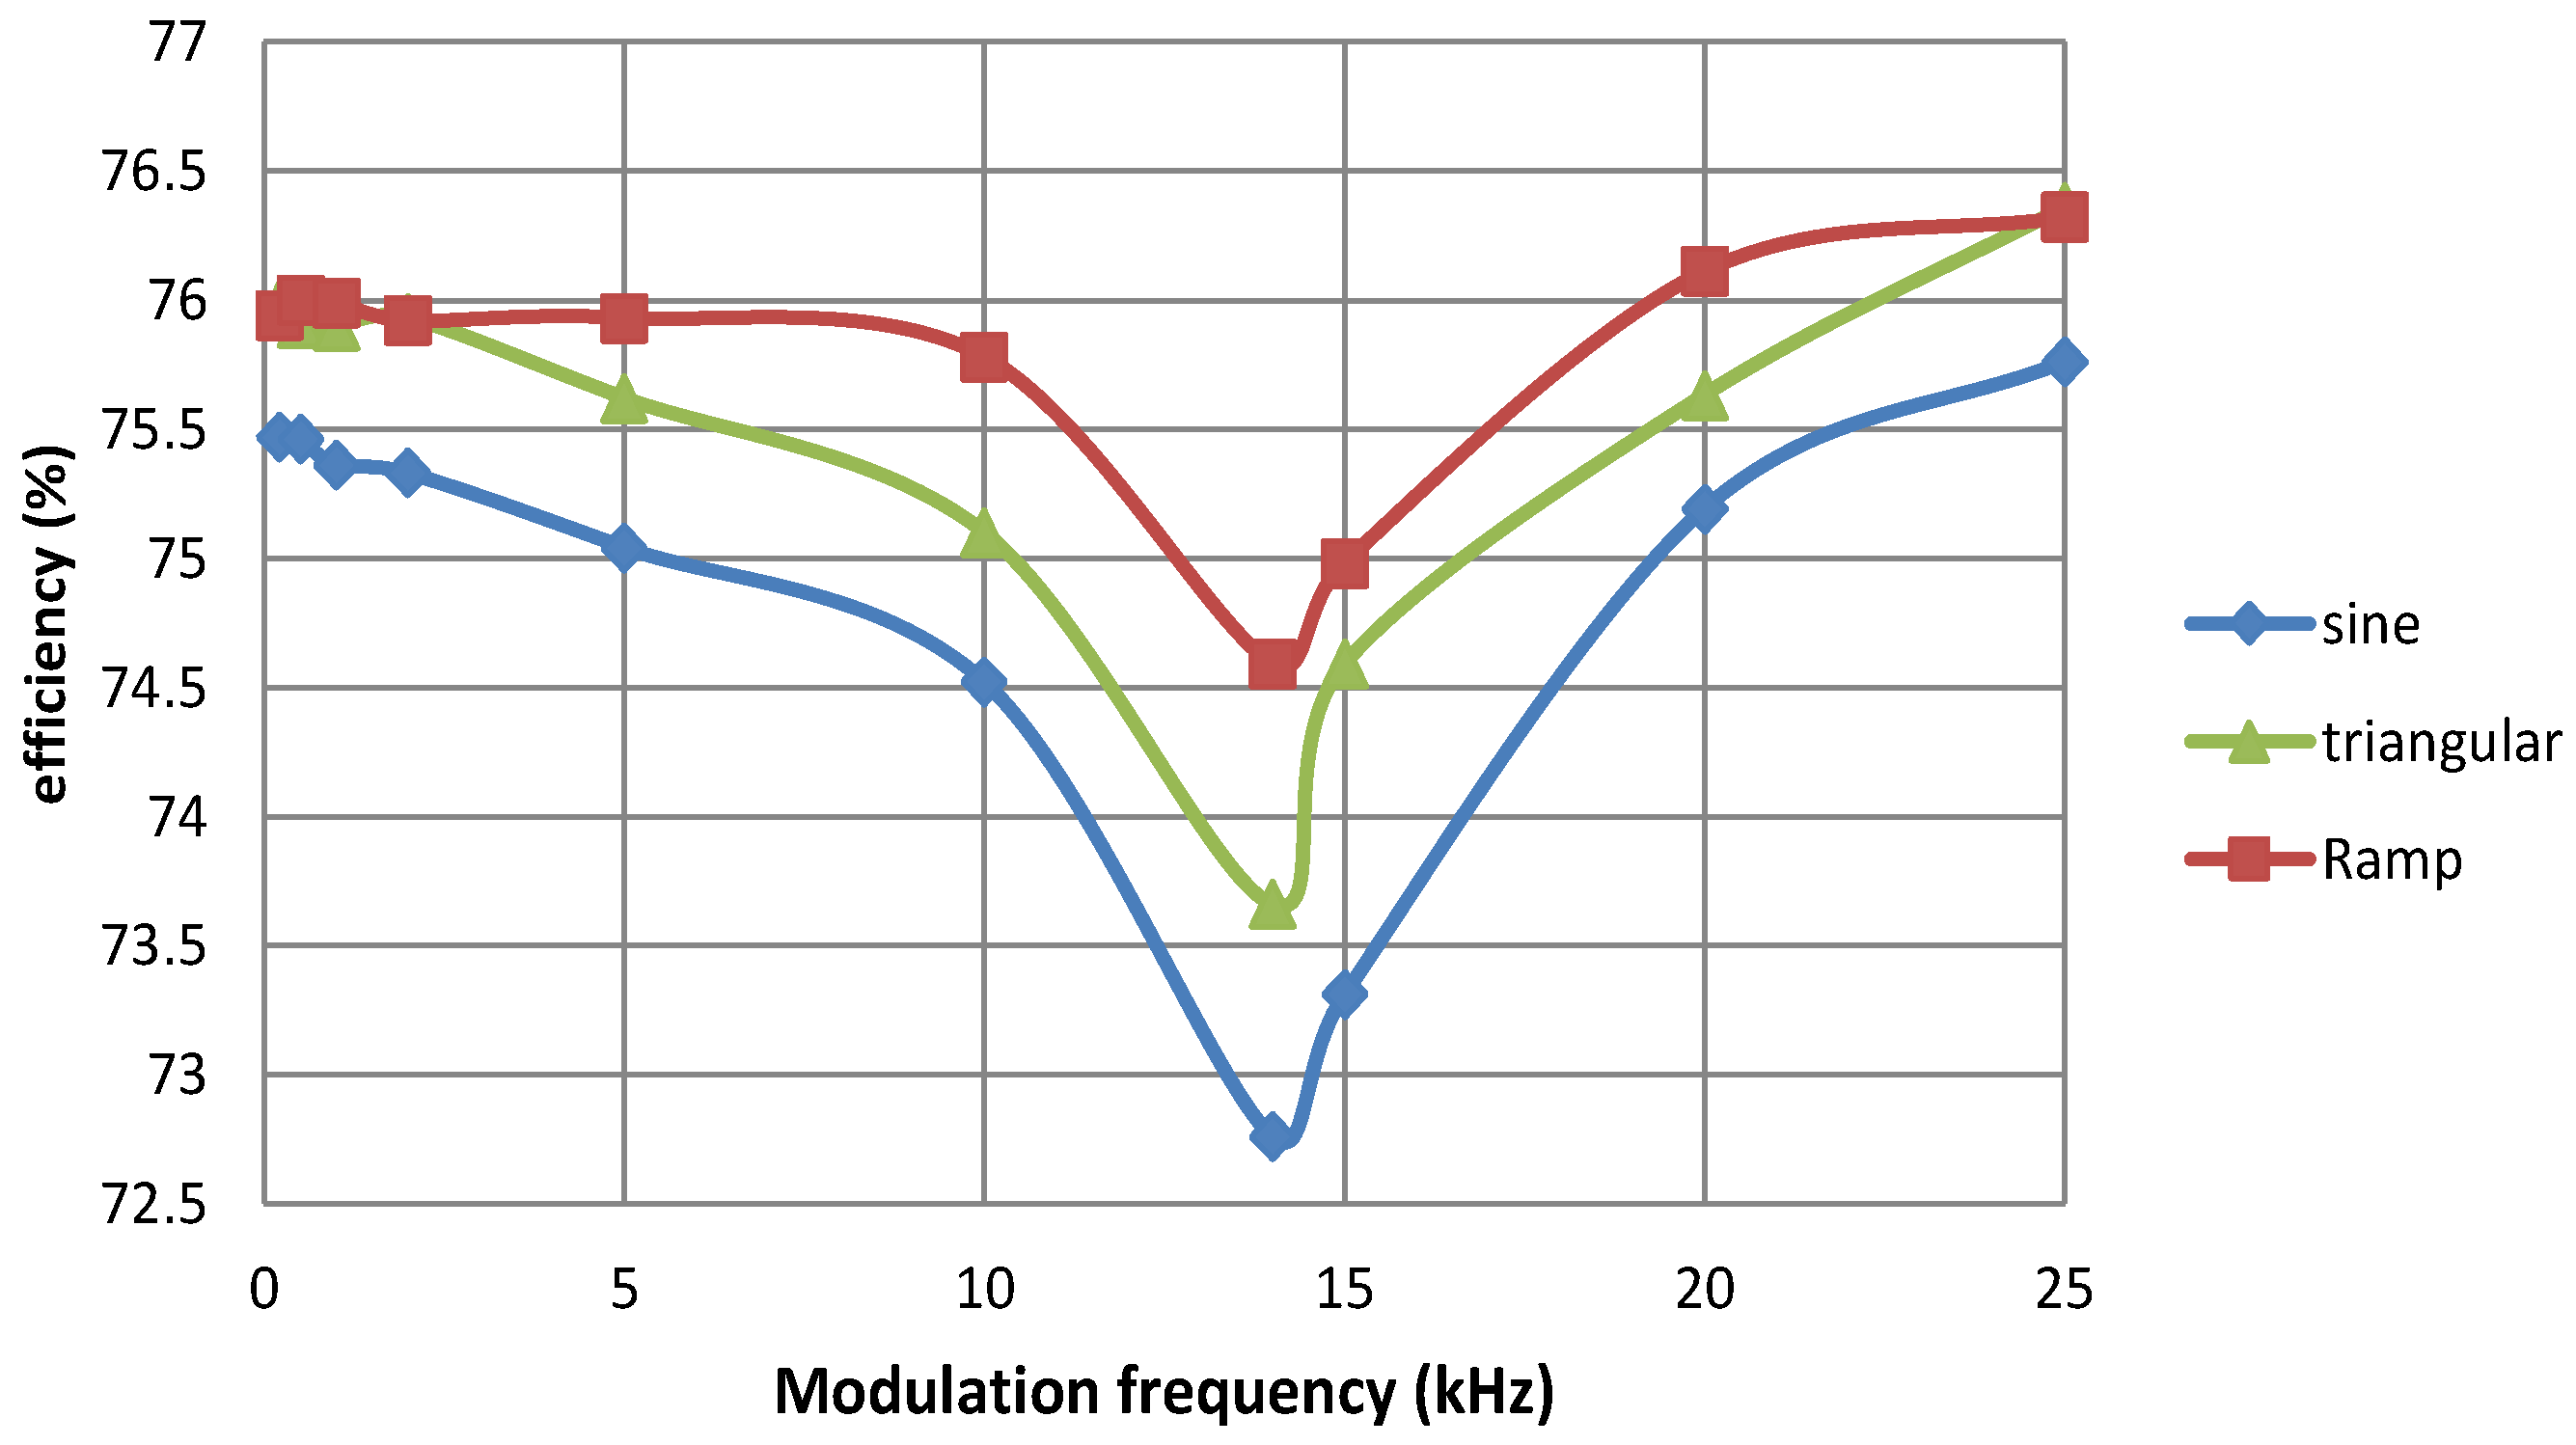
Similar to the radiated emissions reduction coefficients, the efficiency also is the function of modulation parameters: modulation waveform, fm, Δfpeak and Δf.
As Δ
fpeak (for SFM) or Δ
f (for the multi-frequency scheme) increase, the efficiency decreases (
Figure 13 and
Table 3). The decrease in the efficiency can be quite significant (it can even exceed 6% for sine modulation and the multi-frequency technique) at higher Δ
fpeak or Δ
f. If Δ
fpeak is quite low (<6 kHz), then there is insignificant decrease in the efficiency (below 1%) for all modulation waveforms as it may be seen in
Figure 13. Note that the efficiency of the WPT system without the spread spectrum is 76.7% for both the periodic SFM and the multi-frequency technique.
The efficiency is in quite complex relationship with
fm as it may be seen in
Figure 14 and
Figure 15. A huge drop in the efficiency can be observed if
fm is equal to frequencies (or in the vicinity of them) at which the output power is maximum. This “side effect” can be explained by the fact that the RMS values of the power components’ currents increase significantly (and as the result the power components’ losses also increase) at those frequencies. The efficiency worsens insignificantly, if quite high modulation frequencies (>22 kHz) are used, but, unfortunately, the radiated emissions reduction may be poor, if quite large
fm is used (see
Figure 11).
Ramp modulation waveform is not only the best choice in terms of the radiated emission reduction when
β > 2.5, but also it is the best choice in terms of the efficiency, because it gives the lowest drop in the efficiency for different
fm and Δ
fpeak (
Figure 13,
Figure 14 and
Figure 15). Sine modulation gives the worst results in terms of the efficiency. However, sine modulation gives better reduction of the radiated emissions when
β < 2.5.
The multi-frequency scheme also results in a noticeable decrease in the efficiency (
Table 3) especially for higher Δ
f values. For a given value of the efficiency, the multifrequency scheme (based either on 3 or 4 frequencies) gives equal or slightly higher coefficients of the radiated emission reduction than SFM with sine modulation waveform, but it gives, by 1–3 dB, lower radiated emission reduction than in the case of SFM with ramp waveform.
The presented results allow us to conclude that there is trade-off between the radiated emission reduction and the efficiency, because better reduction of the emissions can be achieved at higher peak switching frequency deviations for a given value of fm (this conclusion is valid only when Δfpeak is below the frequency at which the output power is maximum), but higher Δfpeak gives higher drop in the efficiency.
4.3. Choice of the Spread-Spectrum Technique and Its Parameters
At the inductive-resonant WPT system design stage, it is of importance to know what spread-spectrum technique (either periodic SFM, multi-frequency technique or random frequency modulation investigated in [
20]) and its parameters should be selected to obtain a quite significant reduction of the radiated emissions with an allowed drop in the efficiency.
As may be deduced from the results obtained in this paper and in [
20], the periodic SFM and the multi-frequency techniques may give equal or even better reduction of the radiated emissions when compared to that of the random frequency modulation (presented in [
20]) for a given value of RBW (according to the authors [
20] information, the RBW during their experiments was 100 Hz) and decrease in the efficiency, but the implementation of the periodic SFM and the multi-frequency scheme is simpler and cheaper.
Please note that to implement the periodic SFM, a microcontroller with quite good time resolution is necessary (CPU clock frequency should be at least 32 MHz), but to implement the multi-frequency technique a microcontroller with 8 MHz CPU clock frequency is enough. However, according to manufacturers’ price lists, the cost of a microcontroller does not depend on CPU frequency significantly. Therefore, even if the periodic SFM requires a microcontroller with higher CPU clock frequency, the implementation cost will be slightly higher than that of the multi-frequency scheme.
4.3.1. Choice of the Spread-Spectrum Technique
Obviously, if the cost of the control stage is very important, then it is better to choose either the periodic SFM or the multi-frequency technique as the spread-spectrum technique to reduce the radiated emissions from the inductive-resonant WPT systems. If microcontrollers with at least 32 MHz CPU clock frequency are available, then it is better to implement periodic SFM with ramp modulation waveform, because the periodic SFM with ramp modulation waveform outperforms the multi-frequency technique moderately.
4.3.2. Choice of the Modulation Frequency for the Periodic SFM
The choice of fm is limited by RBW which is required by an EMC standard. The modulation frequency should be chosen so that fm ≥ RBW. If the radiated emissions measurements should be made with, for example, RBW = 9 kHz, then fm should be e.g., 10 kHz. The modulation frequency should never be chosen in the vicinity of the frequency at which output power is maximum.
4.3.3. Choice of the Modulation Waveform for the Periodic SFM
If Δfpeak/fm > 2.5, then ramp modulation waveform should be chosen. For lower values of the modulation index it is better to use the sine modulation.
4.3.4. Choice of the Switching Frequency Deviation for the Periodic SFM
The switching frequency deviation should be chosen as high as possible to get sufficient radiated emissions reduction, but below its threshold value at which the drop in the efficiency is maximum allowable (at the lowest coupling coefficient).
4.3.5. Choice of Parameters for the Multi-Frequency Technique
It is necessary to choose only two parameters for the multi-frequency scheme: modulation frequency fm and difference between maximum and minimum switching frequency Δf. The choice of the parameters (fm and Δf = 2Δfpeak) for the multi-frequency scheme is the same as in the case of the periodic SFM: fm should be equal or higher than RBW, but Δf should as high as possible, but below its threshold value at which the drop in the WPT system efficiency is maximum allowable (at the lowest coupling coefficient). fm should never be chosen close to the frequency at which output power is maximum. It is better to choose the four-frequency technique than the three-frequency technique.
5. Conclusions
For the first time, a detailed analysis of the influence of periodic SFM and multifrequency technique parameters on inductive-resonant WPT systems’ radiated emissions and their efficiency has been performed in this paper.
The obtained results show that both the periodic SFM and the multi-frequency technique can be very useful to reduce the radiated emissions from the inductive-resonant WPT systems, but there is trade-off between the inductive-resonant WPT system radiated emission reduction coefficients and the efficiency that are the functions of either the periodic SFM or the multi-frequency techniques parameters. Some useful recommendations on correct selection of the periodic SFM and the multi-frequency technique parameters presented in the paper can help an engineer to get better inductive-resonant WPT system performance.
Both the periodic switching frequency modulation and the multi-frequency technique are significant competitors of random frequency modulation to reduce radiated emissions of the inductive-resonant WPT systems in the case when their parameters are chosen correctly.
Overall, for a given value of the efficiency, the multi-frequency scheme (based either on 3 or 4 frequencies) gives equal or slightly higher coefficients of the radiated emission reduction than SFM with sine modulation waveform, but it gives, by 1–3 dB, lower radiated emission reduction than in the case of SFM with ramp waveform. As an obvious advantage of the multi-frequency technique is that it can be implemented even using a cheap 8-bit 8-MHz microcontroller.


