Abstract
This paper proposed and investigated a sensor that could simultaneously measure temperature and magnetic fields. The key component of this sensor was a photonic crystal fiber with a length of only 1 cm, whose air holes were arranged in a circular lattice symmetry. In order to increase the birefringence of the fiber, we introduced well-designed point defects into the photonic lattice. The deficient pores were filled with a magneto-fluidic material (MF) that sensed temperature and magnetic fields through changes in its refractive index. The outer layer of the fiber cladding was coated with a thin film of Indium tin oxide (ITO), which was in direct contact with ethanol. The surface plasmon resonance created by ITO was used to achieve dual-parameter demodulation and solve the cross-sensitivity problem. The photonic crystal fiber and other optical components made up a Sagnac interferometer, which was used to measure the transmission spectrum of the Sagnac interference. At the same time, the loss spectrum due to the surface plasmon resonance was measured. The variation in temperature and magnetic field was directly related to the shift in the resonance wavelengths of the transmission and loss spectra, thus enabling simultaneous dual-parameter measurements. We investigated the sensing performance of the sensor numerically. The results showed a wavelength sensitivity of 7.6 nm/°C and 0.75 nm/mT, with a resolution of 1.316 × 10⁻³ °C and 1.333 × 10⁻³ mT for temperature and magnetic field, respectively. Compared with other sensors, the key component of the proposed sensor is only 1 cm in length, which makes it compact and easy to manufacture. The geometric parameters, such as the position and radius of the pores, are less likely to deviate from the ideal values, which helps to reduce the impact of manufacturing tolerances on the sensing performance.
1. Introduction
The photonic crystal fiber (PCF) has attracted considerable attention in the field of sensor technology due to its effective anti-electromagnetic interference ability and flexibility in the design of light wave mode [1,2,3]. The researchers have developed a variety of PCF sensors with excellent performance [4,5,6], such as a PCF sensor based on directional coupling effect [4], a D-type PCF sensor [5], a PCF sensor based on surface plasmon resonance (SPR) [6], etc. In order to further optimize the performance of a PCF sensor, the experts often combine it with a Sagnac interferometer to form a hybrid sensor [7]. In a Sagnac interferometer, a segment of high birefringence optical fiber is inserted in the optical fiber loop to introduce an optical path difference between the two optical waves traveling in opposite directions, inducing a special optical interference effect. The optical fiber sensors based on Sagnac interferometer are widely used for accurately measuring the physical quantities, such as temperature, due to their low background noise and high sensitivity as compared with other sensors. Cui Ying et al. [8] designed a Sagnac interferometer for measuring temperature by selectively filling a PCF. The experimental results show that the temperature sensitivity of the designed sensor is 2.58 nm/°C, and its linear temperature detection range is 25–33 °C. Shi Ming et al. [9] constructed a PCF temperature sensor based on Sagnac interference effect, with a maximum sensitivity of 16.8142 nm/°C. Wang Guangyao et al. [10] demonstrated a temperature sensor based on Sagnac interference effect by infiltrating alcohol into the pores of a square lattice PCF and achieved an average sensitivity of 16.55 nm/°C in the linear temperature detection range of 45 °C to 75 °C.
In various practical applications, it is often necessary to monitor multiple parameters simultaneously. For instance, monitoring temperature and magnetic field at the same time is very important for some precision machining processes or scientific research fields. In these scenarios, sensors that only have the ability to measure a single parameter are unable to meet the requirements. In order to address this problem, various solutions have been proposed [11,12,13,14]. Miao Yinping et al. [11] proposed a dual-parameter measurement scheme based on long-period fiber grating and multimode fiber. The authors conducted an experiment to verify the effectiveness and achieved a magnetic field sensitivity of 0.02878 nm/Oersted (Oe) and a temperature sensitivity of −0.04048 nm/°C. Li Jie et al. [12] designed a temperature–magnetic field sensor based on the principle of fiber cone mode interference and achieved a magnetic field sensitivity of 88 pm/Oe in the magnetic field range of 50 to 100 Oe, and a temperature sensitivity of 282.67 pm/°C in the temperature range of 30–80 °C. Liu Hai et al. [13] designed a PCF with two liquid channels and filled them with a sensitive magnetic fluid to realize dual-parameter sensing of temperature and magnetic field. After structural optimization, the magnetic field sensitivity and temperature sensitivity of the sensor reached 1.08 nm/mT and −0.2269 nm/°C, respectively. Yu Ying et al. [14] proposed a temperature–magnetic field sensor based on D-type PCF. In this sensor, a magnetic fluid film is raised on the surface of a D-shaped optical fiber for measuring the magnetic field, and ethanol is poured into the defective air pores of the D-shaped optical fiber for measuring temperature. The results show that the magnetic field measurement range of the sensor is 30–270 Oe, the temperature measurement range is 5–65 °C, the magnetic field sensitivity is 0.21 nm/Oe, and the temperature sensitivity is 1.25 nm/°C. Although the researchers have conducted a number of studies to explore the temperature and magnetic field sensors, the sensitivity and linearity of the existing sensors require further improvement. Moreover, it is not possible to conveniently integrate the existing sensors in other devices due to their size.
In this work, we designed and built a temperature–magnetic field dual-parameter sensor based on the SPR effect and Sagnac interference of a circular lattice PCF. While pursuing high sensitivity and linearity, we managed to shrink the size of the core component of the sensor to 1 cm. The resulting sensor is much smaller as compared to the existing dual-parameter sensors. Additionally, the proposed sensor is easier and cheaper to produce and is more tolerant to the processing errors. Notably, the temperature sensitivity and magnetic field sensitivity of the sensor proposed in this work can reach to 7.16 nm/°C and 0.75 nm/mT, respectively. The magnetic field detection range of the proposed sensor is 0–80 mT. In the following chapters, we present the sensing principle, structural parameters, and sensing performance of the proposed sensor.
2. Working Principle of the Proposed Sensor
The schematic diagram of the temperature–magnetic field dual-parameter sensor proposed in this work is shown in Figure 1. Figure 1a shows the optical path measurement of the Sagnac interference transmission spectrum. The PCF, polarization controller, and 3 dB optical coupler constitute the Sagnac optical fiber loop. The beam emitted by the broadband light source (BBS) passes through the 3 dB optical coupler and is then divided into two beams. The polarization controller ensures that the polarization directions of the two beams are perpendicular to each other (x-polarization and y-polarization). Please note that one beam propagates clockwise and the other propagates counter-clockwise. Due to the birefringence effect of the PCF, the optical paths of the two beams are different, resulting in a phase difference [7,15]. When the two beams pass through the 3 dB opto-coupler again and converge in the optical spectrum analyzer (OSA), the interference occurs. When the environmental parameters (temperature, magnetic field, etc.) change, the refractive index of the sensitive materials is also affected, i.e., the interference fringes shift with the change in temperature or magnetic field. The variations in temperature or magnetic field can be sensed by monitoring the shift in the resonance wavelength of transmission spectrum on OSA. Figure 1b shows the optical path measurement of the loss spectrum caused by the surface–plasmon–resonance effect. The polarization controller sets the direction of polarization of the outgoing beam to y-polarization. The beam passes through the PCF before entering the OSA, where the loss spectrum is detected [16].
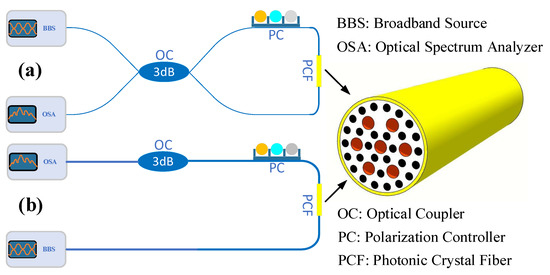
Figure 1.
Schematic of the proposed sensor’s dual-parameter measurement. (a) Measurement of the transmission spectrum for the Sagnac interference. (b) Measurement of the loss spectrum for SPR.
The mathematical expression of transmission spectrum presented in Equation (1) is deduced according to the working principle of Sagnac interferometer [7,15], where represents the phase birefringence. and represent the real parts of the effective refractive indexes of the x-polarized and y-polarized core modes, respectively. The length of PCF L = 1 cm. When the phase matching condition Equation (2) is satisfied, a formant occurs in the transmission spectrum. During the course of measuring the loss spectrum, a coupling resonance occurs between the fiber core mode and the surface plasmon mode. The resulting power loss is calculated using Equation (3), where represents the imaginary part of the effective refractive index.
It is noteworthy that the transmission spectrum and loss spectrum are detected simultaneously. The formant wavelength shifts of the transmission spectrum and loss spectrum are denoted as and . The relationship between them and the variations in temperature and the magnetic field are expressed as:
Generally, the influence of magnetic field on the loss spectrum caused by surface-plasmon-resonance effect is very weak, so . After are calibrated, and the variations in temperature and magnetic field are computed by using the following expression:
Figure 2a shows the cross section of a PCF. The optical fiber used in this work is a PCF with circular lattice, and its pores are distributed in a circular symmetry. The diameter of small pores is denoted as d, the diameter of large pores is denoted as D, and the distance between the adjacent pores is denoted as Λ. One large pore is inserted into the fiber core, one small pore of the cladding is completely filled with quartz material, and the radius of the other six small pores is increased. These point defects are used to enhance the birefringence effect. The conventional stack and draw method [17] have been widely used to make photonic crystal fibers. The fiber shown in Figure 2a can be fabricated by this method. Please note that all the large pores are filled with a magnetic fluid (MF), and the resulting change in its refractive index is used to sense the temperature and magnetic field. The surface of the optical fiber cladding is coated with a nano film of indium tin oxide (ITO) of thickness tITO. The exterior part of the ITO film contains ethanol solution whose refractive index is very sensitive to temperature variation. When the light wave reaches the interface between the ITO film and the quartz material, SPR resonance occurs. A part of the light energy is coupled with the surface plasmon polaritons (SPP) and propagated longitudinally to form a surface plasmon mode.
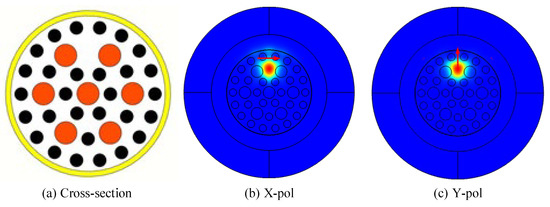
Figure 2.
(a) Cross-section of the photonic crystal fiber with a circular lattice. The optical field distribution of the core mode for the x-polarization (b) and y-polarization (c).
The base material of PCF is silica, whose refractive index is determined by the Sellimeier equation, as shown in (6). The dielectric constant of the ITO film is described by Drude–Lorentz model, and its mathematical expression is shown in Equation (7). In this expression, denotes the dielectric constant when the frequency is infinitely large, and and represent the plasma wavelength and electron collision wavelength, respectively. There is a linear relationship between the refractive index and temperature of the ethanol solution, as expressed in Equation (6). In this equation, λ represents the wavelength of incident light, T represents the temperature, and denotes the temperature coefficient of the ethanol solution. Since the temperature coefficient is two orders of magnitude higher as compared to silica, the effect of temperature on the refractive index of silica can be ignored. The refractive index of magnetic fluid is influenced by the temperature and the magnetic field [9]. This makes it possible to measure the temperature and magnetic field simultaneously. The magnetic fluid selected for the sensor proposed in this work is water-based Fe3O4, i.e., a mixture of water and magnetic particles of Fe3O4. The relationship between the refractive index of water-based Fe3O4, and temperature and magnetic field is shown in Equation (9). In this equation, 1.3592 is the refractive index of the magnetic fluid when the volume ratio of Fe3O4 and water is equal to 3%, represents the ambient temperature increment relative to 20 °C, and represents the increment in the magnetic field strength.
3. Optimization of the Proposed Sensor
First, we analyzed the guided wave mode characteristics and birefringence effect of PCF. Figure 3a shows the real part of effective refractive index and the loss spectra of the core mode and the SPP mode [18]. In order to obtain the indexes and spectra, we fixed the large pore diameter to , the small pore diameter to , the pore spacing to , and the thickness of ITO film to . As presented in the figure, when the wavelength of the incident light gradually increased, the real parts of the effective refractive indexes of y-polarized SPP mode (blue solid pentagram) and y-polarized core mode (red hollow pentagram) gradually decreased. However, it is noteworthy that the decreasing trend of the SPP mode was more evident. When the real parts of the effective refractive indexes of the two modes were equal, the resonance coupling phenomenon occurred. At this time, the light energy was transferred from the y-polarized core mode to the y-polarized SPP mode, and the loss spectrum (red solid line) of the y-polarized core mode reached the maximum value [19]. If the incident wavelength continued to increase, the resonant coupling between the two modes no longer occurred, and the loss spectrum of the y-polarized core mode gradually decreased. In Figure 3a, the polarization loss of the x-polarized core mode represented by solid black line was noticeably smaller as compared to the y-polarized core mode. For this reason, we chose the core mode of y-polarized state as the working mode of the proposed sensor. Figure 3b shows the relationship between the phase birefringence coefficient and the incident light wavelength. With an increase in the wavelength of the incident light, the phase birefringence index also increased (which could reach 10−4). When the phase birefringence coefficient satisfied Equation (2), a formant occurred in the transmission spectrum of the Sagnac interferometer [20].
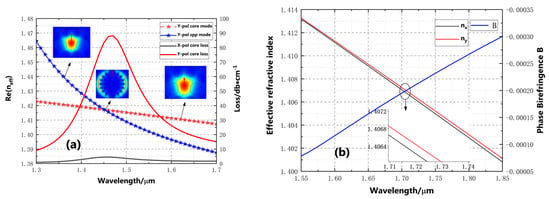
Figure 3.
(a) The variation of effective refractive index and loss with wavelength for different modes. (b) The variation of nx, ny and phase birefringence B with wavelength for the core modes.
The variation in the phase birefringence coefficient of the core mode versus the wavelength of the incident light under different values of temperature and magnetic field is shown in Figure 4. In order to obtain the variation curves of Figure 4a, we fixed the temperature of the surrounding environment, increased the magnetic field from 0 mT to 60 mT with a step of 10 mT, and measured the phase birefringence coefficient of the core mode under each magnetic field strength. It is evident that the absolute value of phase birefringence increased with an increase in the magnetic field when the wavelength of incident light was fixed. Figure 4b depicts the impact of ambient temperature on the phase birefringence. In order to obtain the curves, we fixed the magnetic field of the surrounding environment and increased the temperature from 5 °C to 30 °C with a step of 5 °C. It is evident from the figure that the variation in the phase birefringence versus temperature was the inverse of the variation of phase birefringence versus magnetic field. Under the same wavelength of the incident light, the absolute value of phase birefringence decreased with an increase in the temperature.
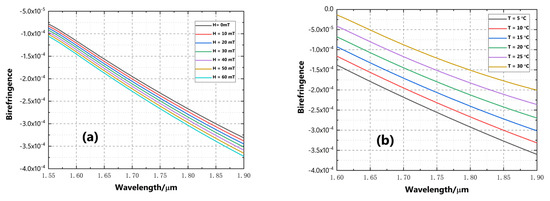
Figure 4.
Effects of magnetic field (a) and temperature (b) on the phase birefringence B, , , , and .
We further analyzed the impact of some parameters, such as the diameters of large/small pores and the thickness of ITO film, on the Sagnac interference effect and surface plasmon effect. The effects of D, d, Λ, and tITO on the loss spectrum are shown in Figure 5. The measurements were conducted when the magnetic field and temperature of the surrounding environment were set to 0 mT and 10 °C, respectively. The large pore diameter D had a slight impact on the loss spectrum, as shown in Figure 5a. As D increased, the central wavelength of the loss spectrum formant only redshifted slightly, and the amplitude of the formant increased gradually. The small pore diameter d had a significant impact on the loss spectrum, as shown in Figure 5b. It is evident that the central wavelength and amplitude of the loss spectrum formant gradually decreased with an increase in d. The impact of pore spacing Λ on the loss spectrum was similar to that of d, as presented in Figure 5c. As Λ increased, the central wavelength and amplitude of the loss spectrum formant decreased gradually. The impact of ITO film thickness tITO on the loss spectrum is shown in Figure 5d. As tITO increased, the central wavelength and amplitude of the loss spectrum formant increased significantly.
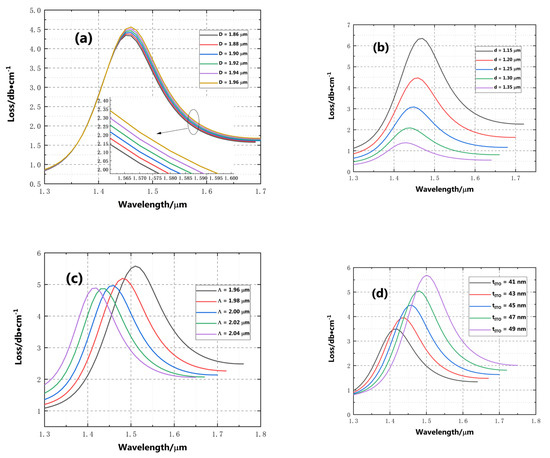
Figure 5.
The effects of D, d, Λ, and tITO on the loss spectra, H = 0 mT and T = 10 °C. (a) The diameter of large pores D. (b) The diameter of small pores d. (c) The distance between the adjacent pores Λ. (d) The thickness of ITO tITO.
The effects of D, d, Λ, and tITO on the transmission spectrum are shown in Figure 6. The measurements were conducted when the magnetic field and temperature of the surrounding environment were set to 0 mT and 10 °C, respectively. It is evident from Figure 6a,b,d that the large pore diameter D, small pore diameter d, and thickness of ITO had a significant impact on the transmission spectrum. As D, d, and tITO increased, the central wavelength of the transmission spectrum formant shifted significantly towards the longer wavelength. The pore layer spacing Λ only had a slight impact on the transmission spectrum, as shown in Figure 6c. As Λ increased, the amplitude of the transmission spectrum formant first decreased and then increased. The central wavelength of the formant first shifted towards the shorter wavelength, and then shifted towards longer wavelength. Please note that the range of wavelength shift was narrow in both directions.
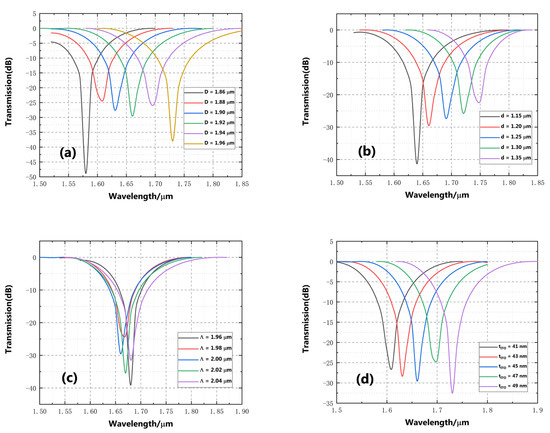
Figure 6.
The effects of D, d, Λ, and tITO on the transmission spectra, H = 0 mT and T = 10 °C. (a) The diameter of large pores D. (b) The diameter of small pores d. (c) The distance between the adjacent pores Λ. (d) The thickness of ITO tITO.
As a general rule, the effect of structural parameters on the sensitivity of a sensor is opposite to the effect of structural parameters on the linearity of a sensor. In other words, the higher the sensitivity, the worse the linearity after demodulation, and the better the linearity, the lower the sensitivity. Therefore, a balance should be maintained between sensitivity and linearity in accordance with the practical requirements. If the application scenario requires high sensitivity, it is recommended to set the structural parameters in such a way that they reduce the linearity to a certain extent and achieve the required sensor sensitivity. If the goal is to ensure good reliability, i.e., good linearity, it is recommended to reduce the sensitivity moderately to ensure the required level of linearity. Through comprehensive analysis, we obtained the optimal values of the structural parameters of the sensor proposed in this work, as shown in Table 1.

Table 1.
Optimized geometric parameters for the sensor.
4. Sensing Performance of the Proposed Sensor
In the previous section, we discussed the determination of structural parameters of the proposed sensor. In order to make the sensor work normally, it was also necessary to calibrate the parameters presented in Equation (1). Afterwards, the sensitivity and resolution of the sensor could be determined according to these parameters. For this purpose, we tested the loss spectrum and transmission spectrum of the optimized sensor under different values of temperature and magnetic field. The results are shown in Figure 7 and Figure 8. Figure 7 shows the loss spectra and transmission spectra obtained under different temperatures when the magnetic field of the surrounding environment was 0. It is evident that when the ambient temperature increased from 0 °C to 25 °C, the central wavelengths of the loss spectrum formant and transmission spectrum formant shifted significantly towards a longer wavelength, i.e., a red shift occurred. Then, we fixed the ambient temperature at 10 °C, increased the magnetic field from 0 mT to 60 mT, and measured the loss spectrum and transmission spectrum of the sensor. The results are shown in Figure 8. It is evident from Figure 8a that the loss spectrum did not change significantly with an increase in the magnetic field. This is because of the ITO film, which induced the SPR effect. In the near-infrared waveband, the ITO film had a shielding effect on the magnetic field in the manner of metals, so it did not respond to the change in the magnetic field. As presented in Figure 8b, as the magnetic field increased, the central wavelength of the transmission spectrum formant gradually shifted towards a shorter wavelength, i.e., a blue shift occurred.
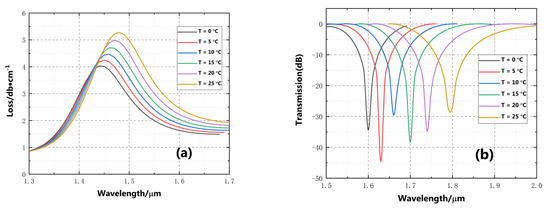
Figure 7.
The loss spectra (a) and transmission spectra (b) under different temperatures for the optimized sensor, H = 0 mT.
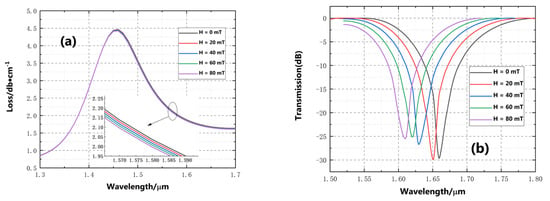
Figure 8.
The loss spectra (a) and transmission spectra (b) under different magnetic fields for the optimized sensor, T = 10 °C.
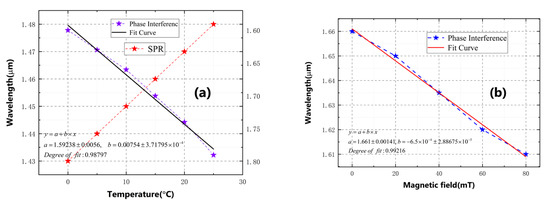
In order to calibrate the parameters in Equation (1), we extract the central wavelengths of the formants in Figure 7 and Figure 8 and draw them again in Figure 9. Since the magnetic field in the surrounding environment had no impact on the loss spectrum, only the central wavelength of the transmission spectrum formant is shown in Figure 9b. The results of linear fitting on these data are also shown in Figure 9. The slopes of these fitting lines are . represents the temperature coefficient of the transmission spectrum formant, which is 7.6 nm/°C after fitting; represents the magnetic field coefficient of the transmission spectrum formant, which is 2 nm/mT after fitting; represents the temperature coefficient of the loss spectrum formant, which is −0.75 nm/°C after fitting; and represents the temperature coefficient of the loss spectrum formant. Since the magnetic field had a little effect on the loss spectrum, its value is 0. The values of are substituted in Equation (5) to solve the inverse matrix. Thus, the mathematical expressions for temperature change and magnetic field change are obtained:
In practical applications, the center wavelength offsets of the loss spectrum formant and transmission spectrum formant are monitored at the same time, and the temperature–magnetic field dual-parameter measurement is realized by substituting the two offsets in Equation (10). Based on Figure 7 and Figure 8 and Equation (10), we determined that the temperature sensitivity of the proposed sensor is 7.16 nm/°C, the temperature measurement range is 0–25 °C, the magnetic field sensitivity was −0.75 nm/mT, and the magnetic field detection range was 0–80 mT. The temperature resolution and magnetic field resolution of the sensor were calculated using Equation (11). Under the assumption that the minimum wavelength resolution of the spectrometer was , the computed average temperature resolution and average magnetic field resolution of the proposed sensor were 1.316 × 10⁻³ °C and 1.333 × 10⁻³ mT, respectively.
In order to test the accuracy of dual-parameter sensing of the proposed sensor, we randomly selected two combinations of ambient temperature and magnetic field (5 °C/20 mT and 15 °C/40 mT) and tested the loss spectrum and transmission spectrum of the sensor under these two conditions. The corresponding results are shown in Figure 10. The central wavelength offset of transmission spectrum formant and the central wavelength offset of loss spectrum formant are presented in Figure 10. The results are 61 nm and 19.62 nm, respectively. After substituting and in Equation (10), we obtain the temperature change and magnetic field change , which are very close to the real values (, ).
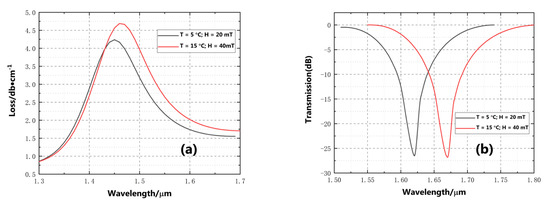
Figure 10.
The loss spectra (a) and transmission spectra (b) of the sensor in two different scenarios (5 °C/20 mT and 15 °C/40 mT).
Finally, we compared the performance of the proposed sensor with other dual-parameter optical fiber sensors presented in previous literature. The corresponding results are presented in Table 2. This table presents some key metrics for different sensors, including working principle, geometry size, sensitivity, and measurement range. It is evident from the results that the proposed sensor has two advantages. First, both its temperature sensitivity and magnetic field sensitivity are high. Its magnetic field detection range can reach up to 0–80 mT, while the maximum magnetic field detection ranges of other sensors can only reach up to 0–50 mT. Second, the size of the core component of the proposed sensor is only 1 cm, thus making it easier to produce and allow the sensor to be integrated in other devices conveniently. The aforementioned comparison results demonstrate that the proposed sensor has excellent characteristics, such as high sensitivity and wide measurement range. Therefore, it has great application potential in the field of environmental monitoring. Actually, the fiber-based Sagnac interferometer can also be used to monitor the refractive index of proteins [21], blood, etc. Thus, the sensor proposed in this paper could also find an application in biosensing systems [22].

Table 2.
Comparison of the proposed sensor and other published solutions.
5. Conclusions
In summary, a dual-parameter sensor for temperature and magnetic field was proposed and investigated based on a photonic crystal fiber with a circular lattice. Firstly, the effects of geometrical parameters on the performance of the sensor were analyzed and discussed. Then, the optimum geometrical parameters were identified based on a balanced consideration of sensitivity and linearity. In practice, the simultaneous sensing of temperature and magnetic fields is achieved by measuring the shift of the formants in the loss and transmission spectrum. The obtained results showed that the temperature sensitivity can reach 7.16 nm/°C with a detection range of 0 to 25 °C, and the magnetic field sensitivity is −0.75 nm/mT with a detection range of 0–80 mT. The temperature and magnetic field resolutions are 1.316 × 10⁻³ °C and 1.333 × 10⁻³ mT, respectively. The proposed sensor not only has a relatively high sensitivity, but also a wide sensing range, which has great potential for applications in areas such as environmental monitoring.
Author Contributions
Conceptualization, D.W. and J.Y.; methodology, D.W.; software, Q.H. and J.Y.; validation, L.Y.; formal analysis, Q.H.; investigation, D.W. and J.Y.; resources, Q.H.; data curation, J.Y.; writing—original draft preparation, D.W.; writing—review and editing, D.W.; visualization, Q.H. and J.Y.; supervision, D.W.; project administration, L.Y.; funding acquisition, D.W. All authors have read and agreed to the published version of the manuscript.
Funding
This work was supported in part by the National Natural Science Foundation of China (Nos. 62141505 and 61367007); the Natural Science Fund of Gansu Province of China (no. 20JR10RA154).
Data Availability Statement
Not applicable.
Conflicts of Interest
The authors declare no conflict of interest.
References
- Hasan, R.; Akter, S.; Ahmed, K.; Abbott, D. Plasmonic refractive index sensor employing niobium nanofilm on photonic crystal fiber. IEEE Photon. Technol. Lett. 2017, 30, 315–318. [Google Scholar] [CrossRef]
- Duan, L.; Yang, X.; Lu, Y.; Yao, J. Hollow-fiber-based surface plasmon resonance sensor with large refractive index detection range and high linearity. Appl. Opt. 2017, 56, 9907–9912. [Google Scholar] [CrossRef]
- Rifat, A.A.; Ahmed, R.; Mahdiraji, G.A.; Adikan, F.M. Highly sensitive D-shaped photonic crystal fiber-based plasmonic biosensor in visible to near-IR. IEEE Sens. J. 2017, 17, 2776–2783. [Google Scholar] [CrossRef]
- Shi, W.H.; Wu, J. Photonic crystal fiber sensor based on surface plasmonic and directional resonance coupling. Acta Opt. Sin. 2015, 35, 41–45. [Google Scholar]
- An, G.; Li, S.; Wang, H.; Zhang, X.; Yan, X. Quasi-D-shaped optical fiber plasmonic refractive index sensor. J. Opt. 2018, 20, 035403. [Google Scholar] [CrossRef]
- Haque, E.; Hossain, A.; Ahmed, F.; Namihira, Y. Surface Plasmon Resonance Sensor Based on Modified D -Shaped Photonic Crystal Fiber for Wider Range of Refractive Index Detection. IEEE Sens. J. 2018, 18, 8287–8293. [Google Scholar] [CrossRef]
- De la Rosa, E.; Zenteno, L.A.; Starodumov, A.N.; Monzon, D. All-fiber absolute temperature sensor using an unbalanced high-birefringence Sagnac loop. Opt. Lett. 1997, 22, 481–483. [Google Scholar] [CrossRef] [PubMed]
- Cui, Y.; Shum, P.P.; Hu, D.J.J.; Wang, G.; Humbert, G.; Dinh, X.-Q. Temperature sensor by using selectively filled photonic crystal fiber Sagnac interferometer. IEEE Photon. J. 2012, 4, 1801–1808. [Google Scholar] [CrossRef]
- Shi, M.; Li, S.; Chen, H. A high-sensitivity temperature sensor based on Sagnac interferometer employing photonic crystal fiber fully filled with ethanol. Appl. Phys. B-Lasers O. 2018, 124, 94. [Google Scholar] [CrossRef]
- Wang, G.; Lu, Y.; Yang, X.; Duan, L.; Yao, J. Square-lattice alcohol-filled photonic crystal fiber temperature sensor based on a Sagnac interferometer. Appl. Opt. 2019, 58, 2132–2136. [Google Scholar] [CrossRef]
- Miao, Y.; Zhang, H.; Lin, J.; Song, B.; Zhang, K.; Lin, W.; Liu, B.; Yao, J. Simultaneous measurement of temperature and magnetic field based on a long period grating concatenated with multimode fiber. Appl. Phys. Lett. 2015, 106, 132410. [Google Scholar] [CrossRef]
- Li, J.; Fan, P.; Tian, Z.; Sun, L.P.; Guan, B.O. Potential for simultaneous measurement of magnetic field and temperature utilizing fiber taper modal interferometer and magnetic fluid. IEEE Photon. J. 2016, 8, 1–9. [Google Scholar] [CrossRef]
- Liu, H.; Wang, Y.; Wei, S.; Zhu, C.; Tan, C.; Wang, M.; Cheng, D. Simultaneous dual-parameter measurement based on dual-channel surface plasmon resonance in photonic crystal fiber. Optik 2017, 145, 582–588. [Google Scholar] [CrossRef]
- Liu, H.; Li, H.; Wang, Q.; Wang, M.; Ding, Y.; Zhu, C.; Cheng, D. Temperature-compensated magnetic field sensor based on surface plasmon resonance and directional resonance coupling in a D-shaped photonic crystal fiber. Optik 2018, 158, 1402–1409. [Google Scholar] [CrossRef]
- Liu, H.; Li, H.; Wang, Q.; Wang, Q.; Wang, M.; Ding, Y.; Zhu, C. Simultaneous measurement of temperature and magnetic field based on surface plasmon resonance and Sagnac interference in a D-shaped photonic crystal fiber. Opt. Quantum Electron. 2018, 50, 392. [Google Scholar] [CrossRef]
- Chen, Y.; Xie, Q.; Li, X.; Zhou, H.; Hong, X.; Geng, Y. Experimental realization of D-shaped photonic crystal fiber SPR sensor. J. Phys. D. 2016, 50, 025101. [Google Scholar] [CrossRef]
- Suzuki, K.; Kubota, H.; Kawanishi, S.; Tanaka, M.; Fujita, M. Optical properties of low loss polarization maintaining photonic crystal fibre. Opt. Express. 2001, 9, 676–680. [Google Scholar] [CrossRef]
- Liu, B.H.; Jiang, Y.X.; Zhu, X.S.; Tang, X.L.; Shi, Y.W. Hollow fiber surface plasmon resonance sensor for the detection of liquid with high refractive index. Opt. Express. 2013, 21, 32349–32357. [Google Scholar] [CrossRef]
- Danlard, I.; Akowuah, E.K. Assaying with PCF-based SPR refractive index biosensors: From recent configurations to outstanding detection limits. Opt. Fiber Technol. 2020, 54, 102083. [Google Scholar] [CrossRef]
- Wang, Q.; Feng, X.; Zhao, Y.; Li, J.; Hu, H. Research on fiber loop coupled resonator slow light and displacement sensing technology. Sens. Actuator A Phys. 2015, 233, 472–479. [Google Scholar] [CrossRef]
- Wang, Z.; Liu, Y.; Gong, C.; Yuan, Z.; Shen, L.; Chang, P.; Liu, K.; Xu, T.; Jiang, J.; Chen, Y.-C.; et al. Liquid crystal-amplified optofluidic biosensor for ultra-highly sensitive and stable protein assay. PhotoniX 2021, 2, 18. [Google Scholar] [CrossRef] [PubMed]
- Chiavaioli, F.; Gouveia, C.A.; Jorge, P.A.; Baldini, F. Towards a uniform metrological assessment of grating-based optical fiber sensors: From refractometers to biosensors. Biosensors 2017, 7, 23. [Google Scholar] [CrossRef] [PubMed]
- Li, C.; Ning, T.; Wen, X.; Li, J.; Zhang, C.; Zhang, C. Magnetic field and temperature sensor based on a no-core fiber combined with a fiber Bragg grating. Opt. Laser Technol. 2015, 72, 104–107. [Google Scholar] [CrossRef]
Publisher’s Note: MDPI stays neutral with regard to jurisdictional claims in published maps and institutional affiliations. |
© 2022 by the authors. Licensee MDPI, Basel, Switzerland. This article is an open access article distributed under the terms and conditions of the Creative Commons Attribution (CC BY) license (https://creativecommons.org/licenses/by/4.0/).