Abstract
One of the most common power problems today is communication and control delays. This can adversely affect decision interaction in grid security management. This paper focuses on communication signal delays and how to identify and address communication system failure issues in the context of grid monitoring and control, with emphasis on communication signal delay. An application to solve this problem uses a thyristor switch capacitor (TSC) and a thyristor-controlled reactor (TCR) to improve the power quality of the Rwandan National Grid (RNG) with synchronous and PV generators. It is to counteract the negative effects of time delays. To this end, the TSC and TCR architectures use two methods: the fuzzy logic controller (FLC) method and the modified predictor method (MPM). The experiment was performed using the Simulink MATLAB tool. The power quality of the system was assessed using two indicators: the voltage index and total harmonic distortion. The FLC-based performance was shown to outperform the MPM for temporary or permanent failures if the correct outcome was found. As a result, we are still unsure if TSC and TCR can continue to provide favorable results in the event of a network cyber-attack.
1. Introduction
The modern grid has a large number of controllers in the measurement of electricity that are widespread in different parts of the world, such as generation, transmission, and distribution, for which control and construction often lead to delays in communication [1]. As the system becomes more complicated, new technology phasor measuring units (PMUs) are created to measure dynamic data from the power system, such as voltage, flow, demand angles, frequency, and power factor. Global positioning system (GPS) satellites synchronize all the collected information with PMUs. Signals such as voltage response, speed response, rotor angle, and so on are evaluated and transmitted to the control center. Because the PMUs must send signals to the control center, they depend on various communication infrastructure [2], which introduces time delays. Delays between the moment of measurement and the signal reaching the controller are generally in the nanoseconds to seconds range, depending on location, structures, and various other parameters [3,4]. The quality of the electricity supplied to a customer is referred to as power quality [5]. In order to maintain the reliability and cost of electrical machinery, it is necessary to maintain and improve the comfortable energy of the machine. In this article, we use a combination of a thyristor switch capacitor (TSC) and a thyristor-controlled reactor (TCR) [6,7,8] to make an energy-friendly improvement for a hybrid machine. The total voltage deviation (TVD) at the point of common coupling (PCC) is sent to the TSC and TCR controllers. All of these measurements are collected and delivered via the PMU. This causes a delay and delays the controller input.
Previously, several studies on the effects of time on the control mechanism and feeding system have been performed [5,9,10,11,12]. Furthermore, several studies have been performed with the aim of minimizing the negative impact of delays on system performance [13,14,15,16,17]. All of these available solutions to mitigate the effects of delays are considered to be ongoing delays, time-varying delays, or random delays [4].
The inter-area oscillations of a multiarea-linked power system could be successfully suppressed under the impact of time-varying delays on a wide-area communication network, according to Li et al. [18]. Bilinear transforms were used to obtain a discrete-time model of a long-range attenuation controller. Zappone et al. proposed a new approach to power control for wireless networks [19]. This approach optimized both the energy efficiency and the latency of the communication together, taking into account the quality of the service constraints associated with the maximum bit error rate or the minimum achievable bit error rate [19]. Sargolzaei et al. concentrated on time delays introduced into the control system by hackers to destabilize the system, and a time delay estimator was modified using an indirect supervisor and a modified minimum average. A squared minimization technique that tracked the time delay introduced by an attacker used model reference control [20]. Alexander et al. proposed an enhanced time delay compensator (ETDC) approach that managed varying time delays, introducing the perspective of network latency instead of dead time; also, the ETDC took advantage of real signals and measurement transmission procedures in WAMS, building a closed-loop memory control for the power system [21]. The authors of [22] addressed the time delay effect of wide-area monitoring and control systems (WAMCS) in smart power grids, which can have a significant impact on system stability. The main purpose was to perform a detailed WAMCS delay analysis in the event of a network failure.
In addition, [23] addressed the issue of delay minimization for wireless sensor network (WSN) relay-based delay minimization routing (DMR) and cooperative delay minimization routing (CoDMR) issues. This work suggested a greedy technique for finding a workable DMR and CoDMR scheme with low overall total energy cost, energy balancing, and latency when using binary fields. In [24], Hai proposed a time synchronization solution based on time division long-term evolution (TD-LTE) frame synchronization to improve the accuracy by correcting the delay caused by the radio propagation path. In this work, Padhy described a time delay compensation (ATDC) method’s system, structure, features, and implementation strategy, as well as timing accuracy. In [25], a compensation technique was proposed that took into account the time-varying delay of wide-area power grid stabilizers. In this task, Zhang considered splitting a finite random delay into multiple delay intervals and designed a compensator for each interval. In addition, a predictive-based hierarchical delay compensation method was proposed at the data-processing level to handle delays in a wide-area control system (WACS) power system [26].
Although, as mentioned earlier, much work has been conducted on time delay impact and techniques for minimizing it, most of these analyses have been performed in the steady state of the power grid. None of the studies has looked at the influence of time delay, as well as how to reduce the negative impacts of a delay by using a TSC and TCR approach in the event of a failure to enhance power quality under fault situations.
Predicated on this context, this paper presents two methods, a fuzzy logic controller (FLC)-based method and a modified predictor method, to reduce the harmful effects of time delays on power quality management with a combined thyristor switch capacitor (TSC) and a thyristor-controlled reactor (TCR) for reactive power compensation in the situation of a hybrid electric grid comprised of sequential and changeable irradiances with a temperature PV plant. The FLC method was chosen because it can manage the nonlinear behavior, instability, inaccuracy, or fluctuation of input parameters and allows for the incorporation of expert knowledge into control rules [2,16,17,27,28]. This type of controller works well under shifting system parameters and with moment signals. In terms of reducing the negative impacts of temporal delays, the FLC-based technique outperforms the modified predictor method. Two indices are utilized to evaluate the system’s power quality: the voltage indication and the total harmonic distortion (THDu). At several sites in the electrical network, such as the Kigali National Grid (KNG), temporary and permanent faults, both balanced and unbalanced, are investigated.
The following is the structure of this paper: Section 2 covers the proposed study’s Kigali National Grid power system model. Section 3 discusses communication delays with the combined TSC and TCR controllers. Section 4 discusses ways to reduce communication delays. The simulation findings are described in Section 5. Finally, Section 6 gives this paper’s findings.
2. Kigali National Grid Description
Generally, the study shows an analysis of the performance of a region (surrounded by a red marker) with one central, regional power station in central Rwanda in the Great Rift Valley of central Africa where the African Great Lakes region and east Africa converge, and the behavior in the electricity map is as shown in Figure 1. The solution is based on the Kigali National Grid (KNG) system and includes the integration of a PV farm, as illustrated in Figure 2, to test the suggested technique’s applicability to a complex power system. The details on the network data, generators, excitation systems, and PSSs are as follows. Generators 1-6 had local PSSs installed. The PV farm is located near the SS9 Mount Kigali substation.
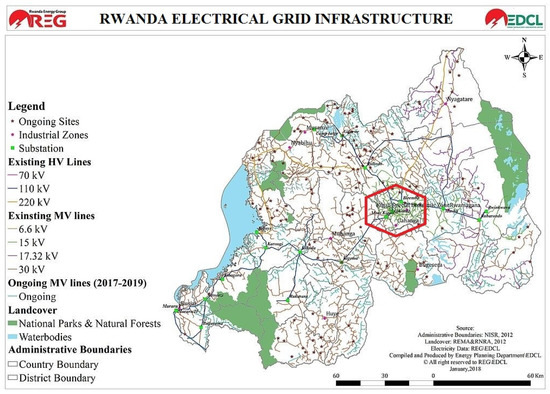
Figure 1.
Estimated location of electricity transmission and distribution network. Source: REG [32].
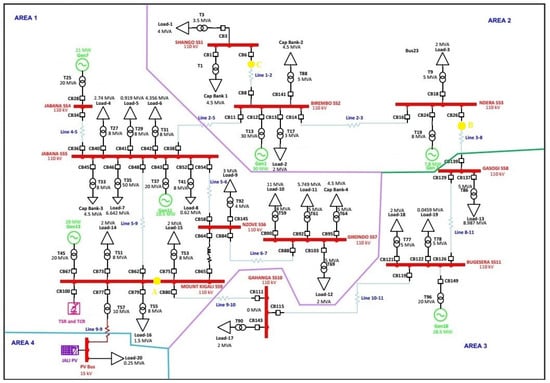
Figure 2.
Kigali National Grid system with five coherence areas.
The automated voltage regulator and the governing control models were installed on synchronous generators. This system had eleven substations that were linked together via transmission lines. In addition, twenty loads, such as Load 1, Load 2, and Load 20, were connected at separate buses. Loads such as Load 5, Load 13, and Load 16 employed in the case study were voltage-stiff nonlinear loads [29,30,31,32]. Section 6 demonstrates and explores the nonlinear characteristics of nonlinear loads, i.e., the harmonic spectra of these loads.
In this research, a 94-Mvar thyristor switch capacitor (TSC) bank and a 109-Mvar thyristor-controlled reactor (TCR) bank linked to the Mount Kigali SS9 bus substation through the secondary side of the transformer were employed to improve the power quality. The measurements utilized in the hybrid system stated above may be found in the study’s appendices, and the solar power plant had a capacity of 0.25 MW. Table 1 provides an overview of the model’s many components. Transmission and distribution voltage ranges ranging from 110kV to 15 kV are included in the present model. Rwanda’s highest voltage network is now 110 kV, with the intention to upgrade to 220 kV soon [33].

Table 1.
Number of components in system model.
In this study, we used data collected from the Energy Utility Corporation Limited (EUCL) of the Rwanda Electricity Group (REG). The data collected were intended to match the output of the algorithm used. With regard to freight and emergency analysis, we collected information on the real power and causes of the bus and cargo buses, as well as the real energy needed and the distribution. The details of the research are attached to the back pages of this report [30,31,32,33,34]. The use of data from the Utility Data Center and the Power National Dispatching Center is recommended for full access to the information required for this research.
3. Communication Delay Issues with Combined TSC and TCR Controller
As demonstrated in Figure 2, TSC and TCR can be utilized in tandem to govern the reactive power flow from the source to the loads. The separate modules are connected together to provide maximum flexibility to the consumers’ loads by concurrently changing the switching of the capacitor banks in discrete numbers in the TSC branch and constantly modifying the flow of the current in the inductor in the TCR branch. It is possible to obtain completely stepless control by coordinating the control between the continuous reactor and the capacitor stages (which are discrete).
Dynamic control strategies of coupled TSC and TCR methods have continuous control, almost no transients, and reduced harmonic production (due to the regulated reactor rating being tiny in comparison to the overall power flow) with control and operation flexibility [35,36]. The drawback of the TSC-TCR method compared to TCR- and TSC-type compensators is the greater installation cost; nevertheless, the cost can be repaid in a shorter period of time: in the long term, this plan is more cost-effective than paying the Electricity Authority for KVA demand charges on a regular basis. A static VAR system compensates for reactive power delivered into the line in a rapid, smooth, and stepless manner. It guarantees that bus voltages are accurately controlled throughout a wide variety of loads.
3.1. Combined TSC and TCR Model
The TSC-TCR was linked to the general grid line, as indicated in Figure 3. Six thyristors were linked to the capacitor, while the other six were connected to the inductor [37]. The thyristors were used to convert these capacitors. The reaction capacitor’s capacitance, C, was 94 Mvar, while the inductor’s capacitance was 109-Mvar. It only worked when the error rate between the voltage lines was more than 2%. The controller’s output was alpha (∝), which was used to modify the thyristors’ pulses. The control of switching TSC and TCR for fuzzy input is shown in Figure 4. It is worth noting that this one-of-a-kind fuzzy controller could help assist other delay reduction approaches, such as PSS and PSS fuzzy.
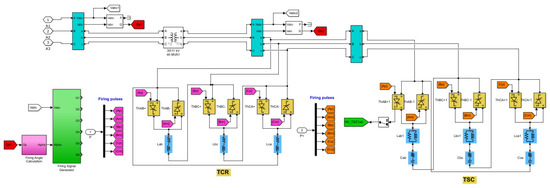
Figure 3.
TSC-TCR 3-phase circuit diagrams with grid connection concept.
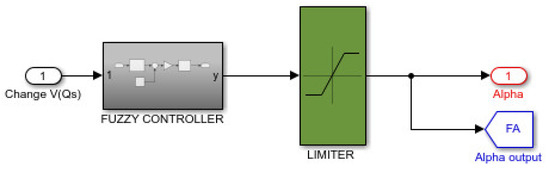
Figure 4.
Control block for switching of TSC-TCR.
3.2. Causes of Electrical Network Communication Delays
Connectivity delays in the hybrid power grid include signal transmission from the PMUs to control centers, as well as from the control centers to controllers, analog-to-digital conversion, online calculation of the global input variables, and signal–time synchronization utilizing GPS. As a result of these delays, controller and system performances suffer [1]. In wide-area control system communication networks, data are sent in packets. Serial delays, defined as the time elapsed between two consecutive bits of data supplied, are one type of temporal delay [38]. A different type of delay is between packet serial delays, which are defined as the time gap between two consecutive data packets. The time it takes for data to be transferred through a network and then resent to another location is known as a routing delay. The time it takes to send data via a communication channel is known as a propagation delay. As a result, the following equations can be used to express the entire time delay:
where is a sequential delay; represents a difference between the latency; is a phase delay; is a transportation delay; is packet size (bits/packet); is the data transmission rate; is the length of the network connection; and is the data transmission speed [39].
3.3. TSC-TCR Controller Time Delay Issue
Figure 5 displays the TSC’s GPS-based shut control system. The controller input was gathered from the control center, as shown in Figure 5, and delays were created throughout the signal transmission, causing the production of such a controller output (alpha) to be delayed, reducing the system’s power quality. Figure 5 depicts the GPS-enabled feedback control. It is also important to note that such delays affect both the transmission and distribution connections. As illustrated in Figure 5, the speed equivalent signal from each generator was routed through filters and an A/D adapter. The digitalized rate equivalent signals from the generators were then routed to a central control office, where they were synced using a GPS receiver. The synchronized signals were used to calculate the total W and time derivatives of TKED. The time derivative of the TKED signal was then given as data output to the other fuzzy controller input. In this case, the instructions could be transmitted and received by wireless or fiber optic methods.
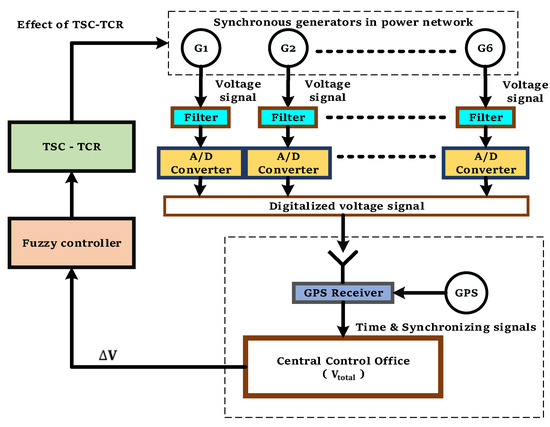
Figure 5.
GPS-enabled shuttered monitoring system.
3.4. Performance Expectations
Additionally, temporal delays were introduced during the continuous computation of such partial derivatives for the TKED, due mostly to either data propagation across optical fibers or wireless methods, A/D transition, or determination of the W cumulative, as well as period derivation of the TKED or signal data communication using GPS. Time delays could have an influence only on control logic, affecting the minimization of shaft torsional oscillations. As a result, while studying a decrease in the shaft torsional waves, such constraints must be considered. In most circumstances, time delays might vary from several microseconds to a few more hundred milliseconds [38,39,40,41]. Comprehensive simulations were performed in this work, utilizing a variety of common time delay settings. Section 5.2 describes some of the simulated occurrences that corresponded to a 900 ms significant delay.
4. Modeling the Problem to Suggest a Solution, Including Developing Communication Delay Reduction Solutions
4.1. Method Using FLC
A two-input-based FLC method was used in this work to reduce the negative impacts of time delays on the TSC performance. The FLC inputs were the voltage-level fluctuations at the PCC and V, as well as the latency of the control input (D). The controller’s output was alpha (α), which was the thyristor’s firing angle. The signal delays ranged from 100 to 900 ms during the controller design phase, which covered all the practical scenarios [40,42]. The following is a description of the planned FLC.
During the fuzzification process, the membership grade was determined. Both the inlet and outlet triangles formed control parameters, as depicted in Figure 6 and Figure 7, and were obtained after a sequence of trial and error. It is worth mentioning that, when additional fuzzy measures were set, such as nonlinear regression features, and were examined and tried, the system functioned admirably. Unfortunately, in several cases, the input and output membership algorithms produced great outcomes. This is why triangle membership functions were used for this study. Figure 6 depicts the symbols NB (negative large), NM (negative medium), Z (zero), PM (positive medium), PB (positive big), N (negative), and P (positive). In Figure 7, the membership functions of the thyristors’ firing angle (alpha), are NB, NM, Z, PM, and PB. Throughout this work, one continuity formula [41] was used to determine the degree of crisp values:
where is the value of the membership grade; is the value of V and D; is the position where the membership grade is one; and is the length. In this work, Table 2 shows 15 guidelines for items such as the independent variables, V, and the outcome variable. The management guidelines were published with a certain system functioning, as well as a defect-detecting technique.
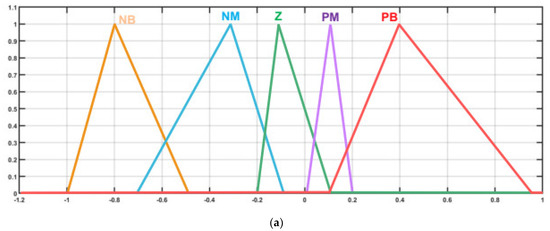
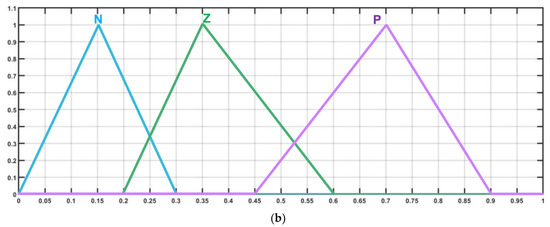
Figure 6.
Fuzzy controller input membership function: (a) ΔV and (b) delay.
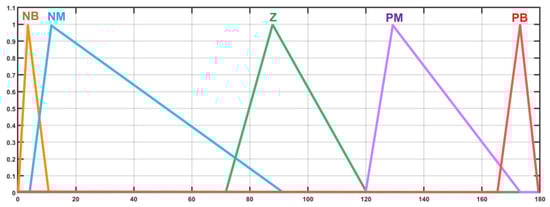
Figure 7.
Membership functions of fuzzy controller linear output.
Table 2.
Membership functions of input and output.
Formula (5) indicates the extent of conformance of every fuzzy set using Mamdani’s technique [41]:
where and are membership grade values, and is the provision of the section. The following middle-area approach was used to compute the thyristor firing angle, :
where is the fuzzy-logic-based table’s value for.
4.2. Adapted Predictor Method
The signal in Figure 8 was adjusted for transmission delay using the suggested improved predictor approach before being sent to the controller. Figure 9 depicts the flow diagram for the updated predictor approach. Before sending the delayed signal into the controller, the prediction method’s algorithm could alter it to the original curve. The prediction approach was versatile in that it could adapt to any controller. If the time delay was , the predicted could be determined given the level in comparison, the previous recorded points, and the estimation [43].
with indicating the predicted position; representing the observed location position; representing a steady value; and representing the rapidity at which the controller’s signal changed. was 0.25, as determined through trial and error.

Figure 8.
Predictor model.
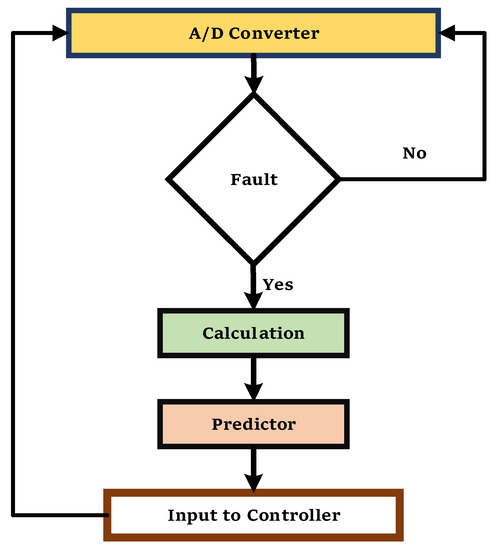
Figure 9.
The improved prediction method’s diagram layout.
5. Simulation Results and Discussion
This study investigated the effect of latency issues on the effectiveness of a TSC-TCR device for increasing hybrid power system efficiency. The suggested method was simulated as described in this section using 64-bit MATLAB version 2020a.
5.1. PV Jali in Grid-Following Mode, PQ Control, and Irradiance Variation
As can be seen from the Figure 10 results, our grid had a Jali PV plant that was based on SS9 Mount Kigali. In its operation, it was based on input conductions of temperature and irradiance; therefore the temperature had a range of 25–45 °C, and the irradiance had a range of 200–1000 . Figure 10 shows how the and changed depending on temperature and irradiance, and the measured values at 10 s (on-grid) show that active power and reactive power were required for Load 20 and Filter C before working with the grid on SS9 Mount Kigali. By examining the grid, it appeared that there was a power drop, but it was able to support Load 20. Moreover when it was completely off, it can be seen that there was a disturbance in the measurements obtained from all the G1–G6 generators.
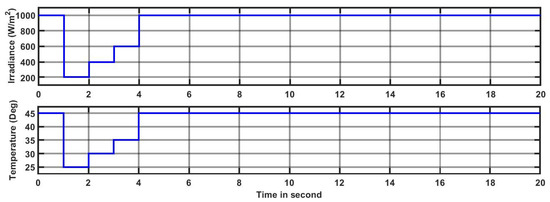
Figure 10.
Variations in Jali PV module parameters with irradiance and temperature.
Table 3 shows the simulated power flow results for a solar panel connected to the electric network at various levels of solar irradiance with demand. As demonstrated in Table 3, the power generated by the solar panel was related to its solar irradiation. There were several types of testing. The first alternative was that, when the PV system’s output power exceeded the power load, the excess electricity was consumed by the utility grid. The second option was that, if the PV system’s power generated equaled the power demand, no power would be supplied to the grid. Once the energy generated from the PV plant was inadequate for self-sufficiency, in the third situation, the solar panel and the grid would be shared to provide the load. As shown, employing around 30 °C with 400 provided us with the optimum option to serve our utility grid based on Mount Kigali SS9.
Table 3.
Power flow simulation results for the planned system with various levels of solar irradiation.
Figure 11 and Figure 12 show how the grid behaved at different times. For example, in Figure 11 the PV was removed when there was an example r separated by the grid and operating at 45 degrees and 1000 degrees of irradiance. These changes were observed from 0 to 18 s and affected the active power, reactive power, , and grids.
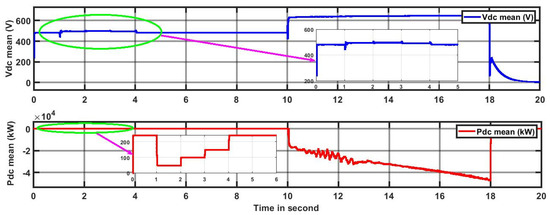
Figure 11.
and grid-connected PV inverter power conversion signal with four steps of irradiance.
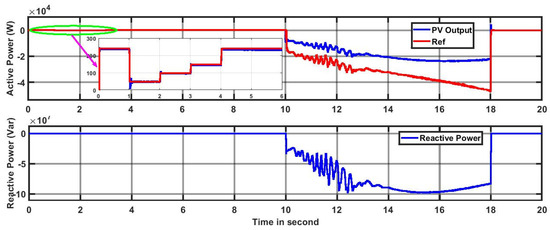
Figure 12.
PV active and reactive power outputs.
5.2. Effect of Time Delay without Minimization Methods
The modeling tests showed how much communication latency was accepted by the system in order to maintain the system stability. The impact of time delay was assessed from the following perspectives: without communication delay, as well as with the lowest and maximum communication delays that the system could tolerate in order to maintain acceptable performance. When there was a delay of 900 ms in the generator, the system responded to the failure scenario (G1–G6). As seen in the graph, due to the delay, it took the controller longer to detect the defect and respond to it. The controller could still provide a strong damping performance and efficiently compensate for the delay.
When there was a delay of 900 ms in the generator (G1–G6), it took longer for the controller to respond to the issue. The controller still provided sufficient damping performance. The entire Kigali National Grid (KNG) system, however, grew unstable. The simulation findings from the study implied that low latency communication was required to preserve the system’s stability. The longer the communication latency, the slower the control operations, which could lead to power system instability and oscillation. The control system experienced increased system overshoots and longer settling times when network delays grew from 100 ms to 900 ms.
Figure 13 of the active power and reactive power shows how different changes occurred on the grid when the shunt reactor and the two capacitance banks started to work from 10 s when there was a 7 s inundation of the PV system. At 18 s, there was an impact when the Jali PV plant was disconnected.
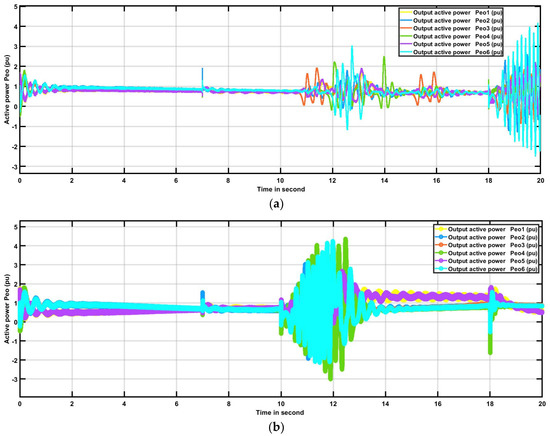
Figure 13.
System responses to fault scenario with constant time delays of 900 ms (a) and 100 ms (b).
5.3. The Proposed Method’s Performance in Terms of the Voltage Index
In this work, the influence of latency upon the performance of only one fuzzy-regulated TSC-TCR was first explored. It was determined that raising the controller signal’s significant delay decreased the controller’s performance. The voltage responses at the PCC for both permanent and temporary three-line-to-ground (3LG) failures at location A without any controller, no latency, and a 900 ms delay are shown in Figure 14 and Figure 15. Table 4 displays the voltage indicators for such 3LG faults at sites A, B, and C. The indices in Table 5 show that the delay time degraded the efficiency of the TSC-TCR controller.
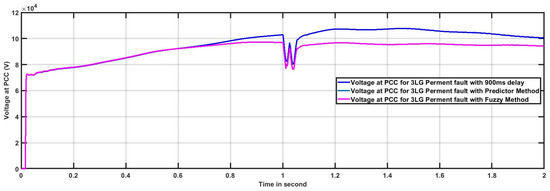
Figure 14.
3LG permanent faulty PCC voltage at location B.
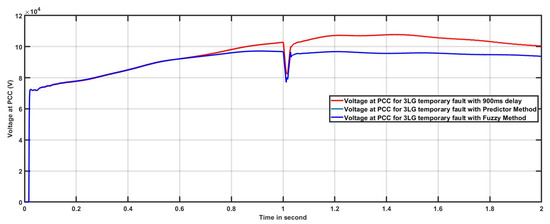
Figure 15.
3LG temporary faulty PCC voltage at location B.
Table 4.
Voltage indices.
Table 5.
Voltage indices at PCC.
As previously stated, with the efficiency of a suggested delay reduction strategy, the voltage index , presented below was used, where ΔV represents the total voltage variation of the generators, and T represents a simulation period of 20.0 s. The smaller the index value, the higher the functionalized value:
Table 5 shows the voltage indices at the PCC during permanent and temporary 3LG faults with delays approaching 900, 700, 500, 300, and 100 ms at power system locations A, B, and C using the modified predictor-delayed minimization strategy, as well as the fuzzy-regulated delayed reduction technique. The result indicators clearly show that fuzzy-controlled methodologies with updated predictor techniques were helpful in decreasing latency issues while improving the system voltage stability. Furthermore, the enhanced prediction approach was outperformed by the fuzzy-regulated strategy.
A three-phase failure occurred on the Ndera and Gasogi Lines (Line 3–8) for 0.009 s between and . The usefulness of TSC-TCR with the fuzzy logic control was demonstrated in this model. Figure 15 and Figure 16 depict fuzzy TSC-TCR modelled using Simulink/MATLAB. When a fault occurred, the TSC-TCR attempted to sustain the voltage by injecting reactive power onto the line if the voltage fell below the reference voltage (1.009 pu). With the fuzzy (TSC-TCR) controller in the system, the PCC terminal voltage oscillated less and stabilized faster, as shown in Figure 14 and Figure 15. When Lines 2–8 failed because of fault B, the terminal inter-area voltage V amounts of inter-areas 1–2, 2–3, 1–3, and 1–4 were also affected, as shown in Figure 14 and Figure 15. Figure 15 shows that the system was constructed with a fuzzy (TSC-TCR) controller. At , 0.2 s after the fault was cleared, the controller stabilized the active power differential faster.
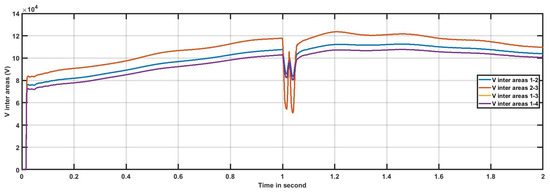
Figure 16.
Inter-area voltage for 3LG permanent fault at location B.
Table 6 demonstrates the PV generator voltage indices for both temporary and permanent 3LG faults at power system locations A, B, and C with 900, 700, 500, 300, and 100 ms delay for the fuzzy-controlled delay reduction approach and the improved predictor-delayed optimization methodology. According to indicators, fuzzy-controlled techniques with predictive methods could minimize the delay and improve the voltage profile in the hybrid grid. The improved predictor approach, on the other hand, outperformed the more-fuzzified, regulated strategy.
Table 6.
Voltage indices of PV plant.
5.4. Plot Performance of Proposed Risk Mitigation Methods
Figure 16 and Figure 17 represent voltage changes at the PCC as a result of both 3LG temporary and permanent failures at location A with a 900 ms delay. The responses show that delayed minimization techniques worked well and enhanced the power performance of the system. In terms of improving hybrid grid power quality, the results also suggest that the fuzzy-logic-controlled strategy beat the modified predictor method. The proposed approach’s efficacy in limiting the negative impacts of delay and enhancing the system power quality was proved. Therefore, the fuzzy-logic-controlled technique beat the improved logic-controlled predictor method. Figure 18 shows the fluctuation in the active power of the generator in the test system (G1–G6). When the three-phase failure occurred, at the two generators immediately dropped out of the synchronization process.
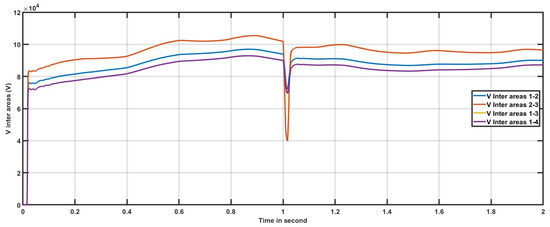
Figure 17.
Inter-area voltage for 3LG temporary fault at location B.
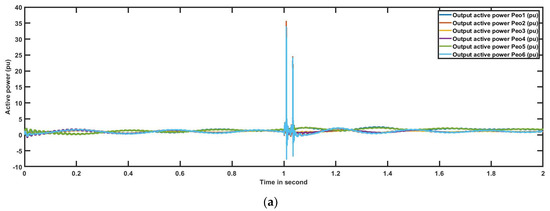
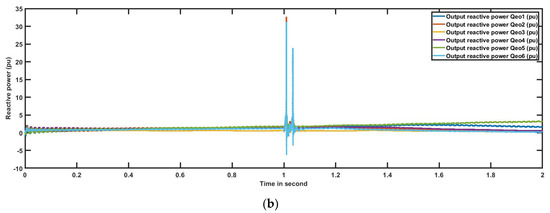
Figure 18.
Output active and reactive power for 3LG permanent fault at location B with constant time delays of 900 ms (a) and 100 ms (b).
5.5. THD Performance of Suggested Minimization Methods
Equation (10) depicts the total harmonic distortion of the PCC voltage. The THD compares the harmonic currents to a basic element of the voltage or current signal [44], in which V1 is the fundamental voltage, while V2, V3, …, represent cognitive harmonic parts of the PCC voltage [4]:
Table 7 shows the THD values for both temporary and permanent 3LG faults with 900, 700, 500, 300, and 100 ms delays for the predictor latency reduction approach with the type-2 fuzzy delay reduction method for power system sites A, B, and C. According to the THDu results, the fuzzy-regulated technique and the prediction method both efficiently minimized the delay effects and increased the system power reliability. In contrast, the enhanced predictor strategy outperformed the fuzzy logic steady electric approach. Furthermore, the oscillations presented a positive way to decrease harmonic currents in the voltage, at which the THDu in the PCC with had no control system with the modified predictor controller, although with type-2 fuzzy controller was proposed in the case of a 3LG temporary fault at location A for the 900 ms delay. The harmonics were shown to be reduced in the settings of the recommended controllers. Furthermore, the enhanced prediction approach was outperformed by the fuzzy-regulated strategy.
Table 7.
Total harmonic distortion at PCC.
Each of these methods was useful in assessing the impact of antitraumatic activities caused by errors occurring in three different locations. Thus, Table 8 outlines the pros and cons of each, indicating the advantages and disadvantages of certain approaches.
Table 8.
Advantages and disadvantages of FLC and MPM control techniques.
5.6. Nonlinear Load Harmonic Spectrum
The study’s harmonic power flow types were employed for network distribution in three-phase balanced and unbalanced categories. At the specified time domain, the coordinating force was applied. Connectivity was also achieved in a number of other harmonic modes. The previous harmonic list employed in the research included seven spectra. Figure 19 depicts the harmonic spectra in the form of the voltage, current, and nonlinear properties of the PCC employed in this investigation.
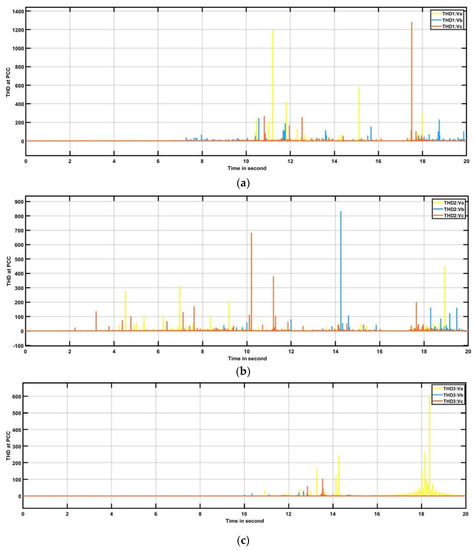
Figure 19.
Harmonic spectra of voltage in PCC for (a) no control, (b) predictor controller, and (c) fuzzy controller methods.
5.7. TSC-TCR’s Cost-Effectiveness
Surprisingly, TSC-TCR is an expensive tool that is becoming increasingly important in energy systems due to key features such as high speed, efficiency, and real-power management capabilities, among others [25,26,27,28,29,30,31,32,33,34,35]. Depending on their potential benefits and the environment, parts of the TSC-TCR system are expected to offer better storage and use to facilities in the future [36,37,38,39,40]. While the price of the TSC-TCR components may appear high at the moment, long-term research and development is expected to lower prices and improve grid security technology.
6. Conclusions
The impact of time delays on a mixed electric grid was investigated in this work, and two approaches for minimizing the bad consequences of latency affecting TSC-TCR electric improvements were proposed. Temporary and permanent faults, both balanced and unbalanced, were considered at various locations throughout the power network. Based on the simulation results, the following conclusions and recommendations can be drawn:
- (1)
- The presented strategies were suitable in minimizing the negative impact of significant delays on the hybrid power system power quality improvement;
- (2)
- In most cases, fuzzy-controlled methods represented excellent alternatives to modified predictor methods;
- (3)
- It was possible that the burden could be controlled if the response was fast (less than 1 s), which could help in inertia response;
- (4)
- The plan to use SVCs and shunt reactors is not enough when using TSC-TCR (in the REG situation of resolving the Shango SS1 and Bugesera SS11 connection problems).
Other creative techniques, such as genetic algorithms and branch-and-bound methods, should be developed and evaluated in the future, allowing the application of fuzzy MPC methods to reduce the detrimental impact of random delays. In addition, delays caused by cyber-attacks should also be evaluated, as well as relevant mitigation strategies. Moreover, it would be fascinating to demonstrate the efficacy of the suggested approaches in a big power grid, such as the IEEE 118-bus test system and others, where THDu values can exceed 10%.
Author Contributions
Conceptualization, D.M., L.K.L. and B.B.M.; methodology, D.M., L.K.L. and B.B.M.; investigation, D.M., L.K.L. and B.B.M.; writing—original draft preparation, D.M.; writing—review and editing, D.M., L.K.L. and B.B.M.; supervision, L.K.L. and B.B.M.; funding acquisition, L.K.L. All authors have read and agreed to the published version of the manuscript.
Funding
This research was partially funded by the African Center of Excellence in Energy for Sustainable Development, University of Rwanda (research core funding no. ACE II-017).
Data Availability Statement
The data given in this study are available on request from the corresponding author.
Acknowledgments
The first author would like to thank the African Center of Excellence in Energy for Sustainable Development (ACEESD), University of Rwanda (UR), for their support in this investigation. The second author appreciates the opportunity presented to conduct more research and learn more by the Department of Electrical and Communications Engineering, Moi University. The third author recognizes the Department of Mechanical and Energy Engineering, University of Rwanda (UR), for their support in strengthening the role of successful systems of knowledge and technology in short-term analysis.
Conflicts of Interest
The authors declare no conflict of interest.
References
- Muyizere, D.; Letting, L.K.; Munyazikwiye, B.B. Effects of Communication Signal Delay on the Power Grid: A Review. Electronics 2022, 11, 874. [Google Scholar] [CrossRef]
- Chompoobutrgool, Y.; Vanfretti, L.; Ghandhari, M. Survey on power system stabilizers control and their prospective applications for power system damping using Synchrophasor-based wide-area systems. Eur. Trans. Electr. Power 2011, 21, 2098–2111. [Google Scholar] [CrossRef]
- Li, M.; Chen, Y. A Wide-Area Dynamic Damping Controller Based on Robust H∞ Control for Wide-Area Power Systems with Random Delay and Packet Dropout. IEEE Trans. Power Syst. 2018, 33, 4026–4037. [Google Scholar] [CrossRef]
- Ghosh, S.; Ali, M.H. Minimization of Adverse Effects of Time Delay on Power Quality Enhancement in Hybrid Grid. IEEE Syst. J. 2019, 13, 3091–3101. [Google Scholar] [CrossRef]
- Khalili, M.; Ali Dashtaki, M.; Nasab, M.A.; Reza Hanif, H.; Padmanaban, S.; Khan, B. Optimal instantaneous prediction of voltage instability due to transient faults in power networks taking into account the dynamic effect of generators. Cogent Eng. 2022, 9, 2072568. [Google Scholar] [CrossRef]
- Salman, G.A.; Abood, H.G.; Ibrahim, M.S. Improvement the voltage stability margin of Iraqi power system using the optimal values of FACTS devices. Int. J. Electr. Comput. Eng. 2021, 11, 984–992. [Google Scholar] [CrossRef]
- Aikins, L.; Kwaku Amuzuvi, C. Power System Stability Improvement of Ghana’s Generation and Transmission System Using FACTS Devices. J. Electr. Electron. Eng. 2020, 8, 47. [Google Scholar] [CrossRef]
- Hoseynpoor, M.; Najafi, M.; Ebrahimi, R.; Davoodi, M. Power system stability improvement using comprehensive FACTS devices. Int. Rev. Model. Simul. 2011, 4, 1660–1665. [Google Scholar]
- Stahlhut, J.W.; Browne, T.J.; Heydt, G.T.; Vittal, V. Latency viewed as a stochastic process and its impact on wide area power system control signals. IEEE Trans. Power Syst. 2008, 23, 84–91. [Google Scholar] [CrossRef]
- Mokhtari, M.; Zouggar, S.; M’sirdi, N.K.; Elhafyani, M.L. Voltage regulation of an asynchronous wind turbine using statcom and a control strategy based on a combination of single input fuzzy logic regulator and sliding mode controllers. Int. J. Power Electron. Drive Syst. 2020, 11, 1557–1569. [Google Scholar] [CrossRef]
- Liu, S.; Wang, X.; Liu, P.X. Impact of Communication Delays on Secondary Frequency Control in an Islanded Microgrid. IEEE Trans. Ind. Electron. 2015, 62, 2021–2031. [Google Scholar] [CrossRef]
- Amin, M.; Al-Durra, A.; Elmannai, W. Experimental Validation of High-Performance HIL-Based Real-Time PMU Model for WAMS. IEEE Trans. Ind. Appl. 2020, 56, 2382–2392. [Google Scholar] [CrossRef]
- Fan, Z.; Kulkarni, P.; Gormus, S.; Efthymiou, C.; Kalogridis, G.; Sooriyabandara, M.; Zhu, Z.; Lambotharan, S.; Chin, W.H. Smart grid communications: Overview of research challenges, solutions, and standardization activities. IEEE Commun. Surv. Tutor. 2013, 15, 21–38. [Google Scholar] [CrossRef]
- Nan, J.; Yao, W.; Wen, J.; Peng, Y.; Fang, J.; Ai, X.; Wen, J. Wide-area power oscillation damper for DFIG-based wind farm with communication delay and packet dropout compensation. Int. J. Electr. Power Energy Syst. 2021, 124, 106306. [Google Scholar] [CrossRef]
- Liu, M.; Dassios, I.; Milano, F. Delay margin comparisons for power systems with constant and time-varying delays. Electr. Power Syst. Res. 2021, 190, 106627. [Google Scholar] [CrossRef]
- Bimali, B.; Uprety, S.; Pandey, R.P. VAR Compensation on Load Side using Thyristor Switched Capacitor and Thyristor Controlled Reactor. J. Inst. Eng. 2021, 16, 111–119. [Google Scholar] [CrossRef]
- Ghaeb, J.A.; Alkayyali, M.; Tutunji, T.A. Wide Range Reactive Power Compensation for Voltage Unbalance Mitigation in Electrical Power Systems. Electr. Power Compon. Syst. 2022, 49, 715–728. [Google Scholar] [CrossRef]
- Li, Y.; Zhou, Y.; Liu, F.; Cao, Y.; Rehtanz, C. Design and Implementation of Delay-Dependent Wide-Area Damping Control for Stability Enhancement of Power Systems. IEEE Trans. Smart Grid 2017, 8, 1831–1842. [Google Scholar] [CrossRef]
- Zappone, A.; Sanguinetti, L.; Debbah, M. Energy-Delay Efficient Power Control in Wireless Networks. IEEE Trans. Commun. 2018, 66, 418–431. [Google Scholar] [CrossRef]
- Sargolzaei, A.; Yen, K.K.; Abdelghani, M.N. Preventing Time-Delay Switch Attack on Load Frequency Control in Distributed Power Systems. IEEE Trans. Smart Grid 2016, 7, 1–10. [Google Scholar] [CrossRef]
- Molina-Cabrera, A.; Ríos, M.A.; Besanger, Y.; Hadjsaid, N.; Montoya, O.D. Latencies in power systems: A database-based time-delay compensation for memory controllers. Electronics 2021, 10, 208. [Google Scholar] [CrossRef]
- Musleh, A.S.; Muyeen, S.M.; Al-Durra, A.; Kamwa, I.; Masoum, M.A.S.; Islam, S. Time-Delay Analysis of Wide-Area Voltage Control Considering Smart Grid Contingences in a Real-Time Environment. IEEE Trans. Ind. Inform. 2018, 14, 1242–1252. [Google Scholar] [CrossRef]
- Ullah, U.; Khan, A.; Altowaijri, S.M.; Ali, I.; Rahman, A.U.; Vijay Kumar, V.; Ali, M.; Mahmood, H. Cooperative and delay minimization routing schemes for dense under water wireless sensor networks. Symmetry 2019, 11, 195. [Google Scholar] [CrossRef]
- Hai-Long, Z.; Guo-Yi, Z. A time synchronization method of power grid based on TD—LTE frame synchronization. In Proceedings of the IEEE Power and Energy Society General Meeting, Chicago, IL, USA, 1 February 2018; pp. 1–5. [Google Scholar]
- Padhy, B.P. Adaptive latency compensator considering packet drop and packet disorder for wide area damping control design. Int. J. Electr. Power Energy Syst. 2019, 106, 477–487. [Google Scholar] [CrossRef]
- Zhang, F.; Cheng, L.; Li, X.; Sun, Y.Z. A Prediction-Based Hierarchical Delay Compensation (PHDC) Technique Enhanced by Increment Autoregression Prediction for Wide-Area Control Systems. IEEE Trans. Smart Grid 2020, 11, 1253–1263. [Google Scholar] [CrossRef]
- Park, J.; Jang, G.; Son, K.M. Modeling and control of VSI type FACTS controllers for power system dynamic stability using the current injection method. Int. J. Control Autom. Syst. 2008, 6, 495–505. [Google Scholar]
- Zand, M.; Nasab, M.A.; Hatami, A.; Kargar, M.; Chamorro, H.R. Using adaptive fuzzy logic for intelligent energy management in hybrid vehicles. In Proceedings of the 2020 28th Iranian Conference on Electrical Engineering, ICEE 2020, Tabriz, Iran, 4–6 August 2020. [Google Scholar]
- Manikandan, S.; Kokil, P. Stability analysis of load frequency control system with constant communication delays. In Proceedings of the 6th Conference on Advances in Control and Optimization of Dynamical Systems ACODS 2020, Chennai, India, 16–19 February 2020. [Google Scholar]
- Rwanda Energy Group. Rwanda: Least Cost Power Development Plan (LCPDP) 2020–2040. Nyarugenge City, Kigali-Rwanda. 2021. Available online: https://www.reg.rw/fileadmin/user_upload/Least_Cost_Power_Development_Plan_2020-2024.pdf (accessed on 17 May 2022).
- Rwanda Energy Group. Rwanda Electricity Distribution Master Plan. June 2021 Revision. 2021. Available online: https://www.reg.rw/fileadmin/user_upload/Rwanda_Electricity_Distribution_Master_Plan.PDF (accessed on 17 May 2022).
- Rwanda Energy Group Limited. Annual Report For Rwanda Energy Group, of the Year 2019–2020. District, Nyarugenge City, Kigali-Rwanda. 2020. Available online: https://www.reg.rw/fileadmin/REG_ANNUAL_REPORT_2020-2021_V3.pdf (accessed on 30 September 2021).
- Rwanda Energy Group (REG). Transmission Master Plan for Rwanda Plan (2020–2028). No. June. 2019, pp. 1–57. Available online: https://www.reg.rw/fileadmin/user_upload/Rwanda_Transmission_Master_Plan_2020_-_2028.pdf (accessed on 30 June 2021).
- Rwanda Energy Group (REG). Distribution. Available online: https://www.reg.rw/what-we-do/distribution/ (accessed on 17 May 2022).
- Shukla, S. Smart ANN Controller for TCR/TSC Devices used in Power System Applications. Int. J. Emerg. Trends Eng. Res. 2020, 8, 3534–3537. [Google Scholar] [CrossRef]
- Jing, W.; Chang, F.; Wang, G.; Chen, J. Research on TSC control strategy based on the average of TCR threephase trigger angles. Zhongshan Daxue Xuebao/Acta Sci. Natralium Univ. Sunyatseni 2021, 60, 54–61. [Google Scholar] [CrossRef]
- Awad, F.; Mansour, A.; Elzahab, E.A. Reduction of harmonics generated by thyristor controlled reactor for RL loads. In Proceedings of the ACCS/PEIT 2017–2017 International Conference on Advanced Control Circuits Systems and 2017 International Conference on New Paradigms in Electronics and Information Technology, Alexandria, Egypt, 5–8 November 2017. [Google Scholar]
- Gamal, M.; Sadek, N.; Rizk, M.R.M.; Abou-Elsaoud, A.K. Delay compensation using Smith predictor for wireless network control system. Alex. Eng. J. 2016, 55, 1421–1428. [Google Scholar] [CrossRef]
- Mokhtari, M.; Aminifar, F.; Nazarpour, D.; Golshannavaz, S. Wide-area power oscillation damping with a fuzzy controller compensating the continuous communication delays. IEEE Trans. Power Syst. 2013, 28, 1997–2005. [Google Scholar] [CrossRef]
- Tiep, D.K.; Lee, K.; Im, D.Y.; Kwak, B.; Ryoo, Y.J. Design of fuzzy-PID controller for path tracking of mobile robot with differential drive. Int. J. Fuzzy Log. Intell. Syst. 2018, 18, 220–228. [Google Scholar] [CrossRef]
- Hossain, M.K.; Ali, M.H. Transient Stability Augmentation of PV/DFIG/SG-Based Hybrid Power System by Nonlinear Control-Based Variable Resistive FCL. IEEE Trans. Sustain. Energy 2015, 6, 1638–1649. [Google Scholar] [CrossRef]
- Muyizere, D.; Letting, L.K.; Munyazikwiye, B.B. Under-frequency Load Shedding on the Performance Time Delay Relays of Transmission lines with difference Controllers. In Proceedings of the 2021 IEEE Southern Power Electronics Conference, SPEC 2021, Kigali, Rwanda, 6–9 December 2021. [Google Scholar]
- Ghosh, S.; Ali, M.H. Minimization of adverse effects of time delay in smart power grid. In Proceedings of the 2014 IEEE PES Innovative Smart Grid Technologies Conference, ISGT 2014, Washington, DC, USA, 19–22 February 2014. [Google Scholar]
- Nasini, P.R.; Narra, N.R.; Santosh, A. Modeling And Harmonic Analysis Of Domestic/Industrial Loads. Int. J. Eng. Res. Appl. 2012, 2, 485–491. [Google Scholar]
Publisher’s Note: MDPI stays neutral with regard to jurisdictional claims in published maps and institutional affiliations. |
© 2022 by the authors. Licensee MDPI, Basel, Switzerland. This article is an open access article distributed under the terms and conditions of the Creative Commons Attribution (CC BY) license (https://creativecommons.org/licenses/by/4.0/).