Abstract
The detection of contaminants in food products after packaging by a non-invasive technique is a serious need for companies operating in the food industry. In recent years, many technologies have been investigated and developed to overcome the intrinsic drawbacks of the currently employed techniques, such as X-rays and metal detector, and to offer more appropriate solutions with respect to techniques developed in the academic domain in terms of acquisition speed, cost, and the penetration depth (infrared, hyperspectral imaging). A new method based on MW sensing is proposed to increase the degree of production quality. In this paper, we are going to present a novel approach from measurements setup to a binary classification of food products as contaminated or uncontaminated. The work focuses on combining MW sensing technology and ML tools such as MLP and SVM in a complete workflow that can operate in real time in a food production line. A very good performance accuracy that reached 99.8% is achieved using the non-linear SVM algorithm, while the accuracy of the performance of the MLP classifier reached 99.3%.
1. Introduction
The food industry is one of the most important human activities for the prosperity and development of society. For this reason, companies that are active in this field try to impose serious and rigorous safety procedures to control the quality of their food products. During the last decades, the automation of food production has been developing enormously, this growth increases the possibility of having more contamination sources during the production process [1]. The packaging phase is considered the most critical process in which the food product could be exposed to contaminated materials. The presence of foreign bodies is not only serious for damaging the company’s reputation, but most importantly, it can cause negative consequences for consumers’ health. Discovering these contaminants inside food packages with non-destructive techniques is a challenge, and has become an impelling need.
In the last years, many technologies and methods such as X-ray technology [2], IR imaging, and others have been explored and developed to face this issue. However, these methods have a lot of drawbacks. X-ray-based devices may fail in detecting low-density material, such as the plastic used for packaging. They also require special care in the operation within food industries due to the ionization radiation that may potentially affect the food sample under test. On the other hand, IR imaging is known for its low penetration depth, and the high absorption by water which is the main content of most food products. Other techniques have been investigated and developed to be used in such applications, such as Microwave and mmW imaging systems. The microwave can be an effective and good choice to be used in detecting contaminated material by a non-destructive technique. In addition, it has a good penetration depth inside the materials and the non-ionizing radiations are completely safe both for the food product and for the operators in the working environment.
Thus, our goal in this paper is focused on detecting physical contamination inside food packages. The novel detection principle here exploited consists of the dielectric contrast between the background (the food medium) and the contaminant. The different permittivities, indeed, cause an alteration of the electromagnetic (EM) waves, which, if correctly acquired, could lead to the notification of a foreign body. The acquired signals from the antennas operating at microwave frequencies are employed in combination with specific machine learning (ML) tools to binarily classify the food samples into contaminated or uncontaminated products. This requires the development of a microwave sensing system that can operate in real time at the speed of a fast conveyor belt that carries the packages in an industrial production line process.
The combination of ML tools with different sensing systems has become of great interest in the previous years. A lot of ML algorithms and classifiers have been used in this domain, such as neural networks [3], linear and non-linear SVM [4], and others. In our work, we are going to focus mainly on using two types of classifiers, which are the SVM (of non-linear type) and the MLP. Our choice to work with these two specific algorithms was made for many reasons. The SVM has been implemented in many electromagnetic-based applications, and in the last years, it has been inserted in microwave-based applications such as damaged apple sorting [5] and human movement classification [6]. On the other hand, the MLP has been used in archaeological shards classification [7], modeling passive and active structures and devices [8], and in the food industry [9], which is the closest to our work.
In this paper, we are going to work similarly to [9], but with some additions and modifications. The author of [9] (and one of the co-authors in this paper) chose to use the MLP classifier with a microwave sensing system to identify whether the food sample under test is contaminated or not. We proposed to enhance the results obtained in [9] in three ways. First, we investigated the SVM algorithm instead of using MLP, since we achieved very good results with this algorithm in similar applications, e.g., [5,10]. Secondly, we optimized the performance of the two classifiers using the Grey Wolf Optimizer (GWO), and finally, we constructed different types of dataset and we trained again the two ML algorithms on it. Figure 1 below shows the workflow, starting from the measurements extraction and ending with the results obtained from each classifier. It is worth mentioning that every step in this workflow after the measurements extraction was applied twice—the first time using the Amplitude only type dataset, while the second was by training the classifiers on the Complex nature dataset.
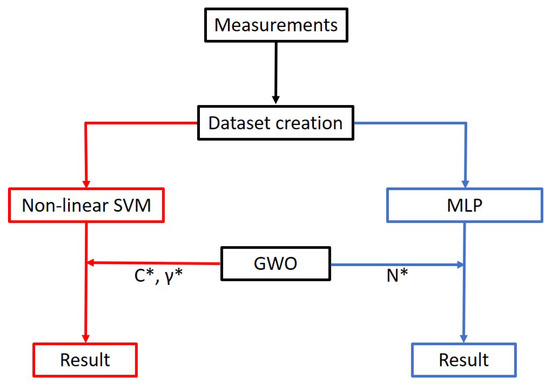
Figure 1.
Workflow.
2. Measurements Setup
The MW sensing system was developed in Politecnico di Torino laboratory and is fully described in [9,11], however, in this section, we are going to restate briefly the description of this system, and how we obtained the required data for the ML process. We conducted our measurements on jars issued by a food company that produces hazelnut–cocoa cream. The physical dimensions of each jar are as follows: 6.6 cm in diameter and 7.5 cm in height. Taking into consideration these dimensions, we performed our measurements in a frequency band between 9 and 11 GHz, with frequency of interest centered at 10 GHz. This frequency was chosen as a compromise between the penetration depth of the microwave and the resolution required to spot intrusions of millimeter size. The dielectric properties of the food inside the jars were measured using a probe operating at 10 GHz, resulting in relative dielectric constant equal to 2.86, and 0.21 S/m for the conductivity. For practical reasons, as a first assessment, the hazelnut–cocoa cream was substituted by safflower oil. The dielectric properties are equivalent in the whole frequency range here selected for both materials, and they were employed for practical purposes, as it is easier to handle and allows to evaluate the intrusion position more precisely. The foreign bodies employed in the assessment were partly provided by the company, consisting of 2-millimeter-radius spherical samples of different materials (soda–lime glass, PTFE nylon) commonly used to validate inspection devices. Further, we added some other materials and foreign bodies, which can be potentially present into an industrial environment, as glass or other types of plastic. The employed intrusions are shown in Figure 2 and numbered from 1 to 6, in addition to information about their most probable position inside the jars, as referred by red circles (a, b, c, d) in the same figure. Based on these data, we created seven jars samples, one free of any contamination materials, and the other six with the different types of contaminants. Accordingly, we tried to cover the whole volume to inspect, by placing the intrusions in different positions inside the jars, so as to provide a complete validation of the system.
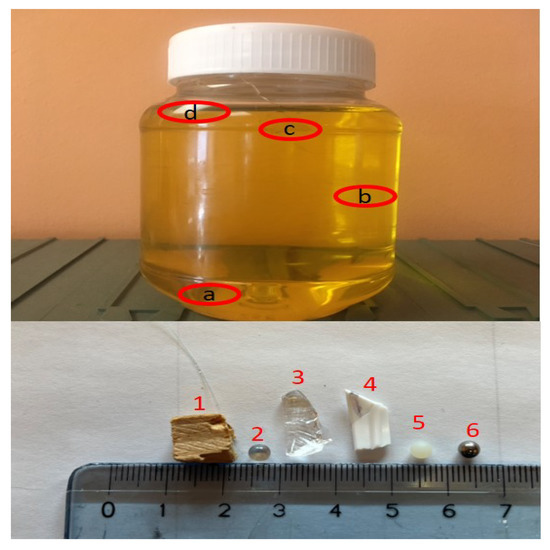
Figure 2.
Uncontaminated jar sample filled up with oil. The image includes different types of contaminants, numbered from 1 to 6, and the circles drawn on the jar (a, b, c, and d) refer to the most probable positions of the contaminants materials inside the jars.
The MW sensing system shown in Figure 3 is formed mainly of an array made up of six antennas fixed on an arch-shaped bearer that allows the jars to pass through it without any interruption. Using a method proposed in [12], also applied in the domain of biomedical applications [13] and in food safety [14], a precise numerical analysis of the singular value decomposition (SVD) of the discretized scattering operator is performed, so as to determine the number and the positions of the antennas, clearly considering also the physical constraints of an actual in-line implementation. This antenna array is connected to a 6-port vector network analyzer (VNA) to record the scattering matrices retrieved by the interaction of the radiating microwave with the jar sample. A photocell detecting the passage of the item triggers the start of the measurement when the object approaches the antenna array. The elements of the array radiate one after another in a sequence form. At each point when a single antenna radiates, we assume this antenna is working as a transmitter, while the other five antennas with the radiating one itself are the receivers. In this way, we obtained a scattering matrix (shown in the next section) of dimensions at each frequency point between 9 and 11 GHz with a step equal to 200 MHz.
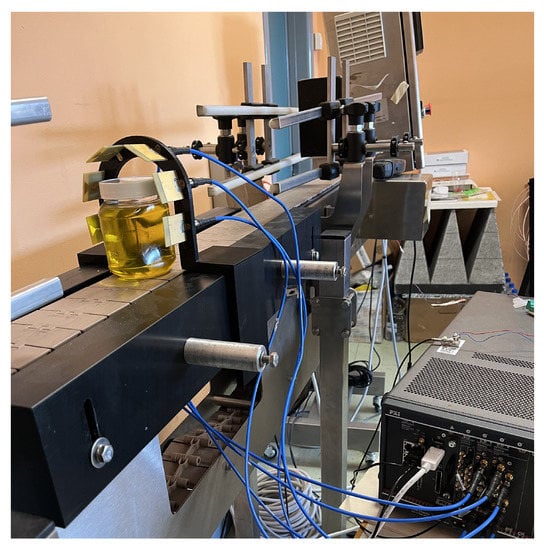
Figure 3.
Microwave sensing system.
3. Dataset Construction
A deep analysis of the measured data is presented in this section, with the aim of building up the dataset for the ML process.
The experimental measurement was conducted hundreds of times on the uncontaminated jar and tens of times on each contaminated jar, with a slight change in the position of these jars with respect to the elements of the imaging system, such as rotating the jar with a small angle each time the test was repeated. We obtained an output for about 1240 samples, these samples were split as follows: 600 samples for the uncontaminated and 640 for the contaminated cases. The output of each jar under test was a scattering matrix (shown below), consisting of 36 elements, that carries the information about the state of the jar at each frequency point, while i and j correspond to the receiving and transmitting antennas respectively, and is the response of the receiving antenna i due to the radiation of the transmitting antenna j. We excluded the reflection coefficients elements , i.e., the elements lie on the diagonal colored with red in the matrix below. The matrix formed of the remaining 30 elements converted into a one-column vector as clarified below. Sweeping the frequency from 9 to 11 GHz leaves us with a number of vectors equal to the number of the frequencies which is 11. By this and at each time a jar sample passes through the sensing system, we are going to have a huge matrix of dimension equal to consisting of 11 columns, and each column represents a matrix of rank = 30.
= ; =
In our work, we focus on two types of data used for the training phase, which are the Magnitude only (Amplitude only) and the complex nature datasets, as mentioned at the beginning. We neglected the dataset formed with both magnitude and phase, as we did not achieve good classification accuracy for such types of information; the same occurred and was mentioned in [9]. The matrices used in constructing the Magnitude only dataset are of dimensions equal to 330, and each matrix represents an output for a jar under test. For the training part, we are not going to have complete information for the sample under test because we neglected the phase values from the measurements data. On the other hand, using data with a complex nature should be more inclusive. However, it is not possible to work directly with complex numbers in ML without applying preprocessing to our measurements, and this will result in making the ML algorithm heavier. To avoid this, we chose to construct the complex nature dataset using the values of the real and the imaginary part of in a separated and consecutive form at each frequency, and in this way, we doubled the dimension of our matrices to become .
4. ML Tools
Before discussing the used ML tools, it is important to show why the usage of these tools is necessary in such applications. To answer this question, we should review what type of data we are working on; for this reason, we constructed two images from the magnitude of the retrieved S-parameters for different types of jars exposed to the microwave sensing system.
The images shown in Figure 4 are the plotting of the entire elements of matrices each of dimension , which is a set of information that carries the amplitude part only from the data measurements. The two images represent two jar samples under test, one is the uncontaminated sample, and the other represents the contaminated one. We can detect a variance in the values of the amplitude between the two cases at different frequencies, as indicated by the black circles drawn in Figure 4. The images contain relevant information, but because of the low resolution at the MW frequencies, it is not enough for us as humans to determine if the image referred to a contaminated or uncontaminated jar sample. In addition, there is uncertainty in the scattering matrices every time the process is repeated. The reason for this uncertainty is that the measurements are being performed in dynamic conditions, and the scattering behavior of the MW is impacted by four varying parameters. These parameters are as follows: the type, the size and the position of the intrusion inside the jar, and the fourth one is related to the movement of the jar sample on the conveyor belt with a constant velocity. Thus, the usage of ML algorithms to automate the classification process is necessary and is considered to be very powerful while working with such a dynamic state.
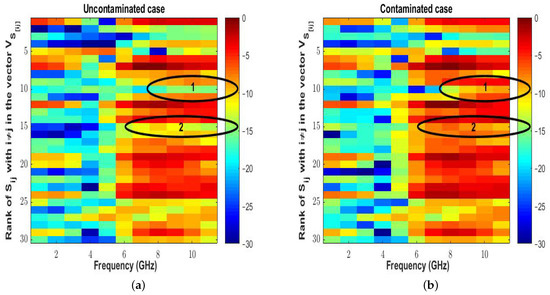
Figure 4.
Plotting of the amplitude of the retrieved S-parameters from two samples under test. (a) The uncontaminated jar sample; (b) the contaminated jar sample.
Principal Component Analysis (PCA) [15] allows us to plot the data shown in Figure 5 below. The figures show the distribution of our two constructed datasets on the three most significant eigenvectors. We indicate with the red circles the contaminated samples, while the green circles correspond to the uncontaminated samples. From the figures, it is clear that the data are overlapping and non-linearly separable for both datasets, and thus, choosing a non-linear ML model to separate the two classes is indisputable. Looking into references that include similar procedures to those in [5,7,9,10,16], they focused mainly on using two ML algorithms, which are the Non-linear Support Vector Machine (SVM) and the Multi-Layer Perceptron (MLP). The reason behind focusing on using those two algorithms is that they are considered powerful and efficient in dealing with non-linearly separable classification problems with small datasets. All the functions of SVM and MLP are built-in and implemented in Python, which is a programming language with open-source libraries for ML. In the next two subsections, we are going to note more on the strengths of these classifiers algorithms and state the theory behind how each algorithm operates.
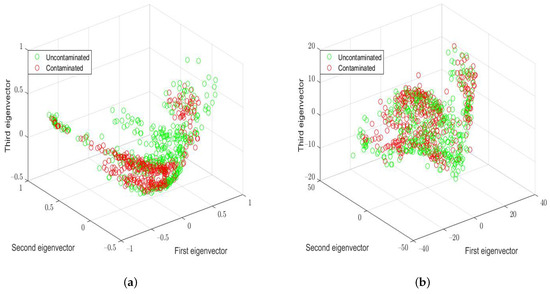
Figure 5.
Data distribution on the 3 most significant eigenvectors. (a) Complex nature dataset. (b) Amplitude only dataset.
4.1. SVM
The Support Vector Machine is a supervised binary classifier, it is considered to be one of the most robust and precise ML algorithms, especially when working on a small database, such as in our case. SVM is of two categories, the linear SVM which is preferable in simple configuration, i.e., when the data of the two classes are linearly separable, the other type is the non-linear SVM, which is suitable for working with non-linearly separable data. SVM in its both types works on finding the optimal hyperplane that can separate the between the two classes that are desired for classification. The performance of SVM is impacted by finding the hyperparameters; one of these hyperparameters is “C”, which is responsible for the adjustment of the margin that separates the two classes, and C should be determined whatever the type of the SVM.
As shown before in Figure 5, our datasets are non-linearly separable; it is clear then that we need to use the non-linear SVM in our application. The analysis of the theory of SVM in its two types can be found in references such as [17,18], however, in our case, we conducted the work in the same way as it is implemented and discussed in [10]. The non-linear SVM uses the trick of using the “Kernel” function to find the optimal hyperplane, it projects the data into a higher dimension, searching for the hyperplane that separates the data; however, using “Kernel” requires calculating other hyperparameters. In our work, we used the Radial Basis Function (RBF) Kernel function, and then another hyperparameter called Gamma “” should be determined. Gamma is a critical parameter that is required to compromise the values of the weight given to the samples based on its separating distance from the origin of the training dataset. The choice of C and is not straightforward; for this reason, we used Grey Wolf Optimizer (GWO) to search for the optimal values of the two parameters. The GWO is briefly described at the end of the ML tools section.
Unlike neural network algorithms, SVM is not preferable for use with datasets with high-complexity data. In our paper, we applied SVM on datasets with low-complexity data (e.g., relatively low number of features), and then we do not have limitations regarding the performance of SVM on such types of datasets.
4.2. MLP
The other ML algorithm that we tested in our work is the Multi-Layer Perceptron (MLP). MLP is an artificial fully connected multi-layer neural network [19] algorithm, it is powerful and effective in treating classification problems for both high and low-complexity databases. The map of MLP shown in Figure 6 below, and it is well known for most people working on ML tools. MLP is a supervised learning technique that starts from an input layer with a vector of input data to predict an output vector (1 or −1 for our case). In [19], we can find the theory explaining in detail how MLP works. In addition, we derived our work in a similar way to the approach followed in [9], but with the help of the GWO in calculating the optimal number of neurons ().
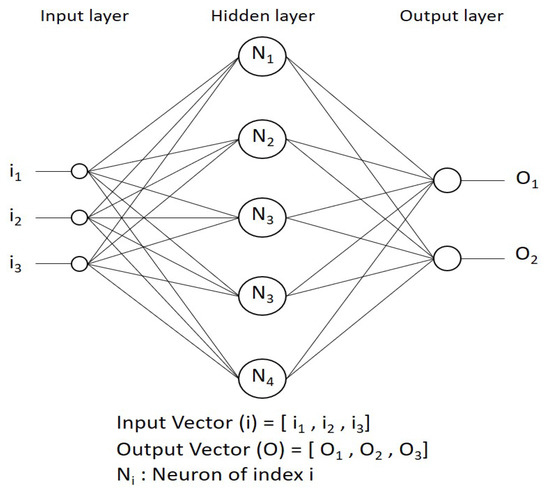
Figure 6.
A Multi-layer Perceptron map with connected layers.
In SVM, the difference between training the algorithm on the two different database was only in the values of the optimal hyperparameters C and , while this is not the case with implementing MLP. In MLP, it is necessary to search for a trade-off between the type of the activation function, the solver (optimizer), number of hidden layers, and the number of neurons in addition to many other parameters that are explained and discussed in [19] and used and mentioned in [9]. In our work, we used the Relu activation function for training the MLP on the Amplitude only dataset, but we used Logistic with the complex nature dataset. The same optimizer, lbfgs, was used with the two databases. The number of the hidden layers should be determined based on the complexity of our database, and since our datasets are not of high complexity, we started the training with one hidden layer.
5. Optimization Using Grey Wolf Optimizer (GWO)
The Grey Wolf Optimizer (GWO) mimics the leadership hierarchy and the hunting mechanism inspired from the behavior of the grey wolves in nature [20]. The algorithm was proposed and discussed in [20], and is used well in many applications such as optimizing the detection process of damaged fruits, as discussed in [16]. We used this optimizer algorithm to search for the optimal parameters needed in both ML algorithms (SVM and MLP) to reduce as much as possible the error on the validation set, and in this way, to have much better accuracy in classifying the samples of the test set. For the non-linear SVM, we aimed at determining the optimum hyperparameters pair ( and ), while we used it with MLP to estimate the optimal number of neuron () in the hidden layer. The values of all these parameters obtained from the optimization process will be presented in the results section with the validation results.
6. Results
The two developed datasets are divided into three parts—training, validation, and the test set. The training and the validation sets are also known as the development sets. As mentioned before, our dataset is formed of 1240 samples, it was split into 58–42% (720–520 samples), corresponding to the development and the test sets, respectively, as shown below in Table 1. It is important to have a balanced number of contaminated and uncontaminated samples in the training set. In addition, the overall contaminated class should be developed from an equal number of samples extracted from each contaminated class alone. Thus, we built our training dataset by choosing randomly 360 samples from the uncontaminated class and 60 samples from each contaminated class, as clarified below in Table 1. We labeled the training data as +1 and −1, referring to the uncontaminated cases and contaminated cases, respectively. Another partitioning should be applied in the development set itself; we chose it to be as follows: 90–10% (648–72 samples), referring to training and validation sets, respectively. It is mentioned in [9] that they have partitioned there datasets into 70–30% for there first split, and 75–25% for the second split. In our work, we tried to minimize the number of the samples for the development set as much as possible. The goal behind this is to check if we can still achieve good performance with less heavy datasets trained on MLP or on non-linear SVM, both with GWO. In addition, this will allow us to have a greater number of samples for the test phase.

Table 1.
Number of samples used from each class for training and test phases.
Our aim in this work is to compare the accuracy performance of two different ML algorithms trained on two different types of datasets, as clarified before. In addition to this, using GWO gave us the option to compare the results obtained from training the MLP algorithm on the complex nature dataset with the results obtained in [9]. Due to the strategy that we followed, we arrived at four groups of results. Before presenting these results, we should first define the confusion matrix shown in Table 2 below, which is a method of displaying the results when working with classification problems.

Table 2.
Confusion matrix.
The confusion matrix shown in Table 2 is defined as a summarizing report for a classification problem on ML. The elements of this matrix are as follows: TN is the true negative, TP presents the true positive classified samples, while FP and FN are referring for the error in the classification process and stands for false positive and false negative, respectively. False negative means that some of the uncontaminated samples are rejected, while false positive means that some of the contaminated jars are not spotted. In critical applications such as ours, any error in not detecting a contaminated food product could have a serious effect on the consumer. For this reason, the quality control in food industry prefers to obtain zero error for the FP term.
6.1. Results for Magnitude Only Dataset
Table 3 below shows the validation results for training the two different classifiers on the Amplitude only dataset, in addition to the values of the optimal parameters of each algorithm that was obtained after applying the GWO. The validation result is ideal (100%) with the non-linear SVM algorithm, while it is slightly lower with MLP (about 98.6%). This difference in the results between the two different algorithms is normal and it was predictable due to the difference in the mathematical method used by each algorithm in solving the classification problem. Moreover, it is important to mention that by repeating the training process with the MLP algorithm, the accuracy of the validation set varied between 98% and 100%, and this is also predictable, since every time MLP is launched, it starts with random values of weights connecting the layers [19], however, this is not the case with using SVM, which operates in more stable conditions especially after fixing the optimal parameters, therefore, it yields mostly the same results in each run. Another factor to be taken into consideration is the training time, which will show how long each algorithm takes to be trained and to validate the performance on the training dataset.

Table 3.
The optimum pair (C*, *) for non-Linear SVM and the optimal number of neurons (N*) for MLP. Training time, confusion matrices and accuracy obtained on the validation set for the two different ML algorithms trained with Magnitude only dataset.
We recorded the confusion matrices obtained for the test samples by launching the classifiers for 100 consecutive times. We plotted the results for each ML algorithm using three separated curves, the first and the second one are for the well-classified and the misclassified samples of testing all the contaminated samples together in one class with the uncontaminated ones (Figure 7 and Figure 8), however, the third curve shows the misclassified samples in each contaminated class in a separate form (Figure 9 and Figure 10). Additionally, we calculated the average performance accuracy of the six contaminated classes, and we highlighted the most critical case faced in each classifier. In the testing process, we faced some critical cases, e.g., samples that include small intrusions and are made up of materials with dielectric properties which as somehow similar to the permittivity of the background of the medium (oil in our case) and had sunken to the bottoms of the jars.
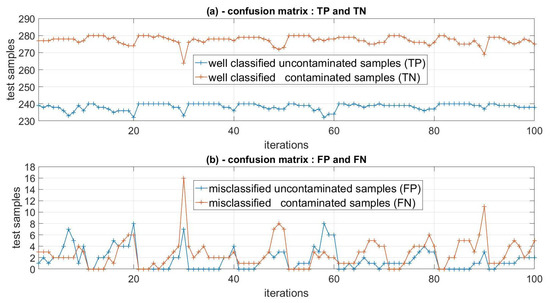
Figure 7.
Confusion matrices obtained by the non-linear SVM classifier trained on Magnitude only dataset. Curve (a) shows the plot of the well-classified terms TP and TN, while curve (b) is the plot of the misclassified terms FP and FN.
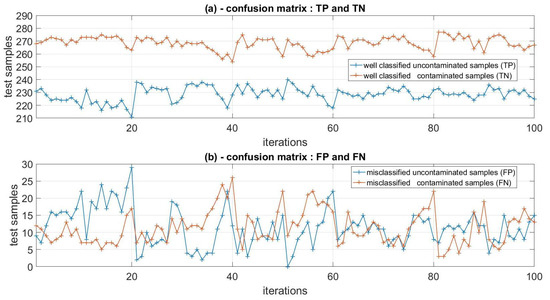
Figure 8.
Confusion matrices obtained by the MLP classifier trained on Magnitude only dataset. Curve (a) shows the plot of the well classified terms TP and TN, while curve (b) is the plot of the misclassified terms FP and FN.
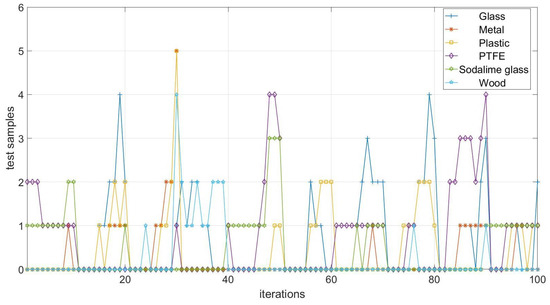
Figure 9.
The plot of the misclassified terms FP and FN of the confusion matrices for each contaminated class alone. The results obtained by the non-linear SVM algorithm trained on the Magnitude only dataset.
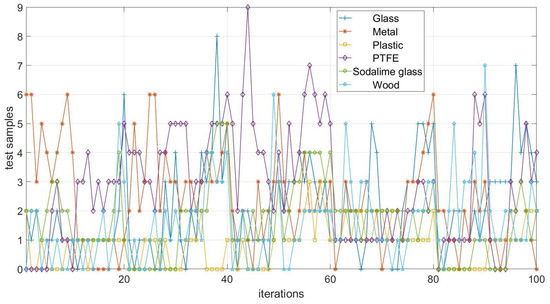
Figure 10.
The plot of the misclassified terms FP and FN of the confusion matrices for each contaminated class alone. The results obtained by the MLP algorithm trained on the Magnitude only dataset.
The classification results are very good and acceptable on average for both ML algorithms, with a significant lead in the performance of the non-linear SVM classifier that clearly manifested in the confusion matrices curves Figure 7, Figure 8, Figure 9 and Figure 10 and in Table 4. The accuracy of the the overall performance of the two algorithms calculated to be as follows, 95.6% for MLP and 99.2% for the non-linear SVM. Neural network algorithms (such as MLP) are known for their power with datasets with high-complexity data. However, our application is more adequate to treat using SVM, which is preferable to be used in the case of datasets with low-complexity non-linear data. For this reason, it is predictable to obtain better accuracy by applying SVM.

Table 4.
The average performance accuracy of the two classifiers with the Magnitude only dataset.
As seen in Table 4, the highest error rate in the classification results was recorded for the jars contaminated with PTFE materials, which is a small sphere of 2 mm in diameter that had sunken in the bottom of the jar. To reduce the classification error for all classes and in particular for the critical case, we used the complex nature dataset that includes the entire information about the samples under test. We expect that using both the real and the imaginary parts in constructing the dataset would give us better results.
6.2. Results for the Complex Dataset
Working with a complex nature database instead of the Amplitude only dataset should enhance the performance of the classifiers, since more data are inserted for training. In the same manner in which we introduced the results of the Magnitude only dataset, we are going to present the validation and the test results. Table 5 below shows the GWO results, the validation results, and the time required for each algorithm to be trained on the new dataset.

Table 5.
The optimum pair (C*,*) for non-linear SVM and the optimal number of neurons () for MLP. Training time, confusion matrices, and accuracy obtained on the validation set for the two different ML algorithms trained with the Complex nature dataset.
The validation results for both algorithms are perfect with zero error. However, the difference is clear in the training time, and again, MLP required more time to be trained on the new dataset. The classification results on the test dataset are presented in the curves below Figure 11, Figure 12, Figure 13 and Figure 14, showing the well-classified and the misclassified samples in the same way that was employed for the magnitude only dataset, and Table 6 shows the average accuracy performance for all the contaminated classes and for the uncontaminated one.
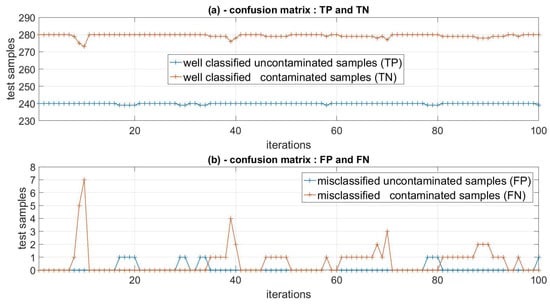
Figure 11.
Confusion matrices obtained by the non-linear SVM classifier trained on the Complex nature dataset. Curve (a) shows the plot of the well-classified terms TP and TN, while curve (b) is the plot of the misclassified terms FP and FN.
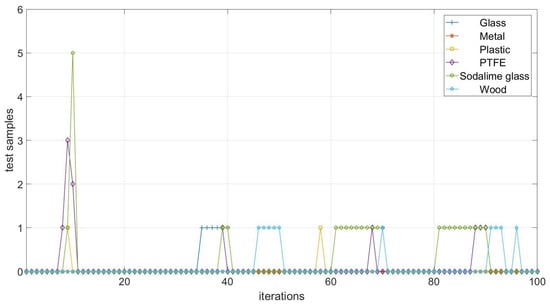
Figure 12.
The plot of the misclassified terms FP and FN of the confusion matrices for each contaminated class alone. The results obtained by the non-linear SVM algorithm trained on the Complex nature dataset.
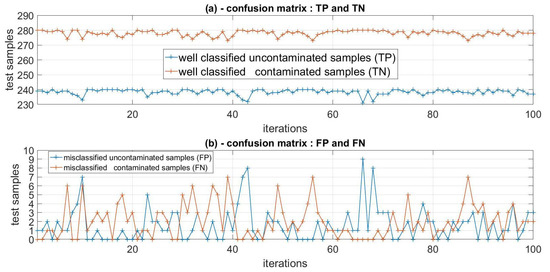
Figure 13.
Confusion matrices obtained by the MLP classifier trained on the Complex nature dataset. Curve (a) shows the plot of the well-classified terms TP and TN, while curve (b) is the plot of the misclassified terms FP and FN.
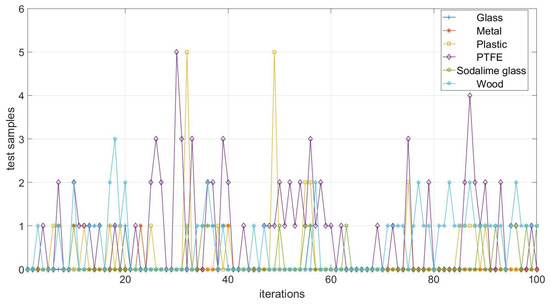
Figure 14.
The plot of the misclassified terms FP and FN of the confusion matrices for each contaminated class alone. The results were obtained by the MLP algorithm trained on the Complex nature dataset.

Table 6.
The average performance accuracy of the two classifiers with the Complex nature dataset.
The new training approach gave us better classification results, and the performance of the MLP algorithm was enhanced in a significant way and reached 99.3%. On the other hand, the performance of the non-linear SVM is perfect with this type of information in the dataset, the average accuracy of classification by the non-linear SVM reached 99.8%. The results approached 100% for most of the tested classes, and 99.3% for the critical case. It is obvious that the performance of the non-linear SVM is better on both types of datasets. The preference is not only for the classification results, but also for the training time consumed and for the stability of the obtained results every time we repeat the test phase.
At the end of the section in which we presented and discussed our results, we need to compare these results to what was published in [9]. Table 7 below summarizes the conditions and the results of our work compared to what was published in [9].

Table 7.
The table summarizes the conditions under which we obtained the results in our paper compared to what was followed in [9].
In Table 7, we presented the performance accuracy of the classifiers on the test datasets under different conditions. The usage of the GWO with MLP aimed to estimate the optimal number of neurons in a short amount time (about 50 sec). This can be performed manually in much more time, as in the procedure in [9]. One condition that is important for the accuracy is the number of samples in the training and the test datasets; in our work, we tried to reduce the number of samples in the training dataset, so that we could have more samples to test. As shown in Table 7, the dataset was split in our work into 58–42% (training–test); however, in [9], the split was 70–30% (training–test). This difference resulted in an insignificant change (about 0.05%) in accuracy, and this is predictable, since as the number of the test samples increases, the error increases.
7. Conclusions
The results of this study demonstrate the power and the robustness of using ML algorithms with an MW sensing system in food industry applications. We built on the work that was started in [9] by using another classifier (non-linear SVM) and by inserting the optimization method (GWO) to enhance the performance of the algorithms. The workflow in this paper started from the experimental measurements using a MW system and ended by classifying the jars samples into contaminated or uncontaminated products. Finally, we managed to obtain results that are supposed to be accepted by companies that are active in the food industry. Although the results we obtained from our work are good and effective in solving this special issue, we expect that this methodology can also be a good choice in many other industrial and medical applications.
Author Contributions
Conceptualization, A.D., C.M., F.V., F.Z., M.R., J.L., J.A.T.V. and M.R.C.; methodology, A.D., C.M., F.V., F.Z., M.R., J.L., J.A.T.V. and M.R.C.; software, A.D., F.Z. and M.R.; validation, A.D.; formal analysis, C.M. and F.V.; investigation, A.D., F.Z. and M.R.; resources, C.M. and J.L.; data curation, A.D. and M.R.; writing—original draft preparation, A.D.; writing—review and editing, A.D., C.M., F.V., F.Z., M.R., J.L., J.A.T.V. and M.R.C.; visualization, A.D., F.Z. and M.R.; supervision, C.M. and F.V.; project administration, C.M. and F.V.; funding acquisition, C.M. and F.V. All authors have read and agreed to the published version of the manuscript.
Funding
Franco Italian University (UFI), Programme Vinci 2021-Ref C3-1978.
Acknowledgments
We would like to acknowledge Julien Marot from Aix Marseille University, Fresnel Institute for his help on the GWO algorithm.
Conflicts of Interest
The funders had no role in the design of the study; in the collection, analyses, or interpretation of data; in the writing of the manuscript; or in the decision to publish the results.
Abbreviations
The following abbreviations are used in this manuscript:
| MW | Microwave |
| SVM | Support vector Machine |
| MLP | Multilayer perceptron |
| VNA | Vector Network Analyzer |
| EM | Electromagnetic |
| ML | Machine learning |
| mmW | millimeter wave |
| SVD | Singular value decomposition |
| GWO | Grey Wolf Optimizer |
| PCA | Principal Component Analysis |
| RBF | Radial Basis Function |
| Relu | Rectified linear Activation Unit |
| Lbfgs | limited-memory Royden-Fletcher-Goldfarb-Shanno |
| PTFE | Polytetrafluoroethylene |
| TN | True negative |
| TP | True Positive |
| FN | False negative |
| FP | False positive |
References
- Lau, O.W.; Wong, S.K. Contamination in food from packaging material. J. Chromatogr. A 2000, 882, 255–270. [Google Scholar] [CrossRef]
- Haff, R.P.; Toyofuku, N. X-ray detection of defects and contaminants in the food industry. Sens. Instrum. Food Qual. Saf. 2008, 2, 262–273. [Google Scholar] [CrossRef]
- Guyer, D.; Yang, X. Use of genetic artificial neural networks and spectral imaging for defect detection on cherries. Comput. Electron. Agric. 2000, 29, 179–197. [Google Scholar] [CrossRef]
- Oliveri, G.; Rocca, P.; Massa, A. Svm for electromagnetics: Stateof- art, potentialities, and trends. In Proceedings of the 2012 IEEE International Symposium on Antennas and Propagation, Chicago, IL, USA, 8–14 July 2012. [Google Scholar]
- Zidane, F.; Lanteri, J.; Brochier, L.; Joachimowicz, N.; Roussel, H.; Migliaccio, C. Damaged Apple Sorting with mmWave Imaging and Non-Linear Support Vector Machine. IEEE Trans. Antennas Propag. 2020, 68, 8062–8071. [Google Scholar] [CrossRef]
- Kim, Y.; Ha, S.; Kwon, J. Human Detection Using Doppler Radar Based on Physical Characteristics of Targets. IEEE Geosci. Remote. Sens. Lett. 2015, 12, 289–293. [Google Scholar]
- Zidane, F.; Coli, V.L.; Lanteri, J.; Binder, D.; Marot, J.; Migliaccio, C. Artificial Intelligence-Based Low-Terahertz Imaging for Archaeological Shards’ Classification. IEEE Trans. Antennas Propag. 2022, 70, 6300–6312. [Google Scholar] [CrossRef]
- Milovanović, B.; Marković, V.; Marinković, Z.; Stanković, Z. Some Applications of Neural Networks in Microwave Modeling. J. Autom. Control. 2003, 13, 39–46. [Google Scholar] [CrossRef]
- Ricci, M.; Štitić, B.; Urbinati, L.; Guglielmo, G.D.; Vasquez, J.A.T.; Carloni, L.P.; Vipiana, F.; Casu, M.R. Machine-Learning-Based Microwave Sensing: A Case Study for the Food Industry. IEEE J. Emerg. Sel. Top. Circuits Syst. 2021, 11, 503–514. [Google Scholar] [CrossRef]
- Zidane, F.; Lanteri, J.; Brochier, L.; Marot, J.; Migliaccio, C. Fruit Sorting with Amplitude-only Measurements. In Proceedings of the 18th European Radar Conference (EuRAD), London, UK, 10–15 October 2021. [Google Scholar]
- Ricci, M.; Vasquez, J.A.T.; Scapaticci, R.; Crocco, L.; Vipiana, F. Multi-Antenna System for In-Line Food Imaging at Microwave Frequencies. IEEE Trans. Antennas Propag. 2022, 70, 7094–7105. [Google Scholar] [CrossRef]
- Scapaticci, R.; Tobon, J.; Bellizzi, G.; Vipiana, F.; Crocco, L. Design and numerical characterization of a low-complexity microwave device for brain stroke monitoring. IEEE Trans. Antennas Propag. 2018, 66, 7328–7338. [Google Scholar] [CrossRef]
- Vasquez, A.J.T.; Scapaticci, R.; Turvani, G.; Bellizzi, G.; Joachimowicz, N.; Duchêne, B.; Tedeschi, E.; Casu, M.R.; Crocco, L.; Vipiana, F. Design and experimental assessment of a 2D microwave imaging system for brain stroke monitoring. Int. J. Antennas Propag. 2019, 2019, 8065036. [Google Scholar]
- Vasquez, J.A.T.; Scapaticci, R.; Turvani, G.; Ricci, M.; Farina, L.; Litman, A.; Casu, M.R.; Crocco, L.; Vipiana, F. Noninvasive inline food inspection via microwave imaging technology: An application example in the food industry. IEEE Antennas Propag. 2020, 62, 18–32. [Google Scholar] [CrossRef]
- Jolliffe, I. Principal component analysis. Encycl. Stat. Behav. Sci. 2005. [Google Scholar] [CrossRef]
- Zidane, F.; Lanteri, J.; Migliaccio, C.; Marot, J. System measurement optimized for damages detection in fruit. In Proceedings of the IEEE Conference on Antenna Measurements & Applications (CAMA), Antibes Juan-les-Pins, France, 15–17 November 2021. [Google Scholar]
- Scholkopf, B.; Smola, A.J. Learning with Kernels: Support Vector Machines, Regularization, Optimization, and Beyond; MIT Press: Cambridge, MA, USA, 2001. [Google Scholar]
- Amari, S.i.; Wu, S. Improving support vector machine classifiers by modifying kernel functions. Neural Netw. 1999, 12, 783–789. [Google Scholar] [CrossRef]
- Gardner, M.W.; Dorling, S.R. Artificial Neural Networks (The Multilayer Perceptron)—A Review of Applications in the Atmospheric Sciences. Atmos. Environ. 1998, 32, 2627–2636. [Google Scholar] [CrossRef]
- Mirjalili, S.; Mirjalili, S.M.; Lewis, A. Grey wolf optimizer. Adv. Eng. Softw. 2014, 69, 46–61. [Google Scholar] [CrossRef]
Publisher’s Note: MDPI stays neutral with regard to jurisdictional claims in published maps and institutional affiliations. |
© 2022 by the authors. Licensee MDPI, Basel, Switzerland. This article is an open access article distributed under the terms and conditions of the Creative Commons Attribution (CC BY) license (https://creativecommons.org/licenses/by/4.0/).