Abstract
COPD is a progressive disease that may lead to death if not diagnosed and treated at an early stage. The examination of vital signs such as respiration rate is a promising approach for the detection of COPD. However, simultaneous consideration of the demographic and medical characteristics of patients is very important for better results. The objective of this research is to investigate the capability of UWB radar as a non-invasive approach to discriminate COPD patients from healthy subjects. The non-invasive approach is beneficial in pandemics such as the ongoing COVID-19 pandemic, where a safe distance between people needs to be maintained. The raw data are collected in a real environment (a hospital) non-invasively from a distance of 1.5 m. Respiration data are then extracted from the collected raw data using signal processing techniques. It was observed that the respiration rate of COPD patients alone is not enough for COPD patient detection. However, incorporating additional features such as age, gender, and smoking history with the respiration rate lead to robust performance. Different machine-learning classifiers, including Naïve Bayes, support vector machine, random forest, k nearest neighbor (KNN), Adaboost, and two deep-learning models—a convolutional neural network and a long short-term memory (LSTM) network—were utilized for COPD detection. Experimental results indicate that LSTM outperforms all employed models and obtained 93% accuracy. Performance comparison with existing studies corroborates the superior performance of the proposed approach.
1. Introduction
Chronic obstructive pulmonary disease (COPD) is a progressive life-threatening pulmonary disease that causes breathlessness and leads to death if not diagnosed and treated at early stages. COPD is ranked as the third leading cause of death in the world, with an extremely high global mortality rate [1,2,3]. COPD is not treatable, but can be managed with adequate treatment during the early stages [3,4]. Approximately 3.17 million people have lost their lives to it, as per the World Health Organization (WHO) [3,4]. COPD impacts breathing function and reduces the breathing capacity of the lungs, leading to respiration problems. Chronic bronchitis and emphysema are elements of COPD [5]. Chronic bronchitis is a chronic inflammatory bronchial condition characterized by excessive coughing and mucus production in the respiratory tract. Emphysema is a chronic systemic pulmonary condition in which tissues supporting the function of the lungs are damaged. Cough, shortness of breath, and wheezing are common symptoms of COPD. Symptoms of very severe COPD include weight loss, coronary heart disease, obesity, anorexia, cognitive dysfunction, and lung cancer [6]. Airbags and airways are elastic by nature, and the lungs have stretching capacities. While breathing, the lungs expand and contract during air passage. This elasticity is gradually depreciated in people with COPD, airways are obstructed, and mucus production in the lungs increases [7,8].
Diagnosis of COPD is based on the patient’s symptoms and signs, history of exposure to pulmonary irritants (such as smoking), and family history. A thorough physical examination is performed by a clinician to diagnose COPD. A doctor can employ normal methods such as a stethoscope to listen to a patient’s heart and lung sounds, subsequently prescribing more of these tests, including spirometry, blood gas test, chest X-ray, or a computed tomography (CT) scan, and genetic tests. The spirometry examination plays an important part in the diagnosis and treatment of COPD [9]. The interpretation of spirometry is not limited to the determination of physiological patterns, but also pretest procedures and test accuracies. The patient must inhale to full lung capacity and, with the utmost effort, blow air out of the lungs as quickly as possible. No air from the chest must be obstructed by the laryngeal arrangement of the tongue [10]. Until the volume of the lung is close to the residual volume, this operation must be maintained by the patient. Forced exhalation must last for at least 6 s in adults and 3 s in infants [11]. Several values extracted from equivalent non-smoking, disease-free subjects are used to generate the comparison equation and are compared to recorded values. If the information collected from normal subjects is normally distributed, the results are displayed along the bell curve [10]. The quality of spirometry raised questions about its efficiency [12,13]. The primary reasons for low-quality spirometry results are improperly trained staff and inadequate testing. Testing personnel must be professionally qualified [13,14].
The amount of oxygen and carbon dioxide in the patient’s blood can be measured via an arterial blood gas examination. This is an indication of how well the lungs are performing. It also shows how severe the patient’s COPD is and whether oxygen treatment may be required. Some individuals have no issues with blood checks. A CT scan is a type of X-ray that produces a very high-resolution image. An illustration of the structures within the chest, including the heart, lungs, and blood vessels, can be provided by any form of X-ray that doctor chooses. In the case of a CT scan, the radiation used is greater than that needed for a normal X-ray scan. While radiation doses are comparatively low for each test, they result in a cumulative build-up of the radiation exposure a human should experience in a lifetime, marginally raising their cancer risk [15]. Analysis of the sputum can help identify the cause of difficulties in breathing and can help detect certain lung cancers. It can also be detected and treated when the patient has a bacterial infection [15].
Recently, the importance of continuous vital sign monitoring technology has been recognized for different medical purposes. Heart rate, breathing and pulse rate, etc. have been regarded as vital signs. Respiration monitoring is an important sign when it comes to the diagnosis of pulmonary disease. The rate of breathing is typically defined as the time of breathing (in breaths per minute, or bpm) observed in a minute. Although respiration rate is a clinically strong predictor of serious events, the calculation of respiration rate is still usually performed manually by counting breaths, which provides unreliable results [16].
Ultra-wide band (UWB) radar is an emerging technology, initially used in the 1970s by the US army and advertised in the late 1990s by Time Domain and Xtreme Spectrum companies [17,18]. The US federal communication commission (FCC) reserved UWB signals with a bandwidth of 7.5 GHz [17]. A frequency of 3.1–10.6 GHz is covered by this bandwidth, and a signal is called UWB if it has a bandwidth of more than 500 MHz [17]. UWB signals have high data rates and low levels of transferring power. Due to the exceptionally low power spectral density (PSD) of UWB transmissions, narrowband technology and UWB systems can coexist in the same spectrum without experiencing undue interference [19]. UWB is more resistant to multipath propagation and has less path loss [20]. Due to its non-intrusive, non-tackling capabilities and its ability to penetrate various materials or obstacles, IR-UWB radar has advantages over other tools [21,22]. Various experiments have been carried out on wireless sensing systems based on UWB to identify vital signs for healthcare applications [22,23,24].
UWB is a technology with unique characteristics because of its incredibly wide bandwidth. The transmission and reception of sub-nanosecond pulses without carriers or modulated short pulses with carriers are usually based on UWB wireless systems [25]. Such wireless systems claim to provide low system complexity, low cost, low use of energy, and high data rates [20,26]. For biomedical applications, UWB coexists well with other instruments because it radiates and absorbs little electricity. IR is a UWB signaling type that uses short pulses of the baseband, usually in the order of nanoseconds, and has been proposed in applications for health, such as those introduced in [27]. Breathing and heart rate calculated by UWB were studied in [28]. The microwave Doppler radar is a suitable option for non-invasive monitoring of vital signs [29].
The research presented in this manuscript uses a respiration rate acquired non-invasively from a safe distance without physical contact using IR-UWB radar for the classification of COPD and healthy subjects. This non-invasive method is especially useful in pandemics such as COVID-19, when a safe distance must be maintained. This study uses the IR-UWB radar for COPD detection and makes the following contributions.
- A dataset of COPD patients was collected from hospitalized patients in Sheikh Zayed medical college and hospital (SZMC&H), Rahim Yar Khan, Pakistan under the supervision of a pulmonologist. The dataset was maintained with important attributes related to COPD, including respiration rate, age, gender, and smoking history for healthy subjects and COPD patients.
- The dataset was collected using a non-invasive IR UWB radar following the safe distance protocol defined for COVID-19, and is the first of its kind.
- COPD detection was carried out using several experiments with both machine-learning and deep-learning models, such as support vector machine (SVM), random forest (RF), k nearest neighbor (KNN), Naive Bayes (NB), AdaBoost (ADA), long short term memory (LSTM), and convolutional neural network (CNN) models.
- Experiments were performed to analyze the validity of the IR UWB radar usage for COPD detection and results were analyzed for models’ accuracy. In addition, results compared with state-of-the-art models.
2. Literature Review
Many research works present different methods for detecting COPD in patients. For example, ref. [30] investigated the efficacy of electrocardiography (ECG)-derived respiration (EDR) to distinguish between COPD patients and healthy people. ECG and respiratory signals of 30 were gathered using the MP45 Biopac device. For each subject, three statistical features—area, time, and skewness ratio—were derived after analyzing the morphological pattern changes in the respiration and EDR signals. To determine how closely the original respiration and the EDR signal resembled one another, error calculation and statistical analysis were conducted. Different classifiers were used for classification, including decision tree (DT), linear discriminant analysis (LDA), SVM, and KNN. Both DT and KNN showed accuracies of 98.33% for respiration and EDR-derived features simultaneously.
A model was presented in [31] to compute forced vital capacity (FVC) and forced expiratory volume (FEV) of human exhalation collected by a mobile microphone. The data were analyzed using regression, and the quadratic regression approach was chosen. The suggested model was evaluated on 25 people, including 10 COPD patients, 5 smokers, and 10 healthy people. The results demonstrated that the proposed models’ FVC, FEV1, and FEV1/FVC values are comparable to those obtained using a clinical spirometer with an accuracy of 96%.
The study [32] used a deep-learning-based risk stratification method for automated COPD identification using the respiration rate. Different feature combinations were used to classify COPD and non-COPD using logistic regression (LR), DT, LDA, KNN, SVM, and quadratic discriminant classifiers. The classification was based on spirometry measurements as well as respiratory sound parameters. The SVM classifier achieved a maximum classification accuracy of 83.6% when employing the most significant lung sound parameters, namely median frequency and linear predictive parameters. Further, SVM and LR achieved 100% accuracy when using median frequency, linear predictive coefficient, and spirometry data. A cross-sectional study of 294 people was carried out to discriminate between COPD caused by smoking (COPD-S), COPD caused by household air pollution (COPD-HAP), and normal patients by [33]. SVM, canonical discriminant analysis (CDA), and principal component analysis (PCA) were used for classification. The results showed that the breath print of COPD patients differs from that of healthy subjects, explaining a 93.8% variability with a correct prediction of 97.8% and correct classification of 100%, as well as positive and negative predictive values of 96.5% and 100%, respectively.
The authors presented an IoT-based respiratory monitoring system for COPD detection in [34]. The study used only the rate of respiration estimated using the Fast Fourier transform (FFT). The rate of respiration was shown on a smartphone and also transmitted to a hospital through an internet connection. Findings showed that PPG signals perform better at estimating the respiration rate that is to be used to detect COPD.
Heart rate variability (HRV) spectrum analysis was employed in [35] with and without the impact of respiratory signals in healthy and COPD participants. The Welch Periodogram technique was used for signal spectrum analysis. There was no difference in HRV spectral analysis between COPD and stable participants with and without the respiration effect. The results demonstrated that low-frequency respiration rates increased the low frequency and reduced high-frequency spectrum analysis, indicating an inaccuracy in HRV analysis. The possibility of detecting the difference between COPD and normal tidal breathing with a structured light plethysmograph (SLP) was investigated by [36]. The study presented ten SLP-measured parameters that vary between COPD and healthy people. The findings suggest that COPD and healthy people vary in their breathing patterns, as measured by SLP.
WheezeD is a computer model developed by Chatterjee et al. to detect wheezing from audio recordings of respiration [37]. The model first used an algorithm to recognize respiratory phases (inhalation and exhalation) from one-dimensional acoustic data. The audio was converted into a 2D Spectro-temporal image using a convolutional neural network (CNN)-based wheeze detection algorithm in the second stage. Audio data of respiration were gathered from the R.A.L.E repository (a repository that contains respiration sounds) [38], with Google repository [7] as a positive class, and audio recording with Samsung gear S3 smartwatch (16 kHz) used as negative class. A respiratory phases (inhalation and exhalation) detection algorithm [39] was applied to detect inhalation and exhalation of each respiratory cycle. The sampling rate normalization algorithm [40] was applied to the spectrogram images of sound data used as the primary input. Subsequently, the image was segmented with short-time Fourier transformation (STFT). An accuracy of 96.99% was achieved by CNN for detecting Wheezing from audio data.
The study [41] investigated the difference in respiration resistance (Rrs) between mild and moderate COPD patients during tidal breathing in the inhalation and exhalation phases. Results revealed that Rrs varied dynamically in COPD patients during tidal breathing. Similarly, the mean Rrs value was substantially higher in moderate COPD than in mild COPD, and in the respiratory cycle, moderate COPD had higher maximal and minimum Rrs at high frequency than mild COPD. Results also showed that in an inhalation–exhalation study, moderate COPD patients had higher maximal and minimum Rrs at 20 to 35 Hz. The work [42] presented an ECG and ECG-derived respiration (EDR)-based method for identifying unobtrusive and restrictive respiratory disease. Biopac system MP45 was used to gather ECG signals. Each subject’s ECG was captured for 300 s at a sampling rate of 1000 Hz. To derive distinguishing features, temporal information was taken from the morphological variations seen in both ECG and EDR signals. The participants were then classified into normal, obstructive, and restrictive groups using various supervised classifiers. On 90 subjects (both healthy and ill), the classifier’s performance was evaluated and the SVM shows classification accuracy of more than 98%.
Using a variety of respiratory rate estimation approaches, several studies classified COPD patients and healthy subjects. The sensors employed by the studies estimated respiration per minute (RPM) invasively, and thus inherited all the limitations associated with on-body sensors such as privacy and safety concerns, frequent components’ replacement, need for a qualified technician, etc. Meanwhile, the proposed approach exploits UWB radar for the estimation of respiration rate at safe distance without any physical contact with the patient and with minimum human intervention. In addition, the data can be collected without the need for a resident medical expert.
3. Methodology
3.1. Preliminary Procedure
Data collection was performed on real patients in SZMC&H, Rahim yar khan, Pakistan. A demo of non-invasive respiration detection using the IR-UWB radar was given to the participants, and consent forms were signed by each participant.
3.2. Proposed Methodology
The schematic methodology diagram is shown in Figure 1. The approach is divided into three major steps. The raw radar data collection is performed in the first step. This is followed by data cleaning and preparation while RPM extraction is in step 2. Finally, machine-learning classifiers are devised for the classification of subjects into COPD and healthy subjects in step 3.
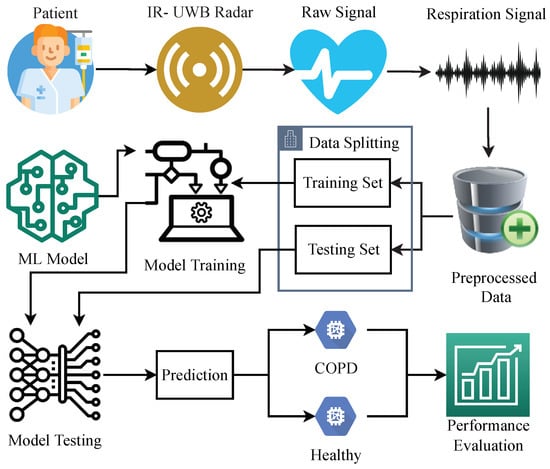
Figure 1.
Architecture of the proposed methodology.
The first step in the proposed methodology is to obtain data from both patients and healthy subjects regarding COPD. For this purpose, IR-UWB radar is used, which is immune to dust, smoke, wetness, and darkness. It is non-intrusive and is highly advantageous when data gathering in a non-contact fashion is needed. The UWB radar provides raw signals from the subjects, which are later preprocessed using signal processing approaches to acquire respiration signals. Respiration signals are stored in the databases for healthy and COPD subjects. For model training and testing, the dataset is divided into training and testing sets, respectively. Trained models are tested on the unseen data of COPD and healthy subjects, and the performance is evaluated using accuracy, precision, recall, and F1 score.
3.3. Data Collection
This work employs an X4m300 IR-UWB radar, as shown in Figure 2, to collect physiological data. It comes with an adjustable frame size, a detection time of 1.5 to 3.5 s, and a detection zone of up to 9.4 m [43,44]. The X4 chip architecture (SoC) powers the UWB radar, which is highly sensitive. It has integrated antennas that offer unlicensed core frequencies of 7.29 GHz or 8.748 GHz and 1.4/1.5 GHz (-10 dB) bandwidth [45]. It is powered by a highly sensitive XeThru X4 UWB chip that detects minimal motion and has the highest signal-to-noise ratio. It has an ARM Cortex-M7 MCU signal processing algorithm. It has a very high resolution rate due to nanosecond pulse transmission [46]. Additionally, the technology is immune to environmental issues such as dust, smoke, dampness, and darkness, and operates reliably in non-clinical, difficult, and remote situations. When the board’s default configurations are used, the integrated firmware yields a 9.4 m-long baseband signal that starts at 0.18 cm. This distance is split into 181 bins, with bin lengths of 0.0514 cm. The effective range for this radar is between 0.2 m and 1.6 m.
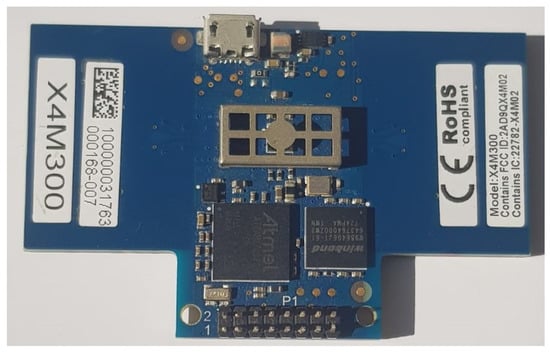
Figure 2.
X4m300 UWB radar.
The inhalation process supplies oxygen to the lungs, expanding the chest and reducing the distance between the radar and the chest, whereas the expiration process has the opposite effect. Figure 3 shows this behavior by increasing (inhaling) and decreasing (exhaling) the amplitude at a certain distance corresponding to the target position relative to the radar. The area under the curve seen in Figure 3 is calculated as performed in previous studies [47,48] to determine the number of chest expansions and contractions caused by breathing. This behavior is shown in Figure 3 by the raising (inhaling) and lowering (exhaling) of the amplitude at a certain distance corresponding to the target location (subject) location relative to the radar. The area under the curve shown in Figure 3 is retrieved to count the number of chest expansions and contractions caused by breathing.
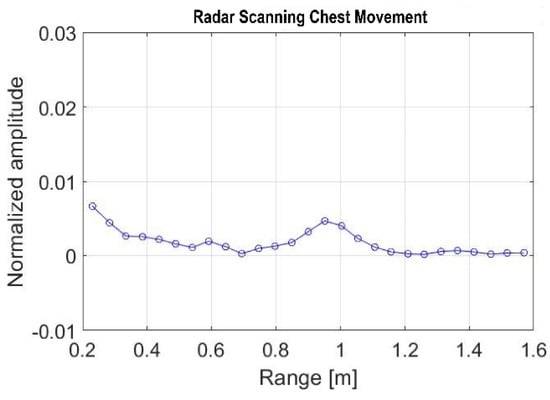
Figure 3.
Radar signal during chest scanning.
A test bed was set up in the consultation room at the outpatient department (OPD) of the pulmonology ward of SZMC&H. Seventy subjects between the ages of thirty-five and seventy years participated in this process. The subjects were then classified into two groups: thirty-five COPD patients that have received a clinical diagnosis from the hospital, and the other thirty-five subjects who were healthy subjects with no clinical diagnosis of respiratory disease. An ethical approval statement was designed according to the guidelines of the Helsinki Declaration and approved by the Khwaja Fareed University of Engineering and Information Technology (KFUEIT) ethical committee, with a consent form signed by each subject. Participants were instructed to sit comfortably facing the UWB radar, as shown in Figure 4. Demographic data of the subjects, such as age, whether they were a smoker/non-smoker, and gender were gathered before recording the chest movement. The chest movement of each subject was recorded for five minutes. The recorded chest movement was saved in comma-separated files (CSV) in separate directories (COPD/Healthy). The resulting CSV files comprise 27 columns and 6000 frames (20 rows per second). The column represents the distance of radar from participants.
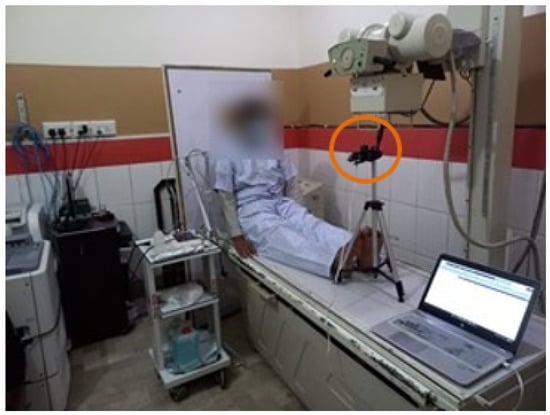
Figure 4.
Data collection with the subject sitting in front of the radar.
3.4. Data Cleansing and Preparation
Respiration, pulse, and noise, including heartbeat, belly movement, eye blinking, eyeball movement, and other ambient movements, are all included in the data obtained for area values under the curve, as the radar system has a viewing field greater than the chest area alone. The technique only requires the breathing patterns for which respiration signals are derived from the collected data. The person is asked to sit in a normal posture and breathe regularly, and the radar obtains data regarding heart rate, respiration, eyebrow movement, eye movement, and limb movement. Since these movements lie in different frequency ranges, the respiration rate can be viewed using Fourier transform and the target signal can be extracted.
The frequency spectrum of the raw signal is produced using the Fourier transform. An adult’s respiration rate has a maximum frequency of 0.4 Hz [47,49,50,51,52]. A filter with a cut-off frequency of 0.4 Hz is required to obtain the respiration signal. In the proposed case, the cut-off frequency of 0.4 Hz shifts to 0.04 when the normalized frequency is employed. To eliminate higher-frequency noise, a tenth-order low-pass Butterworth filter with a cut-off frequency of 0.04 is used to obtain the respiration signal. The Butterworth filter is a digital filter with a highly smooth frequency response curve in the passband. The filter’s square amplitude response function is
where K denotes the filter’s order, which is a positive integer, and is the low-pass filter’s cut-off frequency. In this study, and are used for experiments.
3.5. RPM Extraction from IR-UWB Data
RPM extraction entails various aspects of the data processing process. FFT is used to transform data from the trapezoidal rule into the frequency domain. Following that, the Butterworth filter is used to extract only the data related to respiration. The inhaling process is represented by the peaks found in the Butterworth filtered data. To find peaks, high movement places in the data must be located. Each round of inhalation and exhalation is considered one respiration. Finally, RPM can be calculated using:
where refers to peaks, while T shows the time in minutes.
3.6. Data Splitting
The dataset is split into two subsets: the training set and the testing set. An 80:20 ratio is used for data splitting, where 80% of the dataset is used for model training and 20% of the data are used for model testing. Table 1 shows the count for training and testing sets. In addition to these, 10-fold cross-validation is also employed to show the significance of machine-learning models.

Table 1.
Training and testing count.
3.7. Machine-Learning Models
Different ML models are trained on the dataset, including SVM, NB, RF, KNN, and ADA. These models are selected for experiments because of their significant performance in the literature on similar dataset types. These models, along with their best hyperparameters settings, are shown in Table 2. The hyperparameter setting is obtained using the grid search method, as the models were tuned between a specific range of parameter values.
Table 2.
Hyperparameter settings and performance of machine-learning models for COPD classification.
SVM is used with a ’poly’ kernel which can be appropriate for learning from non-linear data. RF is used with 200 n_estimators, meaning that 200 decision trees are combined for prediction and with the 20 max depth value, each tree is restricted to grow to a maximum 20-level depth. KNN is used with one hyperparameter name n_neighbor with a value of five, which means that KNN will consider five points to find the distance. NB is used with its default setting with 200 estimators, which means that 200 decision trees will be included in the decision process. A learning rate of 0.2 is also used to control the loss and calculate the weight for base models.
3.8. Performance Evaluation
Four evaluation parameters are employed to measure machine-learning models’ performance in areas such as accuracy, precision, recall, and F1 score. These evaluation parameters are mostly used for binary classification algorithms performance measures. These evaluation parameters are mathematically defined as
where
- TP is true positive, which means the actual label of the sample is healthy and the model also predicts it as healthy.
- TN is true negative, which means the actual label of the sample is COPD, and the model also predicts it as COPD.
- FP is false positive, which means the actual label for the sample is COPD, but the model predicts it as healthy.
- FN is false negative, which means the actual label for the sample is healthy, but the model predicts it as COPD.
Thus,
4. Results and Discussions
4.1. Results of RPM Extraction Experiments
Because training and prediction are based on RPM, precise RPM estimation is pivotal. The raw respiration data are processed to remove noise for this purpose. Figure 5 shows the noisy and cleaned data for RPM estimation. It can be observed that the cleaned data have smoother peaks than the noisy data, and peak estimation is easy with the cleaned data. Peaks are identified and counted using the cleaned data. Matlab function findpeaks is employed for this purpose, which returns the vector for the local maximum of the input signal. A local maximum is found concerning adjacent points, and shows a data sample that is greater than or equal to two adjacent samples.
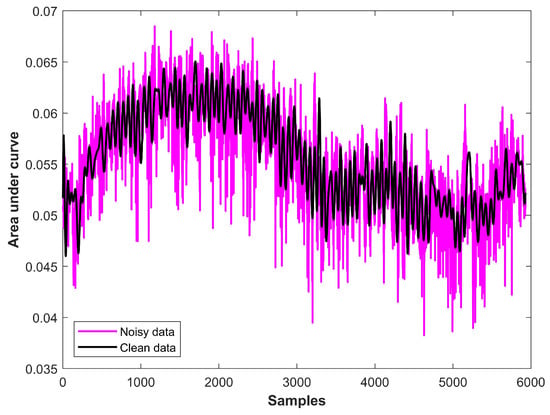
Figure 5.
Data preprocessed for RPM estimation.
Experiments with different participants were carried out to validate the performance and level of accuracy for RPM. For this purpose, 10 subjects participated in the experiment. The experiment was repeated multiple times and the average RPM was estimated to analyze its performance against the oximeter. The estimated RPM was validated against a commercial pulse oximeter.
The validation experiment included ten subjects, including six males and four females with ages ranging from 35 to 60 years. Individuals were instructed to sit comfortably facing the radar, with the pulse oximeter attached to their left index finger. The radar operator alerted the subjects and activated the radar, while the subject simultaneously activated the pulse oximeter. This hand movement did not affect the data collection, since the respiration frequency range does not coincide with the subject’s hand movement while activating the pulse oximeter. The chest movements of each individual were recorded twice, for 1 min each time. The above-described approach was used to determine RPM using IR-UWB data. The findings of the computed RPM were validated by an accuracy of 100% by the commercially available pulse oximeter.
4.2. Results of COPD Classification
A dataset was created based on the RPM, age, whether they were a smoker/non-smoker, gender, and labels (COPD/Healthy). Dataset analysis indicated that healthy subjects’ respiration rates ranged from 16 to 24, whereas COPD patients’ respiration rates ranged from 16 to 27. This indicates that using the respiration rate alone is not sufficient to discriminate COPD patients from healthy subjects. Consequently, other features are required which are more discriminate in this context. The discrimination capability is strengthened by adding other features in the dataset such as age, gender, and smoking/non-smoking status. Figure 6 shows 3D scatter plots of different combinations of features. In the 3D representation of data, Figure 6d illustrates the target classes using all features and four features (RPM, Gender, Smoker, Age) converted into three dimensions (X, Y, and Z) using the PCA technique. It shows that using RPM, gender, and age, COPD patients and healthy subjects can be classified. A scatter plot of the original dataset based on age and RPM is shown in Figure 7. Two critical issues related to machine-learning models are overfitting and underfitting. In overfitting, models learn small noise present in data as a sample and do not generalize on the unknown data. Meanwhile, the underfitting model does not learn well from the training data. To avoid these issues, the data were preprocessed and cleaned and models optimized by fine-tuning different hyperparameters. The dataset was divided into 80% for training and 20% for the testing of models.
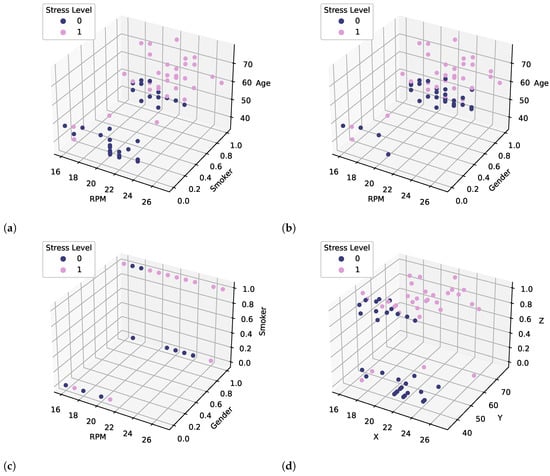
Figure 6.
Features Visualization (0) represent Healthy, (1) represent COPD (a) RPM, Smoker, Age, (b) RPM, Gender, Age (c) RPM, Gender, Smoker, and (d) PCA(RPM, Gender, Smoker, Age) = X, Y, Z.
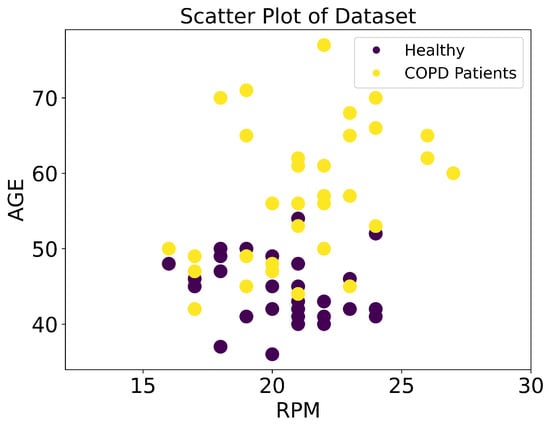
Figure 7.
RPM distribution for healthy persons and COPD patients concerning age.
4.3. Results of COPD Classification Using Machine-Learning Models
After successful training, these models were evaluated on the previously split data for testing. The average accuracy of these models is shown in Table 3. Results indicate that SVM, RF, NB, and ADA showed better training accuracy, but had fluctuations in per class performance, as these models showed different scores for COPD class. For better performance, these models require a large feature set for an appropriate fit. KNN showed better testing accuracy, and also showed significant results for each class, because KNN is a simple model based on the matching criteria and does not need a large feature set for significant performance. KNN can perform well on a small dataset, as the experimental results in the current study prove.
Table 3.
Performance of machine-learning models for COPD classification.
4.4. Results of COPD Classification Using Deep-Learning Models
This study makes use of state-of-the-art deep-learning models in comparison with machine learning. For this purpose, convolutional neural network (CNN) and long short terms memory (LSTM) models are used. The architecture of LSTM and CNN shown is provided in Table 4. The LSTM model consists of five layers: an embedding layer, two dropout layers, an LSTM layer, and a dense layer. The embedding layer is used with 1000 vocabulary size, 20 output dimension size, and 4 input length. The dropout layer is used with a 0.2 dropout rate, which helps to reduce the complexity of learning neurons to reduce the model’s overfitting probability.
Table 4.
Architecture of deep-learning models.
LSTM is used with 100 units, and binary_crossentropy loss function is used due to the binary classification problem. The model is compiled using the ’Adam’ optimizer and fitted with 100 epochs. For the CNN model, we use the same embedding layer, one dropout layer with 0.2 dropout rate, a 1D convolutional layer with 128 filters, and 2 × 2 kernel and ReLU activation function. The ReLU function is used to break linearity in learning data. After the 1D convolutional layer, a max pooling layer is used with 2 × 2 pool size. A flatten layer is used to convert three-dimensional data into one dimension and, in the end, a dense layer softmax activation function is used.
Results suggest that LSTM outperforms all machine-learning models, as well as the CNN model, with the highest 0.93 accuracy score, as shown in Table 5. However, the results from CNN are not very good due to the fact that CNN requires a large feature set for computation. The large size of the kernel is not appropriate to learn from a small feature set. Consequently, the model was trained properly due to a small feature set, which resulted in poor performance of the CNN model with a 0.79 accuracy score.
Table 5.
COPD classification results using deep-learning models.
4.5. Results Using K-Fold Cross Validation
This study also used the K-fold cross-validation approach to show the significance of the models, and the results are presented in Table 6. The results of all learning models are also good, with 10-fold cross-validation. LSTM is at the top, with 0.84 mean accuracy and 0.17 standard deviation.
Table 6.
Results of K-fold cross-validation.
4.6. Comparison with Existing Studies
Performance analysis was carried out with state-of-the-art approaches that present COPD prediction techniques. For this purpose, the models proposed in other studies were also applied to the current dataset, and the results were compared. The study [47] used the SVM model with the data collected from the UWB radar. Similarly, study [22] used a multi-class(MC)-SVM model for remote vital signs recognition. The authors performed experiments on the UWB dataset. Another study [53] used 1D CNN for the recognition of five respiration patterns (Eupnea, Bradypnea, Tachypnea, Apnea, and Motion). They also used the same UWB radar for dataset collection. An additional study [54] worked on pulmonary disease using data for obstructive and non-obstructive classification. The authors used a multi-layer perceptron to achieve a significant accuracy score. For performance comparison, the proposed MLP was trained on the current dataset. Similarly, ref. [55] investigated the prediction of asthma and COPD classification using sound-based features. The best performance was achieved using the decision tree (DT) model. Performance comparison results are given in Table 7.
Table 7.
Comparison results with other studies.
4.7. Discussions
COPD is a life-threatening disease that can lead to premature death if it is not diagnosed and treated during its early stages. It mainly affects the lungs, causing significant breathing problems, mobility, and quality of life issues, introducing other health complications as it progresses. As a result, the detection of COPD is a task of significant importance. Several tests can be used to diagnose COPD, including spirometry, blood test, chest X-ray, CT scans, and genetic testing. Such tests are expensive, time consuming, and require a medical expert for test performance and subsequent diagnosis. Such tests require contact (invasive), which has created complications during the current pandemic. This study proposes a solution for COPD detection where physical contact with the patient is not needed and, advantageously, a medical professional is not required to perform the test, leaving time for improved diagnosis outcomes for clinicians. The study utilizes an IR-UWB radar to detect respiration rates from healthy subjects and COPD patients, as described in Section 3.2. UWB radar is a non-intrusive device and can penetrate through different materials, making it advantageous over several other technologies. Breathing and heart rate measurements can be performed using the UWB, which are further used for disease prediction. However, one of the main challenges is data gathering from COPD patients and healthy subjects, which requires already diagnosed patients and healthy subject inclusion. In this regard, collaborative work was carried out with Sheikh Zayed Hospital, Pakistan, where COPD patients are treated. The data from 70 subjects were gathered for this study using the setup described in Section 3.3.
The efficacy of respiration rate measurement was verified using a commercial pulse oximeter on the preprocessed signal from IR-UWB, as described in Section 4.1. COPD prediction experiments were performed using machine-learning and deep-learning models. Data analysis revealed that using the respiration rate alone was not sufficient to classify the subjects into healthy and COPD patients, because the respiration rate may overlap for COPD patients and healthy subjects. As a result, the study investigated other features such as age, gender, and smoking history. PCA-based analysis indicates that using four features (RPM, age, gender, and smoking history) produced the best performance. So, four features were used for experiments using machine-learning and deep-learning models.
Experimental results given in Table 3 indicate that the KNN model performed better with a 0.86 accuracy score than other models, including SVM, RF, NB, and ADA. Class-wide accuracy varies concerning the model, but models show better accuracy for COPD class prediction than for that of the healthy class. Table 5 shows that deep-learning models obtained the highest accuracy of 0.93 with the LSTM model for COPD detection. It indicates that the performance of deep-learning models is better than machine-learning models. The performance of the LSTM model is important from two perspectives. First, the results were obtained non-invasively, which can be fruitful when diagnosing patients with infectious diseases. Secondly, the prediction accuracy of LSTM proposed in this study is better than existing approaches, as shown in Table 7. The highest accuracy of 0.84 for COPD reported in previous studies was obtained by [53]. The results obtained in the current study are much better than [53].
The results reported in the current study are promising for COPD detection, considering the fact that the proposed approach is non-invasive. However, further investigation is required for several improvements. First, the dataset size is comparatively low, and a large dataset involving more subjects is desirable for generalization. Second, the IR-UWB is tolerant to noise and the algorithm is immune to small subject movements, providing robust results. However, real-time testing is also desired to include remote health care and live but remote doctor consultations. With its contactless signal measurement, this approach can be adopted for data gathering where there is a risk of infectious disease when touching the patient. Third, transfer learning can be adopted in the case of the larger dataset to reduce the computational complexity of models.
5. Conclusions
Chronic obstructive pulmonary disease is a progressive lung disease that causes shortness of breath and other breathing complications. COPD causes hundreds of thousands of deaths, and if it is not diagnosed and treated at early stages, leads to premature death. Although several invasive approaches are available to diagnose COPD, they require pulmonologists for prediction. This study proposes the use of a non-invasive approach utilizing the IR UWB radar, which is used to measure vital signs such as breathing patterns. Experiments were carried out on hospitalized COPD patients to validate the performance of the proposed approach with 35 COPD patients and 35 healthy subjects under the supervision of pulmonologists. For this purpose, age, gender, RPM, and smoking history were considered. Machine-learning models, as well as, LSTM and CNN deep-learning models, were utilized for COPD prediction. Results suggest that LSTM yields the best results, with an accuracy of 93%. The IR-UWB shows the potential for non-invasive COPD prediction and can be highly beneficial, especially during COVID-19 pandemics, for patients with susceptible immune systems, for infants, and others when the observation of non-tactile or remote testing provides benefits, such as observing distancing restrictions. In the health care center, the proposed system has the potential to monitor and diagnose COPD patients from a safe distance. Multiple patient screening and patient flow in a non-stationary environment are also intended for future work.
Author Contributions
Conceptualization, H.U.R.S. and A.A.S.; Data curation, H.U.R.S., F.R. and I.B.; Formal analysis, A.A.S. and I.B.; Funding acquisition, I.d.l.T.D.; Investigation, I.B. and K.Z.; Methodology, K.Z. and F.R.; Project administration, F.R. and I.d.l.T.D.; Resources, I.d.l.T.D. and S.D.; Software, F.R.; Supervision, S.D. and I.A.; Validation, F.R. and I.A.; Visualization, K.Z. and S.D.; Writing—original draft, H.U.R.S. and A.A.S.; Writing—review and editing, I.A. and S.D. All authors have read and agreed to the published version of the manuscript.
Funding
This research was supported by the European University of the Atlantic.
Institutional Review Board Statement
The study was conducted according to the guidelines of the Helsinki Declaration, and approved by the Ethics Committee of KFUEIT (protocol code 312 on 4 September 2020).
Informed Consent Statement
Informed consent was obtained from all subjects involved in the study.
Data Availability Statement
Not applicable.
Conflicts of Interest
The authors declare no conflict of interest.
References
- Laniado-Laborín, R. Smoking and chronic obstructive pulmonary disease (COPD). Parallel epidemics of the 21st century. Int. J. Environ. Res. Public Health 2009, 6, 209–224. [Google Scholar] [CrossRef] [PubMed]
- May, S.M.; Li, J.T. Burden of chronic obstructive pulmonary disease: Healthcare costs and beyond. Allergy Asthma Proc. Ocean. Publ. 2015, 36, 4. [Google Scholar] [CrossRef] [PubMed]
- World Health Organization. The Top 10 Causes of Death. 2020. Available online: https://www.who.int/news-room/fact-sheets/detail/the-top-10-causes-of-death (accessed on 25 June 2022).
- Viniol, C.; Vogelmeier, C.F. Exacerbations of COPD. Eur. Respir. Rev. 2018, 27, 147. [Google Scholar] [CrossRef]
- Holland, K. Emphysema vs. Chronic Bronchitis: Is There a Difference? 2018. Available online: https://www.healthline.com/health/copd/emphysema-vs-chronic-bronchitis (accessed on 25 June 2022).
- Hui, S.; How, C.H.; Tee, A. Does this patient really have chronic obstructive pulmonary disease? Singap. Med. J. 2015, 56, 194. [Google Scholar] [CrossRef]
- Shapiro, S.D.; Ingenito, E.P. The pathogenesis of chronic obstructive pulmonary disease: Advances in the past 100 years. Am. J. Respir. Cell Mol. Biol. 2005, 32, 367–372. [Google Scholar] [CrossRef]
- Williamson, J.P.; McLaughlin, R.A.; Noffsinger, W.J.; James, A.L.; Baker, V.A.; Curatolo, A.; Armstrong, J.J.; Regli, A.; Shepherd, K.L.; Marks, G.B.; et al. Elastic properties of the central airways in obstructive lung diseases measured using anatomical optical coherence tomography. Am. J. Respir. Crit. Care Med. 2011, 183, 612–619. [Google Scholar] [CrossRef] [PubMed]
- Ruppel, G.L.; Carlin, B.W.; Hart, M.; Doherty, D.E. Office spirometry in primary care for the diagnosis and management of COPD: National Lung Health Education Program update. Respir. Care 2018, 63, 242–252. [Google Scholar] [CrossRef] [PubMed]
- Haynes, J.M. Basic spirometry testing and interpretation for the primary care provider. Can. J. Respir. Ther. CJRT Rev. Can. De La Ther. Respir. RCTR 2018, 54. [Google Scholar] [CrossRef] [PubMed]
- Miller, M.R.; Hankinson, J.; Brusasco, V.; Burgos, F.; Casaburi, R.; Coates, A.; Crapo, R.; Enright, P.; Van Der Grinten, C.; Gustafsson, P.; et al. Standardisation of spirometry. Eur. Respir. J. 2005, 26, 319–338. [Google Scholar] [CrossRef]
- Eaton, T.; Withy, S.; Garrett, J.E.; Whitlock, R.M.; Rea, H.H.; Mercer, J. Spirometry in primary care practice: The importance of quality assurance and the impact of spirometry workshops. Chest 1999, 116, 416–423. [Google Scholar] [CrossRef]
- Enright, P.L. Should we keep pushing for a spirometer in every doctor’s office? Respir. Care 2012, 57, 146–153. [Google Scholar] [CrossRef] [PubMed]
- Shanker, A. Quality assurance: What must be done to strengthen the teaching profession. Phi Delta Kappan 1996, 78, 220. [Google Scholar]
- Healthline. COPD Test and Diagnosis. 2018. Available online: https://www.healthline.com/health/copd/tests-diagnosis (accessed on 30 June 2022).
- Kellett, J.; Li, M.; Rasool, S.; Green, G.C.; Seely, A. Comparison of the heart and breathing rate of acutely ill medical patients recorded by nursing staff with those measured over 5 min by a piezoelectric belt and ECG monitor at the time of admission to hospital. Resuscitation 2011, 82, 1381–1386. [Google Scholar] [CrossRef] [PubMed]
- Brown, R.; Ghavami, N.; Adjrad, M.; Ghavami, M.; Dudley, S. Occupancy based household energy disaggregation using ultra wideband radar and electrical signature profiles. Energy Build. 2017, 141, 134–141. [Google Scholar] [CrossRef]
- Ghavami, M.; Michael, L.; Kohno, R. Ultra Wideband Signals and Systems in Communication Engineering; John Wiley & Sons: Hoboken, NJ, USA, 2007. [Google Scholar]
- Ullah, S.; Ali, M.; Hussain, A.; Kwak, K.S. Applications of UWB technology. arXiv 2009, arXiv:0911.1681. [Google Scholar]
- Zhuang, W.; Shen, X.; Bi, Q. Ultra-wideband wireless communications. Wirel. Commun. Mob. Comput. 2003, 3, 663–685. [Google Scholar] [CrossRef]
- Rana, S.P.; Dey, M.; Siddiqui, H.U.; Tiberi, G.; Ghavami, M.; Dudley, S. UWB localization employing supervised learning method. In Proceedings of the 2017 IEEE 17th International Conference on Ubiquitous Wireless Broadband (ICUWB), Salamanca, Spain, 12–15 September 2017; pp. 1–5. [Google Scholar]
- Rana, S.P.; Dey, M.; Brown, R.; Siddiqui, H.U.; Dudley, S. Remote Vital Sign Recognition through Machine Learning Augmented UWB; IET: London, UK, 2018. [Google Scholar]
- Wu, S.; Tan, K.; Xia, Z.; Chen, J.; Meng, S.; Guangyou, F. Improved human respiration detection method via ultra-wideband radar in through-wall or other similar conditions. IET Radar Sonar Navig. 2016, 10, 468–476. [Google Scholar] [CrossRef]
- Kim, S.G.; Ko, I.C.; Jung, S.H. High resolution CMOS IR-UWB radar for non-contact human vital signs detection. In Proceedings of the 2020 IEEE Radio Frequency Integrated Circuits Symposium (RFIC), San Diego, CA, USA, 11–13 June 2020; pp. 27–30. [Google Scholar]
- Lazaro, A.; Girbau, D.; Villarino, R. Analysis of vital signs monitoring using an IR-UWB radar. Prog. Electromagn. Res. 2010, 100, 265–284. [Google Scholar] [CrossRef]
- Fontana, R.J. Recent system applications of short-pulse ultra-wideband (UWB) technology. IEEE Trans. Microw. Theory Tech. 2004, 52, 2087–2104. [Google Scholar] [CrossRef]
- Staderini, E.M. UWB radars in medicine. IEEE Aerosp. Electron. Syst. Mag. 2002, 17, 13–18. [Google Scholar] [CrossRef]
- Immoreev, I.; Tao, T.H. UWB radar for patient monitoring. IEEE Aerosp. Electron. Syst. Mag. 2008, 23, 11–18. [Google Scholar] [CrossRef]
- Ivashov, S.; Razevig, V.; Sheyko, A.; Vasilyev, I. Detection of human breathing and heartbeat by remote radar. In Proceedings of the Electromagnetic Research Symposium, Pisa, Italy, 28–31 March 2004; Volume 2004. [Google Scholar]
- Sarkar, S.; Bhattacharyya, P.; Mitra, M.; Pal, S. A novel approach towards non-obstructive detection and classification of COPD using ECG derived respiration. Australas. Phys. Eng. Sci. Med. 2019, 42, 1011–1024. [Google Scholar] [CrossRef] [PubMed]
- Zubaydi, F.; Sagahyroon, A.; Aloul, F.; Mir, H. MobSpiro: Mobile based spirometry for detecting COPD. In Proceedings of the 2017 IEEE 7th Annual Computing and Communication Workshop and Conference (CCWC), Las Vegas, NV, USA, 9–11 January 2017; pp. 1–4. [Google Scholar]
- Haider, N.S.; Singh, B.K.; Periyasamy, R.; Behera, A.K. Respiratory sound based classification of chronic obstructive pulmonary disease: A risk stratification approach in machine learning paradigm. J. Med. Syst. 2019, 43, 1–13. [Google Scholar] [CrossRef] [PubMed]
- Rodríguez-Aguilar, M.; de León-Martínez, L.D.; Gorocica-Rosete, P.; Padilla, R.P.; Thirión-Romero, I.; Ornelas-Rebolledo, O.; Flores-Ramírez, R. Identification of breath-prints for the COPD detection associated with smoking and household air pollution by electronic nose. Respir. Med. 2020, 163, 105901. [Google Scholar] [CrossRef] [PubMed]
- Soubelet, A.; Pathinarupothi, R.K.; Rangan, E.S.; Durga, P.; Menon, K.U. Internet-of-Things Based Respiratory Rate Monitoring for Early Detection of Cardiovascular and Pulmonary Diseases. In EAI International Conference on IoT Technologies for HealthCare; Springer: Berlin/Heidelberg, Germany, 2018; pp. 97–106. [Google Scholar]
- Materko, W.; Bartels, R.; Motta-Ribeiro, G.C.; Lopes, A.J.; Nadal, J.; SilvaCarvalho, A.R. influence of the respiratory signal in heart rate variability analysis in the respiratory pattern in healthy elderly and with COPD. Int. J. Eng. Technol. Manag. Res. 2018, 5, 1–8. [Google Scholar] [CrossRef]
- Motamedi-Fakhr, S.; Wilson, R.C.; Iles, R. Tidal breathing patterns derived from structured light plethysmography in COPD patients compared with healthy subjects. Med. Devices 2017, 10, 1. [Google Scholar] [CrossRef]
- Chatterjee, S.; Rahman, M.M.; Nemanti, E.; Kuang, J. WheezeD: Respiration phase based wheeze detection using acoustic data from pulmonary patients under attack. In Proceedings of the 13th EAI International Conference on Pervasive Computing Technologies for Healthcare-Demos and Posters. European Alliance for Innovation (EAI), Trento, Italy, 20–23 May 2019. [Google Scholar]
- Tateno, S.; Guan, X.; Cao, R.; Qu, Z. Development of drowsiness detection system based on respiration changes using heart rate monitoring. In Proceedings of the 2018 57th Annual Conference of the Society of Instrument and Control Engineers of Japan (SICE), Nara, Japan, 11–14 September 2018; pp. 1664–1669. [Google Scholar]
- Rahman, M.; Nemati, E.; Nathan, V.; Kuang, J. Instantrr: Instantaneous respiratory rate estimation on context-aware mobile devices. In EAI International Conference on Body Area Networks; Springer: Berlin/Heidelberg, Germany, 2018; pp. 267–281. [Google Scholar]
- Riella, R.; Nohama, P.; Maia, J. Method for automatic detection of wheezing in lung sounds. Braz. J. Med. Biol. Res. 2009, 42, 674–684. [Google Scholar] [CrossRef]
- Yamauchi, Y.; Kohyama, T.; Jo, T.; Nagase, T. Dynamic change in respiratory resistance during inspiratory and expiratory phases of tidal breathing in patients with chronic obstructive pulmonary disease. Int. J. Chronic Obstr. Pulm. Dis. 2012, 7, 259. [Google Scholar] [CrossRef]
- Sarkar, S.; Bhattacharyya, P.; Mitra, M.; Pal, S. Automatic detection of obstructive and restrictive lung disease from features extracted from ECG and ECG derived respiration signals. Biomed. Signal Process. Control 2022, 71, 102791. [Google Scholar]
- Novelda. Ultra Wideband (UWB) Impulse Radar Transceiver SoC-X4 Datasheet. 2020. Available online: https://docplayer.net/143727276-X4-datasheet-impulse-radar-transceiver-soc-xethru-datasheet-by-novelda-as-key-features.html (accessed on 30 June 2022).
- Laonuri Coporation. X4M300. 2020. Available online: https://www.laonuri.com/en/product/x4m300/ (accessed on 25 June 2022).
- Liang, X.; Li, H.; Wang, W.; Liu, Y.; Ghannam, R.; Fioranelli, F.; Heidari, H. Fusion of Wearable and Contactless Sensors for Intelligent Gesture Recognition. Adv. Intell. Syst. 2019, 1, 1900088. [Google Scholar] [CrossRef]
- Kim, D.H. Lane detection method with impulse radio ultra-wideband radar and metal lane reflectors. Sensors 2020, 20, 324. [Google Scholar] [CrossRef] [PubMed]
- Siddiqui, H.U.R.; Saleem, A.A.; Brown, R.; Bademci, B.; Lee, E.; Rustam, F.; Dudley, S. Non-invasive driver drowsiness detection system. Sensors 2021, 21, 4833. [Google Scholar] [CrossRef] [PubMed]
- Siddiqui, H.U.R.; Shahzad, H.F.; Saleem, A.A.; Khan Khakwani, A.B.; Rustam, F.; Lee, E.; Ashraf, I.; Dudley, S. Respiration Based Non-Invasive Approach for Emotion Recognition Using Impulse Radio Ultra Wide Band Radar and Machine Learning. Sensors 2021, 21, 8336. [Google Scholar] [CrossRef]
- Quintana, D.S.; Elstad, M.; Kaufmann, T.; Brandt, C.L.; Haatveit, B.; Haram, M.; Nerhus, M.; Westlye, L.T.; Andreassen, O.A. Resting-state high-frequency heart rate variability is related to respiratory frequency in individuals with severe mental illness but not healthy controls. Sci. Rep. 2016, 6, 37212. [Google Scholar] [CrossRef] [PubMed]
- Ahmed, A.; Harness, J.; Mearns, A. Respiratory control of heart rate. Eur. J. Appl. Physiol. Occup. Physiol. 1982, 50, 95–104. [Google Scholar] [CrossRef]
- Tiinanen, S.; Kiviniemi, A.; Tulppo, M.; Seppänen, T. RSA component extraction from cardiovascular signals by combining adaptive filtering and PCA derived respiration. In 2010 Computing in Cardiology; IEEE: Piscataway, NJ, USA, 2010; pp. 73–76. [Google Scholar]
- Kircher, M.; Lenis, G.; Dössel, O. Separating the effect of respiration from the heart rate variability for cases of constant harmonic breathing. Curr. Dir. Biomed. Eng. 2015, 1, 46–49. [Google Scholar] [CrossRef]
- Kim, S.H.; Geem, Z.W.; Han, G.T. A novel human respiration pattern recognition using signals of ultra-wideband radar sensor. Sensors 2019, 19, 3340. [Google Scholar] [CrossRef]
- Bhattacharjee, S.; Saha, B.; Bhattacharyya, P.; Saha, S. Classification of obstructive and non-obstructive pulmonary diseases on the basis of spirometry using machine learning techniques. J. Comput. Sci. 2022, 63, 101768. [Google Scholar] [CrossRef]
- Haider, N.S.; Behera, A. Computerized lung sound based classification of asthma and chronic obstructive pulmonary disease (COPD). Biocybern. Biomed. Eng. 2022, 42, 42–59. [Google Scholar] [CrossRef]
Publisher’s Note: MDPI stays neutral with regard to jurisdictional claims in published maps and institutional affiliations. |
© 2022 by the authors. Licensee MDPI, Basel, Switzerland. This article is an open access article distributed under the terms and conditions of the Creative Commons Attribution (CC BY) license (https://creativecommons.org/licenses/by/4.0/).