1. Introduction
On 12 December 2019, 27 persons exposed to a new coronavirus infection were notified by the Wuhan Municipal Health Commission (WMHC) in Wuhan City, Hubei Province, China. The Centers for Disease Control and Prevention (CDC) stated that the cause of this infection was “severe acute respiratory syndrome coronavirus 2” or SARS-CoV-2, followed by Coronavirus Disease 2019 (COVID-19) by the World Health Organization (WHO) [
1]. Most cases in the primary group had epidemiological connections to the Wuhan live animal market. The virus that causes pneumonia was sequenced, and it has been found to be one of the beta-coronavirus families and almost identical to the SARS-like BAT coronavirus bat-SL-CoVZC45 and bat-SL-CoVZXC21 with 88% resemblance, 79.5% SARS identity, and 50% MERS [
2,
3].
Early research in January 2020 has shown that, among 41 patients (with an average age of almost 49 years) positive for COVID-19 infection, half of them had chronic diseases, including diabetes 20%, cardiovascular disease 15%, and hypertension 15%. The symptoms appeared to have been 98% fever, 76% cough, and 44% fatigue. COVID-19 Serious complications in these patients included 29% respiratory distress syndrome, 15% RNAaemia, 12% acute cardiac injury, and other secondary infections. Of the total infected patients, 32% were expected to be admitted to the Intensive Care Unit (ICU). The death rate was 15% [
4].
COVID-19 is believed to have been transmitted from animals, but it is not certain which animal it was, even though the animals are the root of the infection. Recent findings show that COVID-19 is 96% like the coronavirus bat [
5]. As the virus is transmitted from person to person over time, it inevitably transforms, and potentially malignant strains may emerge at a high fatality rate. The fatality rate is currently estimated to be below the fatality rate for Severe Acute Respiratory Syndrome (SARS) or Middle East Respiratory Syndrome (MERS) [
6].
Other pulmonary syndromes that have occurred with other offspring of the coronavirus family have been identified. The most eminent examples are the SARS and the MERS. The SARS outbreak has been reported since 2003 without any reports of a person’s infection; however, there are some small continuous reports of MERS. One of the critical components used for diagnosis is imaging, disease progression monitoring, and follow-up of coronavirus-related pulmonary syndromes [
7].
By 24 April 2020, 22:34 GMT, according to WHO, a total of 2,826,035 cases of infection had been confirmed worldwide in 213 countries, including 196,931 deaths and 79,877 cases recovered in active cases of 1,849,227 [
8].
Despite a serious average of infections, the death rate is estimated at 14% compared to confirmed cases of COVID-19, with most deaths typically occurring among elderly people (>80 years of age), patients suffering from several related diseases, and immunocompromised people [
9,
10].
The international guidelines provided by the WHO and the CDC are bound to assist in the management and prohibition of infection domination. There are currently no drugs or antiviral therapies for the coronavirus family. This resulted in different researchers worldwide experiencing the efficacy of drugs, such as interferon-alpha and lopinavir (already used to treat SARS) with other new pharmacological drugs [
11].
This paper will help countries to make decisions that encourage access to corrected values and get some indication as to whether there are other factors that affect the spread of COVID-19, via methods such as increasing the daily test rate. This paper presents an analytical study of COVID-19 coronavirus infection. These analytical data were collected from the WHO database in more than 200 countries. There are other data that have also been collected and taken into account in these countries, such as the total number of tests that each country has undergone, the number of tests per 1 million population, the number of international tourist arrivals in each country per million per year, the number of employees per total population in each country per percentage, the life expectancy at birth, the median age of each country (years), the population density (number of population per Km2), the number of people at age 65 years or older in millions, the total population in millions, and the sex ratio at birth (male to female births).
The main purpose of this work can be summarized as follows:
Find out the outlier data of countries for each of the infected, death, critical, and recovery cases.
Discover the most effective features that cause increased rates for each of the infected, fatal, critical, and recovery cases.
Build a prediction model to predict the values of outlier data for infected, fatal, critical, and recovery cases.
Help countries make decisions that encourage access to corrected values, such as increasing the daily test rate.
The proposed model is based on machine learning approaches to achieve the objectives of this study. It consists of three phases; the dataset is collected and pre-processed in the first phase. The second phase identifies the outlier cases of the dataset collected and selects the most effective features for each of the total infected, fatal, critical, and recovery cases. In the third phase, the predictive models are designed to predict the actual case for each country. Predicted values can be compared with the country’s current values for taking the appropriate decisions. Experimental results show that the outlier detection and extraction of effective features have contributed to the improvement of the classification accuracy value for each of the total infected, fatal, critical, and recovery cases.
This paper is organized as follows.
Section 2 presents a review of the machine learning techniques used in this study.
Section 3 sets out the proposed approach and all steps in detail.
Section 4 presents and discusses the results of applying machine learning approaches to COVID-19 data analysis. Finally,
Section 5 highlights this research work’s conclusions and future endeavors.
2. Data Analysis Approaches
Recently, data has been growing rapidly. Several researchers are currently interested in managing and analyzing the data. There are several benefits of data analysis, such as facilitating faster data and better decision-making. Data analysis is not easy as it requires several analytical techniques, tools, and infrastructure.
Machine learning is one of the most important branches of AI, which is concerned with understanding the data structure and relevance of data in patterns and rules that people can understand and use. The most reliable machine learning techniques are supervised, unsupervised, semi-supervised, and enhanced learning. In machine learning, the extraction of features is the process of extracting the most effective features that are more reliable for fitting training data into model construction.
2.1. Supervised Learning
Supervised learning is a technique based on training and data testing. The trained data are labeled and the labels are then submitted to the model during execution. This labeled dataset is trained to obtain significant outputs when it is processed through decision-making.
Several classification techniques have been examined to classify the data into classes. Classification techniques, such as Naive Bayes (NB), Artificial Neural Network (ANN), Support Vector Machines (SVM), and Random Forest (RF), have achieved great success in data analysis.
2.1.1. Naïve Bayes
The Naive Bayes classifier’s class is determined by the estimator’s class. The training data analysis is used to select numerical precision amounts. As a result, the classifier can be used as an Updateable Classifier functionality but cannot be used as an Updateable Classifier (with zero training cases) [
12].
2.1.2. Support Vector Machines (SVM)
The Support Vector Machine (SVM) Classifier has grown in popularity in recent years because of its superior performance in a variety of applications. A two-class SVM classifier’s goal is to create a hyperplane that maximizes the margin, which is the distance between the closest points on either side of the boundary. These are referred to as support vectors. The SVM algorithm can be a linear classifier when the class separation is a straight line, a nonlinear classifier when the class separation is a nonlinear line or curve, and a soft-margin formulation when there is no linear hyperplane capable of separating the data. [
12].
2.1.3. Artificial Neural Network (ANN)
The Artificial Neural Network (ANN) is a mathematical model that simulates how neurons function in organisms. It is a very effective tool for developing non-linear models. The Multilayer Perceptron (MLP) is an early ANN structure that uses a neural network of fully interconnected structures; it has good efficacy and a wide range of applications. The MLP is an ANN model composed of three layers: an input layer, a hidden layer, and an output layer. However, if the data is overly complex, simply using the MLP structure may prevent the model from learning how to handle every situation effectively. ANN has already evolved into several new structures [
13].
2.1.4. Random Forest (RF)
Random Forest (RF) is a popular approach for data exploration, analysis, and predictive modeling. Breiman proposed Random Forest in 2001. Random forest results are derived from several decision-making trees that are trained separately from a subset of training data. Random Forest is familiar with learning groups, expert committees, and models. The random forest provides high-dimensional data visualization (many columns), clustering, outlier detection, and error detection [
14].
2.2. Unsupervised Learning
It is based on data classification without the classifier’s training. There is no category, no history, no training, and no data testing. They do not provide accurate targets and thus rely on clustering.
2.2.1. K-Means Algorithm
K-Means algorithm based on dividing is an unsupervised algorithm and is used in different fields, particularly data mining and pattern recognition. K-Means is used to reduce the cluster performance index, the square error, and the fault criterion. K-Means is the search for k divisions to accept a specific standard. This is done by: (1) Selecting several points to show the main focal cluster points; (2) Collecting the remaining points of the sample to their focal points due to the lower distance standard; (3) Obtaining the first classification and modifying it several times if the results of the first classification are not applicable [
15].
2.2.2. Semi-Supervised Techniques
These techniques are a combination of supervised and unsupervised learning algorithms. Therefore, some data are labeled and others are not labeled. Algorithms will be applied to labeled and unmarked data, and some dataset classifiers can be learned for either complete information or missing training sets.
2.3. Reinforcement Learning (RL)
Reinforcement learning involves regulating and classifying real-time data alterations in a method that allows the learning framework to be adjusted based on these modifications.
2.4. Feature Selection
Feature selection is the step of neglecting the features in the database that do not have important information due to the task that needs to be completed. The importance of the feature selection step appears to reduce the amount of data processed by the classifier, minimize the time of process execution, and improve performance (adding unrelated features can cause data noise, thereby blocking related features). Feature selection may be done at a lower level in some classifiers, such as trees, but even using these techniques, a reduction of features is still needed. The more data reduction, the more time reduction for execution. Feature selection techniques are divided into three categories—filter, wrapper, and embedded techniques [
16].
2.4.1. Filter Methods
Filter methods are primarily used as a pre-processing step. The selection of features is separated from any specific classification algorithms. Meanwhile, features are selected due to their scores in several statistical experiments for their involvement with the result variable, i.e., they rely solely on data properties. Filter methods are much faster, simpler, easier, and cheaper than wrapper methods. Four algorithms were used in this study [
17]:
Correlation-based Feature Subset Selection (CFS): Evaluates the features by considering the individual predictive capability of any features alongside the stage of increase between them.
Classifier Attribute Evaluation (CAE): Evaluates attributes using a user-specified classifier due to the target class.
Information Gain Attribute Evaluation (IG): Evaluates the features by calculating the information gained due to the class.
Relief Feature Attribute Evaluation: Evaluates attributes by frequently sampling an example and considering the amount of the specific feature for the nearest sample of the same and different classes. It can work either discreetly or on the continuous class data.
2.4.2. Wrapper Methods
Wrapper methods are a learning algorithm used to select significant features from the dataset by searching through the space of features and evaluating the selected features by deducing the expected performance of the classifier. The main goal of the search step is to identify features that increase the criterion. These methods are usually very expensive in computation but are more accurate than filter methods. Several popular models of wrapper techniques include forward feature selection, backward feature elimination, and recursive feature elimination [
17]:
Forward Selection is an iterative method, starting with no features in the model and continuing to add features to each iteration to improve the model until the addition of a new variable does not improve the performance of the model.
Backward Elimination is reversible by starting with all the features and removing the least significant feature at each replication that improves the performance of the model. Repeat until no improvement is observed when the features are removed.
Recursive Feature elimination is a rapacious optimization technique that needs to achieve the highest performance by selecting the preferred subset of features. It often produces patterns and keeps the best or worst execution feature apart at each repetition. It builds the following model with the left features until all the features are finished. It then sets out the features based on the rank of removal.
3. Performance Evaluation Metric Parameters
This section presents the metric parameters used to measure the performance of the proposed approach. The simplest measurement would be the accuracy rate of classification, which is calculated from the number of correctly predicted samples divided by the total number of predicted samples. A single gauge is often not sufficient. Several other metrics, besides accuracy, were used to measure the performance of the classifiers, such as precision, recall, F-measure, Matthews Correlation Coefficient (MCC), and Receiver Operating Characteristic (ROC). The MCC is used to measure accuracy if the amount of data in the classes is not equal or is unbalanced. These metrics are listed as follows:
where:
True Positive (TP) is the number of positive data correctly classified as positive.
False Positive (FP) is the number of positive data falsely classified as negative.
False Negative (FN) is the number of negative data falsely classified as positive.
True Negative (TN) is the number of negative data correctly classified as negative.
4. Proposed Approach
The analytical approach is proposed for the study of COVID-19 coronavirus infections and the discovery of the most effective features that cause increased rates for each of the infected, fatal, critical, and recovery cases. It takes into account the country’s features, such as the total number of tests that each country has undergone, the number of tests per 1 million population, the number of international tourists arriving in each country per million per year, the number of employees per total population in each country in percentage, the life expectancy at birth, the median age of each country (years), the population density (the number of population per Km2), the number of people at age 65 years or older in millions, the total population in millions, and the sex ratio at birth (male to female births).
As shown in
Figure 1, the proposed approach consists of three phases. The data set is collected and pre-processed in the first phase. The second phase identifies the outlier cases of the data set collected and selects the most effective features for each of the total infected, fatal, critical, and recovery cases. In the third phase, the prediction models are designed to predict the actual case for each country.
The first phase of the proposed approach is divided into three stages. The first step is to deal with missing data from the dataset collected. Missing data can be handled by ignoring records with empty fields or using statistical techniques to find the most likely values for missing data. In this study, all records with empty fields will be ignored in the analytical process, where the actual data values are very critical in this application instead of the most likely values.
The second step is used to discrete the features to be predicted in intervals, where many classification algorithms cannot predict continuous values. In this study, total cases, total deaths, total recovered, and critical cases will be predicted. In this step, the K-Means algorithm is used to cluster the values of each classified feature into five clusters, and the values of each cluster are replaced by the cluster label.
The third step is used to normalize the dataset collected, where the range of all features should be normalized so that each feature contributes approximately proportionally to the expected value. In this step, the Min-Max normalization technique is used to transform the range of all features between 0 and 1.
The second phase of the proposed approach consists of three steps. The first step is used to identify the outlier cases for each classified feature. In this study, outlier data will be incorrectly classified in instances during the training phase of the classification algorithm, where these cases behave differently from the other cases with the training model. Therefore, the proposed approach trains the data with different classification algorithms to find the algorithm with the most appropriate data during the training phase. The classification algorithm that achieves the highest accuracy value during the training phase will be selected and considered to be the algorithm of the most fitting data, and its incorrectly classified instances will be selected to be outlier instances.
The second step is used to find the most applicable classifier for each classified feature. In this step, various classification algorithms will be used to train and test the preprocessed data after the removal of outlier cases. The classification algorithm with the highest accuracy for each classified feature will be selected to predict the total cases, the total deaths, the total recovered, and the critical cases.
The third step is used to extract the most effective features for each of the total infected cases, the total death cases, the critical cases, and the recovery cases. In this step, the Wrapper algorithm will be used to select the most efficient subset of features.
The last phase of the proposed approach is used to construct the prediction models after the selection of the most effective subset of features for each classified feature, which contributes to the improvement of classification accuracy.
5. Results
This section presents the dataset specification and then illustrates the result of the proposed approach at each phase.
5.1. Dataset Description
Several features of different countries were collected into the experimental dataset, consisting of 210 records and 19 features, each record representing one country with 19 features. These collected data features for each country included the total number of infected cases, the total number of deaths, total number of recovered cases, daily number of new infected cases (day 10 April 2020), number of active or current infected cases, number of serious critical cases, total number of cases per 1 million of population, and the total number of deaths per 1 million of population.
There are other data that had also been collected and taken into account in these countries, such as the total number of tests that each country had experimented, the number of tests per 1 Million population, the number of international tourist arrivals in each country in million per year, the number of employees per total number of population in each country in percentage, the life expectancy at birth, the median age of each country (years), the population density (number of population per Km2), the number of people with age 65 years or older in millions, the total population in millions, and the sex ratio at birth (male to female births).
All these data had been collected from several trusted and documented resources such as WHO [
4]. The other resources of the collected data are provided in [
18,
19,
20].
Table 1 presents a statistical description of the collected dataset.
5.2. Phase I: Data Pre-Processing
The data had to be pre-processed after the dataset had been collected and before the proposed approach was applied. This step was divided into three steps.
The first step was the handling of missing data that was not recorded in some countries. All records of countries with missing data were removed from the data set. Therefore, the experimental data set consisted of only 51 countries that had removed the missing data records.
The second step was to discriminate the classified features of total cases, total deaths, total recovered, and critical cases. The K-Means algorithm was used to cluster the values of each classified feature into 5 clusters, and the values of each cluster were replaced by the cluster label.
Table 2 shows the number of records, the minimum value, and the maximum value for each cluster of classified features.
The final step of the first step was to normalize the dataset’s numerical features. All values of the dataset features were scaled from 0 to 1 using the min-max normalization algorithm.
5.3. Phase II
The second phase of the proposed approach consisted of three steps: the calculation of the outlier instances of all classification algorithms, the discovery of the highest accuracy of the classification algorithm, and finally the selection of the features of the selected classifier to select the most effective features.
The first step was to calculate the outlier instances. Four experiments were carried out to predict total infected cases, total deaths, critical cases, and recovery cases.
Table 3,
Table 4,
Table 5 and
Table 6 present the number of incorrectly classified instances, which are different for each classification algorithm during the training phase. This number depends on the ability of the classification algorithm to fit the training data and the outlier data.
The classification algorithm with the highest accuracy value during the training phase was selected and considered to be the algorithm with the most appropriate data, and its incorrectly classified instances were outlier data. Therefore, during the training data, the outlier instances were ignored to make the classification algorithms more capable of fitting training data.
The second step was the discovery of the highest accuracy of the classification algorithm for each classified feature. Four experiments were carried out to predict total infected cases, total deaths, critical cases, and recovery cases after the outlier data were ignored.
Table 7,
Table 8,
Table 9 and
Table 10 present the performance metric parameters of the classification algorithms after applying the 10-fold cross-validation test technique.
The results of the previous tables show that the Support Vector Machine (SVM) classifier algorithm is more capable of fitting data to predict total infected cases, total deaths, critical cases, and recovery cases, which achieved the highest classification accuracy compared to other classification algorithms. The third step was to extract the most effective features for each of the total infected cases, total death cases, critical cases, and recovery cases. A comparison study between the Correlation-based Feature Selection (CFS), Correlation Attribute Evaluation (CAE), Information Gain (IG), Relief Attribute Evaluation, and Wrapper algorithms was conducted to select the most effective subset of features.
5.4. Phase III
Feature selection approaches are based on filter and wrapper methods. The filter method depends on the importance of each individual feature to the output prediction without considering the importance of each related subset of the features to the output prediction values. Therefore, the proposed approach uses the wrapper method to select a subset of related features that are most closely related to the output prediction. The last phase of the proposed approach was the construction of the SVM classifier prediction model, which was trained by the values of the selected features using the wrapper method. The proposed approach was evaluated and compared to the different filter-based feature selection algorithms.
Table 15,
Table 16,
Table 17 and
Table 18 present the values of the performance metric parameters of the SVM classifier using different subsets of the feature extraction algorithms.
Experimental results show that the extracted subset with the wrapper algorithm achieved the highest classification accuracy compared to the other feature extraction algorithms.
The experimental results show that the most effective extracted features of the total infected cases are:
Total tests,
International tourist arrivals (millions) per year,
Life expectancy at birth,
Median age (years),
Population aged 65 and over (millions),
The density of population (P/Km2),
Employment in services (% of total employment),
Total population (millions).
The most effective extracted features of the total deaths are:
The number of international tourist arrivals (million) per year,
Population aged 65 and over (millions),
The density of population (P/Km2),
Life expectancy at birth,
Median age (years),
Employment in services (% of total employment).
The most effective extracted features of the total recovered cases are:
The number of international tourist arrivals (millions) per year,
Population aged 65 and over (millions).
The most effective extracted features of the overall critical cases are:
6. Result Discussion
Figure 2,
Figure 3,
Figure 4 and
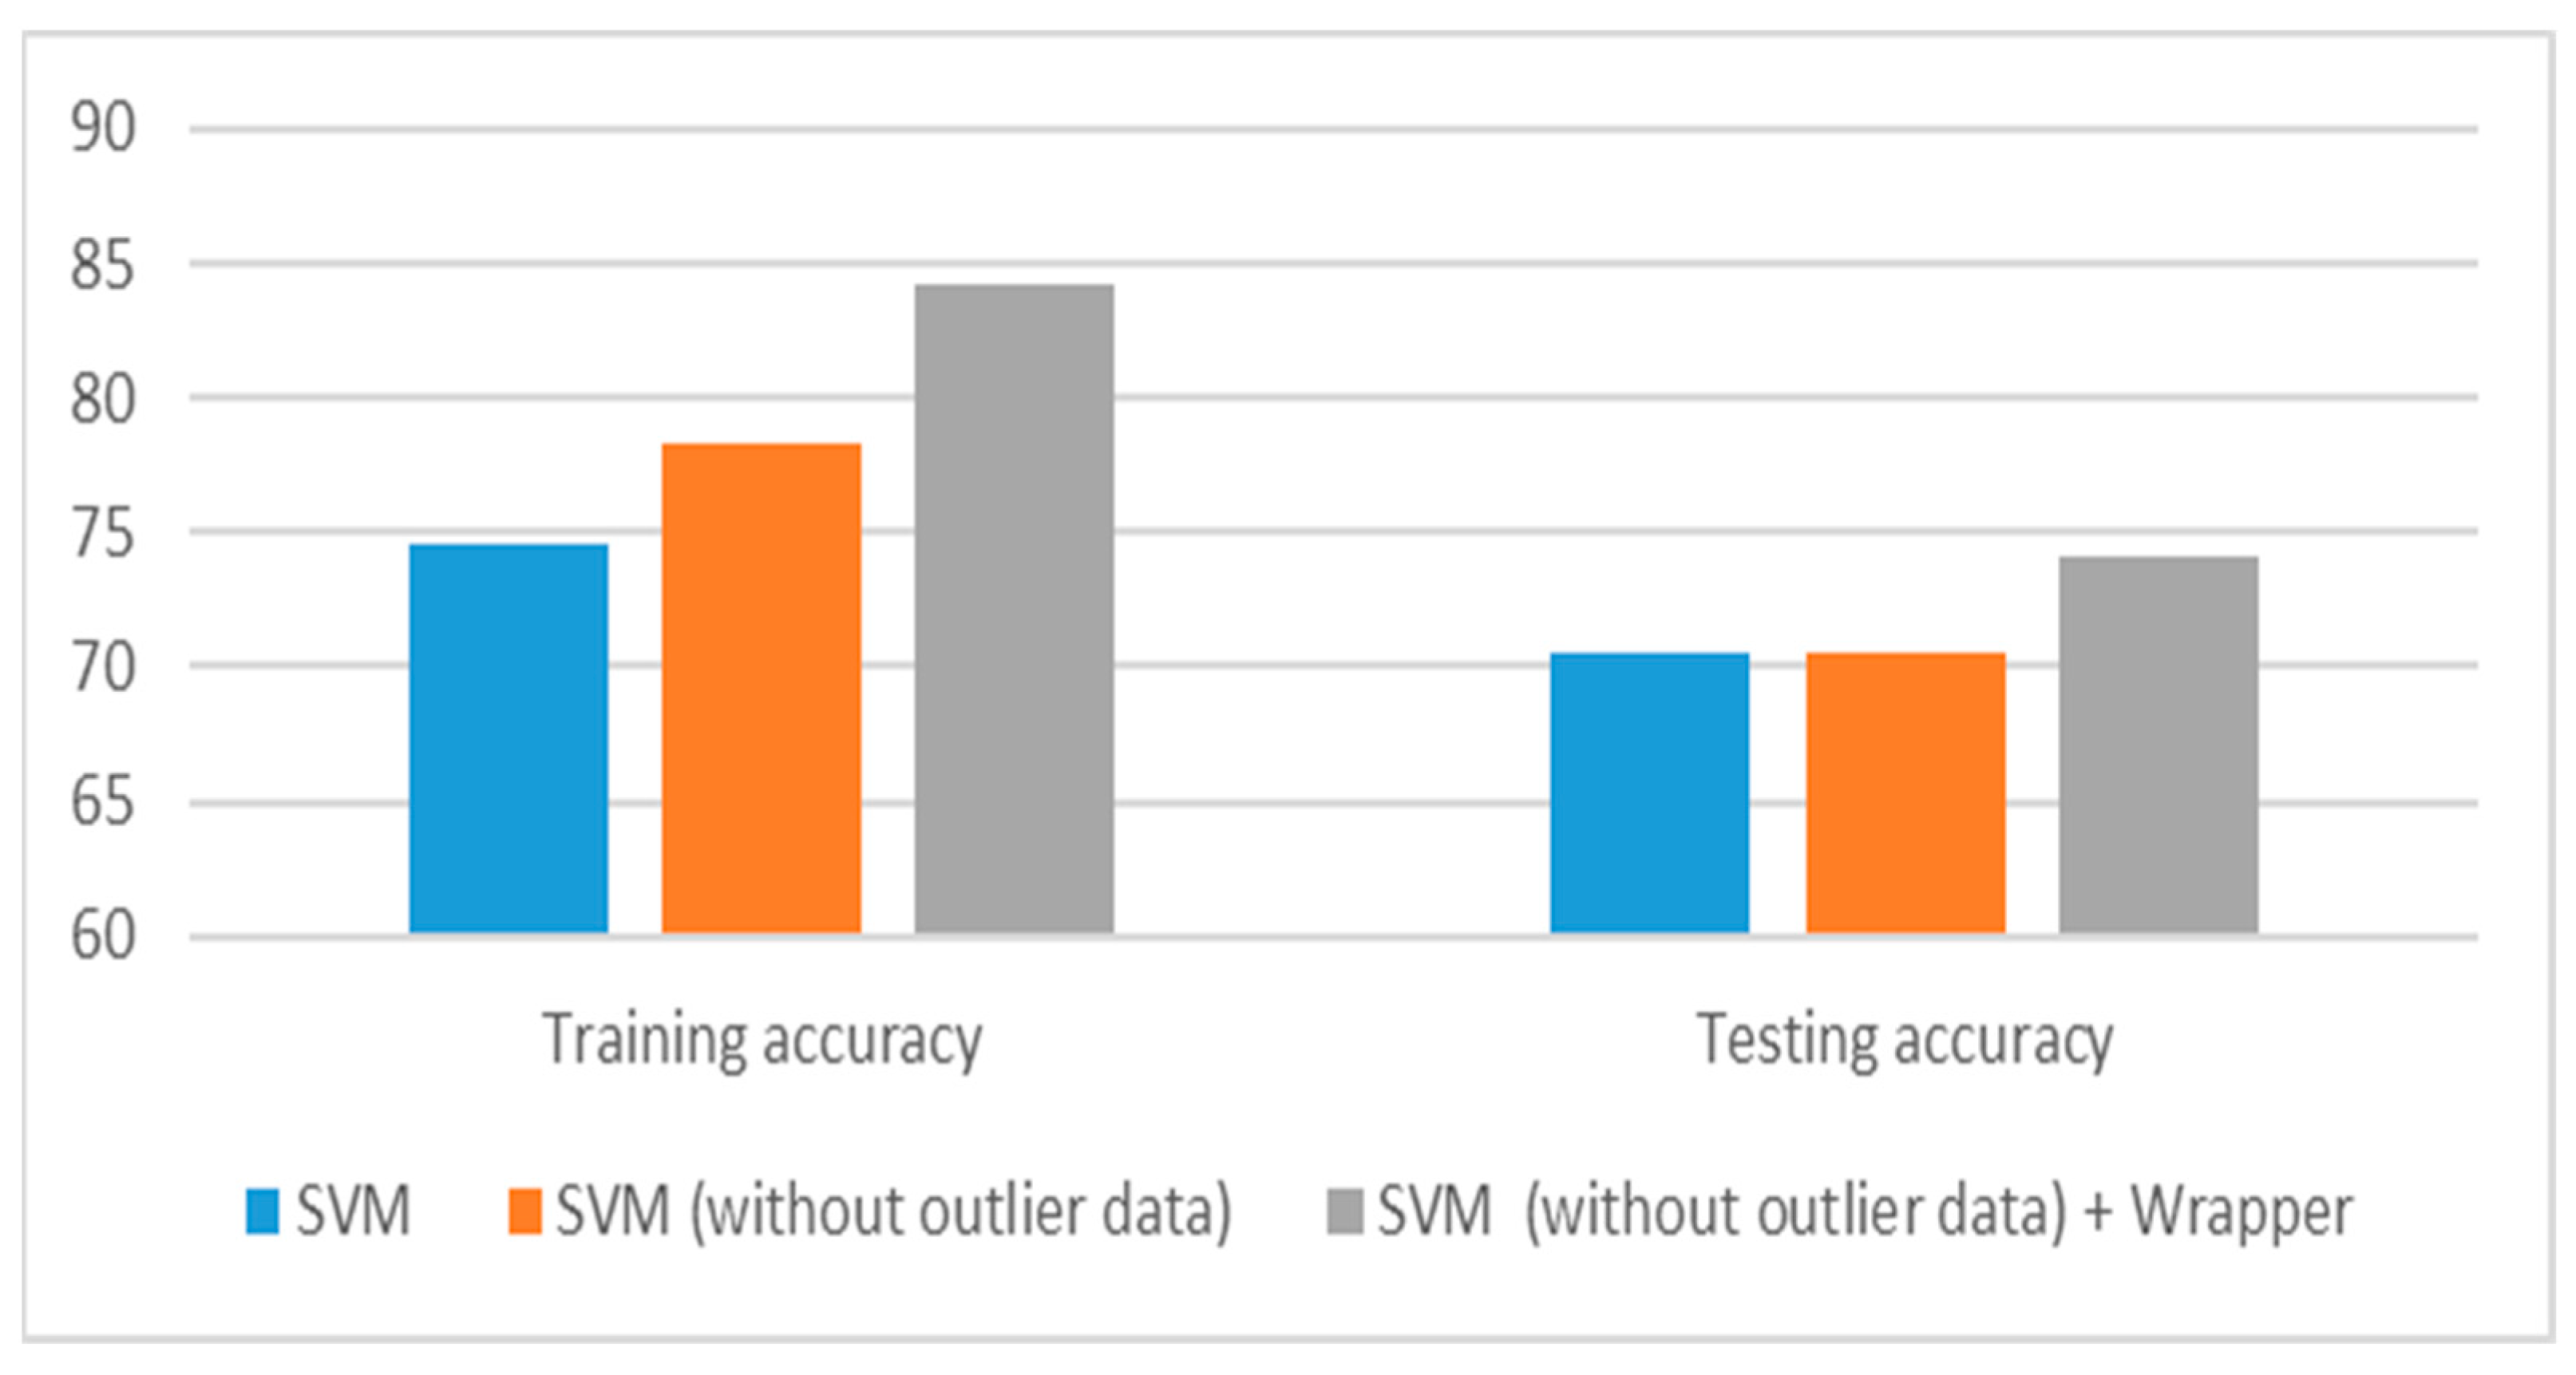
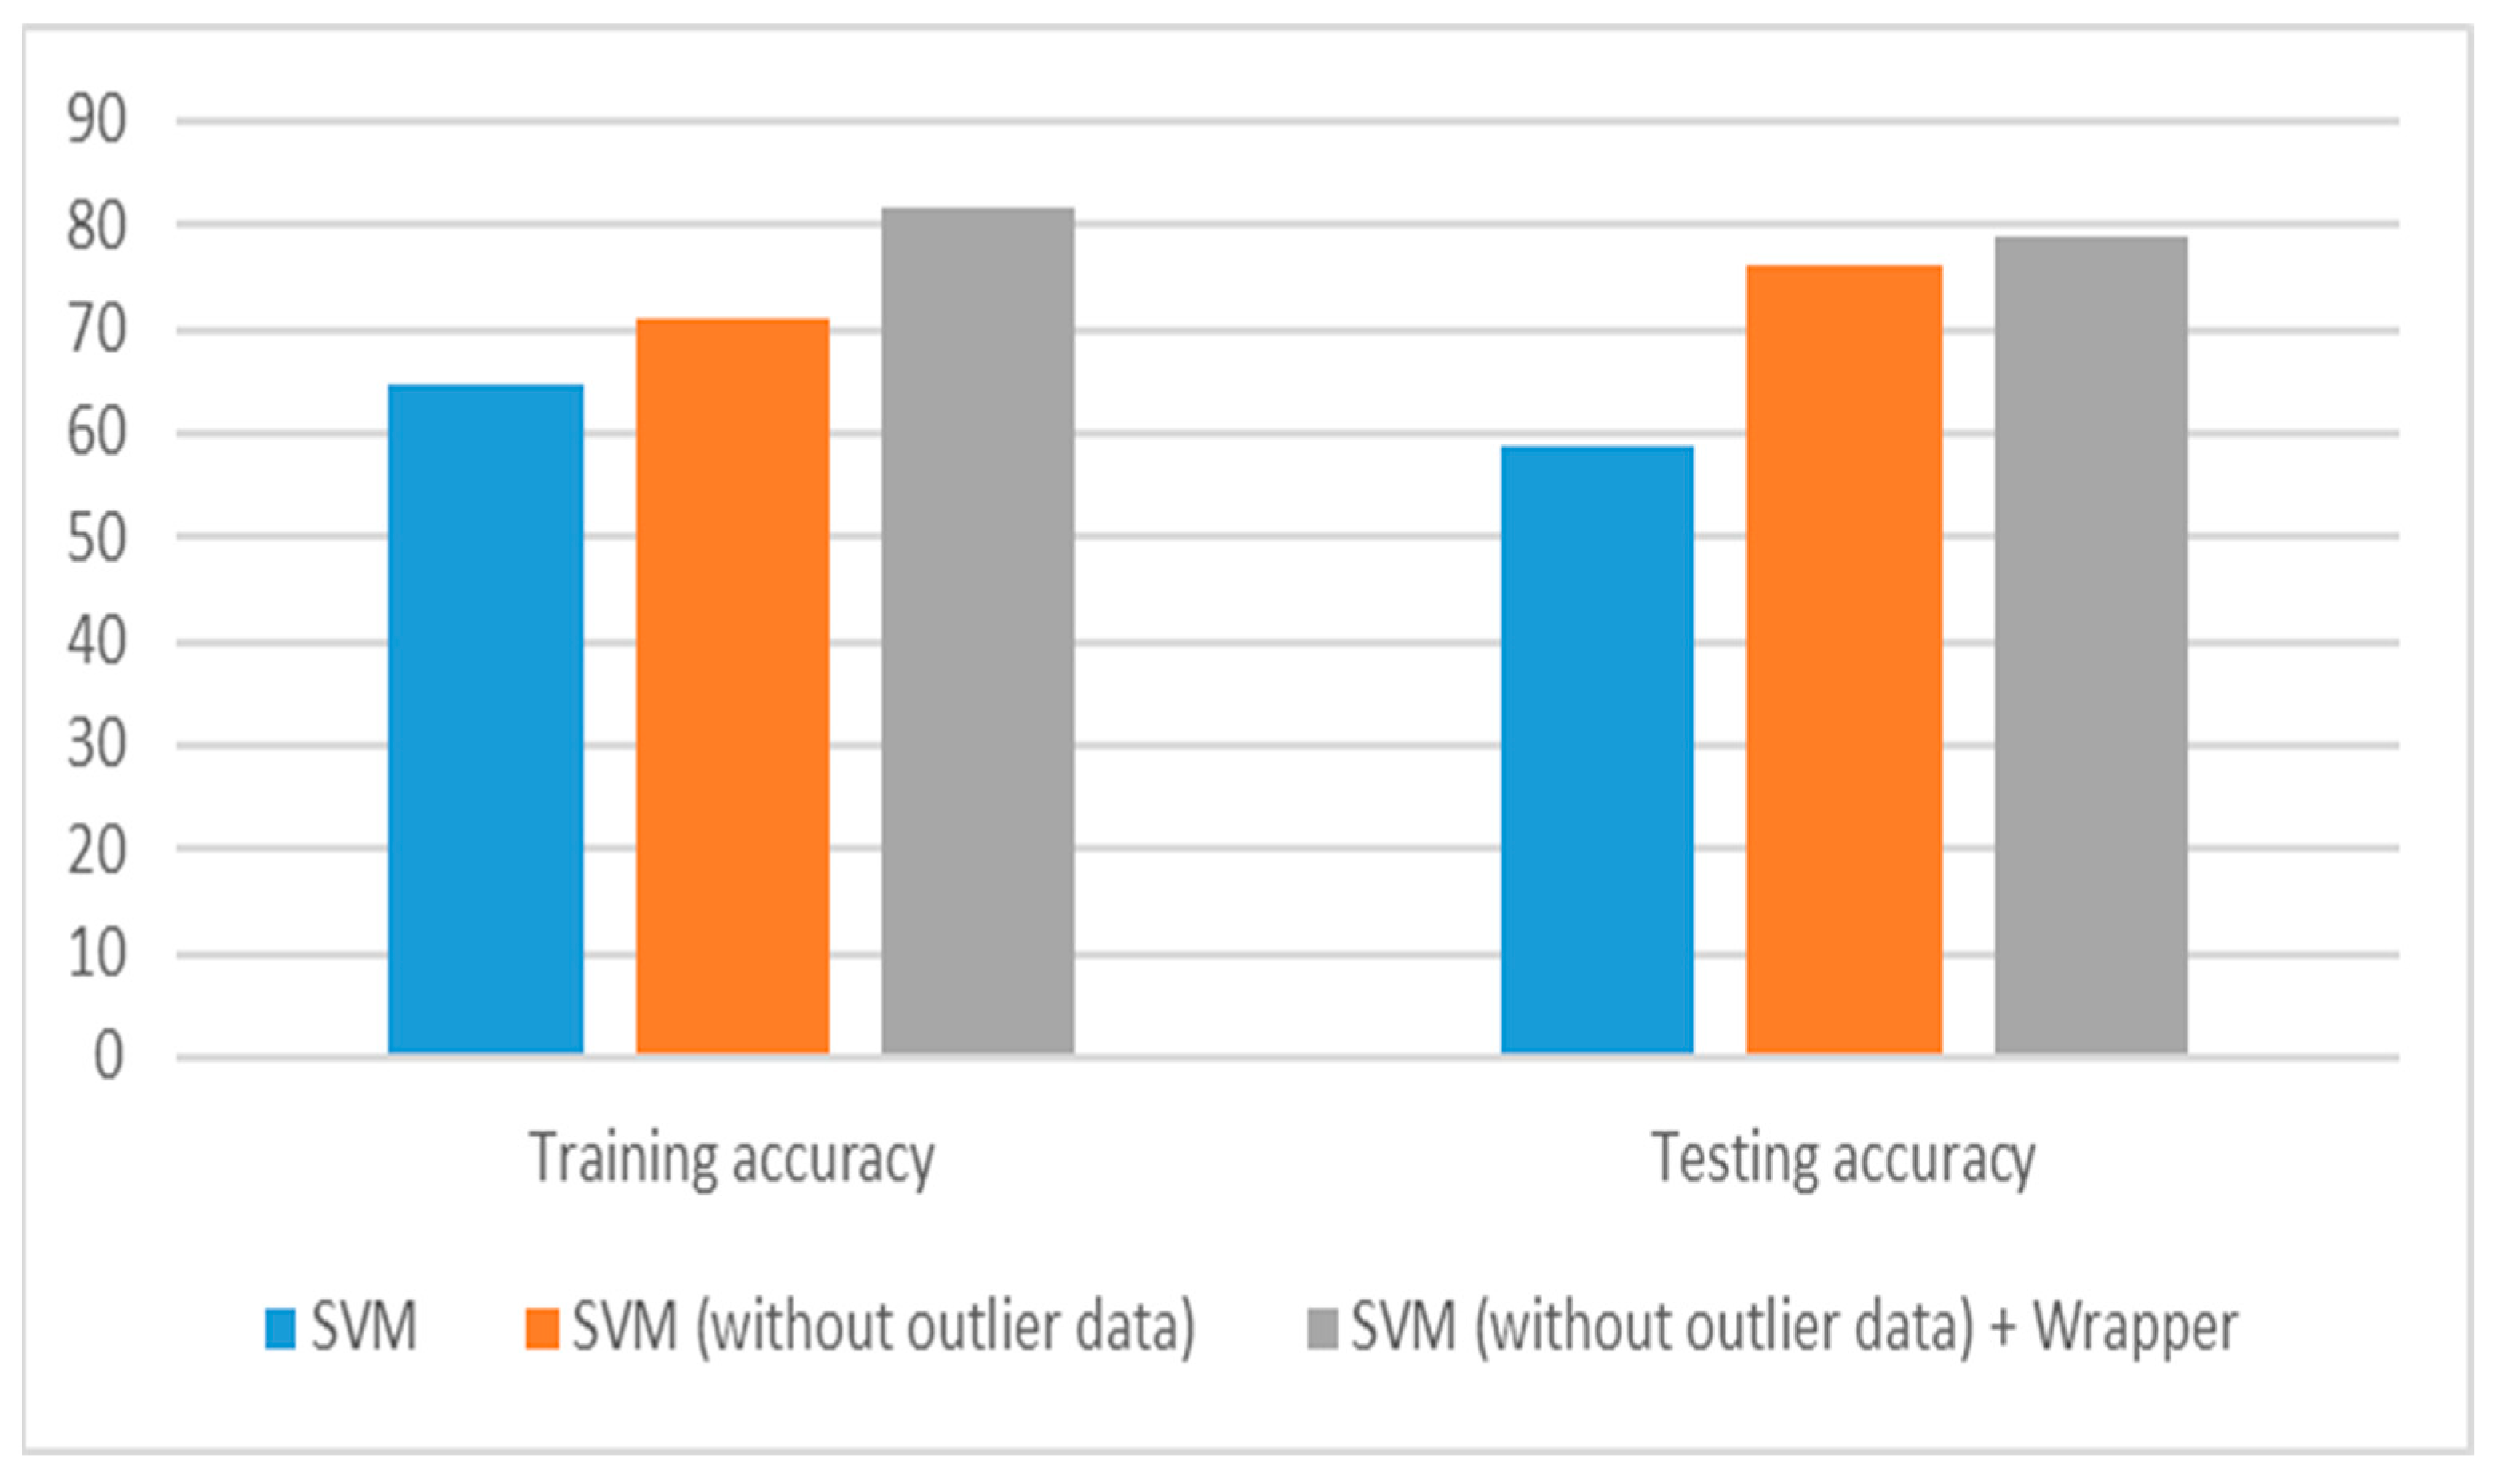
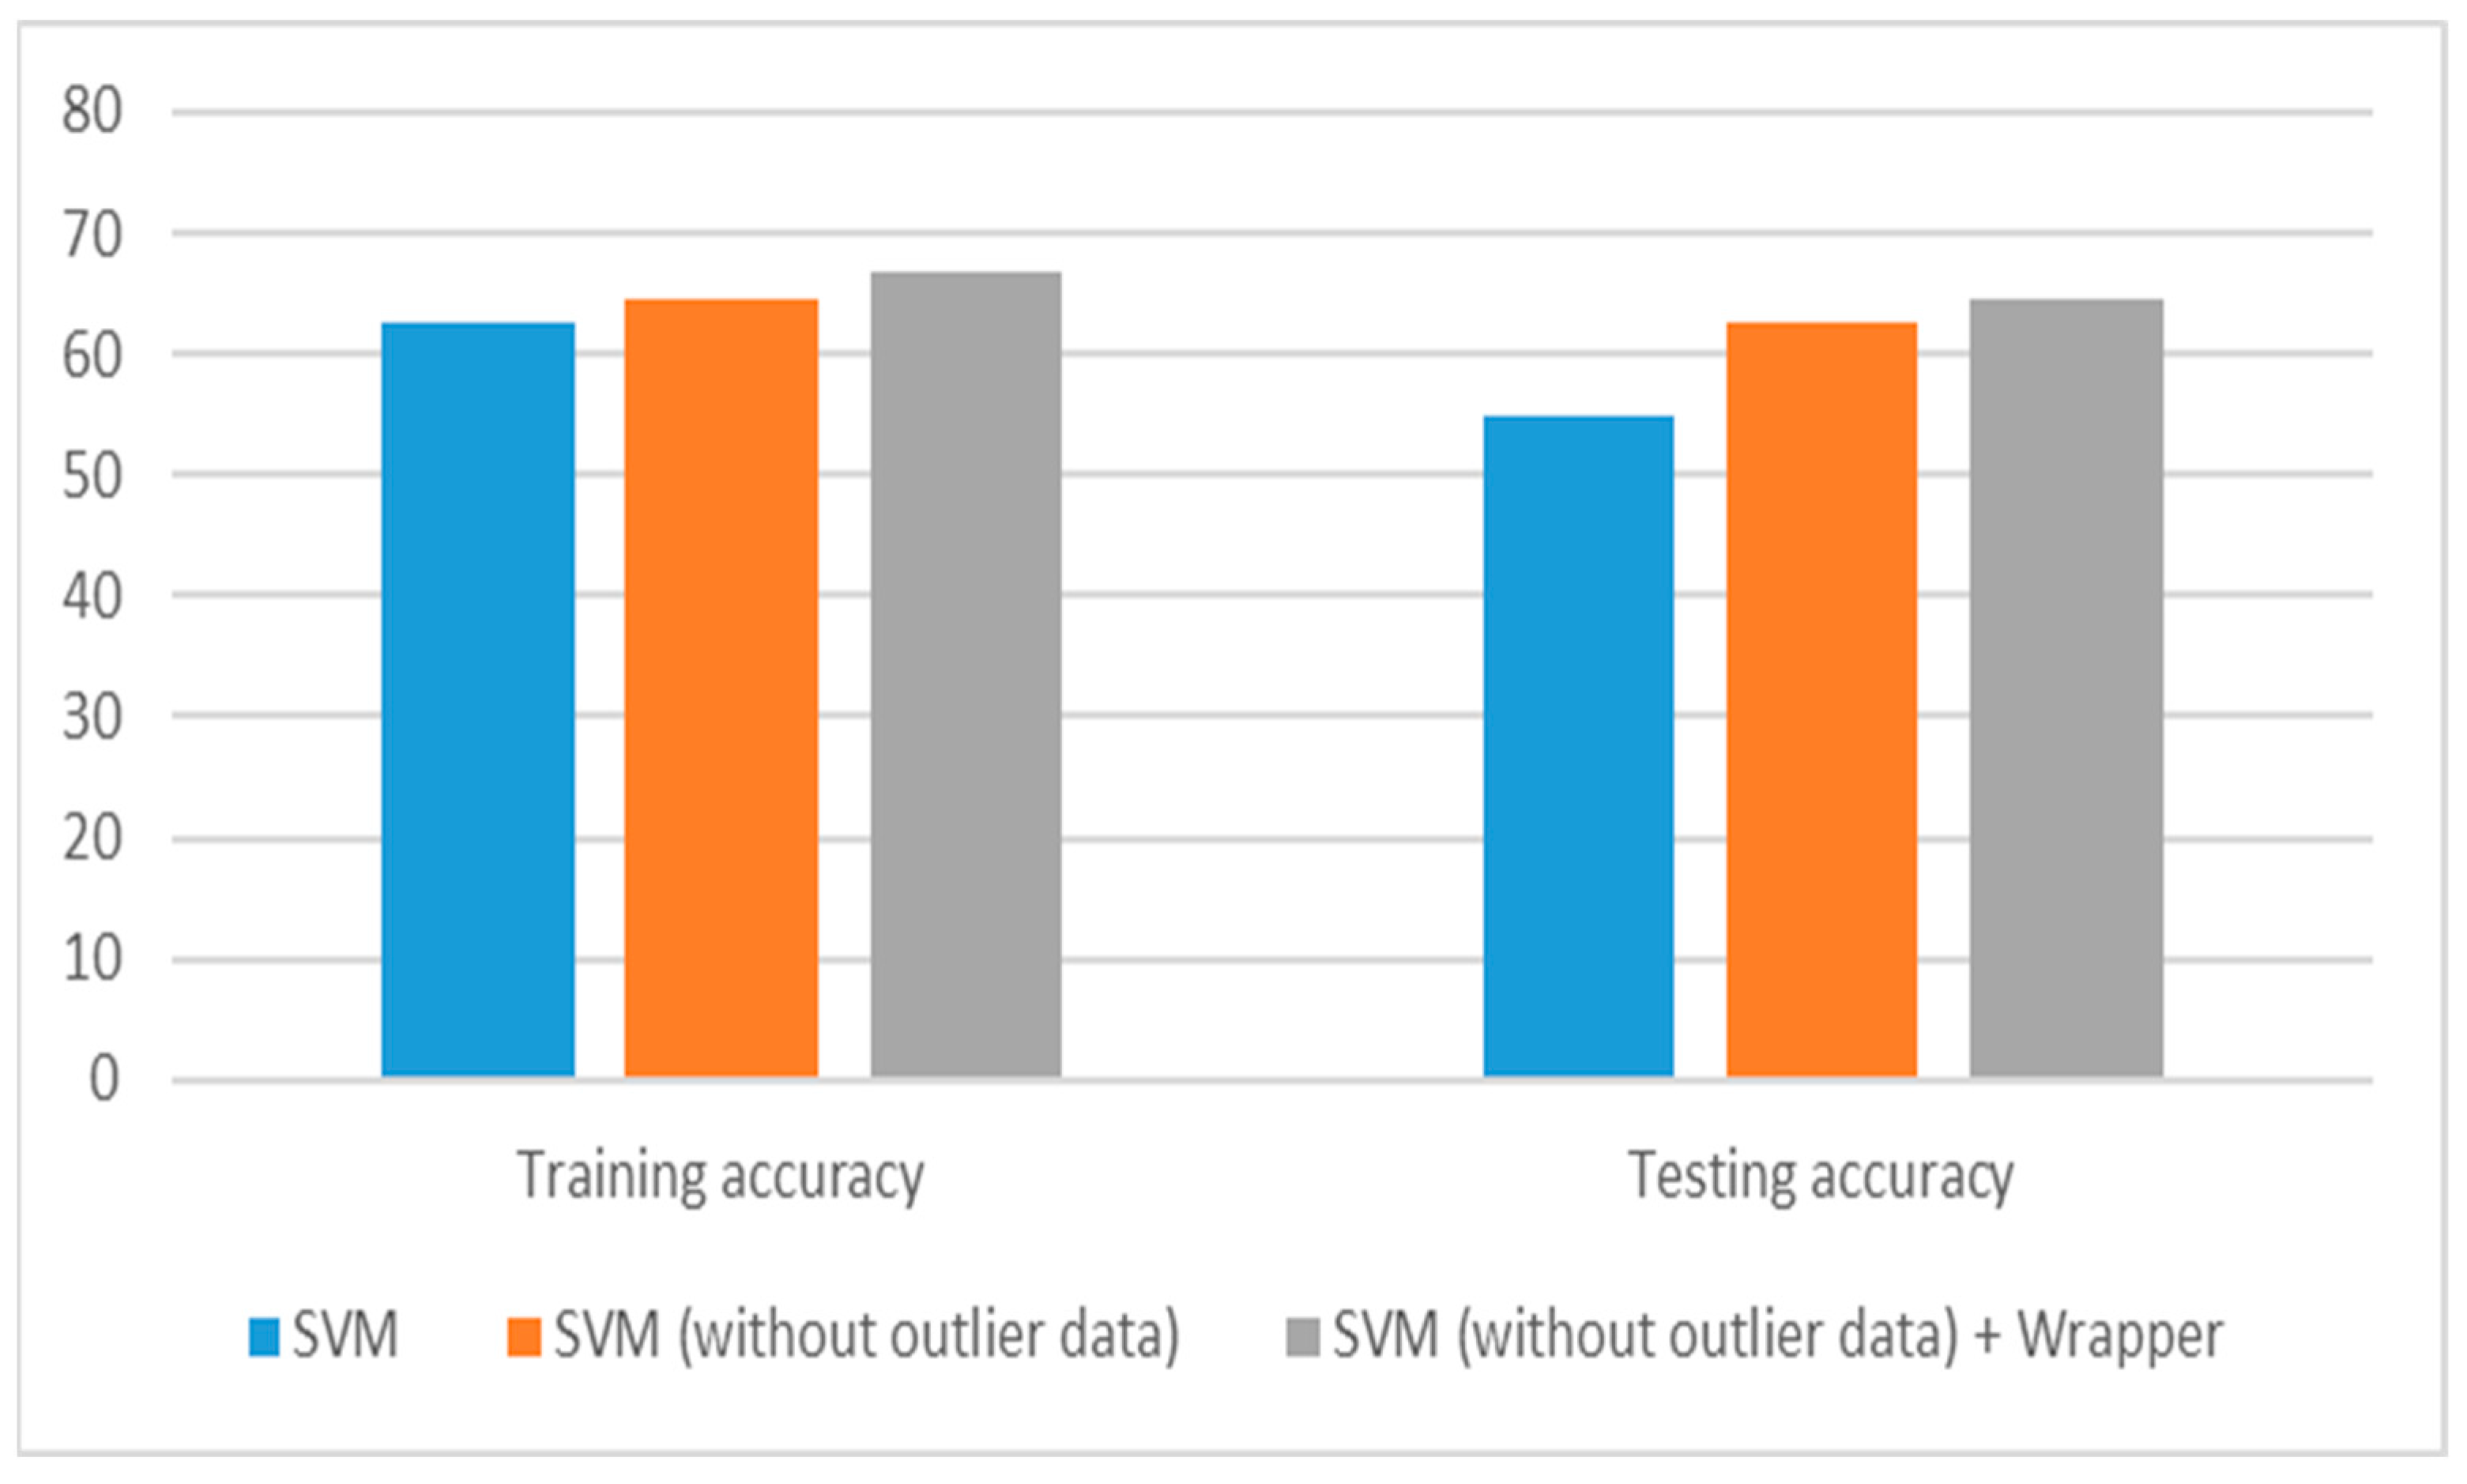
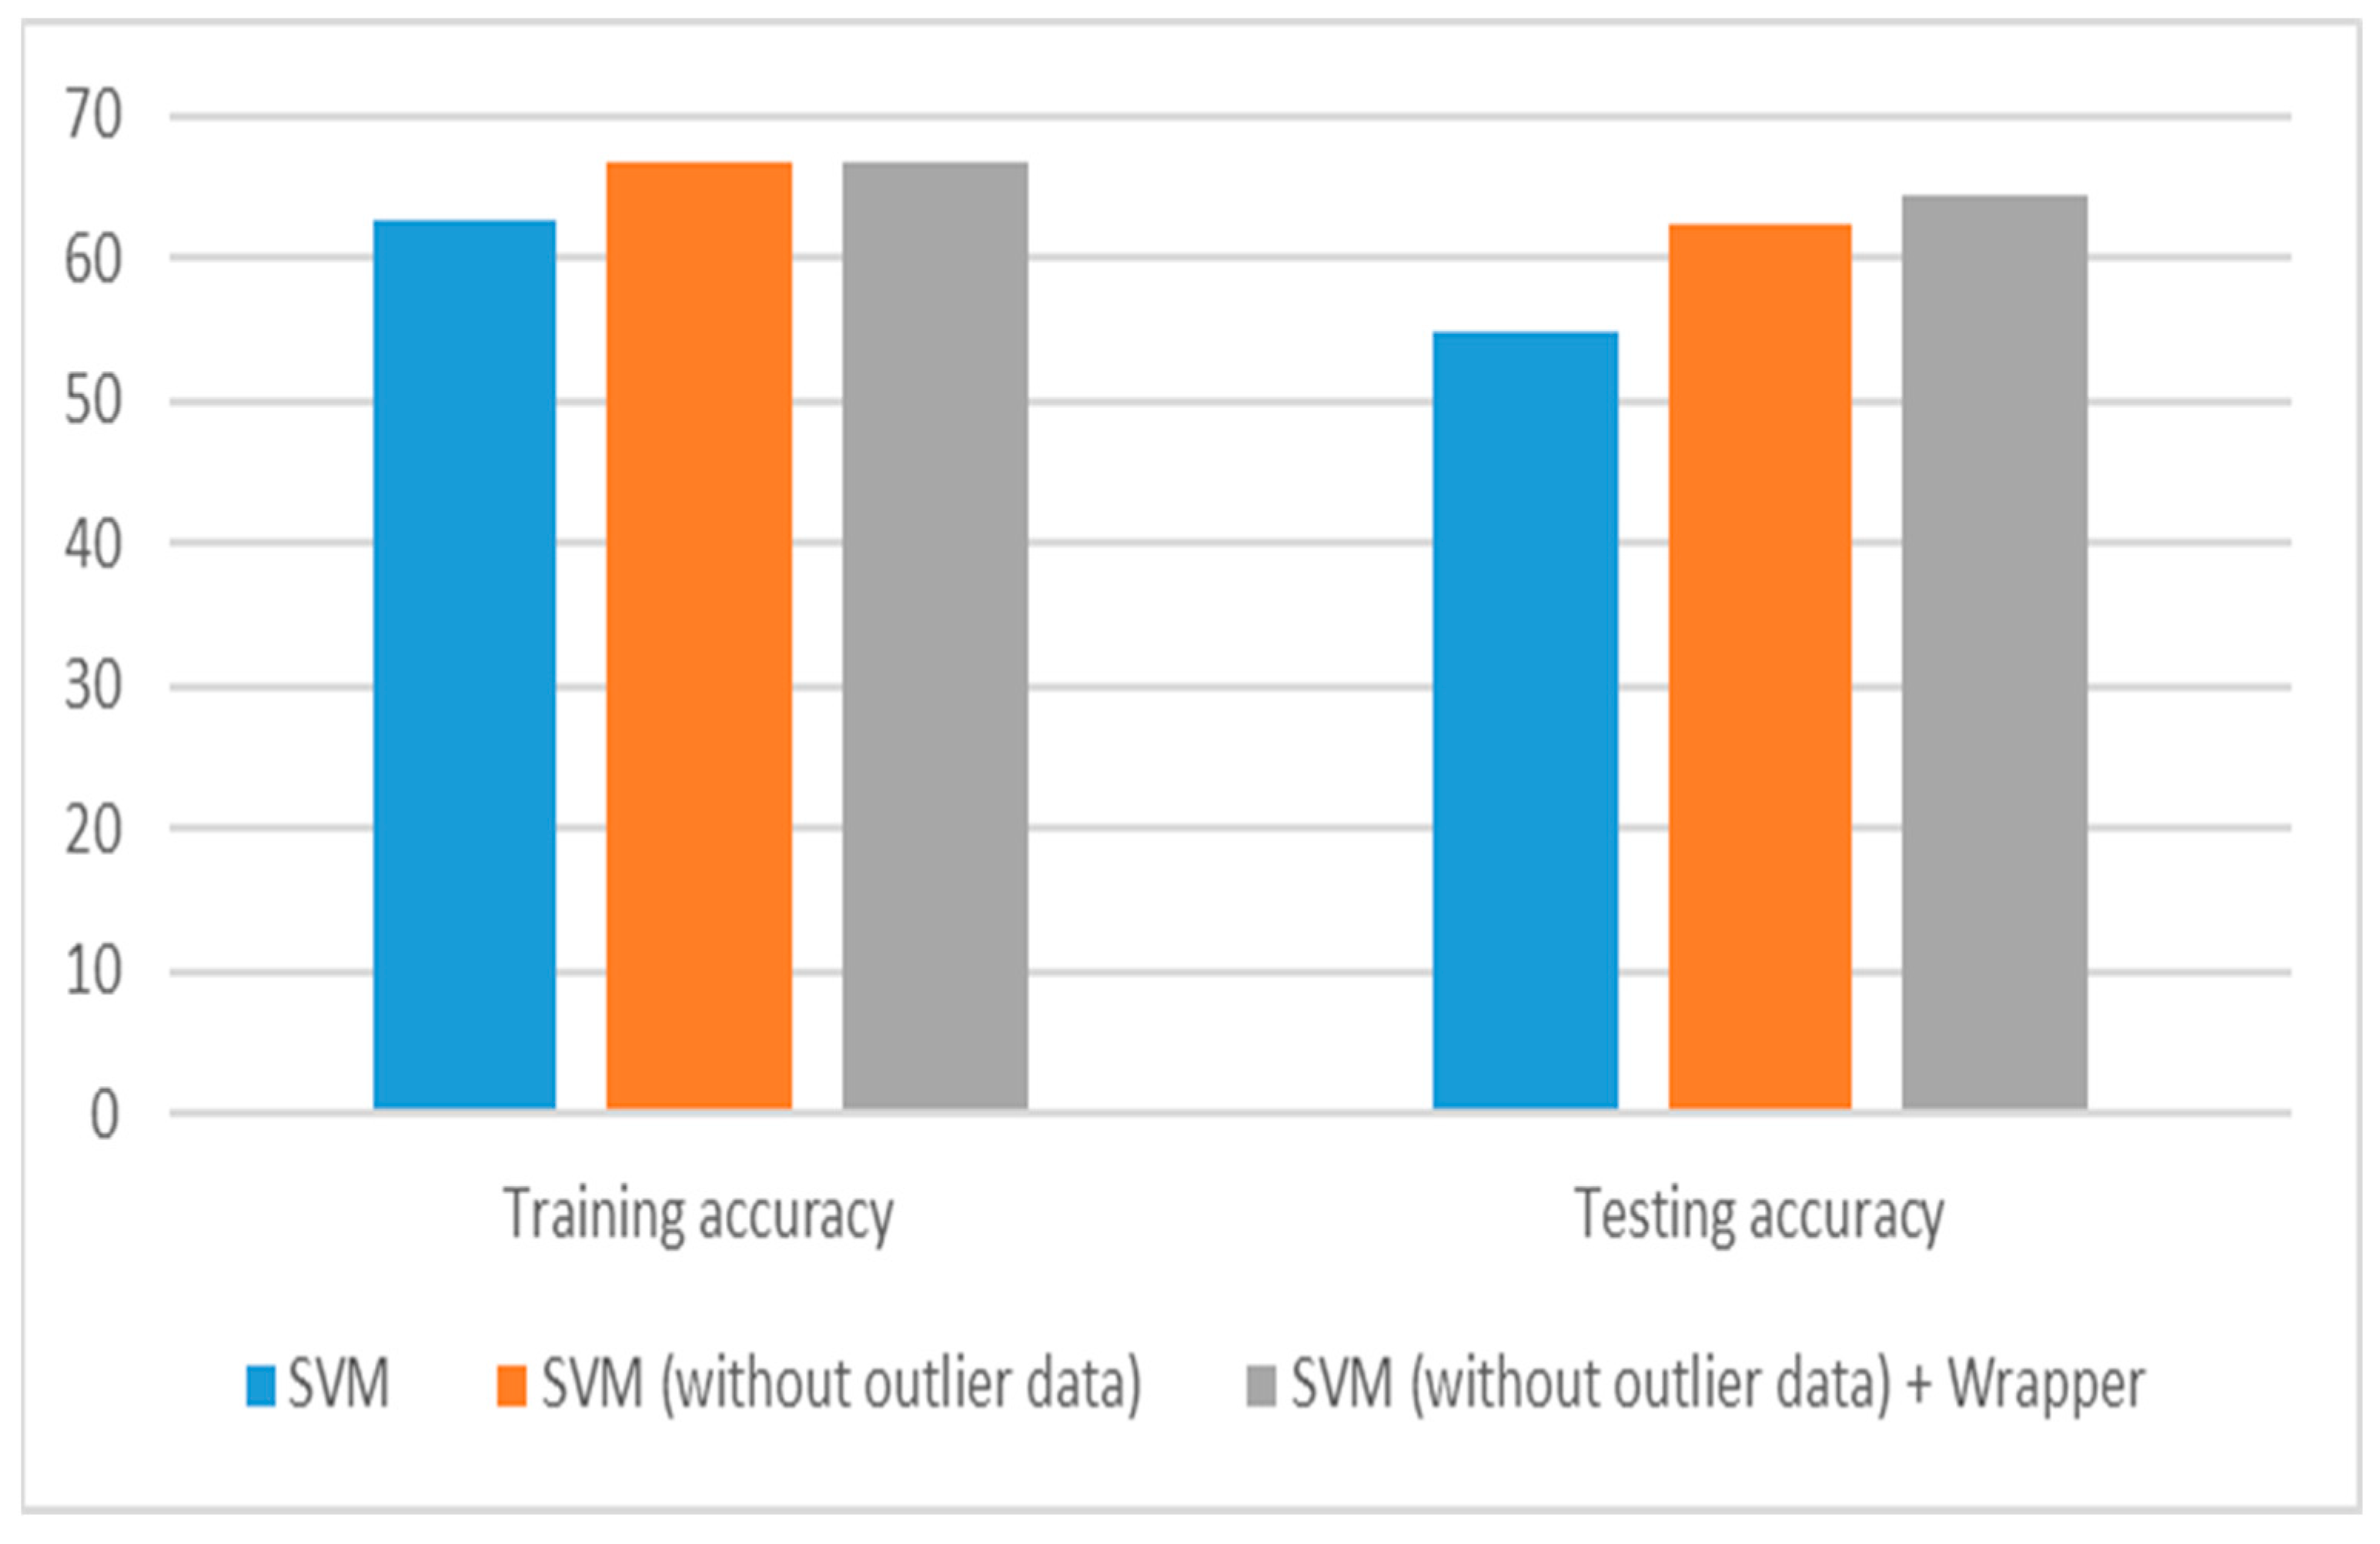
Figure 5 present the effectiveness of the outlier detection and extraction of the effective features of the proposed approach, which shows that these steps have contributed to the increase in the accuracy of the classification. The results also show that the accuracy rate of the predicted values was almost 80% in the experimental results, indicating that the values of the incorrectly classified instance could not fit the classifier. This knowledge can help countries that are incorrectly classified to make decisions that encourage access to corrected values, such as increasing the daily test rate.
7. Conclusions
COVID-19 is a highly infectious virus that can be transmitted by droplets, contact, aerosol, and fecal-oral infection, making it difficult to prevent and control globally. As a result of the increased risk of transmission caused by the movement of people, there is an urgent need to use artificial intelligence and machine learning to predict COVID-19. This paper presents a proposed machine learning model that analyzes several data collected by COVID-19 on countries, such as total infected cases, total deaths, critical cases, daily infected cases, total recovered cases, and others. This paper will help countries make decisions that encourage access to corrected values, such as by increasing the daily test rate. The proposed model is based on the extraction of the most significant features and the classification of the data. The Support Vector Machine (SVM) classifier with an extraction feature wrapper algorithm has shown that it is more capable of fitting and predicting data with the highest accuracy of almost 80 percent compared to other classification algorithms.
In the future, missing data will be considered to complete the experimental dataset without ignoring the empty field records. Deep learning will also be considered to predict overall infected cases, total deaths, critical cases, and recovery cases compared to the SVM algorithm.
Author Contributions
Conceptualization, F.K.K. and D.S.K.; methodology, F.K.K. and D.S.K.; validation, D.S.K., F.K.K., M.M.D. and M.A.E.-R.; analysis, D.S.K., F.K.K., M.M.D. and M.A.E.-R.; writing—original draft preparation, D.S.K., F.K.K., M.M.D. and M.A.E.-R.; writing—review and editing, D.S.K., F.K.K., M.M.D. and M.A.E.-R.; visualization, D.S.K., F.K.K., M.M.D. and M.A.E.-R.; supervision, D.S.K., F.K.K., M.M.D. and M.A.E.-R. All authors have read and agreed to the published version of the manuscript.
Funding
This project is funded by Princess Nourah bint Abdulrahman University Researchers Supporting Project number (PNURSP2022R300), Princess Nourah bint Abdulrahman University, Riyadh, Saudi Arabia.
Conflicts of Interest
The authors declare no conflict of interest.
References
- World Health Organaization. Available online: https://www.who.int/emergencies/diseases/novel-coronavirus-2019 (accessed on 23 March 2020).
- Lu, R.; Zhao, X.; Li, J.; Niu, P.; Yang, B.; Wu, H.; Wang, W.; Song, H.; Huang, B.; Zhu, N.; et al. Genomic characterization and epidemiology of 2019 novel coronavirus: Implications for virus origins and receptor binding. Lancet 2020, 395, 565–574. [Google Scholar] [CrossRef] [Green Version]
- Wu, F.; Zhao, S.; Yu, B.; Chen, Y.-M.; Wang, W.; Hu, Y.; Song, Z.-G.; Tao, Z.-W.; Tian, J.-H.; Pei, Y.-Y.; et al. Complete genome characterization of a novel coronavirus associated with severe human respiratory disease in Wuhan, China. bioRxiv 2020. bioRxiv:20.01.24.919183. [Google Scholar] [CrossRef] [Green Version]
- Bastola, A.; Sah, R.; Rodriguez-Morales, A.J.; Lal, B.K.; Jha, R.; Ojha, H.C.; Shrestha, B.; Chu, D.K.W.; Poon, L.L.M.; Costello, A.; et al. The first 2019 novel coronavirus case in Nepal. Lancet Infect. Dis. 2020, 20, 279–280. [Google Scholar] [CrossRef] [Green Version]
- Rothe, C.; Schunk, M.; Sothmann, P.; Bretzel, G.; Froeschl, G.; Wallrauch, C.; Zimmer, T.; Thiel, V.; Janke, C.; Guggemos, W.; et al. Transmission of 2019-nCoV Infection from an Asymptomatic Contact in Germany. N. Engl. J. Med. 2020, 382, 970–971. [Google Scholar] [CrossRef] [Green Version]
- Rodriguez-Morales, A.J.; Bonilla-Aldana, D.K.; Balbin-Ramon, G.J.; Paniz-Mondolfi, A.; Rabaan, A.; Sah, R.; Pagliano, P.; Esposito, S. History is repeating itself, a probable zoonotic spillover as a cause of an epidemic: The case of 2019 novel Coronavirus. Inf. Med. 2020, 28, 3–5. [Google Scholar]
- Ahmad, T.; Khan, M.; Haroon; Musa, T.H.; Nasir, S.; Hui, J.; Bonilla-Aldana, D.; Rodriguez-Morales, A.J. COVID-19: Zoonotic aspects. Travel Med. Infect. Dis. Elsevier Febr. 2020, 36, 101607. [Google Scholar] [CrossRef]
- Zhao, S.; Lin, Q.; Ran, J.; Musa, S.S.; Yang, G.; Wang, W.; Lou, Y.; Gao, D.; Yang, L.; He, D.; et al. Preliminary estimation of the basic reproduction number of novel coronavirus (2019-nCoV) in China, from 2019 to 2020: A data-driven analysis in the early phase of the outbreak. Int. J. Infect. Dis. 2020, 92, 214–217. [Google Scholar] [CrossRef] [Green Version]
- Cascella, M.; Rajnik, M.; Aleem, A.; Dulebohn, S.; Napoli, R. Features, Evaluation and Treatment Coronavirus (COVID-19); StatPearls Publishing: Treasure Island, FL, USA, 2020. [Google Scholar]
- Mohammed, M.A.; Abdulkareem, K.H.; Al-Waisy, A.S.; Mostafa, S.A.; Al-Fahdawi, S.; Dinar, A.M.; Alhakami, W.; Baz, A.; Al-Mhiqani, M.N.; Alhakami, H.; et al. Benchmarking Methodology for Selection of Optimal COVID-19 Diagnostic Model Based on Entropy and TOPSIS Methods. IEEE Access 2020, 8, 99115–99131. [Google Scholar] [CrossRef]
- Sohrabi, C.; Alsafi, Z.; O’Neill, N.; Khan, M.; Kerwan, A.; Al-Jabir, A.; Iosifidis, C.; Agha, R. World Health Organization declares global emergency: A review of the 2019 novel coronavirus (COVID-19). Int. J. Surg. 2020, 76, 71–76. [Google Scholar] [CrossRef]
- Bhargavi, P.; Jyothi, S. Applying Naive Bayes Data Mining Technique for Classification of Agricultural Land Soils. Int. J. Comput. Sci. Netw. Secur. 2009, 9, 117–122. [Google Scholar]
- Pham, T.A.; Ly, H.-B.; Tran, V.Q.; Giap, L.V.; Vu, H.-L.T.; Duong, H.-A.T. Prediction of Pile Axial 414 Bearing Capacity Using Artificial Neural Network and Random Forest. Appl. Sci. 2020, 10, 1871. [Google Scholar] [CrossRef] [Green Version]
- Breiman, L. Random Forests. Mach. Learn. 2001, 45, 5–32. [Google Scholar] [CrossRef] [Green Version]
- Li, Y.; Wu, H.A. Clustering Method Based on K-Means Algorithm. Phys. Procedia 2012, 25, 1104–1109. [Google Scholar] [CrossRef] [Green Version]
- Dessouky, M.M.; Elrashidy, M.A.; Abdelkader, H.M. Selecting and Extracting Effective Features for Automated Diagnosis of Alzheimer’s Disease. Int. J. Comput. Appl. 2013, 81, 17–28. [Google Scholar]
- Gnanambal, S.; Thangaraj, M.; Meenatchi, V.T.; Gayathri, V. Classification Algorithms with Attribute Selection: An evaluation study using WEKA. Int. J. Adv. Netw. Appl. 2018, 9, 3640–3644. [Google Scholar]
- Worldometers Web Site. Available online: https://www.worldometers.info/ (accessed on 10 April 2020).
- United Nations Development Programme Website. Available online: http://hdr.undp.org/en/data (accessed on 10 April 2020).
- Wikipedia Website. Available online: https://en.wikipedia.org/wiki/World_Tourism_rankings (accessed on 10 April 2020).
Figure 1.
Block diagram of the proposed approach.
Figure 1.
Block diagram of the proposed approach.
Figure 2.
The classification accuracy of the SVM algorithm through the proposed system phases to predict the total infected cases.
Figure 2.
The classification accuracy of the SVM algorithm through the proposed system phases to predict the total infected cases.
Figure 3.
The classification accuracy of the SVM algorithm through the proposed system phases to predict the total deaths.
Figure 3.
The classification accuracy of the SVM algorithm through the proposed system phases to predict the total deaths.
Figure 4.
The classification accuracy of the SVM algorithm through the proposed system phases to predict the total critical cases.
Figure 4.
The classification accuracy of the SVM algorithm through the proposed system phases to predict the total critical cases.
Figure 5.
The classification accuracy of the SVM algorithm through the proposed system phases to predict the total recovery cases.
Figure 5.
The classification accuracy of the SVM algorithm through the proposed system phases to predict the total recovery cases.
Table 1.
The statistical description of the dataset.
Table 1.
The statistical description of the dataset.
| Attribute Name | Minimum Value | Maximum Value | Mean Value | Standard
Deviation | Missing Values |
|---|
| Total Cases |
11
| 465,689 | 28,980 | 72,931 | 0% |
| New Cases |
0
| 30,659 |
1458
|
4412
| 0% |
| Total Deaths |
0
| 18,279 |
1767
|
4347
| 0% |
| New Deaths |
0
|
1757
|
129
|
340
| 0% |
| Total Recovered | 0 | 77,370 | 6607 | 15,803 | 0% |
| Active Cases | 8 | 423,985 | 20,605 | 62,124 | 0% |
| Serious Critical |
0
|
9959
|
899
|
2111
| 0% |
| Total Cases/1M pop |
0.3
|
3277
|
527
|
757
| 0% |
| Deaths/1M pop |
0
|
330
|
31
|
70
| 0% |
| Total Tests |
19
| 2,350,552 | 207,246 | 404,719 | 45% |
| Tests/1M pop | 95 | 59,967 |
6454
| 10,118 | 45% |
| International tourist arrivals (million) per year | 0.31 | 89.4 | 20.55 | 22.19 | 76% |
| Employment in services (% of total employment) |
25.6
|
88
|
64.57
|
13.99
| 23% |
| Life expectancy at birth | 61.2 | 84.7 | 77.41 | 5.57 | 22% |
| Median age (years) | 18.7 | 48.4 | 35.631 | 7.73 | 22% |
| Population density (P/Km2) |
3
|
8358
|
458.39
|
1526.27
| 22% |
| Population, ages 65 and older (millions) |
0
|
155.9
|
10.563
|
25.201
| 22% |
| Population, total (millions) |
0.1
|
1427.6
|
98.55
|
270.1
| 22% |
| Sex ratio at birth (male to female births) |
1.01
|
1.13
|
1.05
|
0.018
| 22% |
Table 2.
The statistical description for the clusters of classified features.
Table 2.
The statistical description for the clusters of classified features.
| Classified Feature | Cluster 1 (L1) | Cluster 2 (L2) | Cluster 3 (L3) | Cluster 4 (L4) | Cluster 5 (L5) |
|---|
| No. | Min | Max | No. | Min | Max | No. | Min | Max | No. | Min | Max | No. | Min | Max |
|---|
| Total Cases | 22 | 11 | 2558 | 10 | 2561 | 7634 | 10 | 7637 | 25,423 | 6 | 25,426 | 76,231 | 3 | 76,233 | 465,689 |
| Total Deaths | 9 | 0 | 98 | 27 | 101 | 298 | 6 | 300 | 997 | 7 | 999 | 2989 | 2 | 2991 |
18,279
|
| Total Recovered | 26 | 0 | 421 | 4 | 425 | 1266 | 10 | 1268 | 4223 | 4 | 4224 | 12,663 | 7 | 12,665 | 77,370 |
| Serious Critical | 21 | 0 | 54 | 11 | 55 | 161 | 9 | 163 | 543 | 6 | 544 | 1627 | 4 | 1630 | 9959 |
Table 3.
Comparison among classification algorithms during the training phase to predict the total infected cases.
Table 3.
Comparison among classification algorithms during the training phase to predict the total infected cases.
| Algorithm Name | Precision | Recall | F-Measure | MCC | ROC | Accuracy | Incorrectly Classified Instance |
|---|
| Naïve Bayes | 65.6 | 66.7 | 64.9 | 52.6 | 91.7 | 66.66 | 17 |
| ANN | 85.3 | 84.3 | 83.9 | 79.2 | 93.6 | 84.313 | 8 |
| SVM | 71.1 | 74.5 | 71.5 | 0.607 | 0.942 | 74.51 | 13 |
| Random Forest | 98.1 | 98 | 98 | 0.971 | 99.9 | 98.03 | 1 |
Table 4.
Comparison among classification algorithms during the training phase to predict the total deaths.
Table 4.
Comparison among classification algorithms during the training phase to predict the total deaths.
| Algorithm Name | Precision | Recall | F-Measure | MCC | ROC | Accuracy | Incorrectly Classified Instance |
|---|
| Naïve Bayes | 75.6 | 68.6 | 70.4 | 0.588 | 87.5 | 68.62 | 16 |
| ANN | 71.1 | 74.5 | 71.5 | 0.607 | 0.942 | 74.51 | 13 |
| SVM | 63.1 | 64.7 | 54.7 | 0.372 | 65.5 | 64.7 | 18 |
| Random Forest | 100 | 100 | 100 | 100 | 100 | 100 | 0 |
Table 5.
Comparison among classification algorithms during the training phase to predict the total critical cases.
Table 5.
Comparison among classification algorithms during the training phase to predict the total critical cases.
| Algorithm Name | Precision | Recall | F-Measure | MCC | ROC | Accuracy | Incorrectly Classified Instance |
|---|
| Naïve Bayes | 69.4 | 64.7 | 64 | 0.495 | 88.5 | 64.71 | 18 |
| ANN | 94.6 | 94.1 | 93.5 | 0.914 | 97.7 | 94.1 | 3 |
| SVM | 62.8 | 62.7 | 52.3 | 0.359 | 67 | 62.75 | 19 |
| Random Forest | 98.1 | 98 | 98 | 0.968 | 99.8 | 98.04 | 1 |
Table 6.
Comparison among classification algorithms during the training phase to predict the total recovery cases.
Table 6.
Comparison among classification algorithms during the training phase to predict the total recovery cases.
| Algorithm Name | Precision | Recall | F-Measure | MCC | ROC | Accuracy | Incorrectly Classified Instance |
|---|
| Naïve Bayes | 69.4 | 64.7 | 64 | 0.495 | 88.5 | 64.7 | 18 |
| ANN | 94.6 | 94.1 | 93.5 | 91.4 | 97.7 | 94.1 | 3 |
| SVM | 62.8 | 62.7 | 52.3 | 0.359 | 67 | 62.74 | 19 |
| Random Forest | 98.1 | 98 | 98 | 96.8 | 99.8 | 98.03 | 1 |
Table 7.
Comparison among classification algorithms using 10-fold cross-validation testing to predict the total infected cases.
Table 7.
Comparison among classification algorithms using 10-fold cross-validation testing to predict the total infected cases.
| Algorithm Name | Precision | Recall | F-Measure | MCC | ROC | Accuracy |
|---|
| Naïve Bayes | 54.1 | 54.9 | 53.9 | 0.381 | 77 | 54.9 |
| ANN | 59.4 | 62.7 | 60.8 | 0.456 | 78.9 | 62.74 |
| SVM | 68.1 | 70.6 | 67.9 | 0.579 | 80.6 | 70.588 |
| Random Forest | 51.5 | 49 | 49.8 | 0.298 | 71.9 | 49.01 |
Table 8.
Comparison among classification algorithms using 10-fold cross-validation testing to predict the total deaths.
Table 8.
Comparison among classification algorithms using 10-fold cross-validation testing to predict the total deaths.
| Algorithm Name | Precision | Recall | F-Measure | MCC | ROC | Accuracy |
|---|
| Naïve Bayes | 58.6 | 54.9 | 55.2 | 0.411 | 69.3 | 54.9 |
| ANN | 47.1 | 47.1 | 46.8 | 0.217 | 66.6 | 47.1 |
| SVM | 68.1 | 76.3 | 69.8 | 0.448 | 68.9 | 76.3 |
| Random Forest | 39.6 | 49 | 43.7 | 0.142 | 67 | 49 |
Table 9.
Comparison among classification algorithms using 10-fold cross-validation testing to predict the total critical cases.
Table 9.
Comparison among classification algorithms using 10-fold cross-validation testing to predict the total critical cases.
| Algorithm Name | Precision | Recall | F-Measure | MCC | ROC | Accuracy |
|---|
| Naïve Bayes | 40.7 | 43.1 | 41.3 | 0.163 | 63 | 43.14 |
| ANN | 43.2 | 49 | 45.6 | 0.168 | 60.3 | 49.01 |
| SVM | 52.5 | 62.5 | 53.6 | 0.295 | 60.8 | 62.5 |
| Random Forest | 47.3 | 52.9 | 48.8 | 0.222 | 69.4 | 52.94 |
Table 10.
Comparison among classification algorithms using 10-fold cross-validation testing to predict the total recovery cases.
Table 10.
Comparison among classification algorithms using 10-fold cross-validation testing to predict the total recovery cases.
| Algorithm Name | Precision | Recall | F-Measure | MCC | ROC | Accuracy |
|---|
| Naïve Bayes | 40.7 | 43.1 | 41.3 | 0.163 | 63 | 43.13 |
| ANN | 43.2 | 49 | 45.6 | 0.168 | 60.3 | 49.02 |
| SVM | 52.5 | 62.5 | 53.6 | 0.295 | 60.8 | 62.5 |
| Random Forest | 47.3 | 52.9 | 48.8 | 0.22 | 69.4 | 52.94 |
Table 11.
The ranked features of the feature extraction algorithms to predict the total infected cases.
Table 11.
The ranked features of the feature extraction algorithms to predict the total infected cases.
| Feature Extraction Algorithm | No. of Extracted Features | Extracted features |
|---|
| CFS | 3 | |
| CAE | 7 | Total tests, International tourist arrivals (million) per year, Median age (years), Life expectancy at birth, Population ages 65 and older (millions), Employment in services (% of total employment) and Population, total (millions)
|
| IG | 3 | |
| Relief | 7 | Total tests, International tourist arrivals (million) per year, Median age (years), Life expectancy at birth, Employment in services (% of total employment), Population ages 65 and older (millions) and Population, total (millions)
|
| Wrapper | 8 | Total tests, International tourist arrivals (million) per year, Life expectancy at birth, Median age (years), Population ages 65 and older (millions), Population density (P/Km2), Employment in services (% of total employment) and Population, total (millions)
|
Table 12.
The ranked features of the feature extraction algorithms to predict the total deaths.
Table 12.
The ranked features of the feature extraction algorithms to predict the total deaths.
| Feature Extraction Algorithm | No. of Extracted Features | Extracted Features |
|---|
| CFS | 5 | Population ages 65 and older (millions), International tourist arrivals (million) per year, Tests/1M pop, Employment in services (% of total employment) and Population, total (millions)
|
| CAE | 6 | International tourist arrivals (million) per year, Median age (years), Population ages 65 and older (millions), Population, total (millions), Life expectancy at birth and Sex ratio at birth (male to female births)
|
| IG | 3 | Population ages 65 and older (millions), International tourist arrivals (million) per year and Population, total (millions)
|
| Relief | 6 | International tourist arrivals (million) per year, Median age (years), Life expectancy at birth, Employment in services (% of total employment), Population ages 65 and older (millions) and Population, total (millions)
|
| Wrapper | 6 | International tourist arrivals (million) per year, Population ages 65 and older (millions), Population density (P/Km2), Life expectancy at birth, Median age (years) and Employment in services (% of total employment)
|
Table 13.
The ranked features of the feature extraction algorithms to predict the total critical cases.
Table 13.
The ranked features of the feature extraction algorithms to predict the total critical cases.
| Feature Extraction Algorithm | No. of Extracted Features | Extracted Features |
|---|
| CFS | 2 | |
| CAE | 8 | International tourist arrivals (million) per year, Total Tests, Median age (years), Population, ages 65 and older (millions), Population, total (millions), Life expectancy at birth and Sex ratio at birth (male to female births)
|
| IG | 2 | |
| Relief | 7 | International tourist arrivals (million) per year, Median age (years), Total Tests, Life expectancy at birth, Population ages 65 and older (millions), Tests/1M pop and Population, total (millions)
|
| Wrapper | 2 | |
Table 14.
The ranked features of the feature extraction algorithms to predict the total recovery cases.
Table 14.
The ranked features of the feature extraction algorithms to predict the total recovery cases.
| Feature Extraction Algorithm | No. of Extracted Features | Extracted Features |
|---|
| CFS | 2 | |
| CAE | 7 | Total tests, International tourist arrivals (million) per year, Life expectancy at birth, Median age (years), Population ages 65 and older (millions), Population, total (millions) and Sex ratio at birth (male to female births)
|
| IG | 2 | |
| Relief | 7 | Total tests, Tests/1M pop, International tourist arrivals (million) per year, Life expectancy at birth, Median age (years), Population ages 65 and older (millions) and Population, total (millions)
|
| Wrapper | 2 | |
Table 15.
Comparison among feature extraction algorithms using SVM classifier to predict the total infected cases.
Table 15.
Comparison among feature extraction algorithms using SVM classifier to predict the total infected cases.
| Algorithm Name | Precision | Recall | F-Measure | MCC | ROC | Accuracy |
|---|
| SVM + CFS | 49.1 | 56.9 | 50.8 | 0.357 | 75.5 | 56.86 |
| SVM + CAE | 59.4 | 62.7 | 60.8 | 0.456 | 78.9 | 62.74 |
| SVM + IG | 49.1 | 56.9 | 50.8 | 0.357 | 75.5 | 56.86 |
| SVM + Relif | 59.4 | 62.7 | 60.8 | 0.456 | 78.9 | 62.74 |
| SVM + Wrapper | 71.5 | 7.9 | 72 | 0.644 | 86.2 | 74.1 |
Table 16.
Comparison among feature extraction algorithms using SVM classifier to predict the total deaths.
Table 16.
Comparison among feature extraction algorithms using SVM classifier to predict the total deaths.
| Algorithm Name | Precision | Recall | F-Measure | MCC | ROC | Accuracy |
|---|
| SVM + CFS | 69.7 | 78.9 | 72.9 | 0.513 | 66.7 | 78.94 |
| SVM + CAE | 49.4 | 68.4 | 57.4 | 0.22 | 55 | 68.42 |
| SVM + IG | 46.8 | 68.4 | 55.6 | 0 | 0.5 | 68.42 |
| SVM + Relif | 69.7 | 78.9 | 72.9 | 0.513 | 66.7 | 78.94 |
| SVM + Wrapper | 69.7 | 78.9 | 72.9 | 0.513 | 66.7 | 78.94 |
Table 17.
Comparison among feature extraction algorithms using SVM classifier to predict the total critical cases.
Table 17.
Comparison among feature extraction algorithms using SVM classifier to predict the total critical cases.
| Algorithm Name | Precision | Recall | F-Measure | MCC | ROC | Accuracy |
|---|
| SVM + CFS | 45.3 | 64.6 | 52.2 | 0.314 | 59.1 | 64.58 |
| SVM + CAE | 41.3 | 54.9 | 41.9 | 0.186 | 55.2 | 54.9 |
| SVM + IG | 45.3 | 64.6 | 52.2 | 0.314 | 59.1 | 64.58 |
| SVM + Relif | 41.3 | 54.9 | 41.9 | 0.186 | 55.2 | 54.9 |
| SVM + Wrapper | 45.3 | 64.6 | 52.2 | 0.314 | 59.1 | 64.58 |
Table 18.
Comparison among feature extraction algorithms using SVM classifier to predict the total recovery cases.
Table 18.
Comparison among feature extraction algorithms using SVM classifier to predict the total recovery cases.
| Algorithm Name | Precision | Recall | F-Measure | MCC | ROC | Accuracy |
|---|
| SVM + CFS | 45.3 | 64.6 | 52.2 | 0.314 | 63.3 | 64.58 |
| SVM + CAE | 41.4 | 54.9 | 43.6 | 0.171 | 57.2 | 54.9 |
| SVM + IG | 45.3 | 64.6 | 52.2 | 0.314 | 63.3 | 64.58 |
| SVM + Relif | 41.4 | 54.9 | 43.6 | 0.171 | 57.2 | 54.9 |
| SVM + Wrapper | 45.3 | 64.6 | 52.2 | 0.314 | 60.3 | 64.58 |
| Publisher’s Note: MDPI stays neutral with regard to jurisdictional claims in published maps and institutional affiliations. |
© 2022 by the authors. Licensee MDPI, Basel, Switzerland. This article is an open access article distributed under the terms and conditions of the Creative Commons Attribution (CC BY) license (https://creativecommons.org/licenses/by/4.0/).


