Abstract
Network monitoring is important to improve network performance and security. The separation of the data plane and the control plane of SDN gives the network flexibility. This flexibility facilitates network management and gives rise to the need for accurate and fine-grained management of networks. However, the traditional software-based flow monitoring cannot easily keep up with today’s high-speed networks such as 100 GbE, even with the help of high-performance frameworks such as DPDK. To meet the need for fine-grained management of high-speed networks, an accurate hardware-based flow monitor design is presented in this paper. In our design, the FPGA-based pipelined cuckoo hashing is used to achieve efficient storage of flow entries. The flow information is accurately recorded without any sampling. The proposed design can achieve a higher performance than the non-sketch CPU-based methods and higher accuracy than sketch methods. Compared with other state-of-the-art flow monitors, the proposed design can achieve a performance of 100 Gbps while maintaining high accuracy.
1. Introduction
Network monitoring is basic for network operators to manage their network since it is essential for network performance and security improvement. Operators are able to use the per-flow statistics for anomaly detection, troubleshooting, and load balancing to achieve optimal performance in their network [1,2]. Network monitoring can be classified into the following two categories: active monitoring and passive monitoring. Active approaches inject traffic into a network and perform different measurements based on the traffic. In contrast to active approaches, passive approaches collect network data to monitor the network and therefore have the advantage of being non-intrusive.
Passive approaches can be performed at the flow level. Flow monitoring is more scalable than traditional packet-level traffic analysis since it focuses on aggregated packets rather than individual packets [3]. Packets are aggregated into flows based on a set of common properties, which could be extracted from the packet header. Flow statistics are very valuable for network management and analysis. For example, the size and number of flows can be used to identify “heavy-hitter” flows to avoid potential denial of service attacks, while they are also important to load balancing strategies in data centers.
In recent years, software-defined networking (SDN) [4] has flourished and is becoming a quite promising next-generation network. The separation of the control plane from the data plane of SDN allows it to give flexibility and programmability to the network. Through southbound interface protocols, such as OpenFlow or P4, the control plane enables the flexible configuration of networks. The centralized control plane and programmable data plane greatly facilitate the management of networks and give rise to the need for accurate and fine-grained management of networks. For example, OpenFlow counters [5] are used for OpenFlow switches to measure flows. The widely used Open vSwitch [6] also requires traffic measurement in its data plane [7].
To meet the flexibility and programmability of the SDN networks, CPUs are used to implement the SDN data plane. In this case, the CPU also needs to perform the monitoring and management of flows. However, high-speed networks are evolving rapidly, and 100 Gbps networks are being used more and more widely. The conflict between high throughput and the real-time packet processing requirement makes software-based flow monitoring unable to keep up with the line rate. In order to improve the performance of flow monitoring, several techniques are used to solve this problem. For example, multi-core CPUs and NIC hardware technologies such as Receive-Side Scaling (RSS) are utilized to improve the performance of packet processing. Packets are distributed to different cores through RSS, and the performance of flow monitoring is improved by using multiple CPU cores to process packets. Because of the performance limitations of the Linux kernel stack, high-performance packet I/O frameworks such as DPDK [8] and Netmap [9] are also utilized to enable high-speed packet processing. By taking advantage of kernel bypassing, huge page memory, and batch processing, the throughput is greatly improved. Sketch methods are also used to improve the performance of flow monitoring. The sketch methods use the estimation method to obtain flow statistics. Although sketch-based methods claim to have a guaranteed error bound when estimating flow statistics, it is impossible to have no error. Therefore, the flow statistics are inaccurate, and this method cannot provide network operators with precise information for fine-grained network management. Although multi-core CPUs, high-performance packet I/O frameworks, and sketch methods can improve the throughput of flow monitoring, it is still a challenge for software to achieve accurate flow monitoring at 100 Gbps.
Field Programmable Gate Arrays (FPGAs) are increasingly being used in high-speed packet processing, and FPGA-based SmartNICs are used to accelerate the SDN data plane due to the advantages of programmability, high throughput, and low latency. When the data plane is offloaded to the FPGA, it is natural to implement flow monitoring on FPGAs. In this paper, we design a passive flow monitoring system that can provide accurate flow information for 100 Gbps networks. FPGA-based flow monitoring is capable of providing accurate flow information and maintaining high throughput, thus meeting the need for fine-grained management of high-speed SDN networks. The main contributions in this paper are as follows:
- An FPGA-based high-performance flow monitoring system is implemented that can accurately record flow information. The design is capable of reaching 100 Gbps without any sampling, which guarantees accuracy;
- Cuckoo hashing is implemented on the FPGA for high-performance and efficient management of flow entries. A victim memory based on distributed RAM is implemented to store flow entries kicked out by cuckoo hashing, thus solving the problem of uncertain insertion cycles;
- We implement the proposed flow monitoring on an FPGA board, and the evaluation results show that the design is able to achieve a high speed of 100 Gbps.
2. Background
The hash table is an efficient data structure for storing key-value pairs, allowing users to look up the corresponding value based on the key. A hash table consists of a series of buckets . The hash function is used to compute the key to obtain the hash value , which is used to map the key-value pair into a bucket of the hash table. The key is then stored in this bucket together with the corresponding additional value . When performing search operations, the key is first hashed, and then the corresponding value is read. When performing delete operations, the key and value in the corresponding bucket are deleted. Ideally, the perfect hash function maps every key to a specific bucket in the hash table. However, perfect hashing requires that the set of keys be statically constant. Therefore, different keys may produce the same hash value, resulting in different key-value pairs being mapped to the same bucket, which gives rise to hash collisions.
Cuckoo hashing is utilized to solve the problem of hash collision. The cuckoo hashing has hash tables and different hash functions , and there is a one-to-one correspondence between hash functions and hash tables. hash functions are first performed on the key to obtain hash values . Then corresponding buckets are read and the key is compared with stored keys. When performing a search operation, if key is the same as one of the stored keys, the corresponding value is read. For the delete operation, both the key and the value will be deleted. When performing an insert operation, it first checks whether there are empty buckets in , and if there are empty buckets, then an empty bucket is selected for storing this key-value pair. If there is no empty bucket, then a bucket is randomly selected, the key-value pair is kicked out, and a new key-value pair is stored in this bucket. The kicked-out key-value pair will be inserted again.
An example is given to illustrate the insertion of cuckoo hashing. As shown in Figure 1, there are two hash functions corresponding to hash tables . The green buckets represent key-value pairs already stored in them. First, the hash functions map the key to two buckets, which are occupied by and . Then, the bucket stored is selected to store and is kicked out. is then re-hashed and another empty bucket is selected to store this key-value pair.
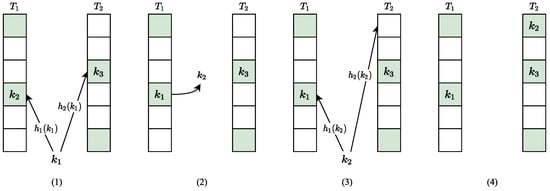
Figure 1.
The insertion of cuckoo hashing.
3. Architecture
The FPGA-based SDN data plane usually follows the match-action architecture. In this architecture, the flow monitoring can be decoupled from the pipeline as a separate module (as shown in Figure 2a), or it can be inserted into the match-action pipeline as an element (as shown in Figure 2b).
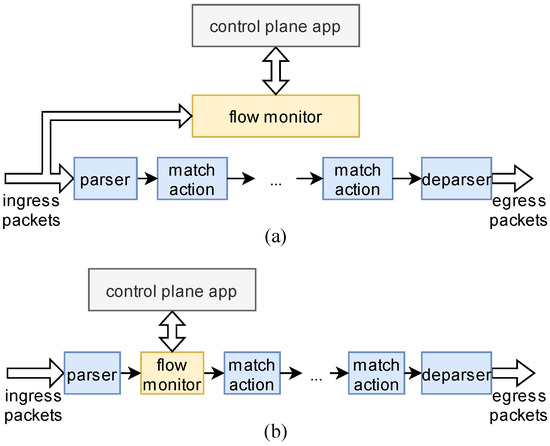
Figure 2.
The location of flow monitoring. (a) decoupled from the pipeline; (b) inserted into the pipeline.
The overall architecture of flow monitoring is shown in Figure 3. The flow cache is the component used to store the flow entries. A flow entry is a data structure intended to store flow information, and each flow entry corresponds to a flow. A flow entry consists of a flow key, a flow value, and a flag bit. The flow key is used to identify a flow, the flow value records the information of the flow, and the flag bit represents the validity of the flow entry. The process of generating a flow entry can be decomposed into three parts, namely, the flow aggregation to parse packets and aggregate packets into flows, the flow entry management to manage flow entries, and the flow entry updater to update flow entries according to the packet statistics (e.g., the packet length).
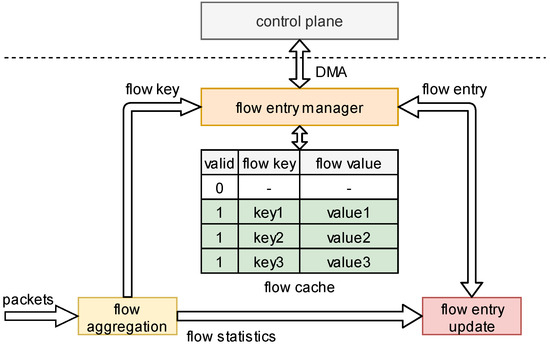
Figure 3.
The overall architecture of flow monitoring.
The flow aggregation module is responsible for parsing and classifying packets. Based on specific fields of the packet header, packets are distributed to different flows. These packet header fields are combined into the flow key and output to the flow entry management. The flow aggregation also generates flow statistics such as packet length, timestamp, etc. Flow statistics also contain TCP flags and VLAN ID. Additionally, these flow statistics are exported to the flow entry updater module for updating the flow values.
The flow entry management module is responsible for managing flow entries stored in the flow cache. When a packet belonging to a new flow arrives, the module inserts a new flow entry into the flow cache. When a packet belonging to the recorded flow arrives, the module updates the flow entry in the flow cache. When a flow entry is inactive, the module deletes the flow entry. Meanwhile, the module communicates with the control plane through DMA, which reads flow entries and processes them.
The flow entry updater module is responsible for updating the flow entry on the basis of the flow statistics. The flow entry is received from the flow entry management and flow statistics are received from the flow aggregation module. After the flow entry is processed, it is resent to the flow entry management module, which performs insert or update operations to the flow cache.
The process of generating a flow entry is as follows. When a packet is an input to the flow monitor, the flow aggregation module first parses the packet header, extracts the desired fields, and forms them into the flow key, which is an output to the flow entry management. At the same time, the flow aggregation module sends the flow statistics to the flow entry updater. The flow entry management hashes the flow key and finds whether there is a flow entry with the same flow key in the flow cache. If so, it sends the flow entry to the flow entry updater; otherwise, an initial flow entry is output. The flow entry updater updates the flow entry based on the flow statistics. After the update process is complete, the updated flow entry is resent to the flow entry management, which performs an insert or update operation to fill the flow entry into the flow cache.
In the following subsections, the hardware design of each component is described in detail.
3.1. The Flow Aggregation
Usually, each flow is a collection of packets with common characteristics. These characteristics can be found in the packet header. The flow aggregation aims to aggregate packets into flows using the flow key, which is generated by the packet parser. A flow is typically indicated by the following five key header fields: Source IP address, Destination IP address, Source port, Destination port, and protocol (that is, the 5-tuple). Packets transmitted in networks often contain multiple layers of headers with varying protocol formats and lengths.
In our design, the 5-tuple is used as the flow key. In order to extract the flow key, a parser is implemented in the proposed architecture. The packet parser first extracts the header from the packet and then the extracted packet header is parsed to obtain the flow key. The process of the packet parser is shown in Figure 4. Since the packet header is composed of multiple layers. The parsing process is divided into several stages, which are fully pipelined to achieve high throughput. Each stage consists of the following two parts: header identification and field extraction. Header identification identifies the length of the header processed in this stage and the subsequent header type. For example, in stage 1, header identification processes the Ethernet header. The next protocol field in the Ethernet header can be used to determine whether the next header is a VLAN header. Field extraction extracts and stores specified fields. Each stage processes a layer of headers. Field extraction extracts the required fields from the corresponding locations of the processed header. For example, in stage 3, the IP header is processed and IP addresses are extracted from the IP header. In stage 1, the Ethernet header is parsed to identify the next header type. In the second stage, the VLAN tag or QINQ tag is parsed if the packet header contains these tags, otherwise, nothing is done to the packet header. The next header type is also identified. The IP header is parsed in the third stage, source IP address, destination IP address, and layer 4 protocol are extracted. Meanwhile, some packet statistics such as packet length are recorded. In the last stage, the source port and destination port are extracted. The timestamp is also generated in this module when the packet arrives. When the operations in all stages are completed, the 5-tuple and packet statistics along with the timestamp are output to the next part.
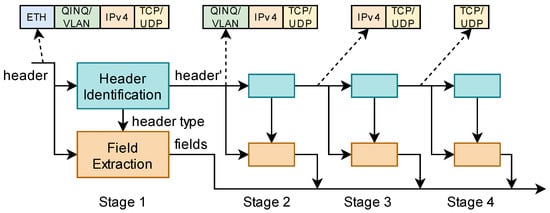
Figure 4.
The process of the packet parser.
3.2. The Flow Cache
The flow cache is a structure used to store flow entries. It is important which approach is adopted to achieve efficient storage and lookup of flow entries. Content-Addressable Memory (CAM) looks up data stored in it and returns the address of the matching data in only 1 cycle. The flow key can be stored in CAM and the address returned is used to index the corresponding flow value stored in RAM. Although it takes only 1 cycle for CAM to search for a value, there are no dedicated CAM resources in the FPGA. The CAM is usually implemented by using Block RAMs (BRAMs) or Lookup Tables (LUTs), which is low utilization of related resources. FPGA vendors now offer onboard DDR storage. The DDR has a large storage space and seems to be a good fit for storing flow entries. For DDR, a dozen clock cycles may be required between a read request and a read response. However, for a high-speed network of 100 Gbps, the flow cache may need to be read or written in every cycle. Therefore, the DDR cannot meet the requirements of high-speed networks.
BRAMs are used to implement flow caches in our architecture because they can be read or written in every cycle. The architecture of the flow cache is shown in Figure 5. The channel is a set of buses that include read/write enable signals, read/write addresses, and read/write data. The flow cache consists of four flow tables, each of which is implemented by true dual-port RAM to ensure that it can be read and written simultaneously. Two interface modules are used to route the read and write signals to the corresponding flow table. For example, when the flow management reads the flow entry in flow Table 1 through channel A, interface A assigns the read enable signal and the read address signal to flow Table 1. After flow Table 1 receives these signals, the desired flow entry is output through channel A.
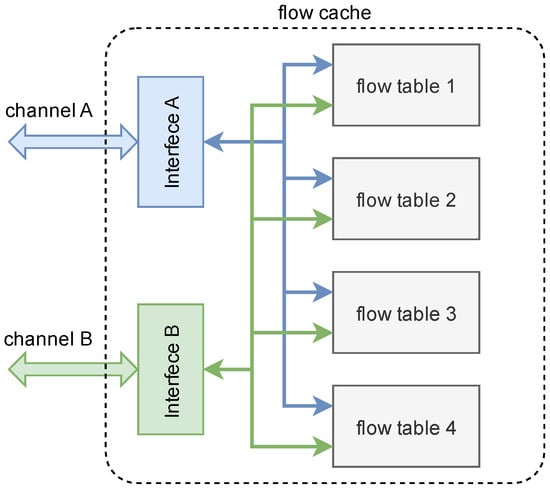
Figure 5.
The architecture of the flow cache.
3.3. The Flow Entry Management
The flow entry management is responsible for managing flow entries stored in the flow cache as well as communicating with the control plane through DMA. The flow entry management performs insert (including update), search, and delete operations on flow entries stored in the flow cache. The architecture of the flow management is shown in Figure 6. The hash core module implements the cuckoo hashing on the FPGA. After hashing the flow key, it uses a part of the hash value as an address to initiate read or write requests to the flow cache. The search operation uses a separate channel, and the insert and the delete operations share the same channel to access the flow cache. Because for the delete operation, it needs to write the flag bit of the corresponding flow entry to 0, which is a special insert operation. The victim memory is used to store kicked flow entries, and its role will be introduced in the following subsection.
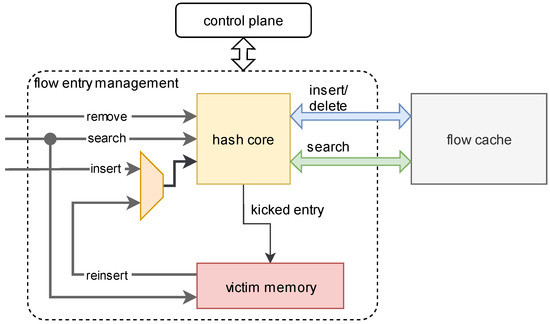
Figure 6.
The architecture of the flow entry management.
3.3.1. The Hash Core: Cuckoo Hashing in FPGA Implementation
Cuckoo hashing is very efficient for flow entry storage due to its high resource utilization efficiency and constant search cycles. However, the insertion time can be several cycles and is uncertain, which poses some difficulties, such as data inconsistency in the hardware implementation. We adapt cuckoo hashing to read and write data to the required address in the flow cache. The hash core hashes the flow key to obtain the hash value and then inserts, updates, searches, and deletes the flow entry based on the hash value.
After flow aggregation, the flow key is output to the flow entry management. The process of the hash core is shown in Figure 7. For simplicity, we describe the following three main signals used in this module: the flow key, the flow value, and the opcode. The opcode indicates the insert (including update), search, and delete operations of the flow entry. For the simplicity of the diagram, we use the same legend to identify the flow keys of the insert operation and the flow key of the search operation. In fact, because the insert and search operations correspond to different channels of the flow cache, the two operations can be executed in parallel.
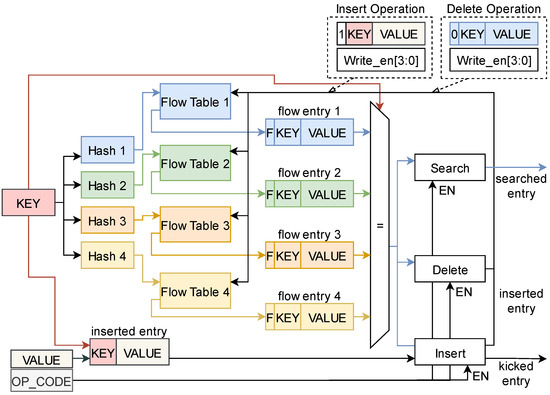
Figure 7.
The process of cuckoo hashing.
The entire process is described as follows. Regardless of the operation, it is required to hash the flow key and then read the flow entry based on the computed hash value. Four different hash functions are implemented in the hash core module, and each function maps the flow key to a bucket in the corresponding flow table. The bucket is the storage location of the flow entry in the flow table, and each bucket stores a flow entry. The flow key is first computed by four hash functions in parallel to obtain four hash values. Then the four hash values are input to the corresponding flow table to obtain the corresponding flow entry. A flow entry consists of a flow key, a flow value, and a flag bit to identify whether the bucket is empty. The input key is then compared with the four flow keys contained in the four flow entries. For a search operation, if the input flow key matches one of the four flow keys, then the corresponding flow entry is output. Otherwise, if there is no available flow entry that corresponds to the flow key in the flow cache, and an initial flow entry is initiated and output. For the delete operation, the flag bit of the corresponding flow entry is set to 0 to indicate this entry is unavailable. Additionally, the write enable signal of the corresponding flow table is set to 1 to write this flow entry to the corresponding address. Both search and delete operations are performed in the pipeline, which can improve the throughput.
For insert operation, the implementation of pipeline structure can be complex due to the reinsert operation. If the flow key is the same as one of the four stored flow keys and the flag bit is 1, it means that this flow has already been recorded and the flow entry is updated with the new one. If some flag bits are 0, it means some buckets in the flow table are empty, and a bucket is selected to store the flow entry. If all four buckets are not empty, then a bucket is randomly selected to store the newly inserted flow entry by kicking out the flow entry previously stored in this bucket. The kicked-out flow entry looks for an alternative empty bucket and takes up the bucket. If there is no empty bucket, another flow entry will be kicked out. This kick-out-reinsertion cycle may be executed several times, which causes the insertion cycle to be uncertain. If we stall the pipeline during all these kick-out-reinsertion cycles, the throughput decreases, and the performance is severely impacted. Even worse, when searching for a flow entry that has been kicked out but has not yet been reinserted into the flow cache, data inconsistency occurs. Because no flow entry will be found, an initial flow entry will be output and the previous flow information is lost.
3.3.2. Solution of Uncertain Insertion Cycle and Data Inconsistency
A victim memory structure based on distributed RAM is implemented to solve these problems. When a flow entry is kicked out from the flow cache, it is inserted into the first free location of the victim memory. The victim memory holds the kicked-out flow entries until they are reinserted into the flow cache. The flow entries stored in the victim memory are treated as “new flow entries” that will be inserted into the flow cache later when no insertion is performed. The flow entry is removed from the victim memory after it is reinserted into the flow cache. In this way, the variable insertion time can be seen as constant as the search and delete time. The overhead of using the victim memory is that some FPGA resources are occupied, which are very small. It is worth sacrificing small FPGA resources to achieve high performance.
Using victim memory structure, the data inconsistency problem can also be solved. When a search operation is performed, the flow entry is not only searched in the flow cache but also in the victim memory. Since the victim memory is based on distributed RAM, it is highly flexible and all its memory addresses can be traversed in one clock cycle. When a search operation is performed on the victim memory, the search key is compared with the flow key of the flow entries that are stored in the victim memory, and if they are the same, the corresponding flow entry stored in the victim memory is output. By using this method, not only the flow entries stored in the flow cache can be searched, but also the kicked-out flow entries can be searched. Therefore, data consistency can be guaranteed.
3.4. The Flow Entry Updater
The flow entry updater module updates flow entries, which are output from the flow entry management, according to the packet statistics, which are output from the flow aggregation. The module updates the flow value (e.g., timestamp) in the flow entry and outputs the updated flow entry to the flow entry management, and the flow entry management inserts this updated flow entry into the flow cache. The whole architecture of the flow entry updater is shown in Figure 8. There are several calculation units in the flow entry updater module. Each unit calculates one field of the flow entry. For example, the flow entry is updated with the first packet and the last packet’s timestamp, the total number of packets in this flow is incremented by one, etc. A temp memory is used to store the updated flow entries to prevent data inconsistency, which will be presented later.
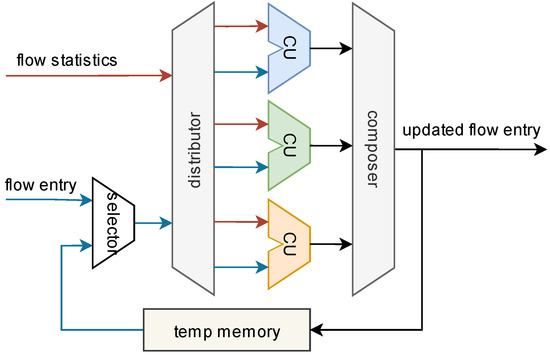
Figure 8.
The architecture of the flow entry updater.
When a packet is received, a memory location is read first by the flow entry management to obtain the corresponding flow entry, then this flow entry is updated and written back to the flow cache. The whole process can span several clock cycles; however, a memory location can be accessed once per cycle at a high speed, such as 100 Gbps. This introduces a potential data consistency problem. For example, when two packets (P1 and P2) belonging to the same flow are processed in several clock cycles, the read of the flow entry in the flow cache for the second packet (P2) may occur before the write back to the flow cache of the updated flow entry for the first packet (P1), as depicted in Figure 9. Assume that the packet P1 is processed from time 0. It takes R clock cycles to read the flow cache, U clock cycles to update the flow entry, and W clock cycles to write to the flow cache, so after the time R + U + W, the updated flow entry can be written into the flow cache. If packet P2, which belongs to the same flow as packet P1, is processed before the time R + U + W, the flow entry read by P2 is out of date. Therefore, the flow entry returned from the flow entry management is not the correct data to be used by the flow entry updater module when processing the second packet, and the flow value cannot be calculated correctly. Stalling the pipeline is a way to guarantee data consistency, but at the cost of reduced performance.
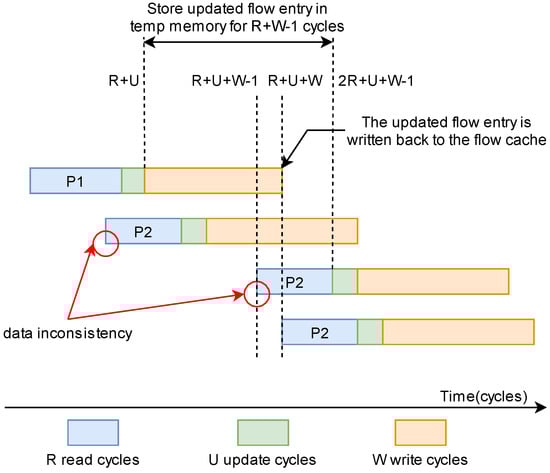
Figure 9.
Processing of two packets belonging to the same flow.
To solve this problem, a temp memory is designed in the flow entry updater, as shown in Figure 10. The temp memory is based on distributed RAM and serves to store the updated flow entries. The temp memory acts similarly to the shift register, where flow entries stored in temp memory are shifted out with the clock. When a flow entry is updated, the updated flow entry is not only written back to the flow cache but also stored in the temp memory. It takes one cycle to write to temp memory, and the two write operations are performed in parallel. The updated flow entries are shifted from the bottom of the temp memory to the top of it, and an updated flow entry will eventually be shifted out when it is stored in the flow cache. As shown in Figure 10, the pink flow entry is written to the temp memory and other flow entries in the temp memory are moved up. The top yellow flow entry is shifted out from the top of the temp memory.
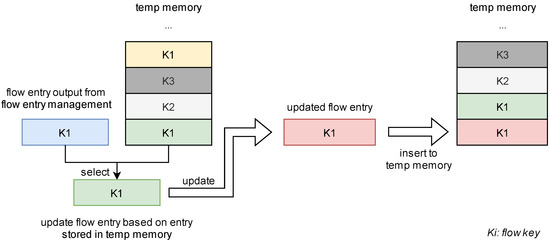
Figure 10.
The processing of the temp memory.
When a flow entry is an output from the flow entry management, the flow updater module first checks from the bottom to the top of the temp memory whether there is an updated flow entry with the same flow key. If there is, the flow entry output from flow entry management is out of date, and the flow updater module updates the flow based on the flow entry in the temp memory. The whole temp memory is checked because the temp memory is based on distributed RAM. We can perform these search operations in parallel within one clock cycle. As depicted in Figure 9, when the packet P2 is processed at the time R + U + W − 1 (corresponding to the update at the time 2R + U + W − 1), data inconsistency may still occur. Therefore, the updated flow entry of packet P1 should be stored in the temp memory for R + W − 1 cycles. That is, the depth of the temp memory is R + W − 1. The overhead of using temp memory is a small usage of FPGA resources, but we do not need to stall the pipeline to solve the data inconsistency problem, thus avoiding performance degradation.
The whole process of the flow entry updater is as follows. As shown in Figure 8, when a flow entry needs to be updated, the selector compares the flow entry output from the flow entry management with flow entries stored in the temp memory, selects the newest flow entry, and outputs it to the distributor. The distributor allocates the flow entry and the flow statistics to each computation unit. After being processed by the computing units, the new flow entry is combined by the composer. The new flow entry is then output back to the flow entry management and is also stored in the temp memory.
4. Implementation and Evaluation
We implement the proposed flow monitoring on the Intel N3000 FPGA platform (Intel, Santa Clara, CA, USA). This FPGA board is equipped with an Intel Arria 10 1150GT FPGA (Intel, Santa Clara, CA, USA), which has abundant resources to support the proposed design. There are also high-speed transceivers on this FPGA that support 100 Gbps network speed. Ethernet frames are converted from optical signals to electrical signals and then enter the high-speed transceiver. Four Intel 25 G Ethernet IPs are used to perform codecs for the physical layer and data link layer, and output packets in the form of Avalon Stream Bus. The width of the bus is 512 bit, and the design runs at a clock frequency of 200 Mhz, thus it can support 100 Gbps data processing. The design is developed in Verilog for best performance and is synthesized and implemented by Quartus 19.2 (Intel, Santa Clara, CA, USA). The FPGA board is connected to the server through the PCIe interface. The server is equipped with 2 Intel Xeon Gold 5215 CPUs (Intel, Santa Clara, CA, USA) and 128 GB of DDR4 memory. For comparison, a 100 Gbps Intel NIC (Intel, Santa Clara, CA, USA) is also installed on this server. The IXIA tester is used to evaluate the implemented design.
4.1. Resource Utilization
In our implementation, 4096 flow entries are stored in each of the 4 flow tables, thus we implement 16 K flow entries in the FPGA. A flow entry consists of a 104-bit flow key, a 1-bit flag, and a 192-bit flow value, which is composed of timestamps for the first packet and the last packet (64 bits for each), the number of the received packets for the flow (24 bits), and the flow size (40 bits). Table 1 shows the resource usage of the FPGA. Since the flow cache is implemented by Block RAMs, the BRAM is utilized at about 17.55%. The remaining resources are still sufficient to implement other network functions in the FPGA data plane.

Table 1.
The resource usage.
Table 1.
The resource usage.
| Used | Available | Percentage | |
|---|---|---|---|
| Logic utilization (ALM) | 7121 | 427200 | 1.66% |
| BRAM Bits | 9748480 | 55562240 | 17.55% |
4.2. Flow Information
In this part, we evaluate flow information measured by FPGA. First, we evaluate the number of flows that can be recorded. The load factor is a metric of a hash table. It is defined as a = k/m, where k denotes the number of entries stored that can be stored in the hash table and m denotes the total size of the hash table. The IXIA tester sends 15,000 flows that correspond to a load factor of 0.91 at different rates, and the packet length is 128–1024 bytes. Additionally, flow entries recorded by the FPGA are read by the server. Figure 11 shows the number of recorded flow entries measured by FPGA (yellow bars) and the number of sent flows generated by IXIA (blue bars) at different rates. The result shows that the design can monitor all flows at a different rate.
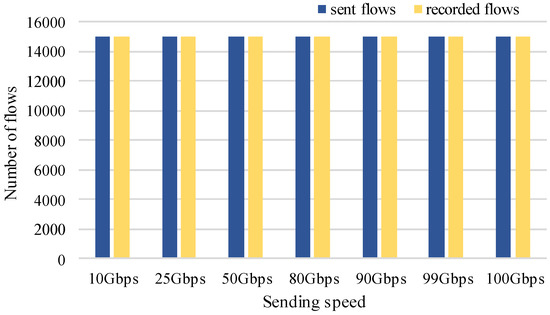
Figure 11.
The number of flows.
We also evaluated the number of received packets. The IXIA tester sends packets of 128–1024 bytes at 100 Gbps. The packets are first processed by the flow monitor and then forwarded back to the IXIA tester. We measured 9 sets of data in total and Figure 12 shows the result. The blue bars show the number of packets sent by IXIA, the gray bars show the number of packets received by IXIA, and the orange bars show the number of packets recorded by the flow monitor, which is obtained by summing the number of packets per flow. The result shows that the recorded packet number, the sent packet number, and the received packet number are the same. This shows that the number of packets is correctly recorded.
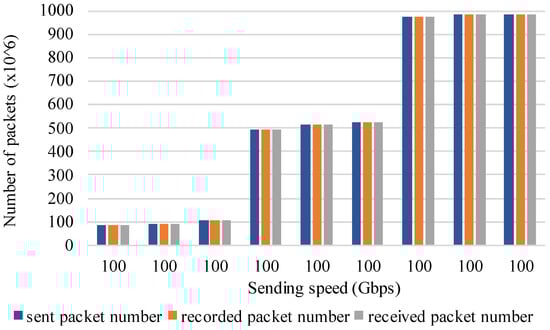
Figure 12.
The number of packets.
Next, the per-flow and total throughput are measured. Eight thousand flows are evenly sent by IXIA at different rates, and the packet length for each flow is 64B. Figure 13 shows the per-flow throughput and the total throughput. The blue bars show the per-flow throughput corresponding to the right vertical axis. The orange dash line and the green dotted line, respectively, represent the total throughput and the theoretical throughput corresponding to the left vertical axis. The theoretical throughput is calculated as follows. An Ethernet frame is composed of a 64-byte packet, an 8-byte preamble, and a 12-byte interframe gap, so the length of an Ethernet frame is 84 bytes. If the network rate is R Gbps, the corresponding theoretical packet throughput is (R × 1000)/((64 + 8 + 12) × 8) Mpps. As shown in Figure 13, the per-flow throughput is 1/8000 of the total throughput, and the total throughput can reach the theoretical throughput.
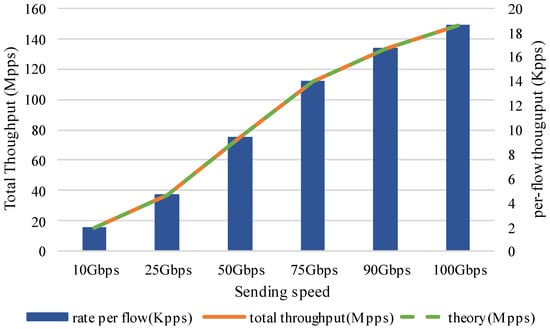
Figure 13.
The per-flow and total throughput.
4.3. Comparison
In this part, FloWatcher-DPDK [10] is implemented to compare with our design. FloWatcher-DPDK uses DPDK to accelerate flow monitoring. In this evaluation, the IXIA tester sends packets of different lengths and the total throughput is evaluated. Figure 14 shows the throughput of the FPGA and FloWatcher-DPDK. It shows that even with the help of the high-performance packet processing framework, it is difficult to achieve high throughput, such as 100 Gbps, while the flow monitoring based on FPGA can meet the high throughput requirement.
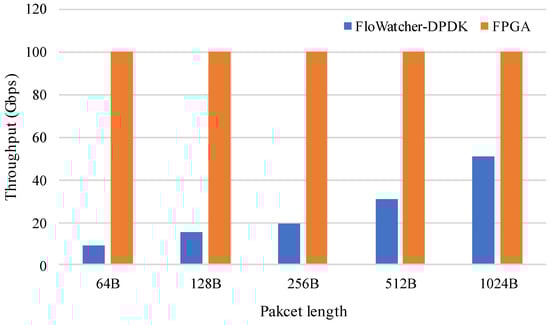
Figure 14.
The throughput of FloWatcher-DPDK and FPGA.
5. Related Work
Many software-based network monitors have been implemented in the past. Yang et al. [11] designed a network traffic monitoring system for SDN. In their design, the network traffic monitor system works with virtual switches and OpenFlow controllers to collect the traffic data. The throughput can only achieve 1 Gbps. UMON [7] is a fine-grained traffic monitoring system in OVS. The monitoring flow table is decoupled from the forwarding, so the forwarding rules are not affected. In their experiment, the throughput was about 2.2 Gbps. Instead of using powerful CPUs of commodity servers, Monas et al. [12] used ARM processors to implement portable network monitoring for energy and cost-saving. However, the performance is low due to the limitations of the ARM processor. FlexMon [13] is a traffic monitor for programmable networks that can achieve 10 Gbps and is designed to improve the accuracy of traffic measurement with limited data plane resources. They designed a hybrid scheme using counters and sketches and achieved a tradeoff between resource consumption and accuracy. MONA [14] is an adaptive monitoring framework that can provide accuracy above a user-defined threshold. MONA is capable of achieving the highest accuracy at approximately 10 Gbps. Although both FelxMon and MONA achieve a high performance of 10 Gbps, these solutions cannot guarantee accurate measurement results and are difficult to scale to higher-speed networks.
High-performance packet processing frameworks (such as DPDK) and multi-core architectures are also used to achieve high throughput. FloWatcher-DPDK [10] is a DPDK-based traffic monitor. A hash table is used to store the flow statistics, and the hash value calculated by the NIC is used to index the hash table. By tuning various parameters such as batch size, the number of RSS queues, the total number of mem-pools, etc., it can achieve 10 Gbps with a low loss rate. DPDKState [15] is a passive traffic analyzer that also leverages DPDK to achieve high throughput. The design is tested using packets with an average length of 716 bytes and reaches 40 Gbps when using 16 CPU cores. Such high performance comes at the cost of using excessive CPU resources; however, the resources allocated to the monitoring process are usually limited. Sketches are also used to overcome insufficient performance. Wu et al. [16] implemented different sketch-based methods on the commodity server. They designed different schemes (such as whether to use RSS) and evaluated the performance of these schemes. The throughput achieves about 100 Gbps when processing large packets with a 1024-B packet length. However, such high performance comes at the cost of accuracy that is caused by sketch methods.
Flow monitoring is also an important part of physical routers or switches. Netflow and sFlow are widely used for monitoring in routers. However, enabling Netflow or sFlow [17] can increase the burden on the router. To alleviate the impact on the performance of the high-speed network, these solutions heavily rely on sampling, which cannot accurately record flow information and therefore introduces inaccuracies. Some FPGA-based flow monitoring methods have been implemented [18,19], but they cannot achieve high throughput. Baruch et al. [20] utilize an FPGA platform to identify network flows. Content-addressable memory (CAM) is used to store flow information. McGlone et al. [21] propose to use high-level design flow to quickly implement an FPGA-based flow monitor. However, throughput is not evaluated in their work. A flow monitor based on the NetFPGA-10G platform [22] has been proposed and can achieve 10 Gbps performance. A hardware-assisted architecture is proposed by Chandrababu et al. [23] They used the design to perform flow monitoring in high-speed networks. The design can achieve a performance of 20.2 Gbps.
Table 2 compares our work with related works. Our work achieves higher throughput than other methods, except for X. Wu et al. However, their method sacrifices accuracy, while our method still guarantees accuracy at high throughput.
Table 2.
Comparison with related works.
6. Conclusions
In this paper, an accurate FPGA-based flow monitor that is capable of processing 100 Gbps networks is proposed. The design can accurately calculate flow information without any sampling. The high performance and accuracy of the proposed design meet the need for fine-grained management of future high-speed networks. In the proposed design, Block RAMs in FPGA are used to store flow entries. Cuckoo hashing is effectively used to index the flow entry and the pipeline structure is elaborated to achieve high performance. The hardware traffic generator is utilized to measure the performance of the design, which can achieve 100 Gbps.
Author Contributions
Conceptualization, M.S. and Z.G.; methodology and implementation, M.S.; validation M.S., K.W. and X.Z.; writing-original draft preparation: M.S.; writing-review and editing, Z.G., K.W. and X.Z.; supervision, Z.G. All authors have read and agreed to the published version of the manuscript.
Funding
This work was funded by the Strategic Leadership Project of Chinese Academy of Sciences: SEANET Technology Standardization Research System Development (Project No. XDC02070100). This work was also funded by the IACAS Frontier Exploration Project (Project No. QYTS202006).
Data Availability Statement
All the necessary data are included in the article.
Acknowledgments
The authors would like to thank the reviewers for their valuable feedback. The authors also would like to thank Xiaoying Huang, Mangu Song for their helpful comments.
Conflicts of Interest
The authors declare no conflict of interest.
References
- Moshref, M.; Yu, M.; Sharma, A.; Govindan, R. Scalable Rule Management for Data Centers. In Proceedings of the 10th USENIX Symposium on Networked Systems Design and Implementation (NSDI 13), Lombard, IL, USA, 2–5 April 2013; pp. 157–170. [Google Scholar]
- Al-Fares, M.; Radhakrishnan, S.; Raghavan, B.; Huang, N.; Vahdat, A. Hedera: Dynamic Flow Scheduling for Data Center Networks. In Proceedings of the 7th USENIX Symposium on Networked Systems Design and Implementation (NSDI 10), San Jose, CA, USA, 28–30 April 2010; Volume 10, pp. 89–92. [Google Scholar]
- Hofstede, R.; Čeleda, P.; Trammell, B.; Drago, I.; Sadre, R.; Sperotto, A.; Pras, A. Flow Monitoring Explained: From Packet Capture to Data Analysis with Netflow and Ipfix. IEEE Commun. Surv. Tutor. 2014, 16, 2037–2064. [Google Scholar] [CrossRef]
- Benzekki, K.; El Fergougui, A.; Alaoui, A.E.B.E. Software-defined Networking (SDN): A Survey. Secur. Commun. Netw. 2016, 9, 5803–5833. [Google Scholar] [CrossRef]
- Mogul, J.C.; Tourrilhes, J.; Yalagandula, P.; Sharma, P.; Curtis, A.R.; Banerjee, S. Devoflow: Cost-Effective Flow Management for High Performance Enterprise Networks. In Proceedings of the 9th ACM SIGCOMM Workshop on Hot Topics in Networks, Monterey, CA, USA, 20–21 October 2010; pp. 1–6. [Google Scholar]
- Pfaff, B.; Pettit, J.; Koponen, T.; Jackson, E.; Zhou, A.; Rajahalme, J.; Gross, J.; Wang, A.; Stringer, J.; Shelar, P. The Design and Implementation of Open VSwitch. In Proceedings of the 12th USENIX symposium on networked systems design and implementation (NSDI 15), Oakland, CA, USA, 4–6 May 2015; pp. 117–130. [Google Scholar]
- Wang, A.; Guo, Y.; Hao, F.; Lakshman, T.V.; Chen, S. Umon: Flexible and Fine Grained Traffic Monitoring in Open Vswitch. In Proceedings of the 11th ACM Conference on Emerging Networking Experiments and Technologies, Heidelberg, Germany, 1–4 December 2015; pp. 1–7. [Google Scholar]
- Zeng, L.; Ye, X.; Wang, L. Survey of Research on DPDK Technology Application. J. Netw. New Media 2020, 9, 2. [Google Scholar]
- Rizzo, L. Netmap: A Novel Framework for Fast Packet I/O. In Proceedings of the 21st USENIX Security Symposium (USENIX Security 12), Boston, MA, USA, 13–15 June 2012; pp. 101–112. [Google Scholar]
- Zhang, T.; Linguaglossa, L.; Gallo, M.; Giaccone, P.; Rossi, D. FloWatcher-DPDK: Lightweight Line-Rate Flow-Level Monitoring in Software. IEEE Trans. Netw. Serv. Manag. 2019, 16, 1143–1156. [Google Scholar] [CrossRef]
- Yang, Y.-Y.; Yang, C.-T.; Chen, S.-T.; Cheng, W.-H.; Jiang, F.-C. Implementation of Network Traffic Monitor System with SDN. In Proceedings of the 2015 IEEE 39th Annual Computer Software and Applications Conference, Taichung, Taiwan, 1–5 July 2015; IEEE: Piscataway Township, NJ, USA, 2015; Volume 3, pp. 631–634. [Google Scholar]
- Monas, A.; Verma, A.; Gawari, A.; Paswan, R.S. Portable Network Monitor Using ARM Processor. Procedia Comput. Sci. 2016, 92, 493–497. [Google Scholar] [CrossRef][Green Version]
- Wang, Y.; Wang, X.; Xu, S.; He, C.; Zhang, Y.; Ren, J.; Yu, S. FlexMon: A Flexible and Fine-Grained Traffic Monitor for Programmable Networks. J. Netw. Comput. Appl. 2022, 201, 103344. [Google Scholar] [CrossRef]
- Tangari, G.; Charalambides, M.; Tuncer, D.; Pavlou, G. Accuracy-Aware Adaptive Traffic Monitoring for Software Dataplanes. IEEE/ACM Trans. Netw. 2020, 28, 986–1001. [Google Scholar] [CrossRef]
- Trevisan, M.; Finamore, A.; Mellia, M.; Munafò, M.; Rossi, D. Dpdkstat: 40gbps Statistical Traffic Analysis with off-the-Shelf Hardware. Tech. Rep. 2016, 318627. Available online: https://nonsns.github.io/paper/DPDKStat-techrep.pdf (accessed on 1 May 2022).
- Wu, X.; Li, P.; Ran, Y.; Luo, Y. Network Measurement for 100 GbE Network Links Using Multicore Processors. Future Gener. Comput. Syst. 2018, 79, 180–189. [Google Scholar] [CrossRef]
- SFlow. Available online: http://www.sflow.org/ (accessed on 1 May 2022).
- Zadnik, M.; Pecenka, T.; Korenek, J. Netflow Probe Intended for High-Speed Networks. In Proceedings of the International Conference on Field Programmable Logic and Applications, Tampere, Finland, 25–26 August 2005; IEEE: Piscataway Township, NJ, USA, 2005; pp. 695–698. [Google Scholar]
- Yusuf, S.; Luk, W.; Sloman, M.; Dulay, N.; Lupu, E.C.; Brown, G. Reconfigurable Architecture for Network Flow Analysis. IEEE Trans. Very Large Scale Integr. VLSI Syst. 2007, 16, 57–65. [Google Scholar] [CrossRef][Green Version]
- Baruch, Z.; Peculea, A.; Arsinte, R.; Suciu, M.; Majo, Z. Embedded System for Network Flow Identification. In Proceedings of the 2006 IEEE International Conference on Automation, Quality and Testing, Robotics, Cluj-Napoca, Romania, 25–28 May 2006; IEEE: Piscataway Township, NJ, USA, 2006; Volume 1, pp. 426–429. [Google Scholar]
- McGlone, J.; Woods, R.; Marshall, A.; Blott, M. Design of a Flexible High-Speed FPGA-Based Flow Monitor for next Generation Networks. In Proceedings of the 2010 International Conference on Embedded Computer Systems: Architectures, Modeling and Simulation, Samos, Greece, 19–22 July 2010; IEEE: Piscataway Township, NJ, USA, 2010; pp. 37–44. [Google Scholar]
- Forconesi, M.; Sutter, G.; Lopez-Buedo, S.; Aracil, J. Accurate and Flexible Flow-Based Monitoring for High-Speed Networks. In Proceedings of the 2013 23rd International Conference on Field programmable Logic and Applications, Porto, Portugal, 2–4 September 2013; IEEE: Piscataway Township, NJ, USA, 2013; pp. 1–4. [Google Scholar]
- Chandrababu, S.; Bahulekar, C.; Yadav, R.; Desai, D. Hardware-Assisted Flow Monitoring for High Speed Networks. In Proceedings of the 2019 10th International Conference on Computing, Communication and Networking Technologies (ICCCNT), Kanpur, India, 6–8 July 2019; IEEE: Piscataway Township, NJ, USA, 2019; pp. 1–5. [Google Scholar]
Publisher’s Note: MDPI stays neutral with regard to jurisdictional claims in published maps and institutional affiliations. |
© 2022 by the authors. Licensee MDPI, Basel, Switzerland. This article is an open access article distributed under the terms and conditions of the Creative Commons Attribution (CC BY) license (https://creativecommons.org/licenses/by/4.0/).